
Proteomics-Based Transporter Identification by the PICK Method: Involvement of TM7SF3 and LHFPL6 in Proton-Coupled Organic Cation Antiport at the Blood–Brain Barrier

 , , , and
Abstract
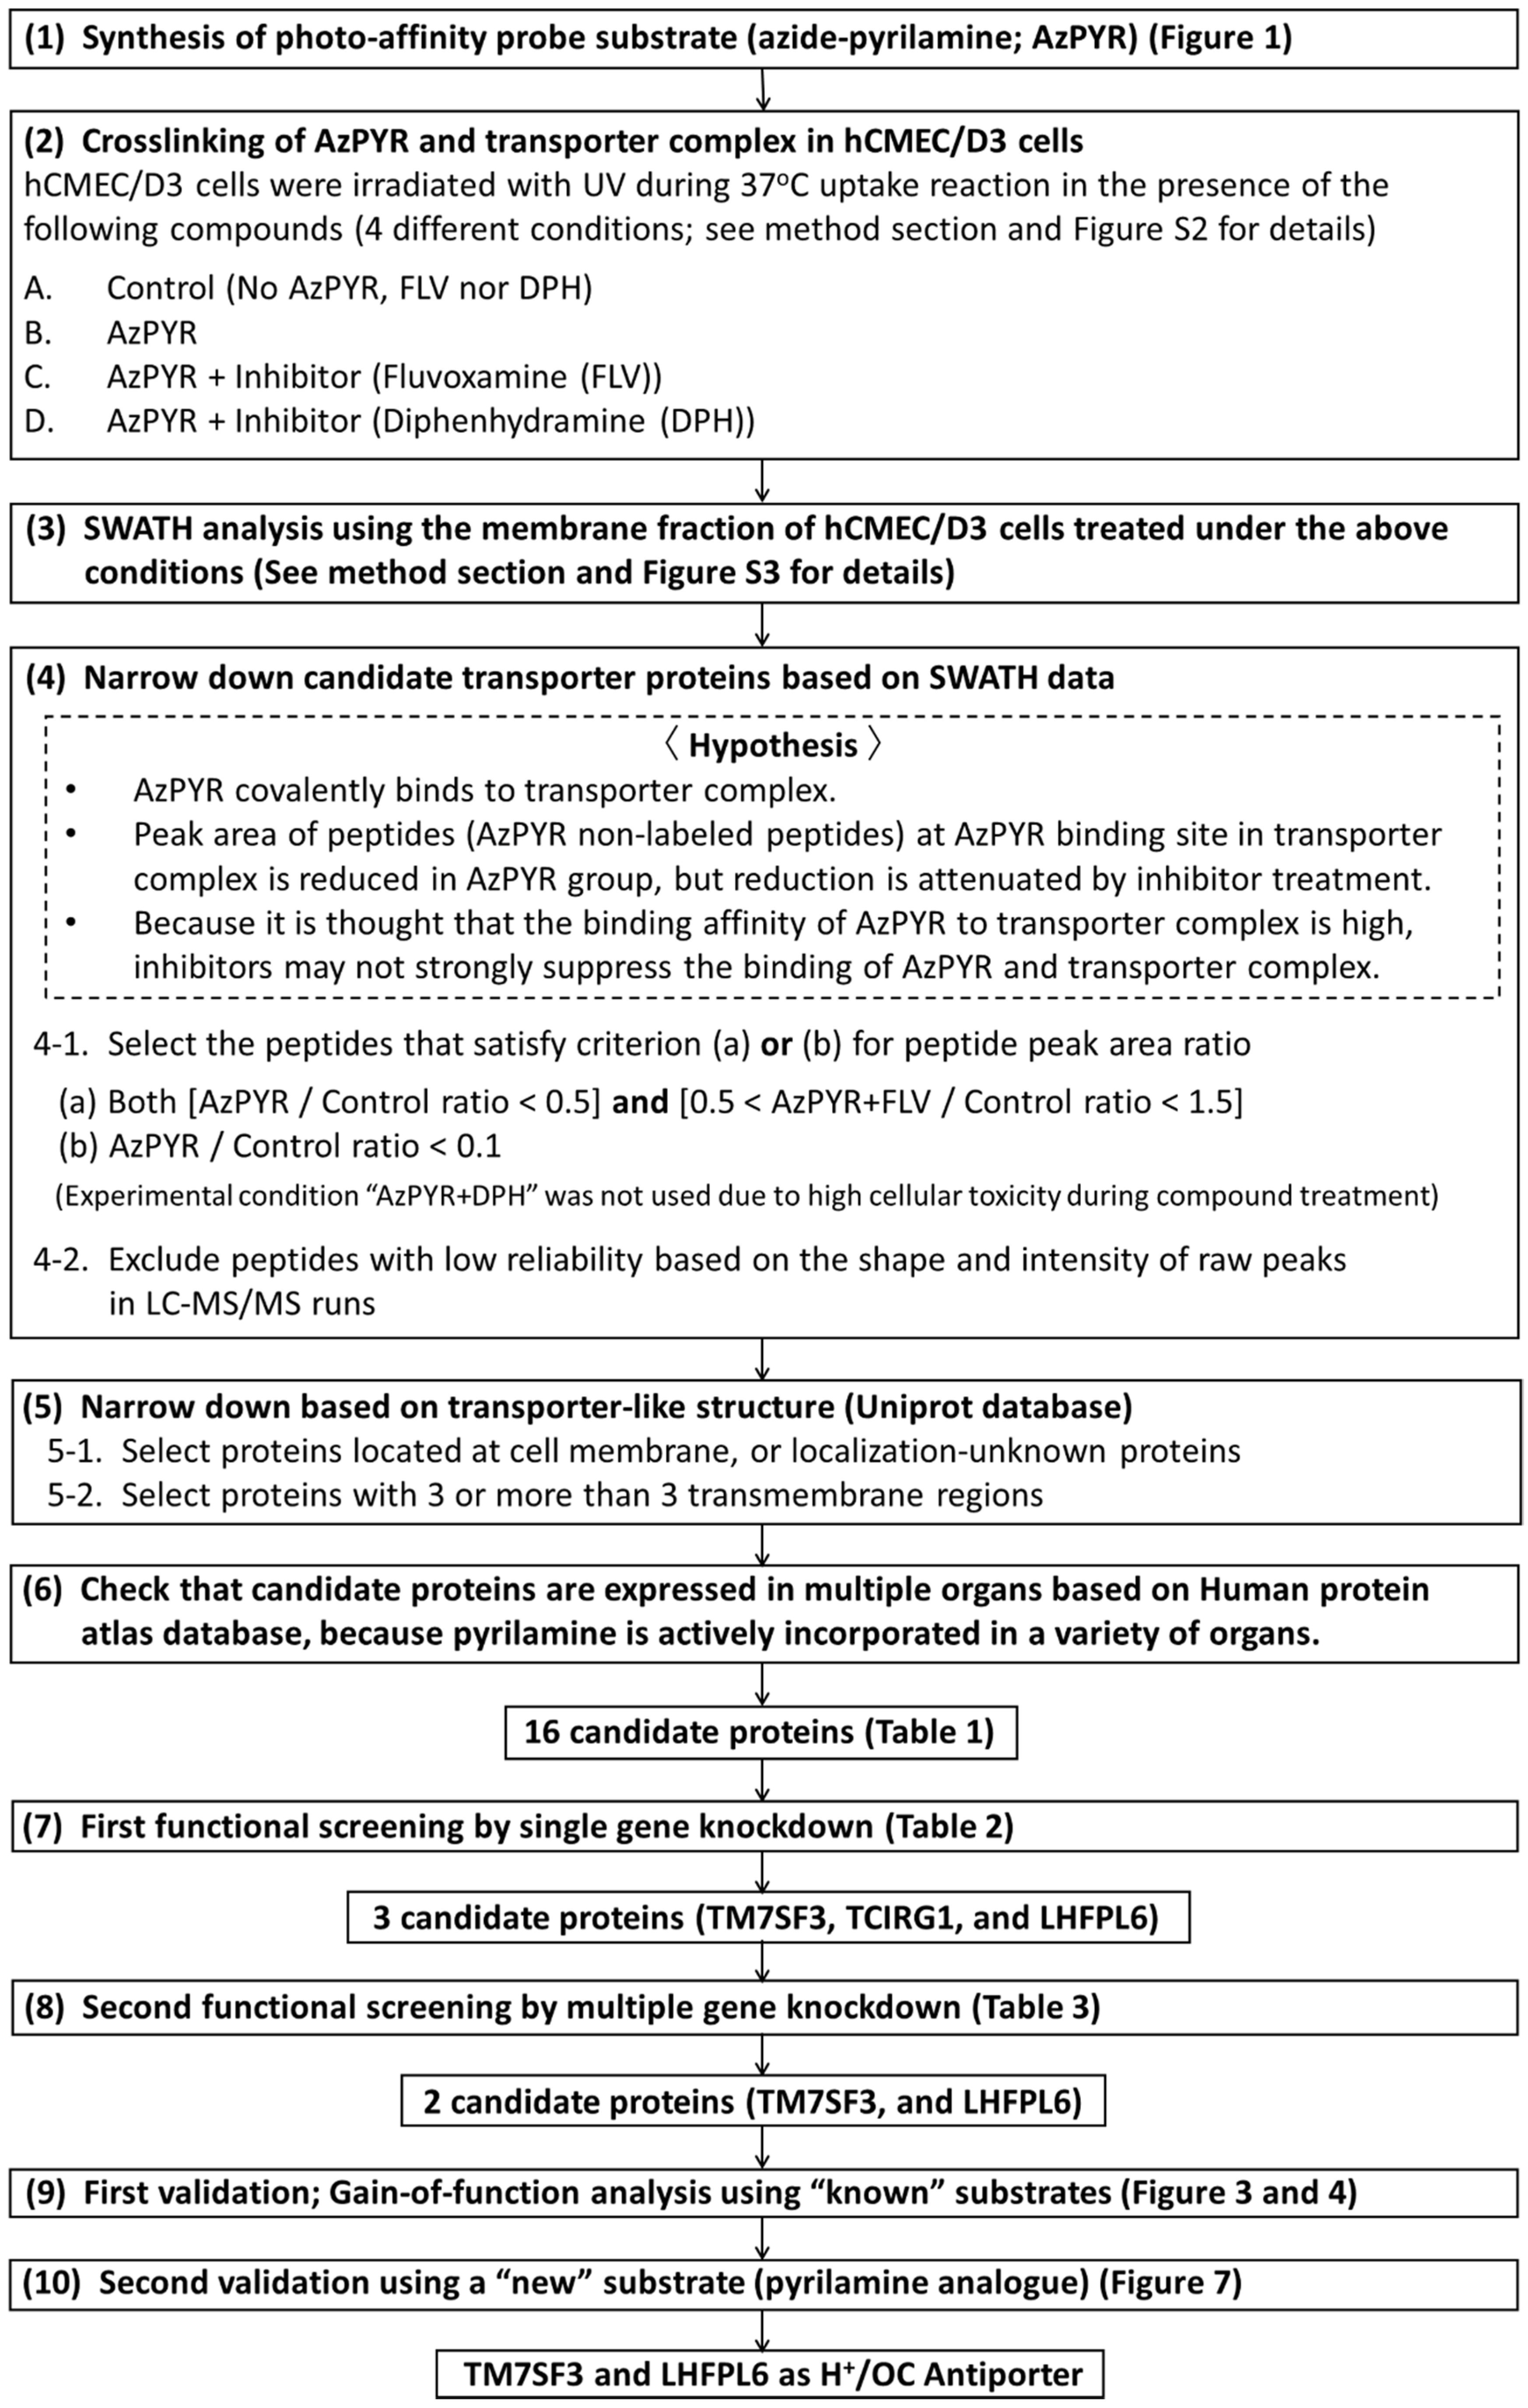
:1. Introduction
2. Materials and Methods
2.1. Reagents
2.2. Cell Culture
2.3. Uptake Study
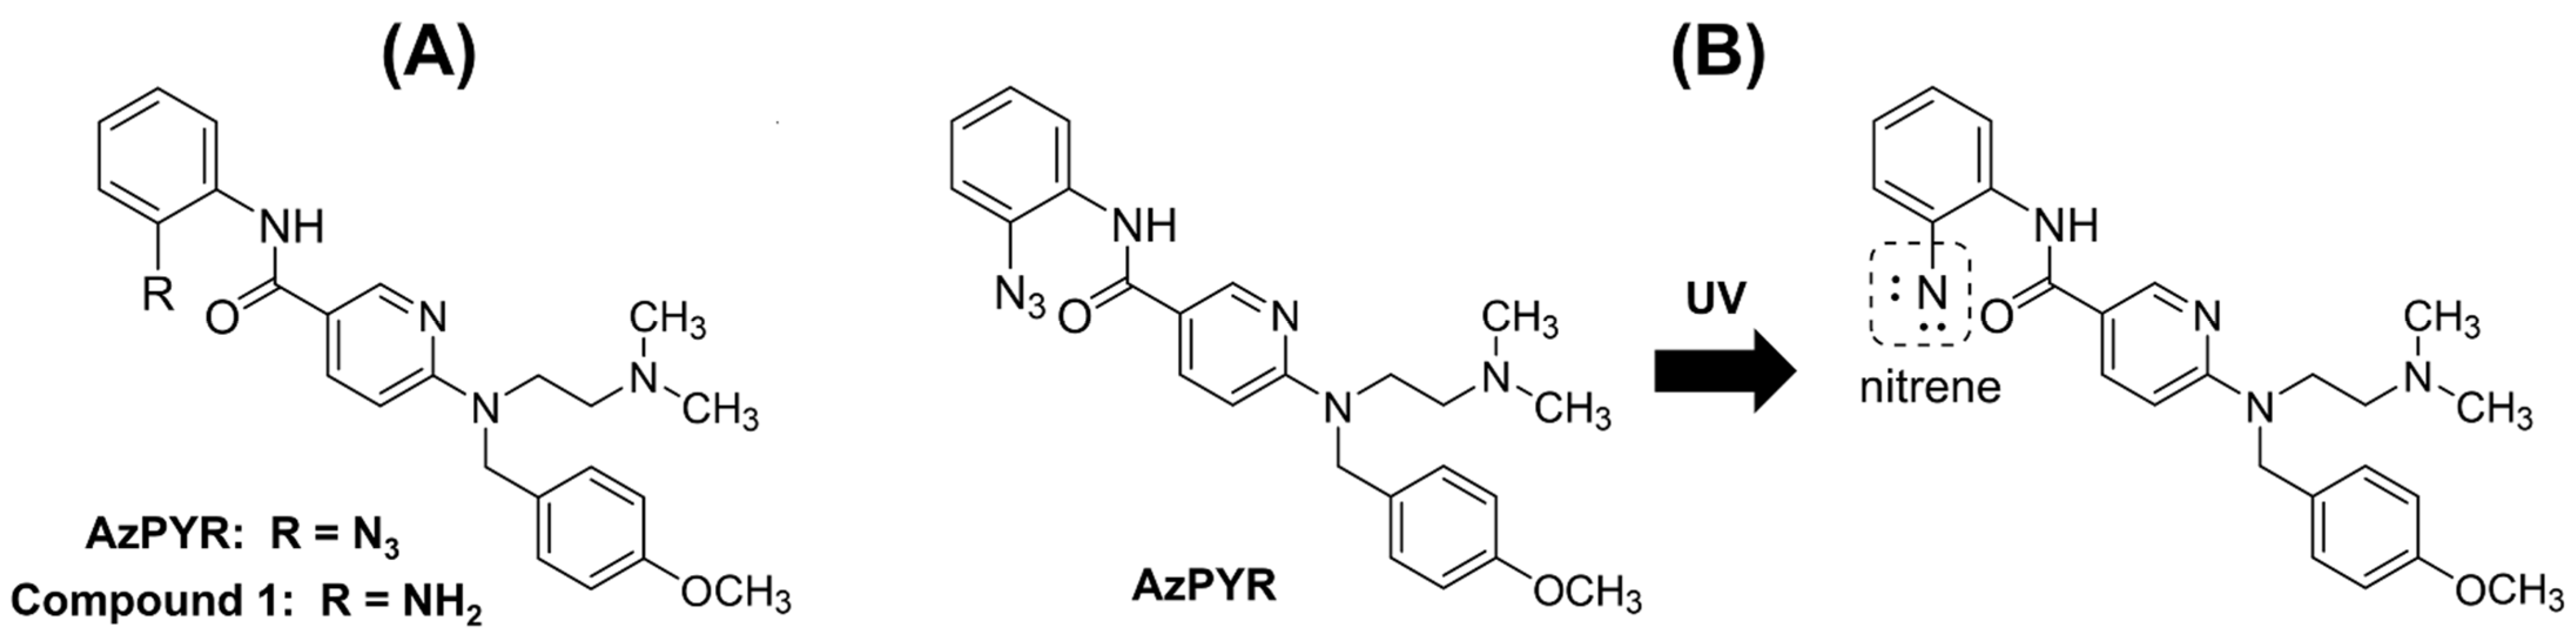
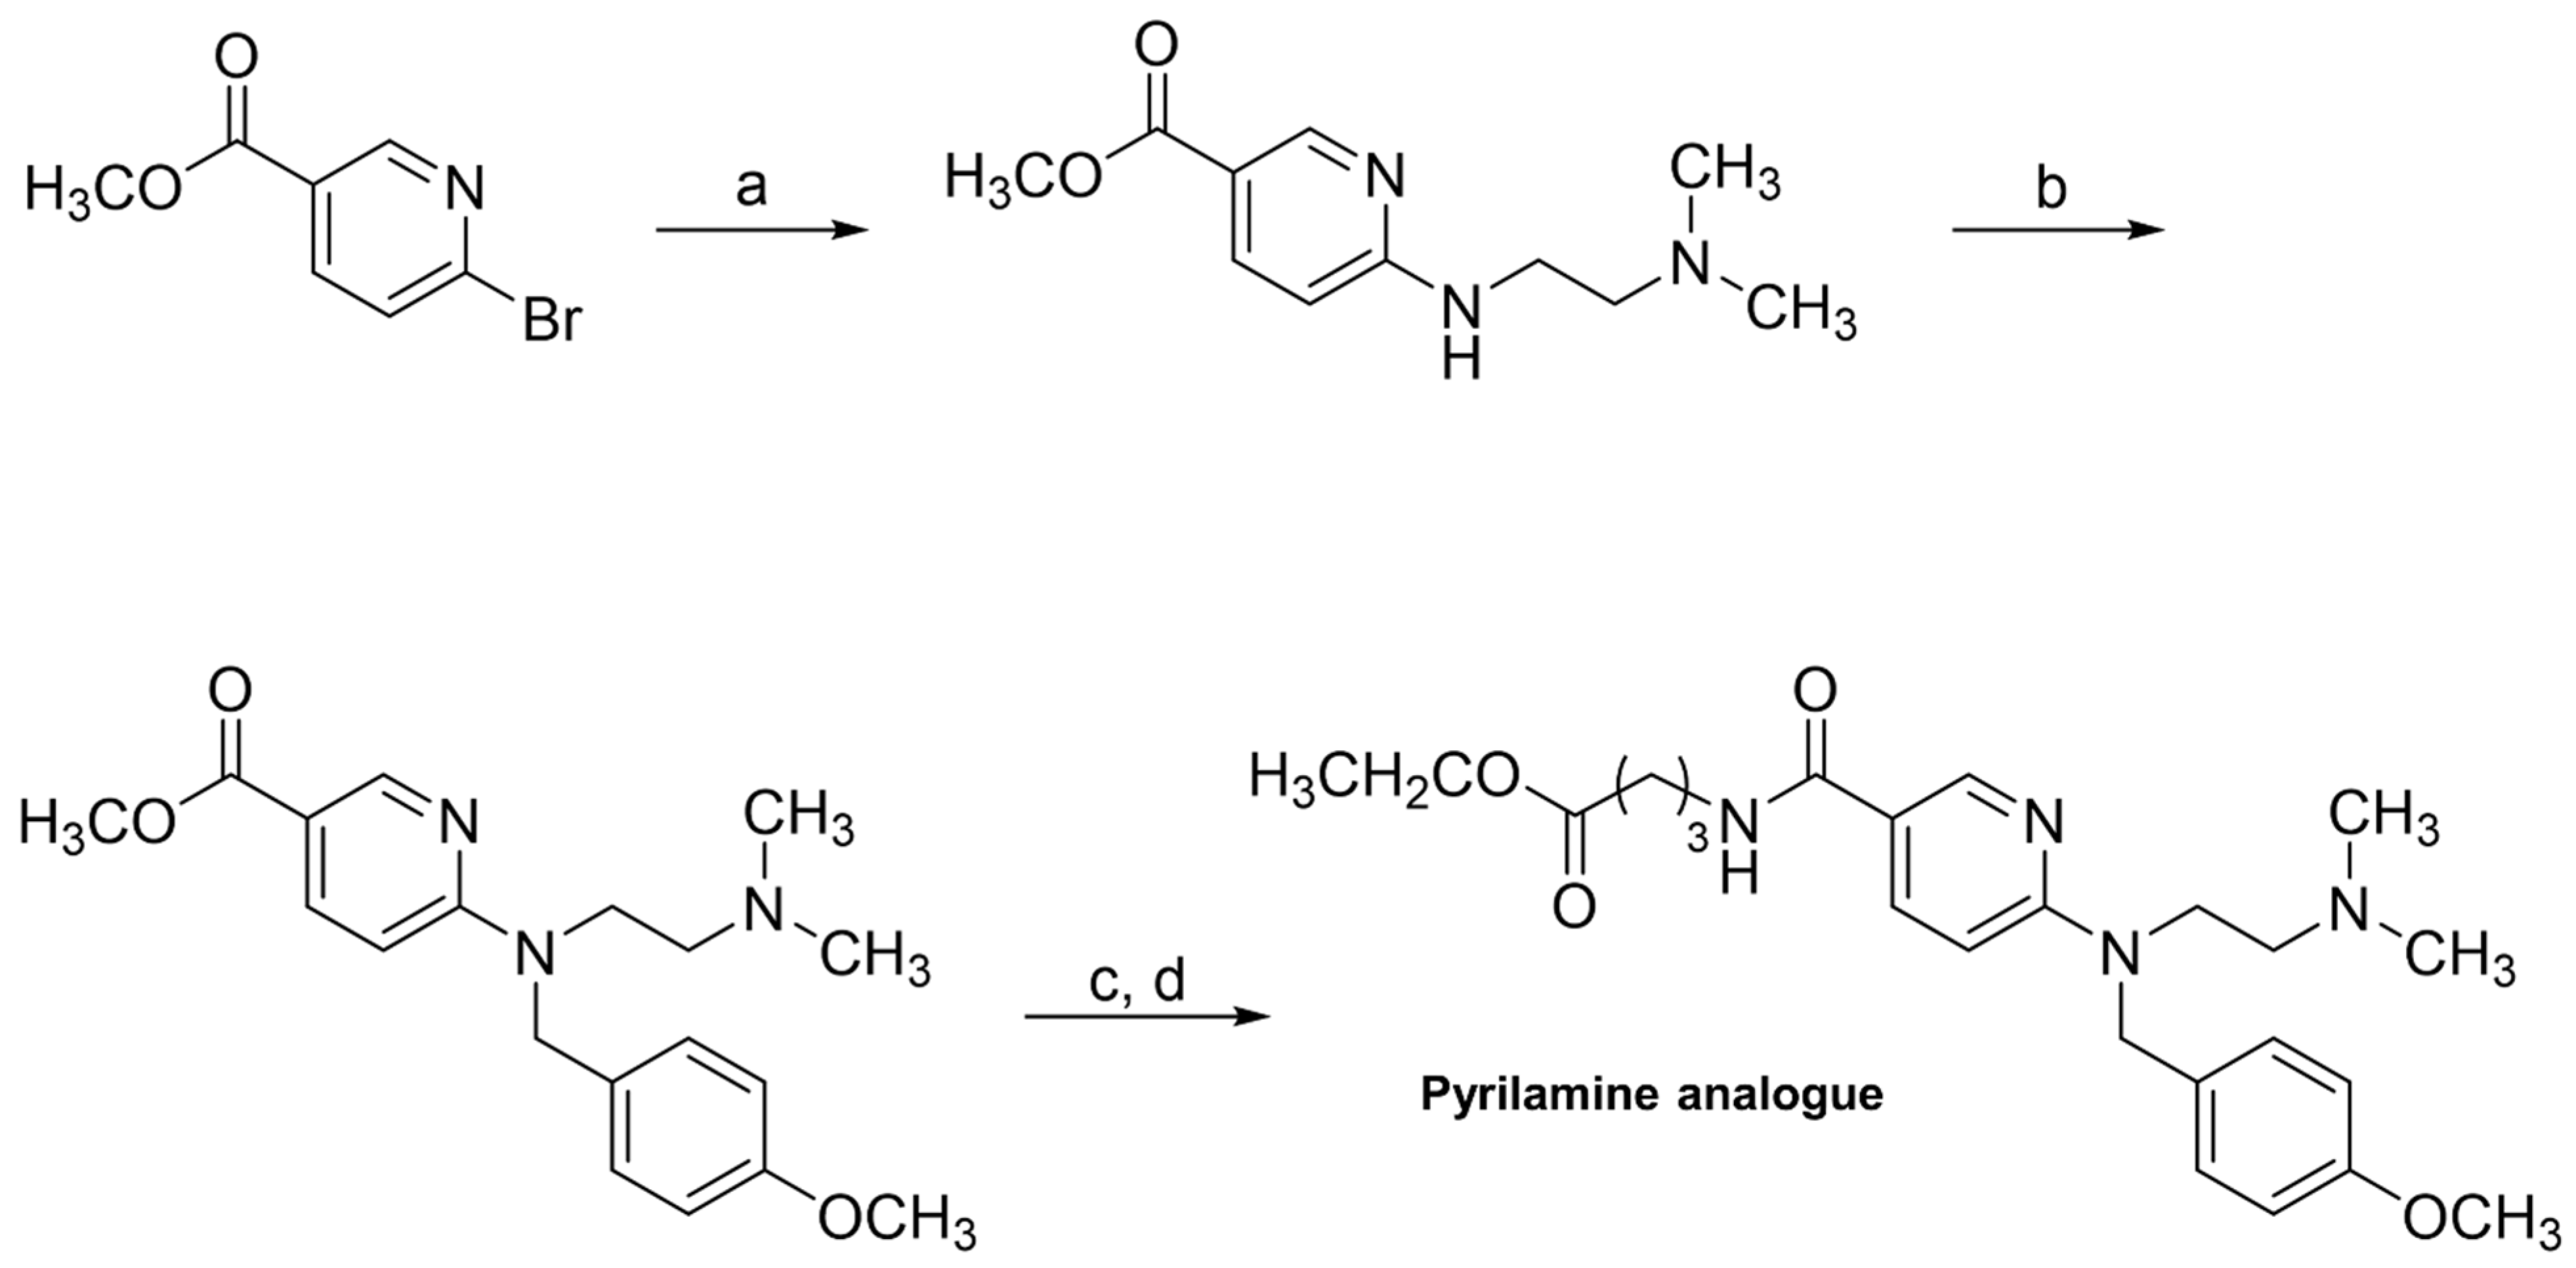
2.4. Design, Synthesis and Evaluation of Photo-Affinity Probe (Azide-Pyrilamine; AzPYR)
2.5. Crosslinking of AzPYR and Transporter Complex in hCMEC/D3 Cells
2.6. SWATH Analysis to “PICK” Candidate Transporter Proteins
2.7. Functional Screening by Single or Multiple Gene Knockdown
2.8. First Validation; Gain-of-Function Analysis Using “Known” Substrates
2.9. Second Validation Using a “New” Substrate (Pyrilamine Analogue)
2.10. Statistical Analysis
3. Results
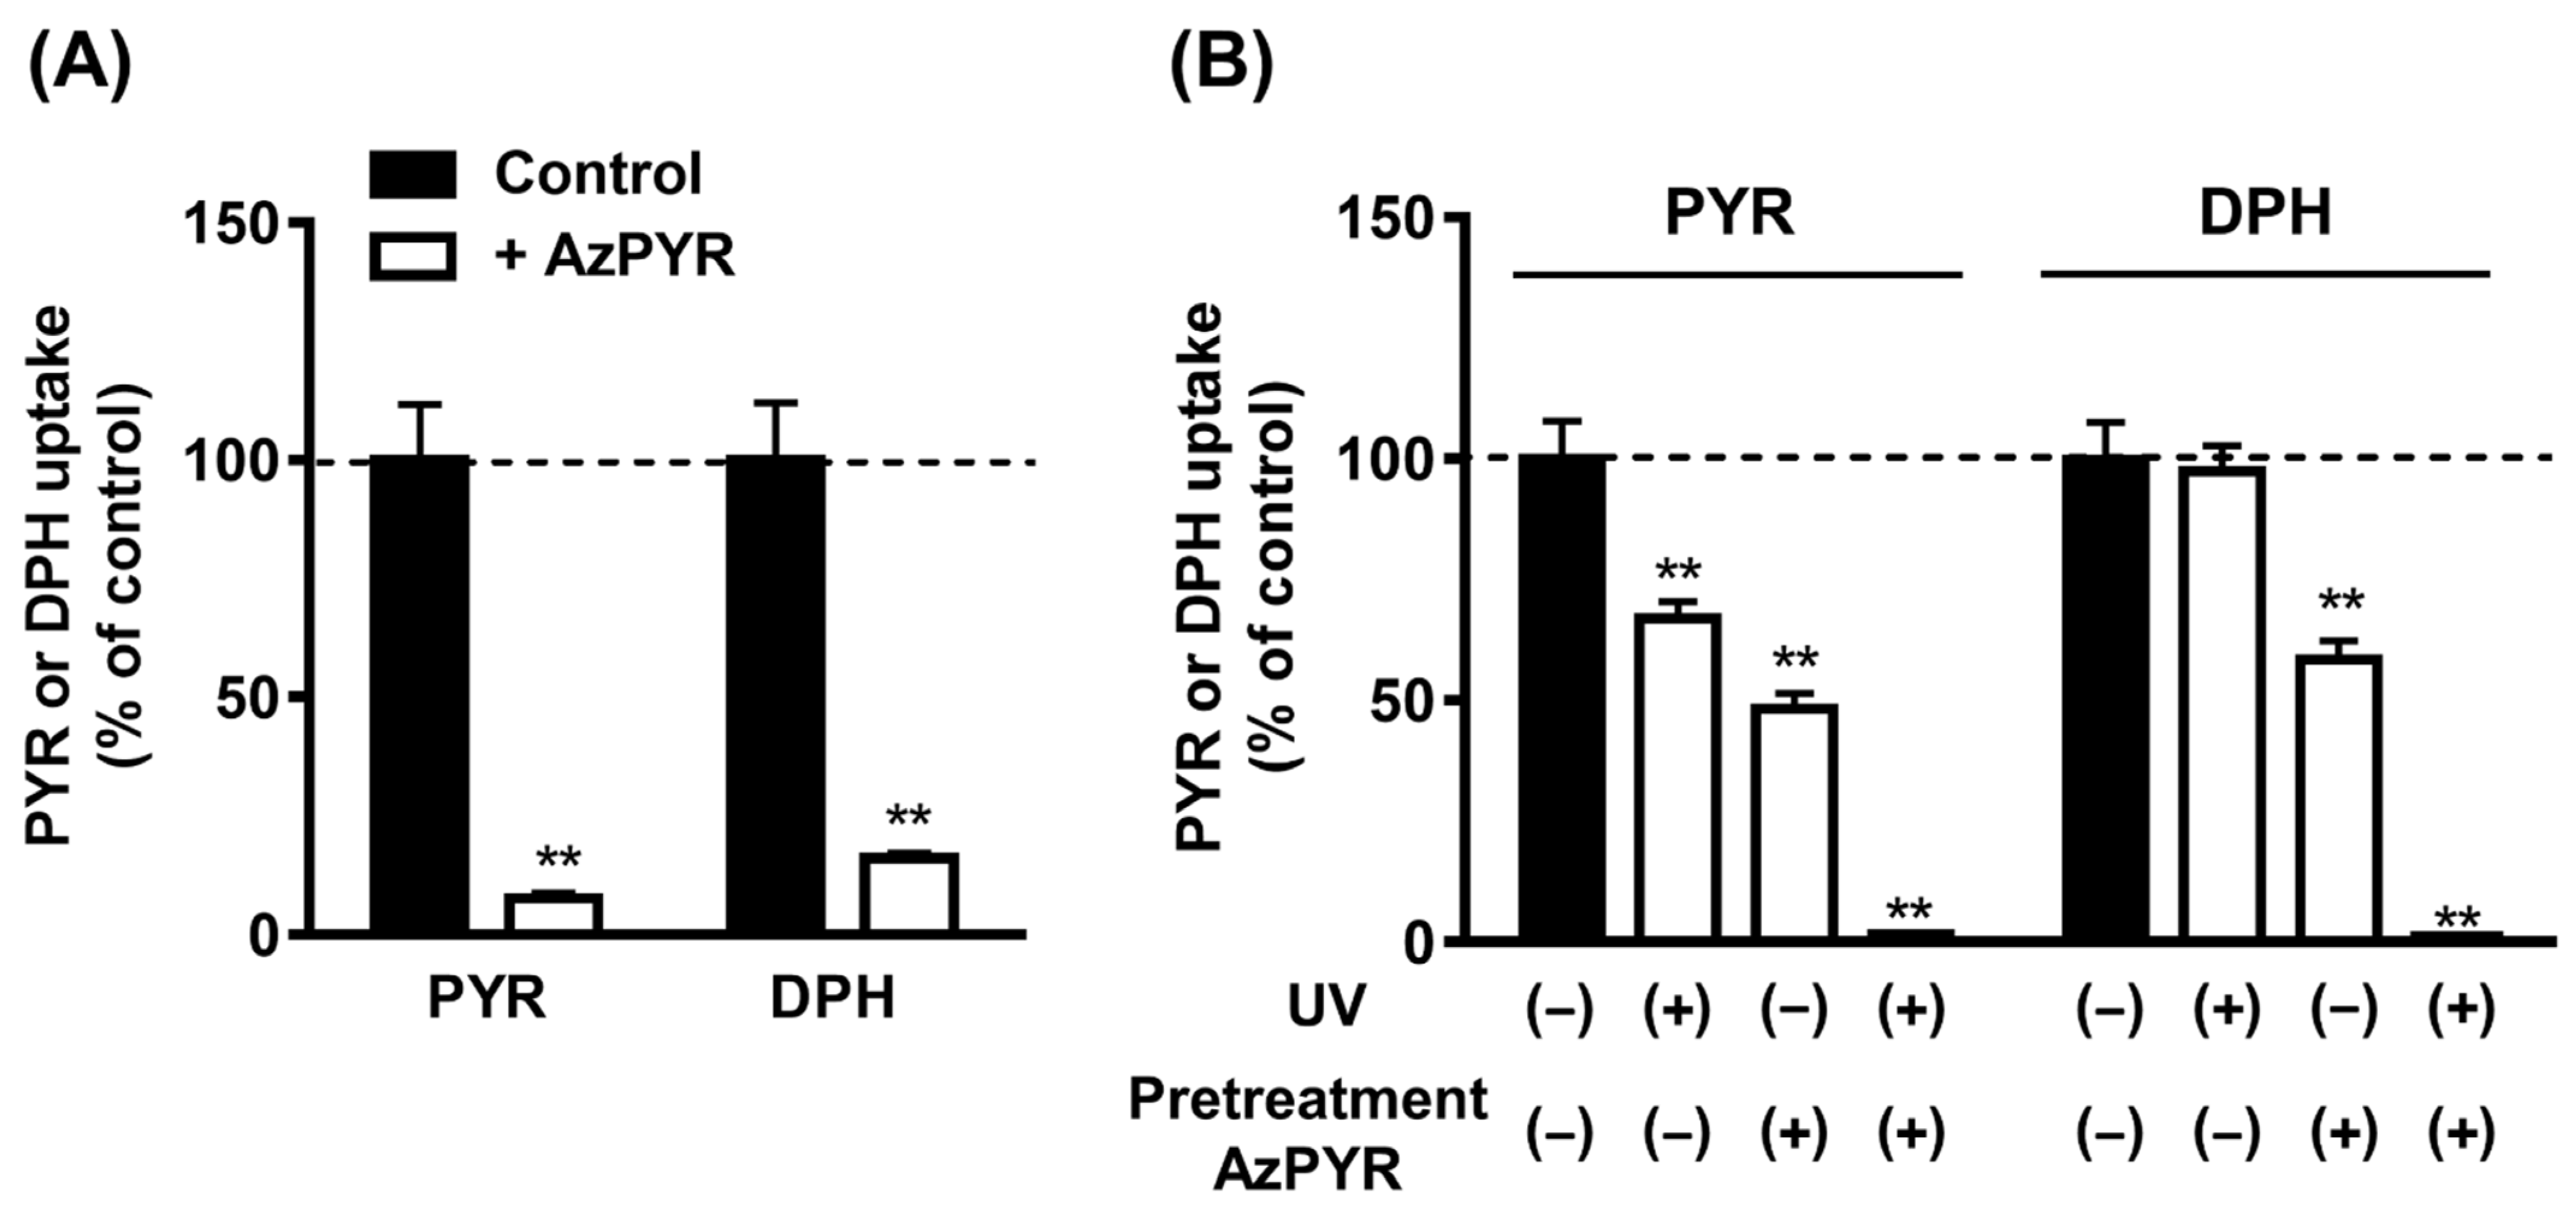
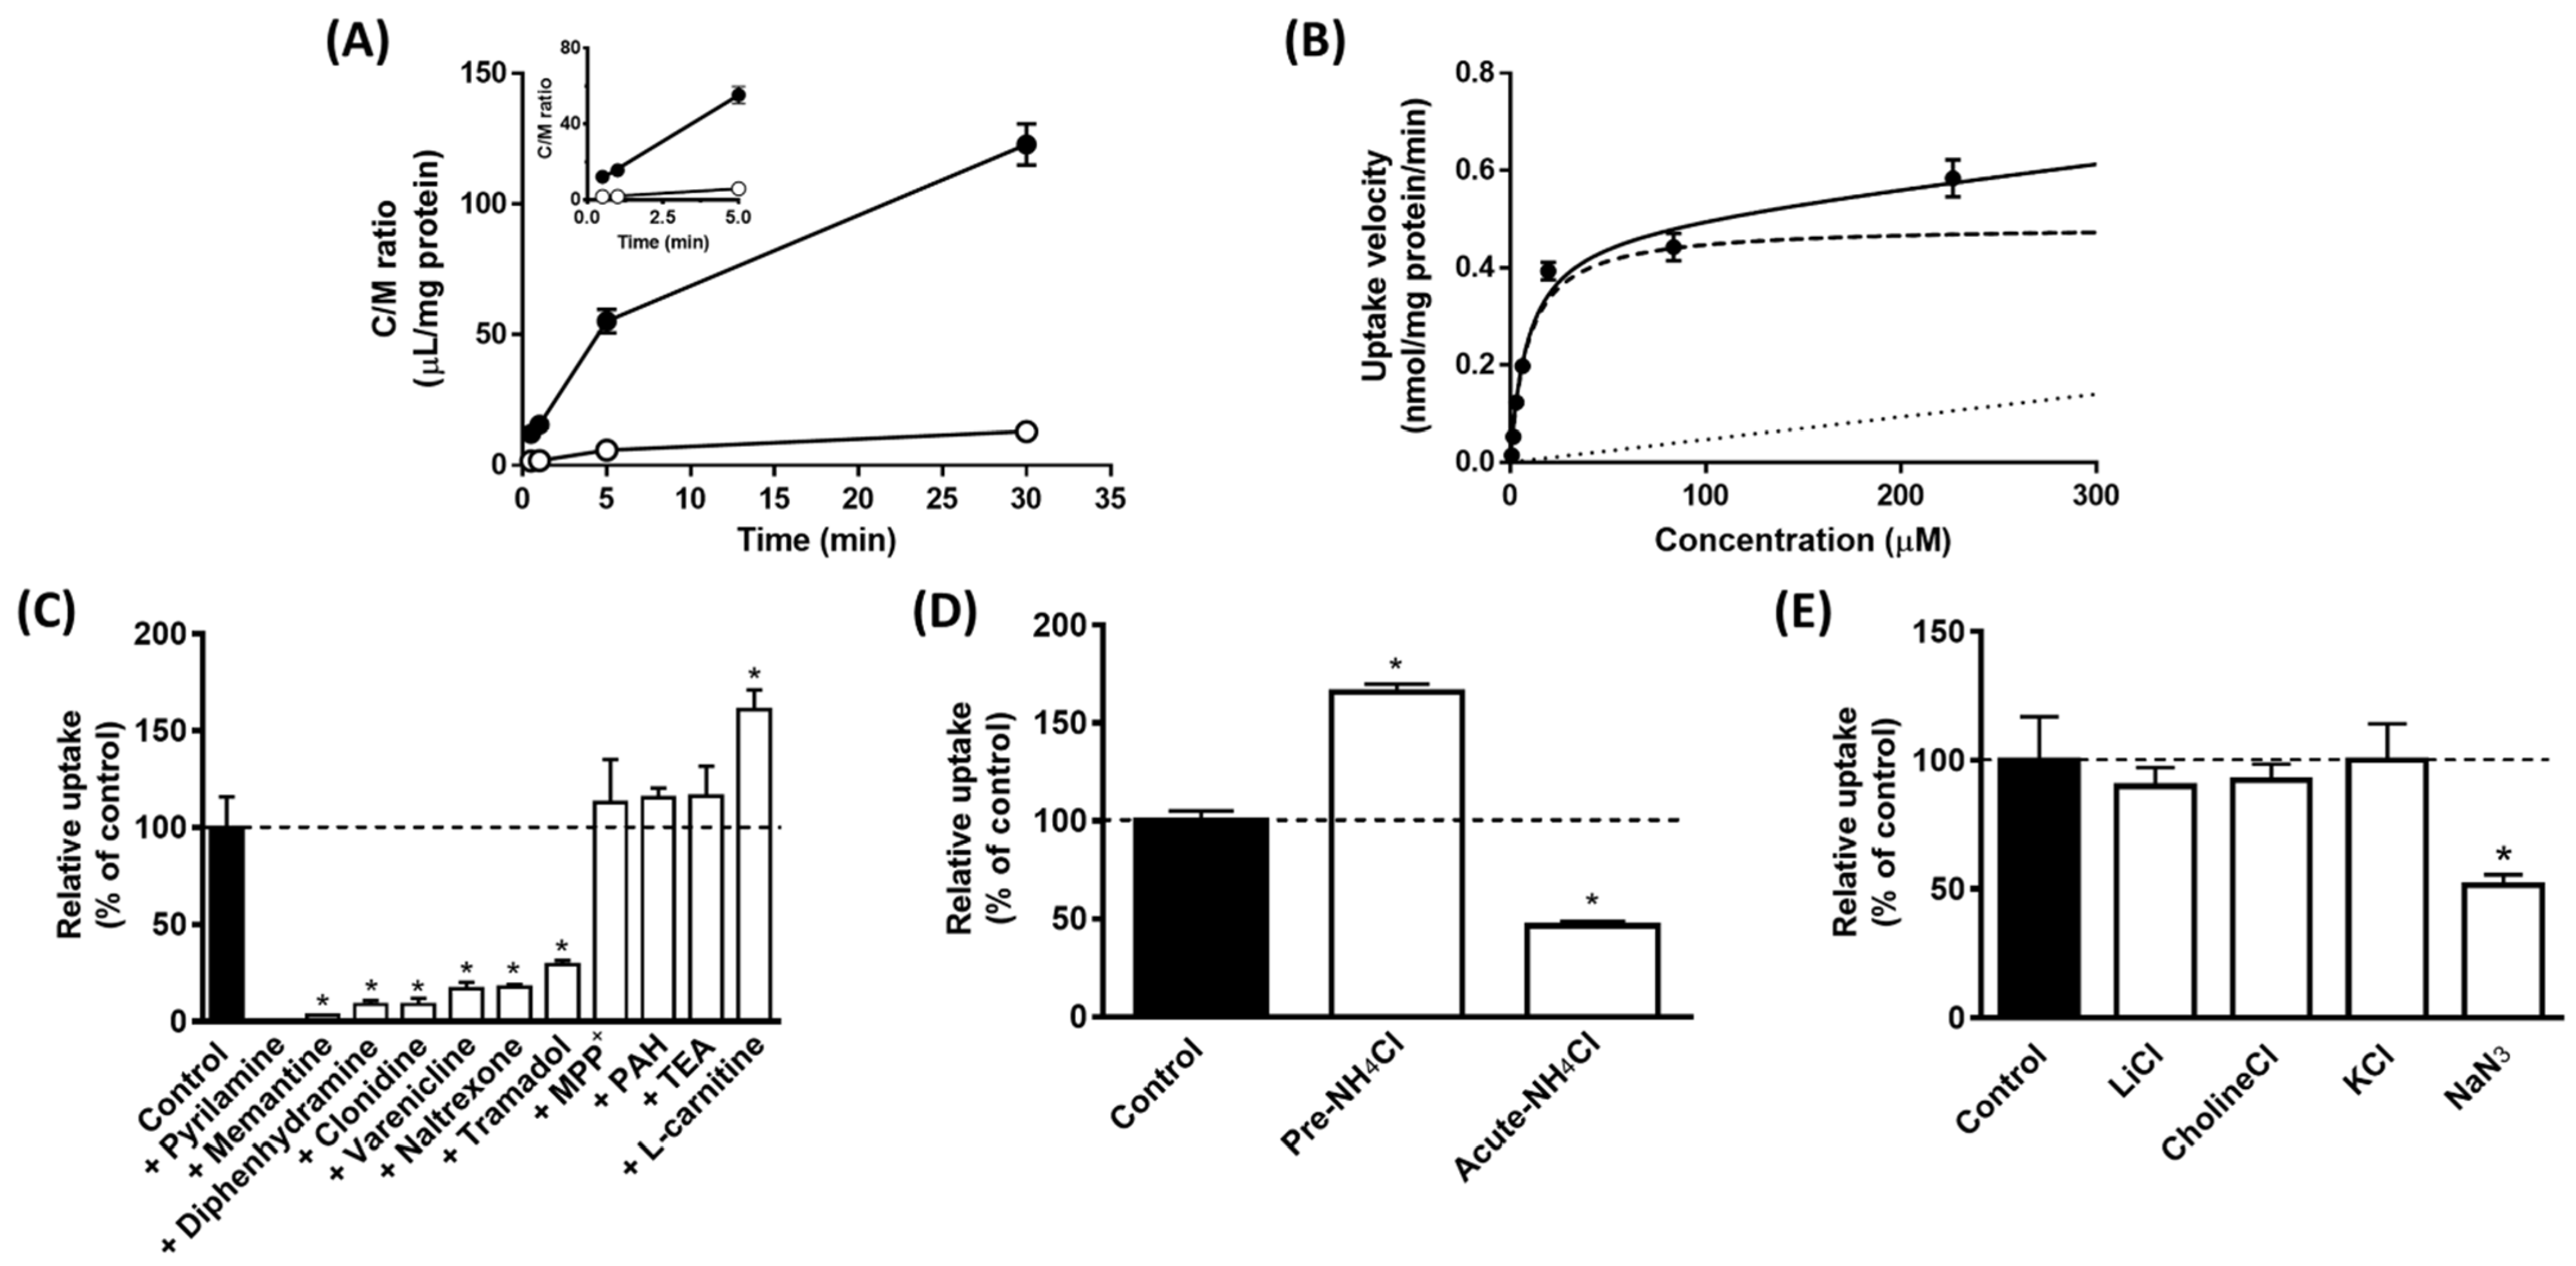
3.1. Binding of AzPYR to H+/OC Antiporter
3.2. SWATH-Based Screening of H+/OC Antiporter
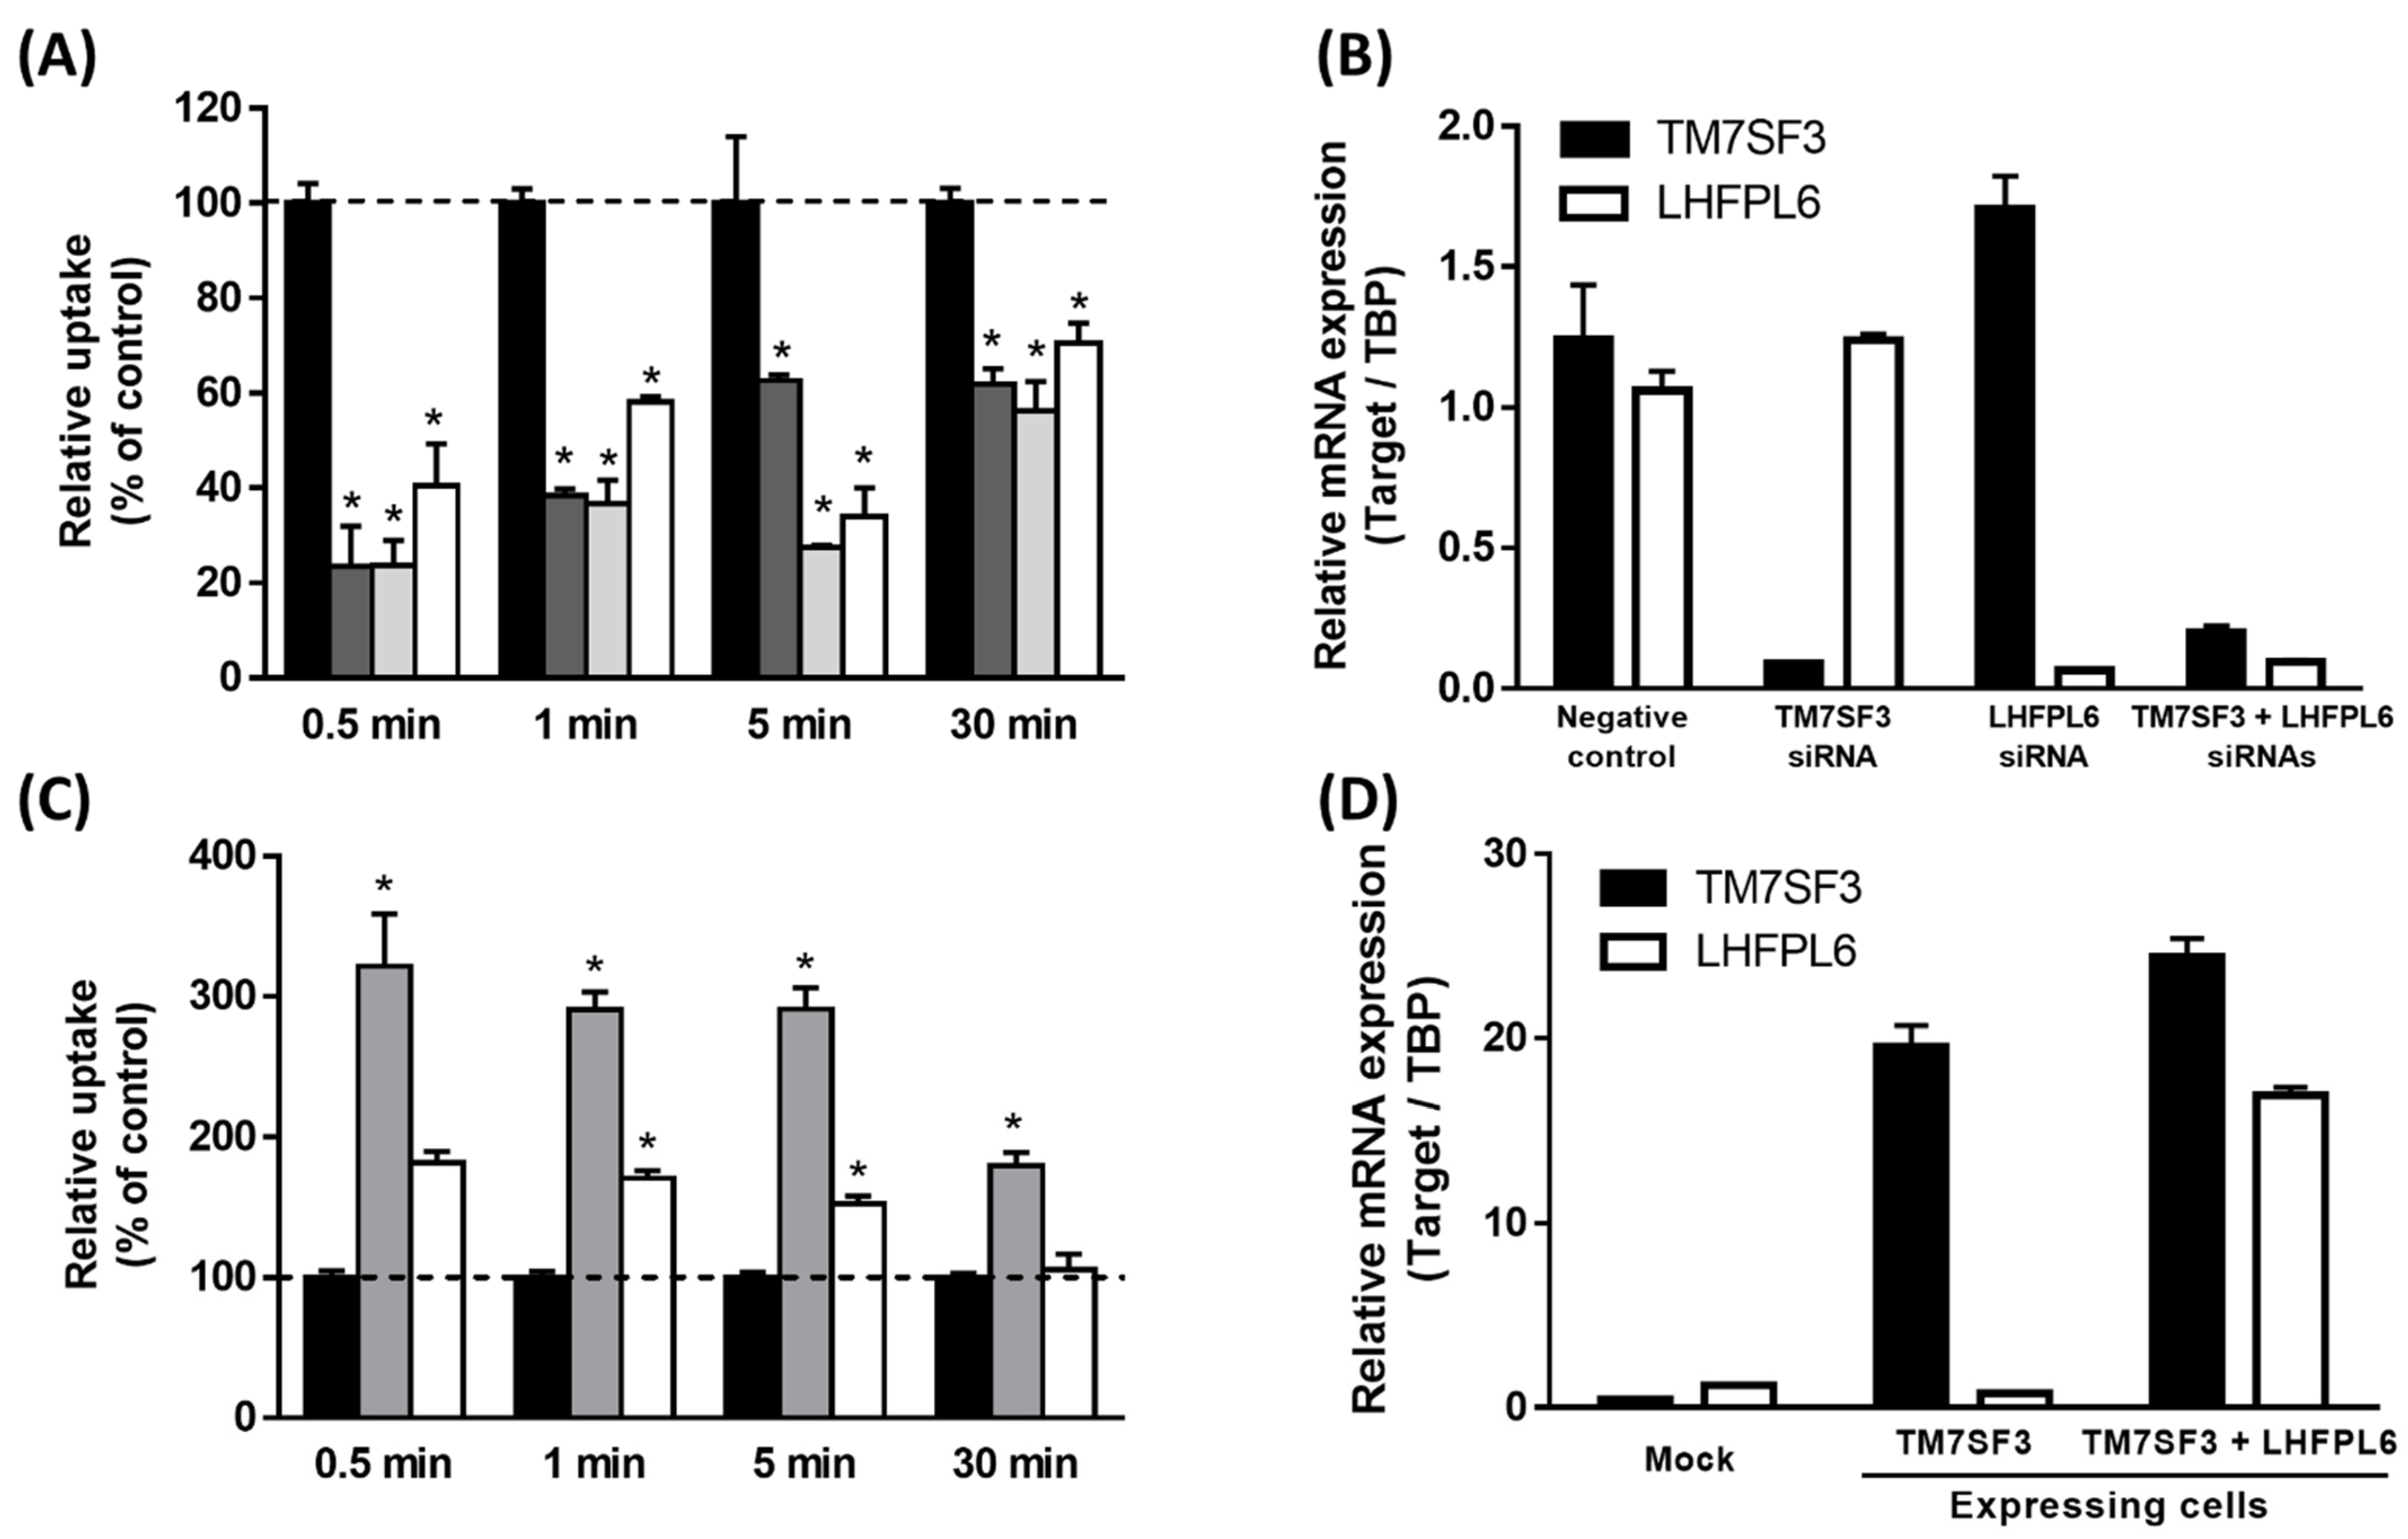
3.3. First Functional Screening by Single Gene Knockdown
3.4. Second Functional Screening by Multiple Gene Knockdown
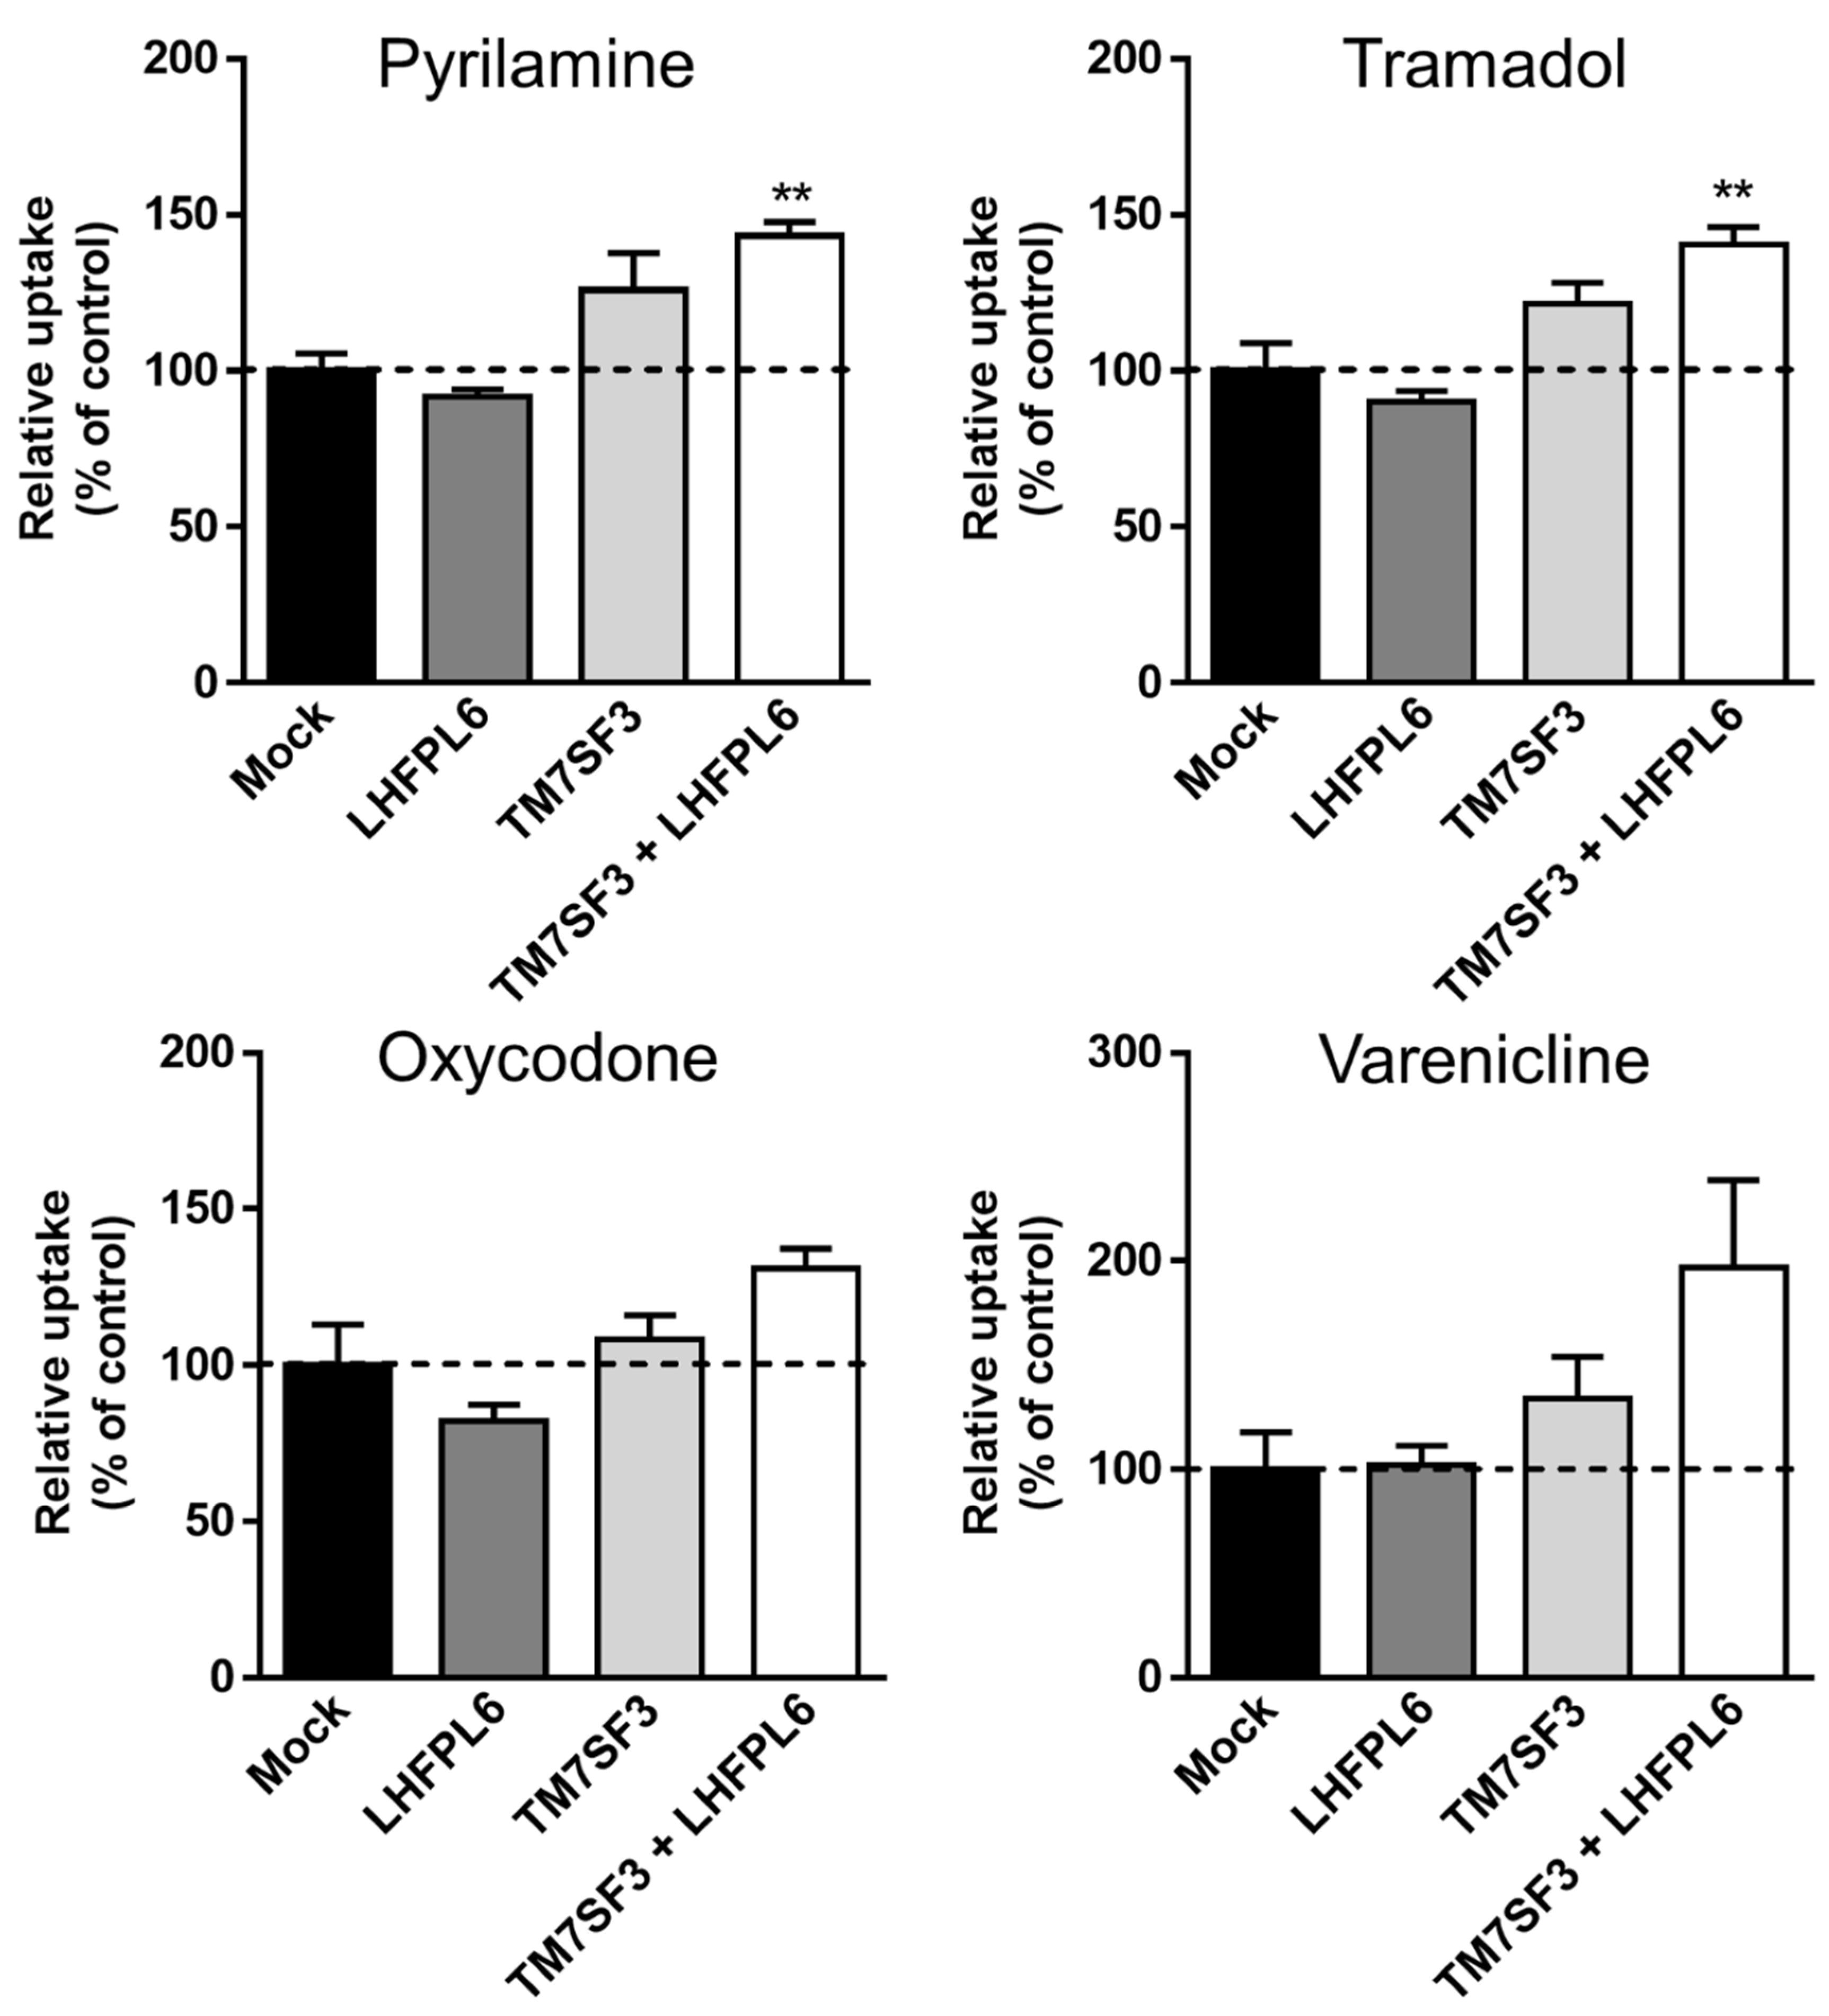
3.5. First Validation; Gain-of-Function Analysis Using “Known” Substrates
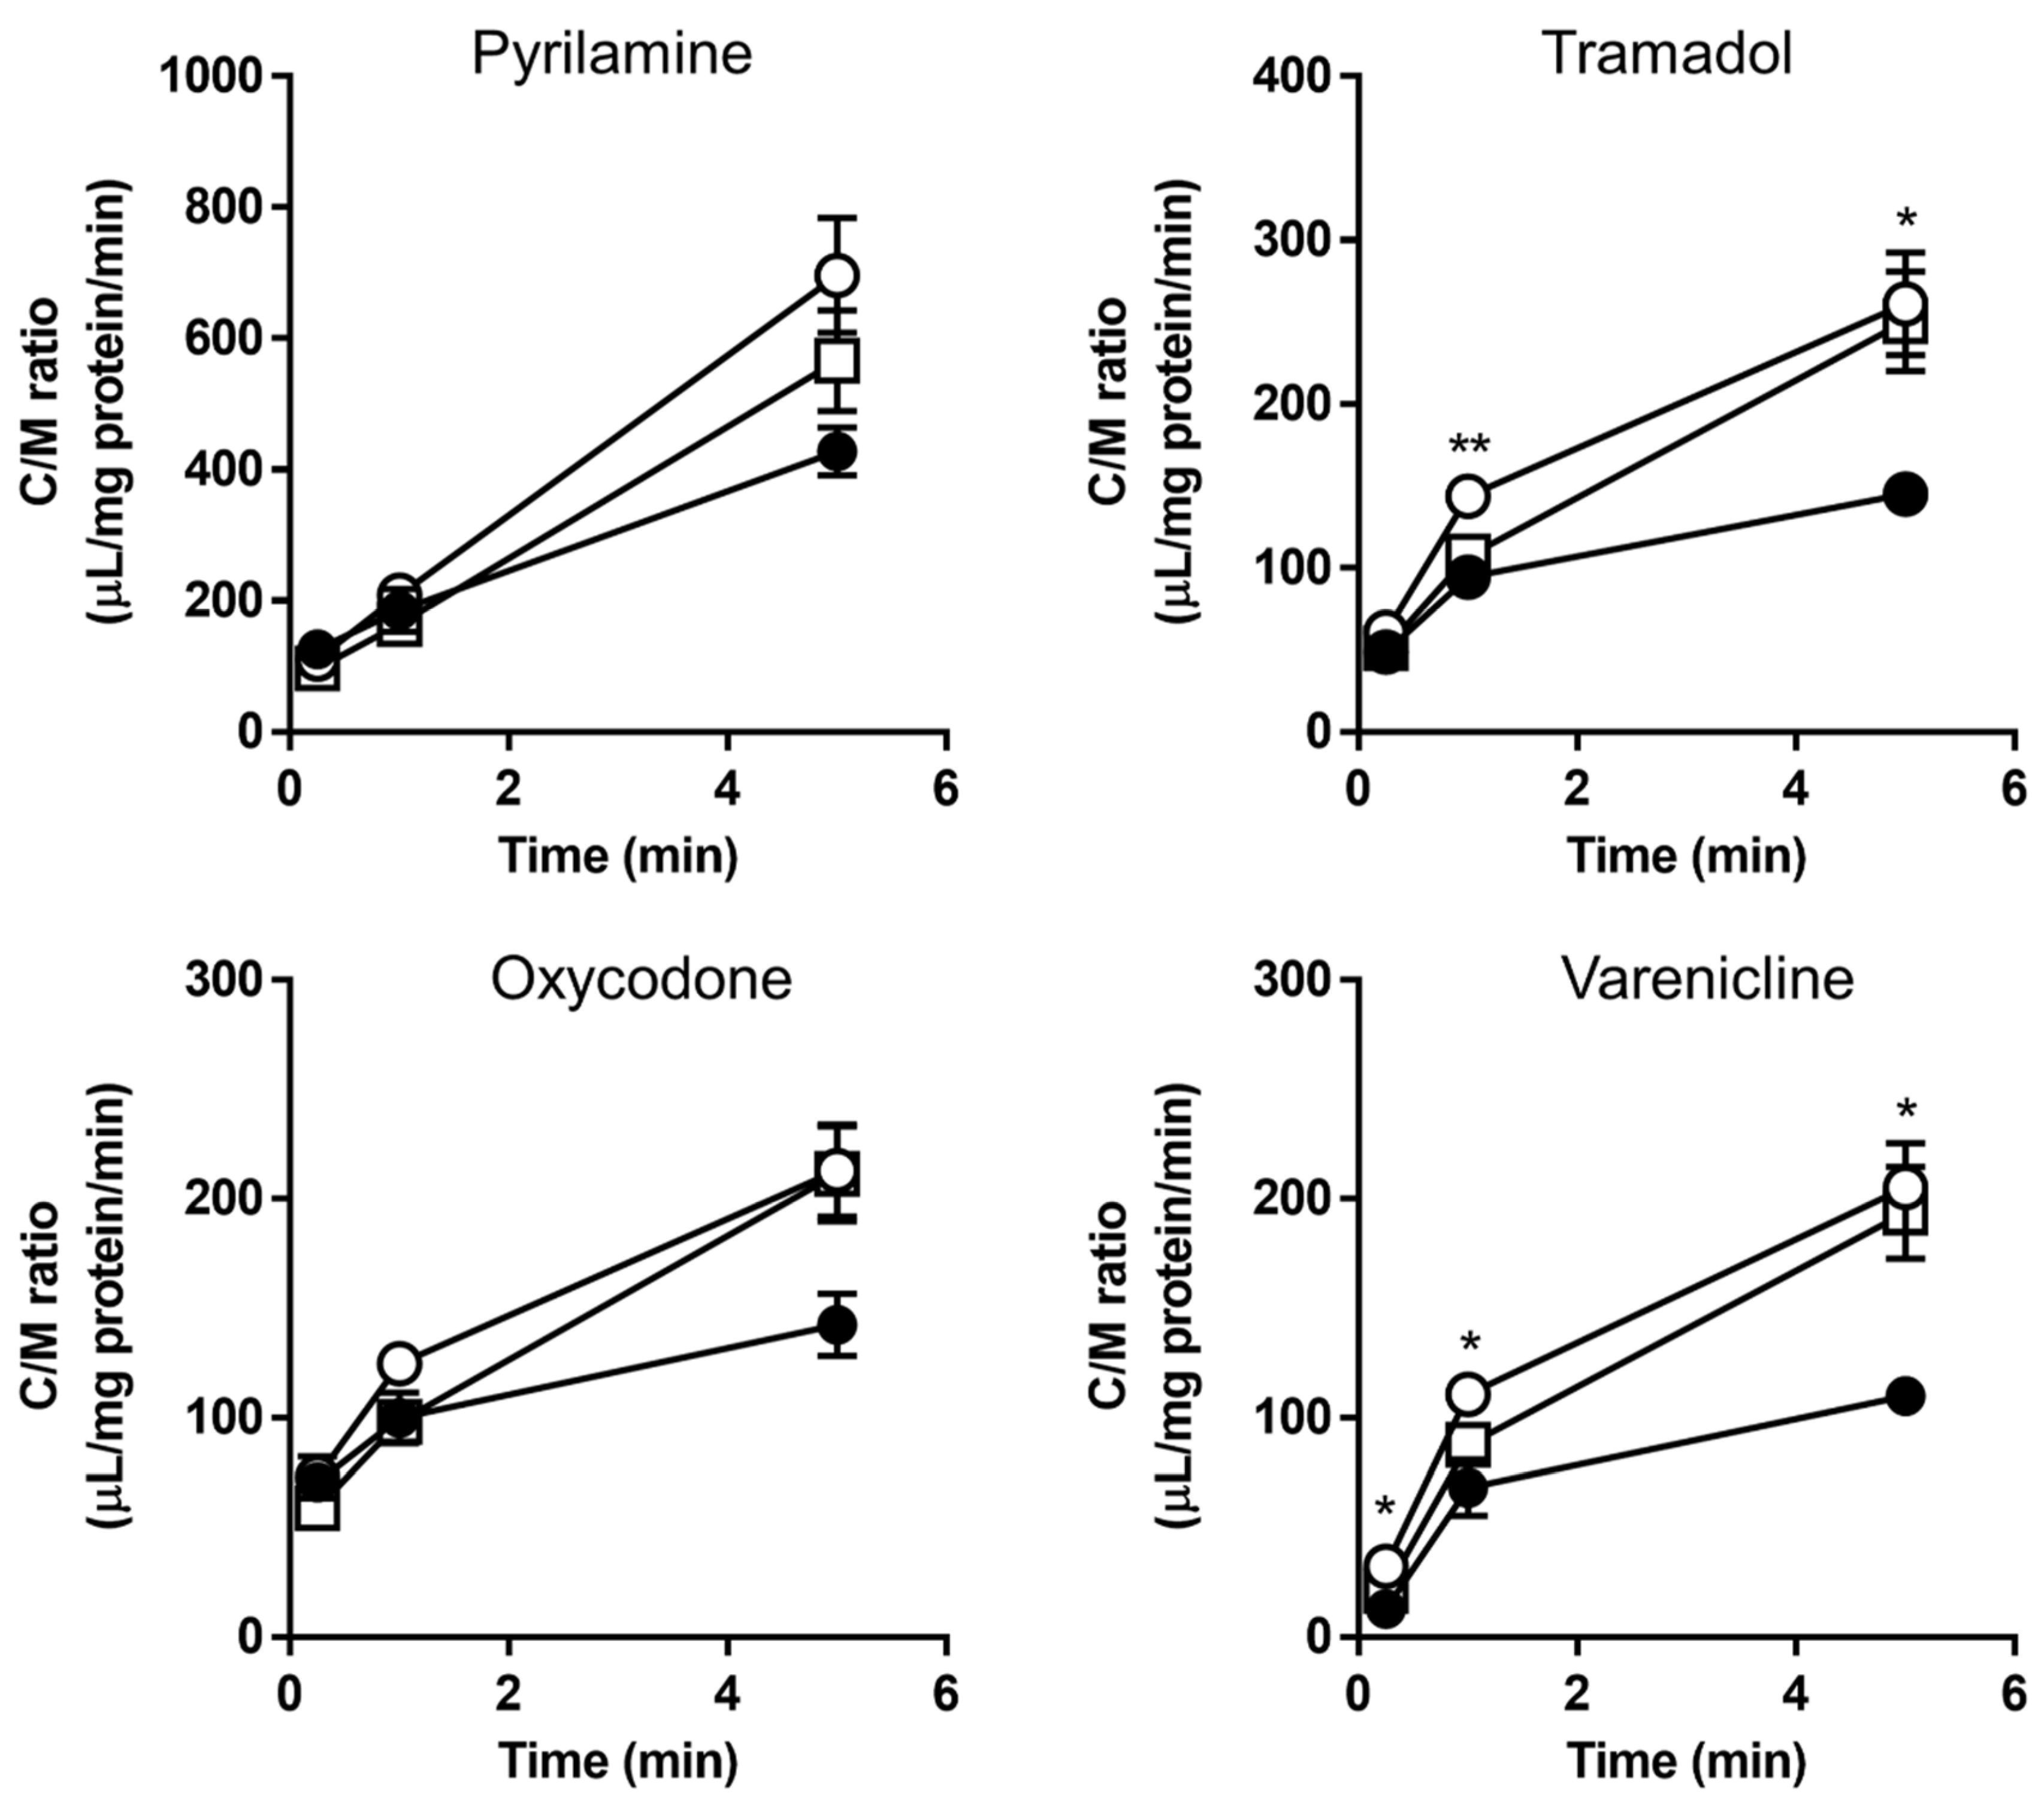
3.6. Second Validation Using a “New” Substrate (Pyrilamine Analogue)
4. Discussion
5. Conclusions
Supplementary Materials
Author Contributions
Funding
Institutional Review Board Statement
Informed Consent Statement
Data Availability Statement
Acknowledgments
Conflicts of Interest
References
- Yamazaki, M.; Terasaki, T.; Yoshioka, K.; Nagata, O.; Kato, H.; Ito, Y.; Tsuji, A. Carrier-mediated transport of H1-antagonist at the blood-brain barrier: A common transport system of H1-antagonists and lipophilic basic drugs. Pharm. Res. 1994, 11, 1516–1518. [Google Scholar] [CrossRef] [PubMed]
- Sadiq, M.W.; Borgs, A.; Okura, T.; Shimomura, K.; Kato, S.; Deguchi, Y.; Jansson, B.; Björkman, S.; Terasaki, T.; Hammarlund-Udenaes, M. Diphenhydramine active uptake at the blood-brain barrier and its interaction with oxycodone in vitro and in vivo. J. Pharm. Sci. 2011, 100, 3912–3923. [Google Scholar] [CrossRef] [PubMed]
- Boström, E.; Simonsson, U.S.; Hammarlund-Udenaes, M. In vivo blood-brain barrier transport of oxycodone in the rat: Indications for active influx and implications for pharmacokinetics/pharmacodynamics. Drug Metab. Dispos. 2006, 34, 1624–1631. [Google Scholar] [CrossRef]
- Cisternino, S.; Chapy, H.; André, P.; Smirnova, M.; Debray, M.; Scherrmann, J.M. Coexistence of passive and proton antiporter-mediated processes in nicotine transport at the mouse blood-brain barrier. AAPS J. 2013, 15, 299–307. [Google Scholar] [CrossRef]
- André, P.; Debray, M.; Scherrmann, J.M.; Cisternino, S. Clonidine transport at the mouse blood-brain barrier by a new H+ antiporter that interacts with addictive drugs. J. Cereb. Blood Flow Metab. 2009, 29, 1293–1304. [Google Scholar] [CrossRef] [PubMed]
- Kubo, Y.; Kusagawa, Y.; Tachikawa, M.; Akanuma, S.; Hosoya, K. Involvement of a novel organic cation transporter in verapamil transport across the inner blood-retinal barrier. Pharm. Res. 2013, 30, 847–856. [Google Scholar] [CrossRef] [PubMed]
- Tega, Y.; Akanuma, S.; Kubo, Y.; Hosoya, K. Involvement of the H+/organic cation antiporter in nicotine transport in rat liver. Drug Metab. Dispos. 2015, 43, 89–92. [Google Scholar] [CrossRef] [PubMed]
- Shimomura, K.; Okura, T.; Kato, S.; Couraud, P.O.; Schermann, J.M.; Terasaki, T.; Deguchi, Y. Functional expression of a proton-coupled organic cation (H+/OC) antiporter in human brain capillary endothelial cell line hCMEC/D3, a human blood-brain barrier model. Fluids Barriers CNS 2013, 10, 8. [Google Scholar] [CrossRef] [PubMed]
- Okura, T.; Hattori, A.; Takano, Y.; Sato, T.; Hammarlund-Udenaes, M.; Terasaki, T.; Deguchi, Y. Involvement of the pyrilamine transporter, a putative organic cation transporter, in blood-brain barrier transport of oxycodone. Drug Metab. Dispos. 2008, 36, 2005–2013. [Google Scholar] [CrossRef] [PubMed]
- Shinozaki, Y.; Akanuma, S.; Mori, Y.; Kubo, Y.; Hosoya, K. Comprehensive Evidence of Carrier-Mediated Distribution of Amantadine to the Retina across the Blood-Retinal Barrier in Rats. Pharmaceutics 2021, 13, 1339. [Google Scholar] [CrossRef] [PubMed]
- Chapy, H.; Goracci, L.; Vayer, P.; Parmentier, Y.; Carrupt, P.A.; Declèves, X.; Scherrmann, J.M.; Cisternino, S.; Cruciani, G. Pharmacophore-based discovery of inhibitors of a novel drug/proton antiporter in human brain endothelial hCMEC/D3 cell line. Br. J. Pharmacol. 2015, 172, 4888–4904. [Google Scholar] [CrossRef]
- Hiranaka, S.; Tega, Y.; Higuchi, K.; Kurosawa, T.; Deguchi, Y.; Arata, M.; Ito, A.; Yoshida, M.; Nagaoka, Y.; Sumiyoshi, T. Design, Synthesis, and Blood-Brain Barrier Transport Study of Pyrilamine Derivatives as Histone Deacetylase Inhibitors. ACS Med. Chem. Lett. 2018, 9, 884–888. [Google Scholar] [CrossRef] [PubMed]
- Wang, X.; Qi, B.; Su, H.; Li, J.; Sun, X.; He, Q.; Fu, Y.; Zhang, Z. Pyrilamine-sensitive proton-coupled organic cation (H+/OC) antiporter for brain-specific drug delivery. J. Control. Release 2017, 254, 34–43. [Google Scholar] [CrossRef] [PubMed]
- Okura, T.; Higuchi, K.; Kitamura, A.; Deguchi, Y. Proton-coupled organic cation antiporter-mediated uptake of apomorphine enantiomers in human brain capillary endothelial cell line hCMEC/D3. Biol. Pharm. Bull. 2014, 37, 286–291. [Google Scholar] [CrossRef] [PubMed]
- Kitamura, A.; Higuchi, K.; Okura, T.; Deguchi, Y. Transport characteristics of tramadol in the blood-brain barrier. J. Pharm. Sci. 2014, 103, 3335–3341. [Google Scholar] [CrossRef]
- Higuchi, K.; Kitamura, A.; Okura, T.; Deguchi, Y. Memantine transport by a proton-coupled organic cation antiporter in hCMEC/D3 cells, an in vitro human blood-brain barrier model. Drug Metab. Pharmacokinet. 2015, 30, 182–187. [Google Scholar] [CrossRef] [PubMed]
- Kurosawa, T.; Higuchi, K.; Okura, T.; Kobayashi, K.; Kusuhara, H.; Deguchi, Y. Involvement of Proton-Coupled Organic Cation Antiporter in Varenicline Transport at Blood-Brain Barrier of Rats and in Human Brain Capillary Endothelial Cells. J. Pharm. Sci. 2017, 106, 2576–2582. [Google Scholar] [CrossRef]
- Sweet, D.H. Organic Cation Transporter Expression and Function in the CNS. Handb. Exp. Pharmacol. 2021, 266, 41–80. [Google Scholar] [PubMed]
- Alexovič, M.; Urban, P.L.; Tabani, H.; Sabo, J. Recent advances in robotic protein sample preparation for clinical analysis and other biomedical applications. Clin. Chim. Acta 2020, 507, 104–116. [Google Scholar] [CrossRef] [PubMed]
- Frei, A.P.; Moest, H.; Novy, K.; Wollscheid, B. Ligand-based receptor identification on living cells and tissues using TRICEPS. Nat. Protoc. 2013, 8, 1321–1336. [Google Scholar] [CrossRef] [PubMed]
- Sumranjit, J.; Chung, S.J. Recent advances in target characterization and identification by photoaffinity probes. Molecules 2013, 18, 10425–10451. [Google Scholar] [CrossRef] [PubMed]
- Patterson, D.M.; Nazarova, L.A.; Prescher, J.A. Finding the right (bioorthogonal) chemistry. ACS Chem. Biol. 2014, 9, 592–605. [Google Scholar] [CrossRef] [PubMed]
- Kitamura, M.; Yano, M.; Tashiro, N.; Miyagawa, S.; Sando, M.; Okauchi, T. Direct Synthesis of Organic Azides from Primary Amines with 2-Azido-1,3-dimethylimidazolinium Hexafluorophosphate. Eur. J. Org. Chem. 2011, 2011, 458–462. [Google Scholar] [CrossRef]
- Tezuka, K.; Suzuki, M.; Sato, R.; Kawarada, S.; Terasaki, T.; Uchida, Y. Activation of Annexin A2 signaling at the blood-brain barrier in a mouse model of multiple sclerosis. J. Neurochem. 2022, 160, 662–674. [Google Scholar] [CrossRef] [PubMed]
- Uchida, Y.; Sasaki, H.; Terasaki, T. Establishment and validation of highly accurate formalin-fixed paraffin-embedded quantitative proteomics by heat-compatible pressure cycling technology using phase-transfer surfactant and SWATH-MS. Sci. Rep. 2020, 10, 11271. [Google Scholar] [CrossRef]
- Sato, R.; Ohmori, K.; Umetsu, M.; Takao, M.; Tano, M.; Grant, G.; Porter, B.; Bet, A.; Terasaki, T.; Uchida, Y. An Atlas of the Quantitative Protein Expression of Anti-Epileptic-Drug Transporters, Metabolizing Enzymes and Tight Junctions at the Blood-Brain Barrier in Epileptic Patients. Pharmaceutics 2021, 13, 2122. [Google Scholar] [CrossRef] [PubMed]
- Uchida, Y.; Higuchi, T.; Shirota, M.; Kagami, S.; Saigusa, D.; Koshiba, S.; Yasuda, J.; Tamiya, G.; Kuriyama, S.; Kinoshita, K.; et al. Identification and Validation of Combination Plasma Biomarker of Afamin, Fibronectin and Sex Hormone-Binding Globulin to Predict Pre-eclampsia. Biol. Pharm. Bull. 2021, 44, 804–815. [Google Scholar] [CrossRef]
- Sadek, B.; Alisch, R.; Buschauer, A.; Elz, S. Synthesis and dual histamine H1 and H2 receptor antagonist activity of cyanoguanidine derivatives. Molecules 2013, 18, 14186–14202. [Google Scholar] [CrossRef] [PubMed]
- Takamuro, I.; Sekine, Y.; Tsuboi, Y.; Nogi, K.; Taniguchi, H. A Pyrazolopyrimidine Compound and a Process for Preparing the Same. WO2004064721 A2, 5 August 2004. [Google Scholar]
- Yamazaki, M.; Fukuoka, H.; Nagata, O.; Kato, H.; Ito, Y.; Terasaki, T.; Tsuji, A. Transport mechanism of an H1-antagonist at the blood-brain barrier: Transport mechanism of mepyramine using the carotid injection technique. Biol. Pharm. Bull. 1994, 17, 676–679. [Google Scholar] [CrossRef] [PubMed]
- Nakazawa, Y.; Okura, T.; Shimomura, K.; Terasaki, T.; Deguchi, Y. Drug-drug interaction between oxycodone and adjuvant analgesics in blood-brain barrier transport and antinociceptive effect. J. Pharm. Sci. 2010, 99, 467–474. [Google Scholar] [CrossRef] [PubMed]
- Hosang, M.; Gibbs, E.M.; Diedrich, D.F.; Semenza, G. Photoaffinity labeling and identification of (a component of) the small-intestinal Na+,D-glucose transporter using 4-azidophlorizin. FEBS Lett. 1981, 130, 244–248. [Google Scholar] [CrossRef]
- Kim, S.H.; Shin, S.J.; Park, J.S. Identification of the ATP transporter of rat liver rough endoplasmic reticulum via photoaffinity labeling and partial purification. Biochemistry 1996, 35, 5418–5425. [Google Scholar] [CrossRef] [PubMed]
- Fotiadis, D.; Kanai, Y.; Palacín, M. The SLC3 and SLC7 families of amino acid transporters. Mol. Asp. Med. 2013, 34, 139–158. [Google Scholar] [CrossRef]
- Beck, A.; Isaac, R.; Lavelin, I.; Hart, Y.; Volberg, T.; Shatz-Azoulay, H.; Geiger, B.; Zick, Y. An siRNA screen identifies transmembrane 7 superfamily member 3 (TM7SF3), a seven transmembrane orphan receptor, as an inhibitor of cytokine-induced death of pancreatic beta cells. Diabetologia 2011, 54, 2845–2855. [Google Scholar] [CrossRef] [PubMed]
- Isaac, R.; Goldstein, I.; Furth, N.; Zilber, N.; Streim, S.; Boura-Halfon, S.; Elhanany, E.; Rotter, V.; Oren, M.; Zick, Y. TM7SF3, a novel p53-regulated homeostatic factor, attenuates cellular stress and the subsequent induction of the unfolded protein response. Cell Death Differ. 2017, 24, 132–143. [Google Scholar] [CrossRef]
- Liu, Y.J.; Yin, S.Y.; Zeng, S.H.; Hu, Y.D.; Wang, M.Q.; Huang, P.; Li, J.P. Prognostic Value of LHFPL Tetraspan Subfamily Member 6 (LHFPL6) in Gastric Cancer: A Study Based on Bioinformatics Analysis and Experimental Validation. Pharmgenomics Pers. Med. 2021, 14, 1483–1504. [Google Scholar] [CrossRef] [PubMed]
- Whillans, D.W.; Adams, G.E. Electron transfer oxidation of DNA radicals by paranitroacetophenone. Int. J. Radiat. Biol. Relat. Stud. Phys. Chem. Med. 1975, 28, 501–510. [Google Scholar] [CrossRef] [PubMed]
- Petit, M.M.; Schoenmakers, E.F.; Huysmans, C.; Geurts, J.M.; Mandahl, N.; Van de Ven, W.J. LHFP, a novel translocation partner gene of HMGIC in a lipoma, is a member of a new family of LHFP-like genes. Genomics 1999, 57, 438–441. [Google Scholar] [CrossRef]
- Hirano, S.; Goto, R.; Uchida, Y. SWATH-Based Comprehensive Determination of the Localization of Apical and Basolateral Membrane Proteins Using Mouse Liver as a Model Tissue. Biomedicines 2022, 10, 383. [Google Scholar] [CrossRef] [PubMed]
- Usoskin, D.; Furlan, A.; Islam, S.; Abdo, H.; Lönnerberg, P.; Lou, D.; Hjerling-Leffler, J.; Haeggström, J.; Kharchenko, O.; Kharchenko, P.V.; et al. Unbiased classification of sensory neuron types by large-scale single-cell RNA sequencing. Nat. Neurosci. 2015, 18, 145–153. [Google Scholar] [CrossRef]
- Hodge, R.D.; Bakken, T.E.; Miller, J.A.; Smith, K.A.; Barkan, E.R.; Graybuck, L.T.; Close, J.L.; Long, B.; Johansen, N.; Penn, O.; et al. Conserved cell types with divergent features in human versus mouse cortex. Nature 2019, 573, 61–68. [Google Scholar] [CrossRef] [PubMed]
- Smajić, S.; Prada-Medina, C.A.; Landoulsi, Z.; Ghelfi, J.; Delcambre, S.; Dietrich, C.; Jarazo, J.; Henck, J.; Balachandran, S.; Pachchek, S.; et al. Single-cell sequencing of human midbrain reveals glial activation and a Parkinson-specific neuronal state. Brain 2022, 145, 964–978. [Google Scholar] [CrossRef]
- Yang, A.C.; Vest, R.T.; Kern, F.; Lee, D.P.; Agam, M.; Maat, C.A.; Losada, P.M.; Chen, M.B.; Schaum, N.; Khoury, N.; et al. A human brain vascular atlas reveals diverse mediators of Alzheimer’s risk. Nature 2022, 603, 885–892. [Google Scholar] [CrossRef]
- Bronckers, A.L.; Lyaruu, D.M.; Bervoets, T.J.; Medina, J.F.; DenBesten, P.; Richter, J.; Everts, V. Murine ameloblasts are immunonegative for Tcirg1, the v-H-ATPase subunit essential for the osteoclast plasma proton pump. Bone 2012, 50, 901–908. [Google Scholar] [CrossRef] [PubMed]


| Protein Names | Subcellular Location | Abundance Ratio AzPYR-Unbound Peptide | Number of Transmembrane Domains | ||
|---|---|---|---|---|---|
| AzPYR /Control | (AzPYR+FLV) /Control | (AzPYR+DPH) /Control | |||
| Magnesium transporter protein 1 (MAGT1) | Cell membrane | 0.385 | 0.626 | 0.499 | 4 |
| CD9 antigen (CD9) | Cell membrane | 0.182 | 0.957 | 1.566 | 4 |
| Cytochrome b reductase 1 (CYBRD1) | Unknown | 0.401 | 0.975 | 0.925 | 6 |
| Sodium/potassium-transporting ATPase subunit alpha-1 (ATP1A1) | Cell membrane | 0.365 | 0.809 | 1.075 | 10 |
| Cleft lip and palate transmembrane protein 1 (CLPTM1) | Cell membrane | 0.266 | 0.658 | 0.692 | 5 |
| V-type proton ATPase 116 kDa subunit a isoform 3 (TCIRG1) | Unknown | 0.144 | 0.84 | 0.551 | 8 |
| V-type proton ATPase 116 kDa subunit a isoform 1 (ATP6V0A1) | Unknown | 0.319 | 0.739 | ― (a) | 8 |
| LHFPL tetraspan subfamily member 6 protein (LHFPL6) | Unknown | 0.0326 | 0.993 | 0.879 | 3 |
| PRA1 family protein 3 (ARL6IP5) | Cell membrane | 0.0891 | 0.0732 | 0.404 | 4 |
| Solute carrier family 43 member 3 (SLC43A3) | Unknown | 0.0725 | 0.0795 | 1 | 12 |
| Transmembrane protein 65 (TMEM65) | Cell membrane | 0.28 | 0.622 | 0.238 | 3 |
| Transmembrane 7 superfamily member 3 (TM7SF3) | Cell membrane | 0.451 | 0.681 | ― (a) | 7 |
| Sodium/hydrogen exchanger 1 (SLC9A1) | Cell membrane | 0.442 | 1.44 | 1.09 | 12 |
| Solute carrier family 12 member 5 (SLC12A5) | Unknown | 0.189 | 0.964 | 0.977 | 12 |
| CD63 antigen (CD63) | Cell membrane | 0.0906 | 0.172 | 0.413 | 4 |
| Aquaporin-3 (AQP3) | Cell membrane | 0.0561 | 0.494 | 0.0525 | 6 |
| Target Gene | Relative Uptake (% of Control) | |||
|---|---|---|---|---|
| Pyrilamine | Tramadol | Diphenhydramine | Gabapentin | |
| Control | 100 ± 12 | 100 ± 10 | 100 ± 15 | 100 ± 7 |
| MAGT1 | 109 ± 11 | 104 ± 8 | 118 ± 11 | 110 ± 5 |
| CD9 | 26.0 ± 7.3 | 56.5 ± 7.1 | 83.4 ± 12.0 | 148 ± 17 |
| CYBRD1 | 96.7 ± 19.0 | 114 ± 12 | 121 ± 23 | 165 ± 22 ** |
| ATP1A1 | 130 ± 21 | 129 ± 22 | 132 ± 12 | 161 ± 17 ** |
| CLPTM1 | 128 ± 19 | 133 ± 17 | 132 ± 7 | 169 ± 14 ** |
| TCIRG1 | 50.2 ± 14.6 | 67.0 ± 11.7 | 83.9 ± 9.7 | 119 ± 5 |
| SLC12A5 | 95.9 ± 7.6 | 87.2 ± 5.3 | 107 ± 9 | 92.8 ± 5.6 |
| LHFPL6 | 46.1 ± 20.3 | 74.8 ± 13.9 | 68.9 ± 9.2 | 134 ± 14 |
| ARL6IP5 | 174 ± 16 | 149 ± 2 | 134 ± 5 | 146 ± 14 |
| SLC43A3 | 52.0 ± 16.0 | 122 ± 13 | 127 ± 21 | 143 ± 9 |
| TMEM65 | 120 ± 19 | 170 ± 17 ** | 144 ± 16 | 130 ± 6 |
| TM7SF3 | 69.5 ± 11.4 | 76.8 ± 5.5 | 68.7 ± 8.7 | 145 ± 8 |
| SLC9A1 | 68.4 ± 16.3 | 76.8 ± 2.3 | 96.5 ± 8.7 | 87.3 ± 8.6 |
| ATP6V0A1 | 116 ± 15 | 119 ± 3 | 107 ± 9 | 118 ± 7 |
| CD63 | 105 ± 6 | 118 ± 8 | 97.7 ± 20.2 | 144 ± 14 |
| AQP3 | 148 ± 45 | 114 ± 21 | 146 ± 25 | 90.8 ± 11.3 |
| Relative Uptake (% of Control) | |||||
|---|---|---|---|---|---|
| Pyrilamine | Tramadol | Oxycodone | Varenicline | Gabapentin | |
| Control | 100 ± 9 | 100 ± 6 | 100 ± 7 | 100 ± 14 | 100 ± 5 |
| TCIRG1 + LHFPL6 | 104 ± 2 | 112 ± 4 | 74.6 ± 1.8 * | 61.0 ± 8.0 | 89.5 ± 6.1 |
| TM7SF3 + LHFPL6 | 68.2 ± 5.7 * | 64.8 ± 4.3 ** | 66.6 ± 3.0 ** | 67.7 ± 7.9 | 121 ± 6 |
| TCIRG1 + TM7SF3 | 87.6 ± 9.0 | 93.0 ± 6.5 | 74.6 ± 7.6 * | 59.6 ± 13.6 | 99.7 ± 6.9 |
| Control | 100 ± 4 | 100 ± 5 | 100 ± 6 | 100 ± 24 | 100 ± 3 |
| TCIRG1 + TM7SF3 + LHFPL6 | 93.6 ± 5.5 | 101 ± 4 | 92.0 ± 4.1 | 76.0 ± 8.0 | 122 ± 5 * |
Publisher’s Note: MDPI stays neutral with regard to jurisdictional claims in published maps and institutional affiliations. |
© 2022 by the authors. Licensee MDPI, Basel, Switzerland. This article is an open access article distributed under the terms and conditions of the Creative Commons Attribution (CC BY) license (https://creativecommons.org/licenses/by/4.0/).
Share and Cite
Kurosawa, T.; Tega, Y.; Uchida, Y.; Higuchi, K.; Tabata, H.; Sumiyoshi, T.; Kubo, Y.; Terasaki, T.; Deguchi, Y. Proteomics-Based Transporter Identification by the PICK Method: Involvement of TM7SF3 and LHFPL6 in Proton-Coupled Organic Cation Antiport at the Blood–Brain Barrier. Pharmaceutics 2022, 14, 1683. https://doi.org/10.3390/pharmaceutics14081683
Kurosawa T, Tega Y, Uchida Y, Higuchi K, Tabata H, Sumiyoshi T, Kubo Y, Terasaki T, Deguchi Y. Proteomics-Based Transporter Identification by the PICK Method: Involvement of TM7SF3 and LHFPL6 in Proton-Coupled Organic Cation Antiport at the Blood–Brain Barrier. Pharmaceutics. 2022; 14(8):1683. https://doi.org/10.3390/pharmaceutics14081683
Chicago/Turabian StyleKurosawa, Toshiki, Yuma Tega, Yasuo Uchida, Kei Higuchi, Hidetsugu Tabata, Takaaki Sumiyoshi, Yoshiyuki Kubo, Tetsuya Terasaki, and Yoshiharu Deguchi. 2022. "Proteomics-Based Transporter Identification by the PICK Method: Involvement of TM7SF3 and LHFPL6 in Proton-Coupled Organic Cation Antiport at the Blood–Brain Barrier" Pharmaceutics 14, no. 8: 1683. https://doi.org/10.3390/pharmaceutics14081683