Article

Mono and Multiple Tumor-Targeting Ligand-Coated Ultrasmall Gadolinium Oxide Nanoparticles: Enhanced Tumor Imaging and Blood Circulation

1
Department of Chemistry, College of Natural Sciences, Kyungpook National University, Taegu 41566, Korea
2
Department of Medical & Biological Engineering, Kyungpook National University, Taegu 41944, Korea
3
Department of Molecular Medicine, School of Medicine, Kyungpook National University, Taegu 41944, Korea
4
Department of Biology Education, Teachers’ College, Kyungpook National University, Taegu 41566, Korea
*
Authors to whom correspondence should be addressed.
Pharmaceutics 2022, 14(7), 1458; https://doi.org/10.3390/pharmaceutics14071458
Submission received: 2 June 2022 / Revised: 9 July 2022 / Accepted: 11 July 2022 / Published: 12 July 2022
(This article belongs to the Special Issue Development of Novel Tumor-Targeting Nanoparticles)

Abstract

:
Hydrophilic and biocompatible PAA-coated ultrasmall Gd2O3 nanoparticles (davg = 1.7 nm) were synthesized and conjugated with tumor-targeting ligands, i.e., cyclic arginylglycylaspartic acid (cRGD) and/or folic acid (FA). FA-PAA-Gd2O3 and cRGD/FA-PAA-Gd2O3 nanoparticles were successfully applied in U87MG tumor-bearing mice for tumor imaging using T1 magnetic resonance imaging (MRI). cRGD/FA-PAA-Gd2O3 nanoparticles with multiple tumor-targeting ligands exhibited higher contrasts at the tumor site than FA-PAA-Gd2O3 nanoparticles with mono tumor-targeting ligands. In addition, the cRGD/FA-PAA-Gd2O3 nanoparticles exhibited higher contrasts in all organs, especially the aorta, compared with those of the FA-PAA-Gd2O3 nanoparticles, because of the blood cell hitchhiking effect of cRGD in the cRGD/FA-PAA-Gd2O3 nanoparticles, which prolonged their circulation in the blood.

1. Introduction

Molecular imaging is an important tool for tumor diagnosis [1,2,3]. Currently available imaging modalities include magnetic resonance imaging (MRI) (25–100 μm, 10−11–10−12 M), X-ray computed tomography (50–200 μm, not well characterized), fluorescent imaging (2–3 mm, 10−9–10−12 M), ultrasound imaging (50–200 μm, not well characterized), positron emission tomography (1–2 mm, 10−11–10−12 M), and single-photon emission computed tomography (1–2 mm, 10−11–10−12 M); the numbers in parentheses are spatial resolution and sensitivity in terms of imaging probe concentration, respectively [3]. Among these, MRI is a non-invasive imaging technique commonly used for disease diagnosis owing to its high spatial resolution with no depth limit [2,3]. Currently, various Gd-chelates are commercially available as MRI contrast agents. In addition, recent studies have demonstrated that Gd-based nanoparticles can provide better contrast than molecular Gd-chelates [4,5]. Nanoparticles facilitate enhanced tumor imaging compared with small molecules owing to their advanced imaging properties and facile conjugation with tumor-targeting ligands [4,5]. Furthermore, nanoparticles allow diverse theranostic applications via surface functionalization, leading to improved tumor treatments [5,6]. Moreover, the number of nanoparticles delivered to the tumor can be enhanced using multiple tumor-targeting ligands, as this strategy can overcome the receptor saturation phenomenon observed in mono tumor-targeting ligand-coated nanoparticles [7,8,9].
Conventional large nanoparticles adhere to blood plasma proteins, including albumins and serum (termed as opsonization), during circulation [10,11]. As a result, they can be taken up by the reticuloendothelial system (RES), which consists of phagocytic cells [12,13,14,15]. This limits the lifetime and availability of nanoparticles in the blood and reduces their therapeutic efficacy. However, opsonization and RES uptake can be reduced by coating nanoparticles with hydrophilic ligands, such as polyethylene glycols (PEGs) [6], and restricting their hydrodynamic diameters to 10–100 nm [14,15]. Additionally, this size range facilitates their delayed renal excretion, as it is larger than the kidney glomerular epithelial filtration slit (~4 nm) [16]. Consequently, tumor imaging and therapy can be improved by prolonged blood circulation of such nanoparticles.
Among others, ultrasmall gadolinium oxide (Gd2O3) nanoparticles are of special interest, as Gd possesses unique and excellent theranostic properties [17]. The pure high-spin magnetic moment of Gd (S = 7/2) makes it an ideal core metal ion for commercial application as a T1 MRI contrast agent [18,19,20]. In addition, Gd has the highest neutron capture cross-section (σ = 254,000 barns) among stable radioisotopes [21,22,23]. These properties render Gd-based chemicals extremely useful as MRI-guided neutron capture therapeutic agents for malignant tumors [24]. Notably, ultrasmall Gd2O3 nanoparticles have considerably higher longitudinal water proton spin relaxivities (r1) than those of commercially available Gd-chelates [25,26,27,28,29,30]. Moreover, their r2/r1 ratios (r2 = transverse water proton spin relaxivity) are close to one; therefore, they can act as high-performance T1 MRI contrast agents.
In the present study, ultrasmall Gd2O3 nanoparticles were synthesized using a one-pot polyol method and grafted with polyacrylic acid (PAA; Mw = ~1800 amu) to form water-soluble and biocompatible nanoparticle colloids in aqueous media. PAA-Gd2O3 nanoparticles were further conjugated with folic acid (FA) and/or cyclic arginylglycylaspartic acid (cRGD) tumor-targeting ligands to prepare FA-PAA-Gd2O3 and cRGD/FA-PAA-Gd2O3 nanoparticles, respectively. FA targets the overexpressed folate receptors on tumor cells and facilitates nanoparticle penetration [31,32,33], whereas cRGD peptides target the overexpressed integrin receptors (e.g., αvβ3) on tumor cells, which are associated with tumor angiogenesis and metastasis [34,35,36,37,38,39]. Therefore, FA and cRGD have been extensively used as tumor targeting ligands for tumor imaging and diagnosis [31,34,37,38,39] as well as drug delivery during chemotherapy, including drugs such as of doxorubicin and paclitaxel [32,33,35,36,38] in vitro and in vivo. Drugs can be delivered to tumor cells after conjugation with magnetic nanoparticles [32], liposomes [33], commercial imaging agents [34], micelles [35], bacteria [36], gold nanoparticles [37], polymer nanoparticles [38], and quantum dots [39]. In this study, T1 MR images of the tumor were used to investigate the enhanced tumor imaging of cRGD/FA-PAA-Gd2O3 nanoparticles compared with FA-PAA-Gd2O3 nanoparticles. In addition, T1 MR images of the aorta, kidneys, and liver were used to investigate the effect of cRGD in cRGD/FA-PAA-Gd2O3 nanoparticles on blood circulations as compared with FA-PAA-Gd2O3 nanoparticles.

2. Materials and Methods

2.1. Materials

Gadolinium(III) chloride hexahydrate (99.9%), sodium hydroxide (>99.9%), triethylene glycol (TEG) (99%), PAA (Mw = ~1800 amu), dimethyl sulfoxide (DMSO) (99.9%), N,N′-dicyclohexylcarbodiimide (DCC) (99%), 4-(dimethylamino) pyridine (DMAP) (>9%), tert-butyl N-(2-aminoethyl) carbamate (EDA-Boc) (>98%), triethylamine (TEA) (>99%), trifluoroacetic acid (TFA) (99%), N-hydroxysuccinimide (NHS) (98%), 1-ethyl-3 (3-dimethylaminopropyl) carbodiimide hydrochloride (EDC∙HCl) (97%), FA (>97%), Roswell Park Memorial Institute (RPMI)-1640, Dulbecco’s Modified Essential Medium (DMEM), sterile phosphate-buffered saline (PBS) solution, and dialysis tube (molecular weight cut-off (MWCO) = 1000 and 2000 amu) were procured from Sigma-Aldrich (St. Louis, MO, USA). cRGD (cRGDyk: Arg-Gly-Asp-D-Tyr-Lys) was procured from Vivitide (Gardner, MA, USA). Ethyl acetate (99.9%), chloroform (99.9%), and ethanol (99.99%) were purchased from Duksan (Ansan, Korea). All reagents and materials were used as received. Nanoparticles were initially washed with ethanol, then finally washed with triple-distilled water to prepare nanoparticle suspensions.

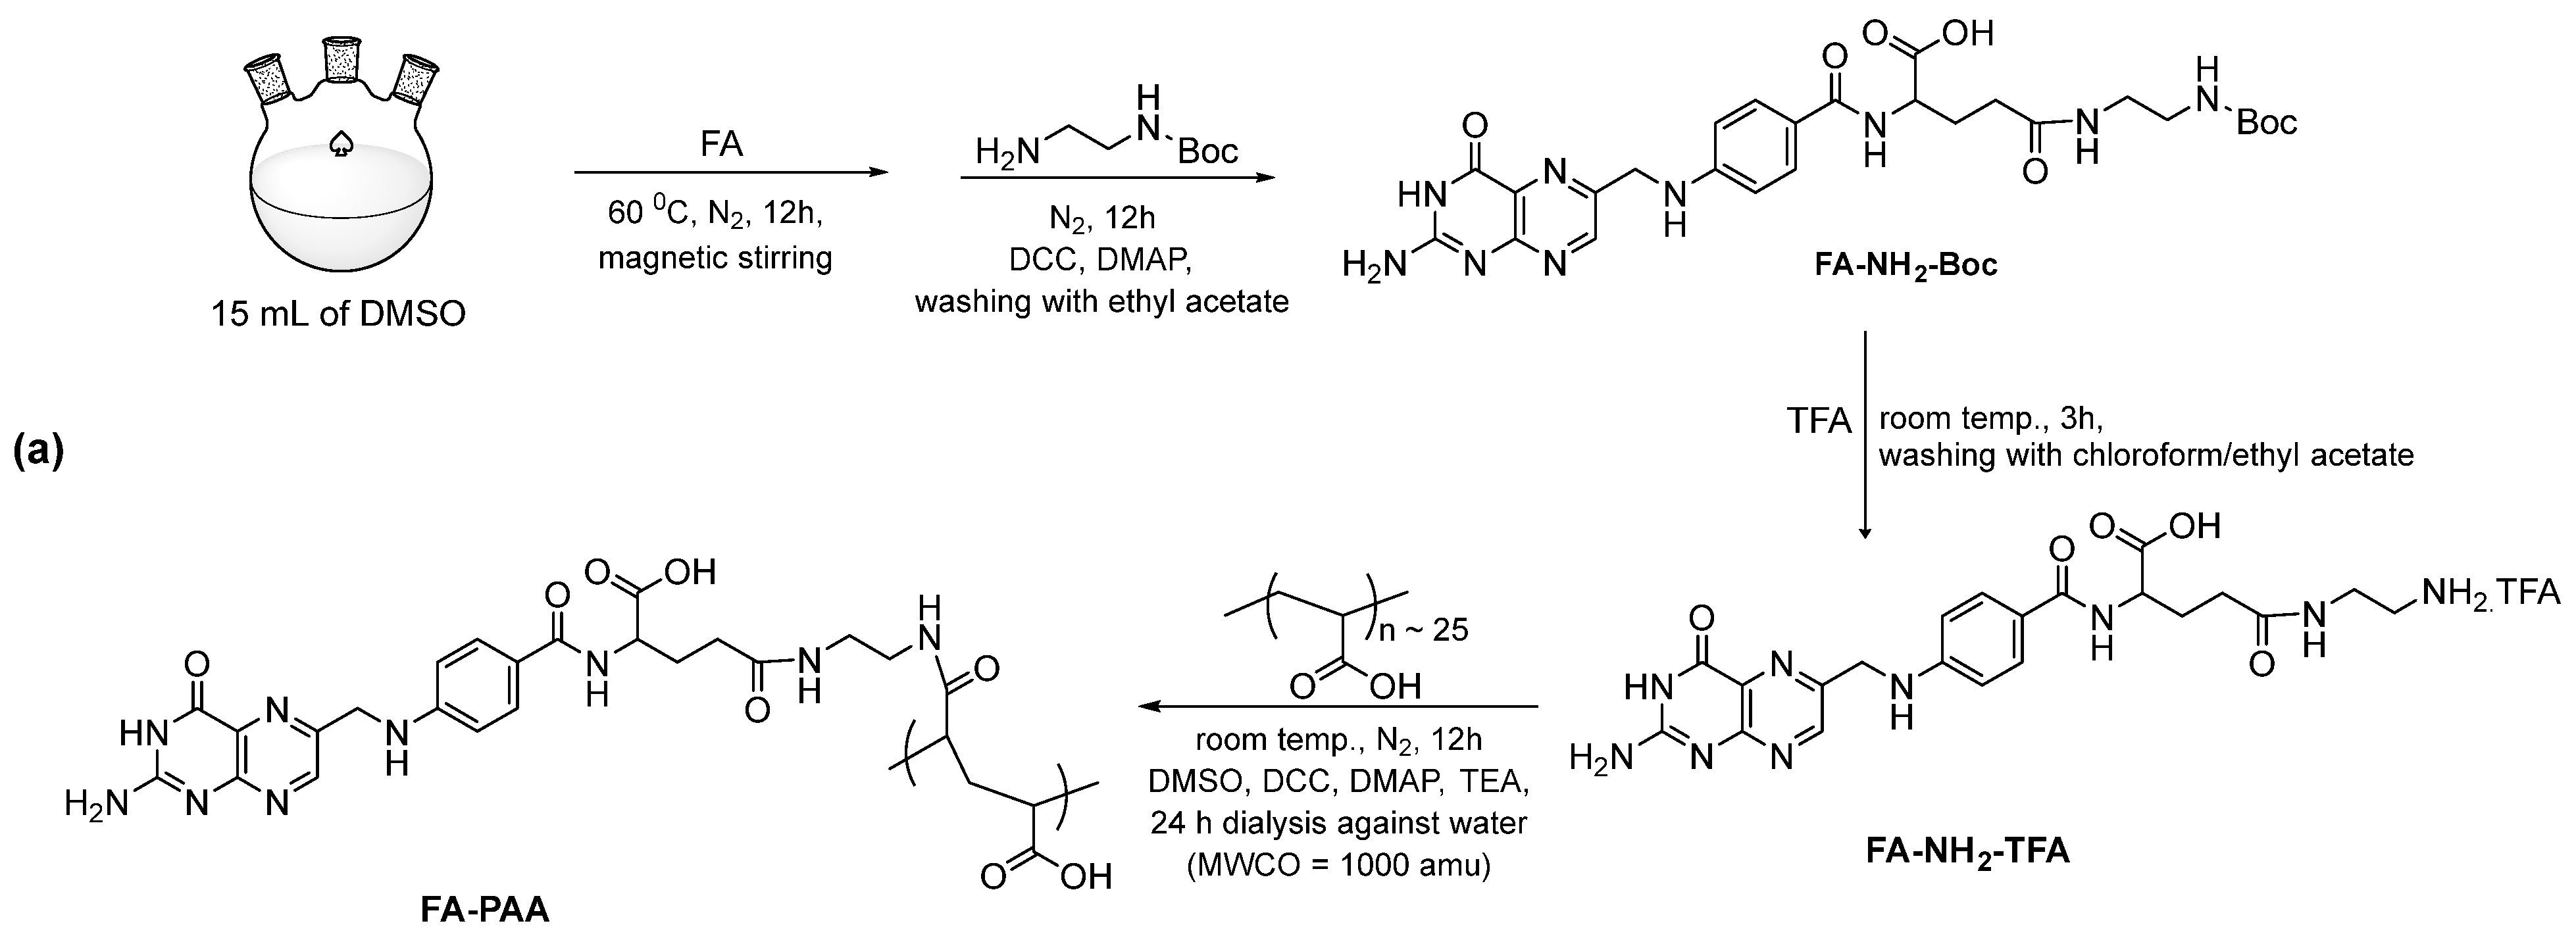
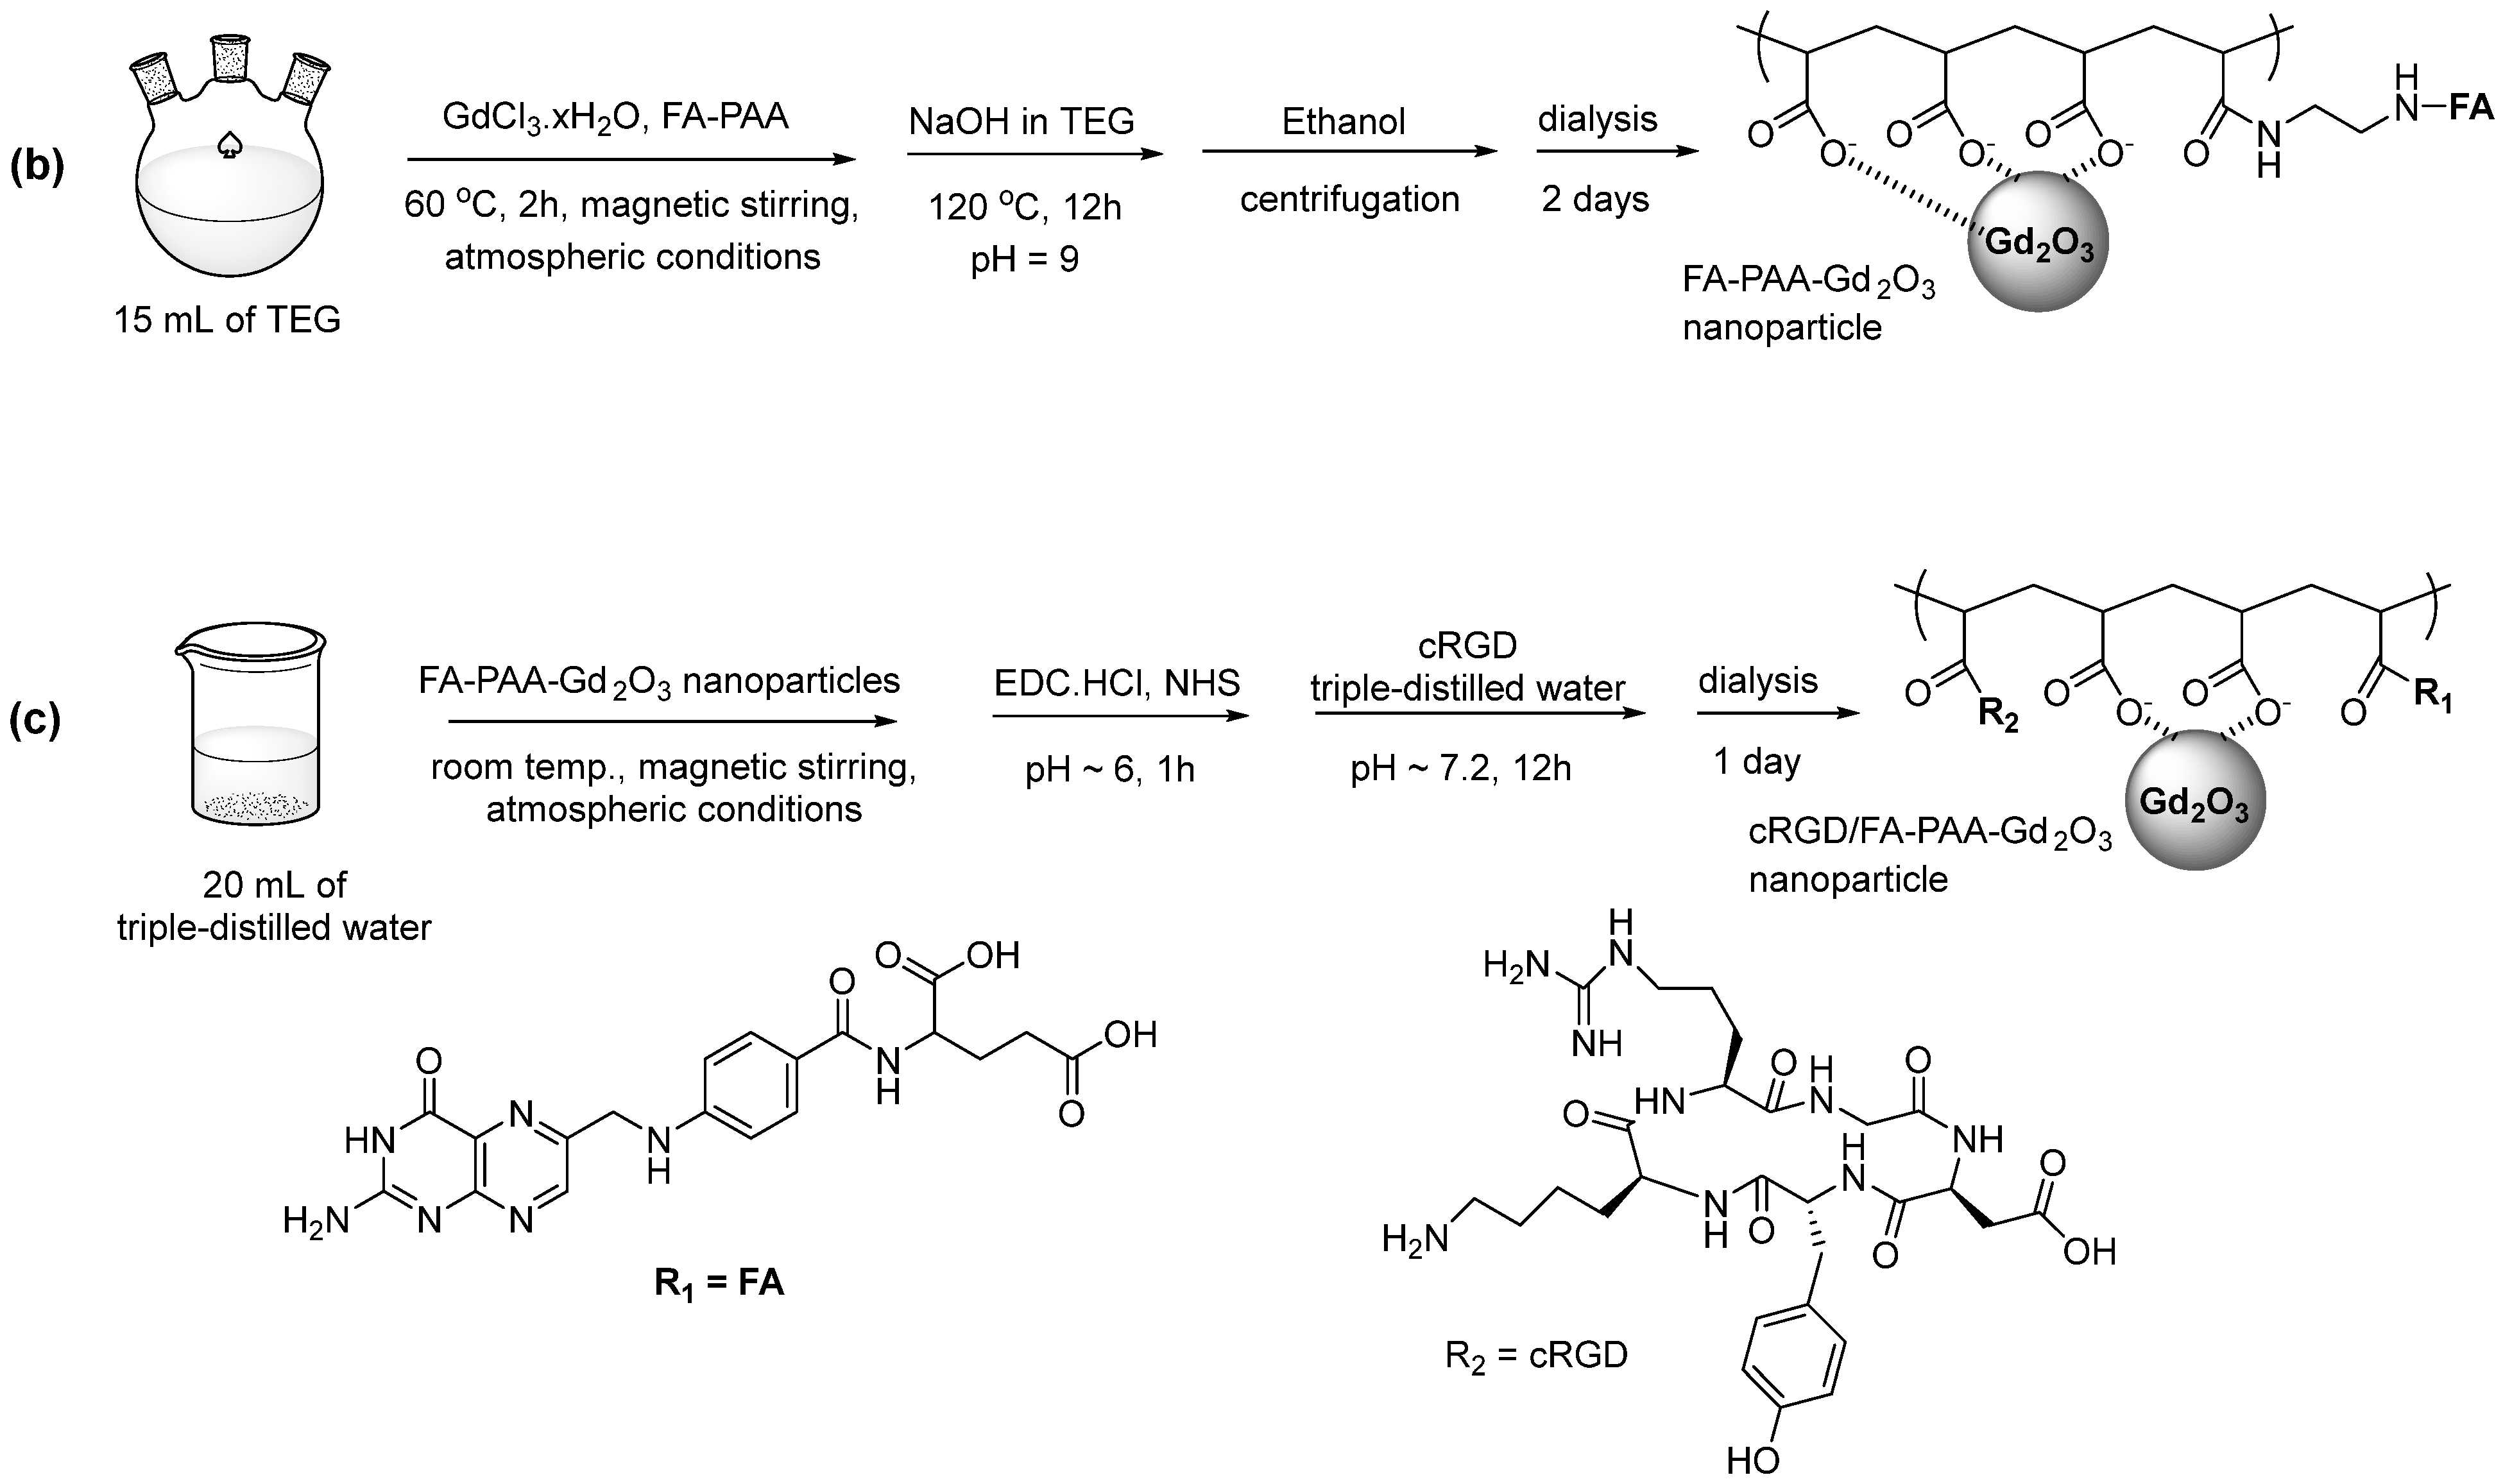
2.2. Preparation of FA-PAA-Gd2O3 Nanoparticles

FA-PAA was first prepared as described previously (Figure 1a) [40]. To obtain FA-NH2-Boc, 0.9 mmol FA was dissolved in DMSO (15 mL) in a 100-mL three-neck round-bottom flask at 60 °C under N2 flow with magnetic stirring. After the solution attained room temperature, 1.0 mmol DCC and 0.1 mmol DMAP were dissolved in the solution by magnetic stirring for 1 h. Next, 1.8 mmol EDA-Boc was dissolved in the solution by magnetic stirring for another 12 h. The resulting solution was slowly poured into cold ethyl acetate, and finally FA-EDA-Boc (yellow precipitate) was washed several times with ethyl acetate. Synthesis of FA-NH2-TFA was carried out by dissolving the yellow precipitate in 2 mL TFA in a 100-mL three-neck round-bottom flask with magnetic stirring for 3 h at room temperature. Chloroform was slowly poured into the solution until a yellow precipitate was obtained. Next, the clear solution was removed and precipitate was washed three times with ethyl acetate. The obtained FA-NH2-TFA was dried to powdered form using a rotary evaporator. To obtain FA-PAA, FA-NH2-TFA was dissolved in 5 mL DMSO containing 40 μL TEA with magnetic stirring. Separately, 1.5 mmol PAA was dissolved in DMSO (20 mL) under N2 flow at 60 °C in a 100-mL three-neck round-bottom flask with magnetic stirring. After the solution attained room temperature, 1.5 mmol DCC and 0.15 mmol DMAP were dissolved in the solution with continuous magnetic stirring for 1 h. Then, the above-prepared FA-NH2-TFA solution was slowly added to the PAA solution with continuous magnetic stirring for 12 h. The obtained solution was dialyzed against triple-distilled water for 24 h (MWCO = 1000 amu). The remaining solution inside the bag was filtered through Whatman filter paper (Sigma-Aldrich, USA) and evaporated using a rotary evaporator to collect FA-PAA (dark yellow solid).
FA-PAA-Gd2O3 nanoparticles were obtained using a one-pot polyol method (Figure 1b). Briefly, a mixture of 2.0 mmol GdCl3∙6H2O, 0.3 mmol of the above-synthesized FA-PAA, and 20 mL TEG was magnetically stirred in a three-neck round-bottom flask at 60 °C under atmospheric conditions to prepare a clear precursor solution. Next, NaOH (10 mmol) dissolved in 10 mL TEG was slowly poured into the precursor solution with magnetic stirring for 12 h at 120 °C until the pH reached ~9.0. Subsequently, the solution was cooled to room temperature and 400 mL ethanol was poured with magnetic stirring for ~30 min. FA-PAA-Gd2O3 nanoparticles were obtained by centrifugation (4000 rpm) and removing the supernatant. The nanoparticles were finally dispersed in ethanol, followed by centrifugation, and this step was repeated five times to remove TEG, free ions (Gd3+, Na+, and Cl), and unreacted FA-PAA. Finally, the product solution was dialyzed against triple-distilled water (MWCO = 2000 amu) for two days to remove any remaining impurities from the FA-PAA-Gd2O3 nanoparticles.

2.3. Preparation of cRGD/FA-PAA-Gd2O3 Nanoparticles

Three quarters of the synthesized FA-PAA-Gd2O3 nanoparticles, 1.0 mmol EDC∙HCl, and 1.0 mmol NHS were added to 20 mL triple-distilled water at room temperature under atmospheric conditions (Figure 1c). The solution pH was maintained at 6.0 by adding 1.0 M HCl with magnetic stirring at room temperature for 1 h. The solution pH was then increased to 7.2 by adding 1.0 M NaOH, followed by adding 50 mg cRGD. The resulting solution was stirred magnetically for 12 h followed by dialysis against triple-distilled water (MWCO = 1000 amu) for one day to remove free cross-linking agents and unreacted cRGD. A portion of the COOH groups in PAA was conjugated with Gd2O3 nanoparticles via hard acid (i.e., Gd3+) and hard base (i.e., COO) bonding, and a portion of the remainder was conjugated with NH2 groups of FA and cRGD via amide bonds.

2.4. Evaluation of Physicochemical Properties of the Nanoparticles

To measure the nanoparticle diameters, a high-resolution transmission electron microscope (HRTEM) (200 kV; FEI, Hillsboro, OR, USA; Titan G2 ChemiSTEM CS Probe) was used. The colloidal nanoparticles dispersed in aqueous media were dropped using a micropipette (2–20 μL, Eppendorf, Hamburg, Germany) onto a carbon film supported by a 200-mesh copper grid (Ted Pella Inc., Redding, CA, USA; Pelco No. 160) and air-dried at room temperature. Subsequently, the elements (C, N, O, and Gd) present in the nanoparticles were identified by an energy-dispersive X-ray spectroscope (EDS) (Bruker, Berlin, Germany; Quantax Nano) installed inside the HRTEM. To measure the Gd concentration in nanoparticle suspension, inductively coupled plasma–atomic emission spectroscopy (ICP-AES) (Thermo Jarrell Ash Co., Waltham, MA, USA; IRIS/AP) was used. The hydrodynamic diameters (a) and zeta potentials (ζ) of the nanoparticle colloids (0.01 mM Gd) were characterized using a dynamic light scattering (DLS) particle size analyzer (Malvern, Malvern, UK; Zetasizer Nano ZS). The nanoparticle structures in the powdered samples were characterized using an X-ray diffraction (XRD) machine (Philips, The Netherlands; X’PERT PRO MRD) with unfiltered CuKa (λ = 0.154184 nm) radiation; a scan range of 15–100° and a scanning step of 0.033° in 2θ were used. FT-IR absorption spectra (Mattson Instrument Inc., Madison, WI, USA; Galaxy 7020A) were taken using the powdered sample pellets with KBr to investigate PAA conjugation with nanoparticles, cRGD, and FA within 400–4000 cm−1. The surface-coating amount was quantified using a thermo-gravimetric analysis (TGA) instrument (TA Instrument, New Castle, DE, USA; SDT-Q600) between room temperature and 900 °C under air flow. The average amounts (in wt.%) of surface-coating ligands (FA-PAA and cRGD/FA-PAA) were obtained from the mass drops in TGA curves after considering water and air desorption between room temperature and ~105 °C. The amount of nanoparticles was obtained from the remaining mass followed by XRD analysis. Elemental analysis (EA) (ThermoFisher, Waltham, MA, USA; Flash 2000) was carried out to measure the composition (C/H/O/N) and amount of surface-coating ligands (in wt.%) using powdered samples.

2.5. In Vitro Cellular Cytotoxicity Assay

Normal mouse hepatocytes (NCTC1469) and human malignant glioma (U87MG) cell lines were cultured in DMEM and RPMI-1640 media, respectively. Cells (5 × 10⁴) were seeded into 24-well plates (500 μL cells/well) and incubated for 24 h in 5% CO2 at 37 °C. The concentrated nanoparticle suspension was diluted with sterile PBS solution to prepare five test concentrations. Subsequently, 2 μL aliquots were added to the cells to obtain 10, 50, 100, 200, and 500 μM Gd concentrations, followed by 48 h incubation. Next, 200 μL CellTiter-Glo reagent was added for cell lysis and the reaction was incubated on an orbital shaker for 30 min. The cellular cytotoxicity of the nanoparticle suspension samples was measured using a CellTiter-Glo Luminescent Cell Viability Assay (Promega, Madison, WI, USA) according to the manufacturer’s instructions. Intracellular adenosine triphosphate was quantified using a Victor 3 luminometer (Perkin Elmer, Waltham, MA, USA) in the 300–700 nm wavelength range. Cell viability was measured in triplicate to obtain average values, which were normalized to those of the untreated control cells (0.0 mM Gd).

2.6. Water Proton Spin Relaxivity and Map Image Measurements

The concentrated nanoparticle suspension was diluted with triple-distilled water to prepare various concentrations (1, 0.5, 0.25, 0.125, and 0.0625 mM Gd), which were subject to analysis of the longitudinal (T1) and transverse (T2) water proton spin relaxation times and longitudinal (R1) and transverse (R2) map images using a 3.0 T MRI scanner (Siemens, Munich, Germany; Magnetom Trio Tim). Next, inverse relaxation times (1/T1 and 1/T2) were plotted as a function of Gd concentration to estimate the r1 and r2 values from the corresponding slopes. An inversion recovery method was used to measure the T1 relaxation times by recording MR images at 35 different inversion times (TI) in the range of 50–1750 ms. The T1 values were estimated from nonlinear least-square fits to the mean signal intensities at various TI values. To measure T2 relaxation times, the Carr–Purcell–Meiboom–Gill pulse sequence was used for multiple spin-echo measurements. The MR images were obtained at 16 different echo time (TE) values in the range of 10–190 ms. The T2 values were estimated from the nonlinear least-square fits to the mean signal intensities of the multiple spin-echo measurements at various TE values. The following parameters were used for measurements: MR field (H) = 3.0 T, temperature (T) = 22 °C, repetition time (TR) = 2000 ms, field of view (FOV) = 16 cm, FOV phase = 0.5, slice thickness = 5 mm, number of acquisitions (NEX) = 1, pixel spacing = 0.625 mm, pixel band width = 122.10 Hz, and matrix size = 256 × 128.

2.7. Preparation of Murine Tumor Model

U87MG tumor cells were cultured in RPMI-1640 containing 10% (v/v) fetal bovine serum and 1% (v/v) penicillin streptomycin for 24 h in 5% CO2 at 37°. Six 5-week-old male BALB/c nude mice (~20 g) were injected subcutaneously with U87MG tumor cells (5 × 10⁶ cells/100 μL of PBS) in the left rump tissue, and MRI experiments were carried out after three weeks.

2.8. In Vivo T1 MR Image Measurements

Mice were anesthetized using 1.5% isoflurane in oxygen. Measurements were taken before and after injecting the two forms of aqueous nanoparticle suspensions (approximately 0.1 mmol Gd/kg) into the tail veins of mice (N = 3 each group). A warm water blanket was used to maintain the body temperature at 37 °C during measurements. The slight breathing movements of mice, even under anesthesia, were fixed using a small animal sleeve. In addition, the mice were wrapped with a band around their abdomens to minimize abdominal movements. After the measurements, the mice were revived from anesthesia and placed in cages with free access to food and water. Radio frequency-spoiled T1-weighted gradient-recalled echo (GRE) sequences were used for obtaining images. The experimental parameters were as follows: H = 3.0 T, T = 37 °C, TE = 7 ms, TR = 850 ms, pixel band width = 15.63 Hz, frequency = 256 Hz, phase = 256, NEX = 3, FOV = 60 mm, FOV phase = 1, slice thickness = 1.0 mm, number of slices = 24, and spacing gap = 1.1 mm. The signal-to noise ratio (SNR) was defined as the ratio of mean signal intensity of the anatomical region of interest (ROI) to that of the background noise. The T1-contrast ROI was defined as SNR (t)/SNR (0), with t the time after injection and 0 the time before injection.

3. Results

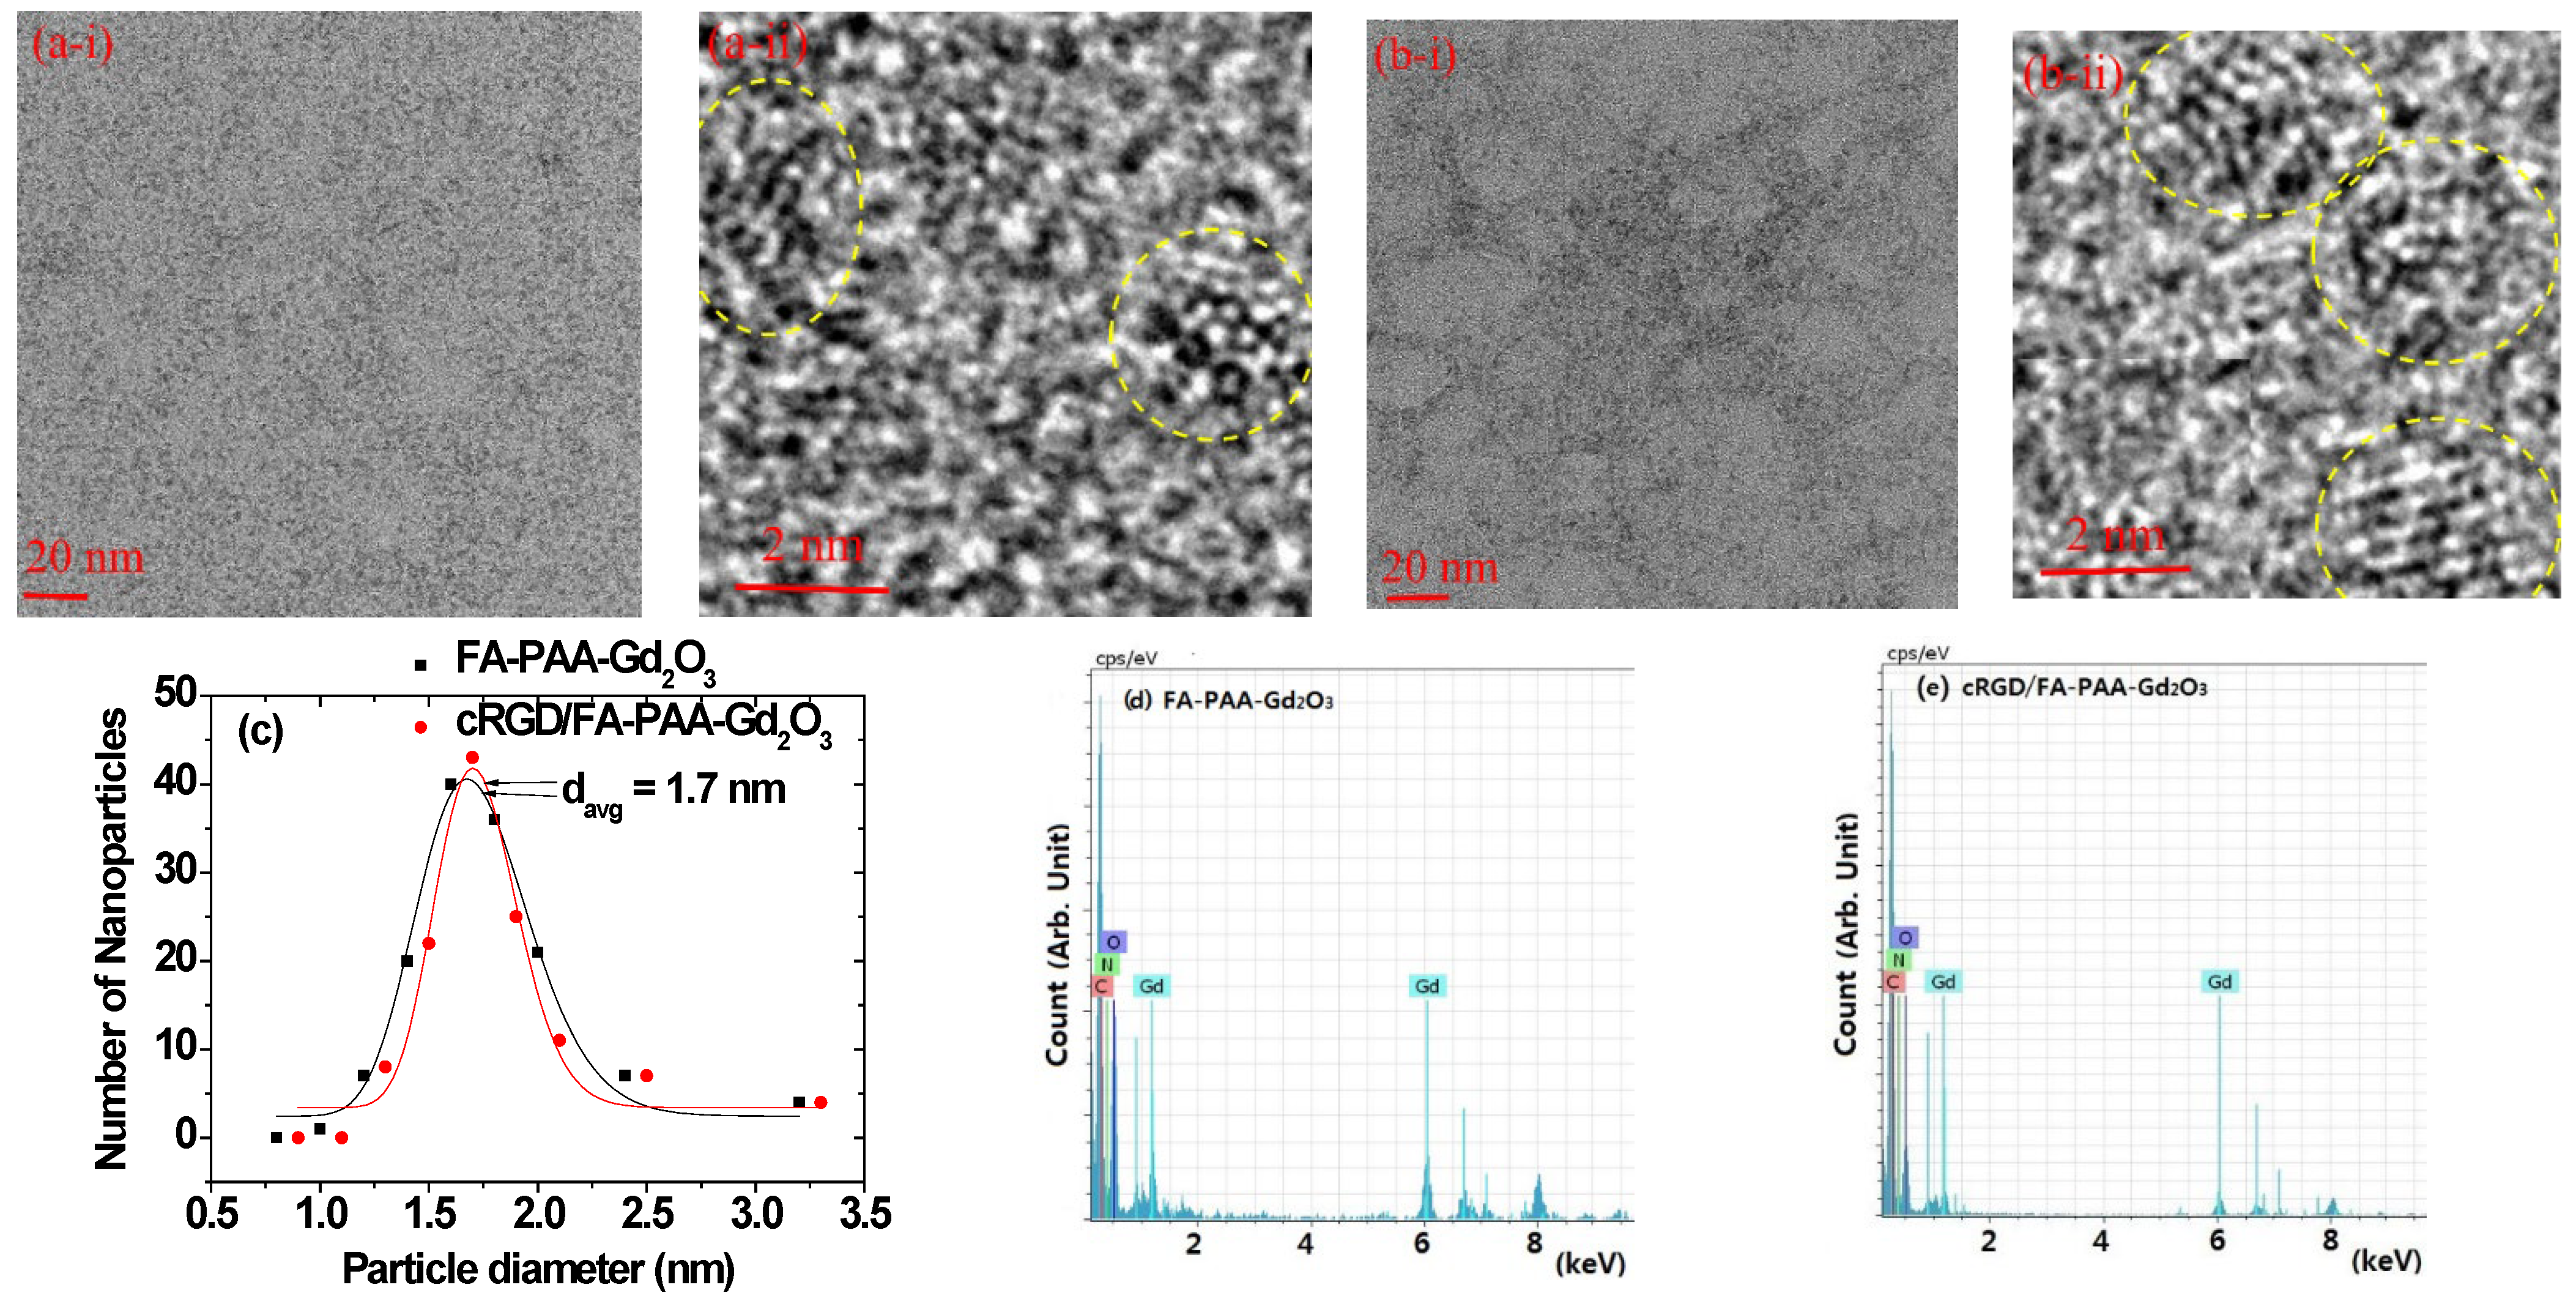
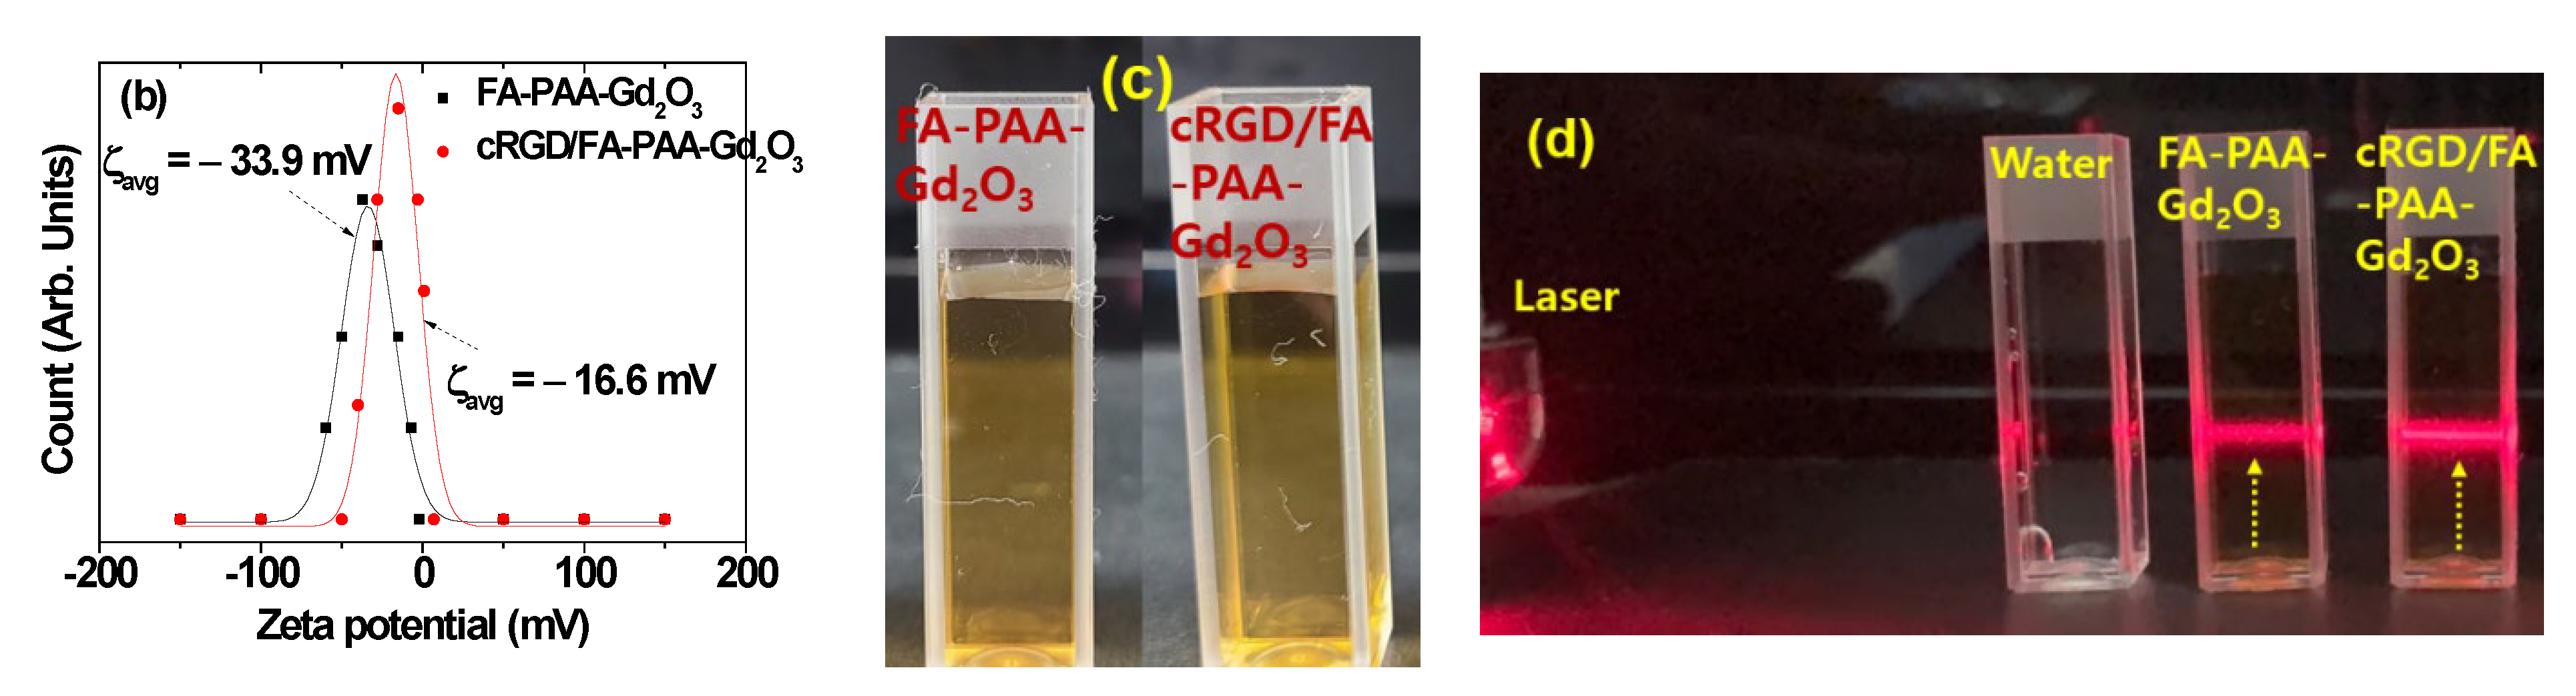
3.1. Physicochemical Properties of FA-PAA-Gd2O3 and cRGD/FA-PAA-Gd2O3 Nanoparticles

The FA-PAA-Gd2O3 (Figure 2(a-i,a-ii)) and cRGD/FA-PAA-Gd2O3 nanoparticles (Figure 2(b-i,b-ii)) were nearly monodispersed and ultrasmall, with diameters ranging from 1.5–3.0 nm. The average particle diameters (davg) of FA-PAA-Gd2O3 and cRGD/FA-PAA-Gd2O3 were 1.7 nm, as estimated from log-normal function fits to the observed particle diameter distributions (Figure 2c). The EDS spectra confirmed the presence of Gd, C, N, and O in the nanoparticles (Figure 2d,e). The observed values are listed in Table 1.
The hydrodynamic diameters (aavg) of FA-PAA-Gd2O3 and cRGD/FA-PAA-Gd2O3 nanoparticles dispersed in aqueous media and physiological solution (0.9 NaCl wt.% in water) were measured to be 11.4 and 13.8 nm, respectively, by their DLS patterns (Figure 3(a-i,a-ii)) using log-normal function fits to the observed hydrodynamic diameter distributions (Table 1). DLS patterns were measured three times. Similar hydrodynamic diameters were observed for both samples at all times, indicating the presence of stable colloids in aqueous and physiological solutions. PAA contains a large number of hydrophilic COOH groups; therefore, the FA-PAA-Gd2O3 and cRGD/FA-PAA-Gd2O3 nanoparticles can attract a large number of water molecules, which explains the observed large aavg values and excellent colloidal stability. Moreover, the cRGD/FA-PAA-Gd2O3 nanoparticles had a higher aavg value than the FA-PAA-Gd2O3 nanoparticles due to the additional cRGDs in their surface-coating layers. Additionally, the lesser number of free COO groups in the cRGD/FA-PAA-Gd2O3 nanoparticles resulted in their lower zeta potential (ζ; −16.6 mV) than that (−33.9 mV) of the FA-PAA-Gd2O3 nanoparticles (Figure 3b and Table 1). As shown in Figure 3c, the aqueous nanoparticle suspensions exhibited excellent colloidal stability (i.e., no precipitation after synthesis for >1 year). The dispersion of nanoparticle colloids in aqueous media was confirmed by the Tyndall effect (Figure 3d); laser light scattering was observed only in nanoparticle suspension samples (two cuvettes on the right), unlike in triple-distilled water (left cuvette).

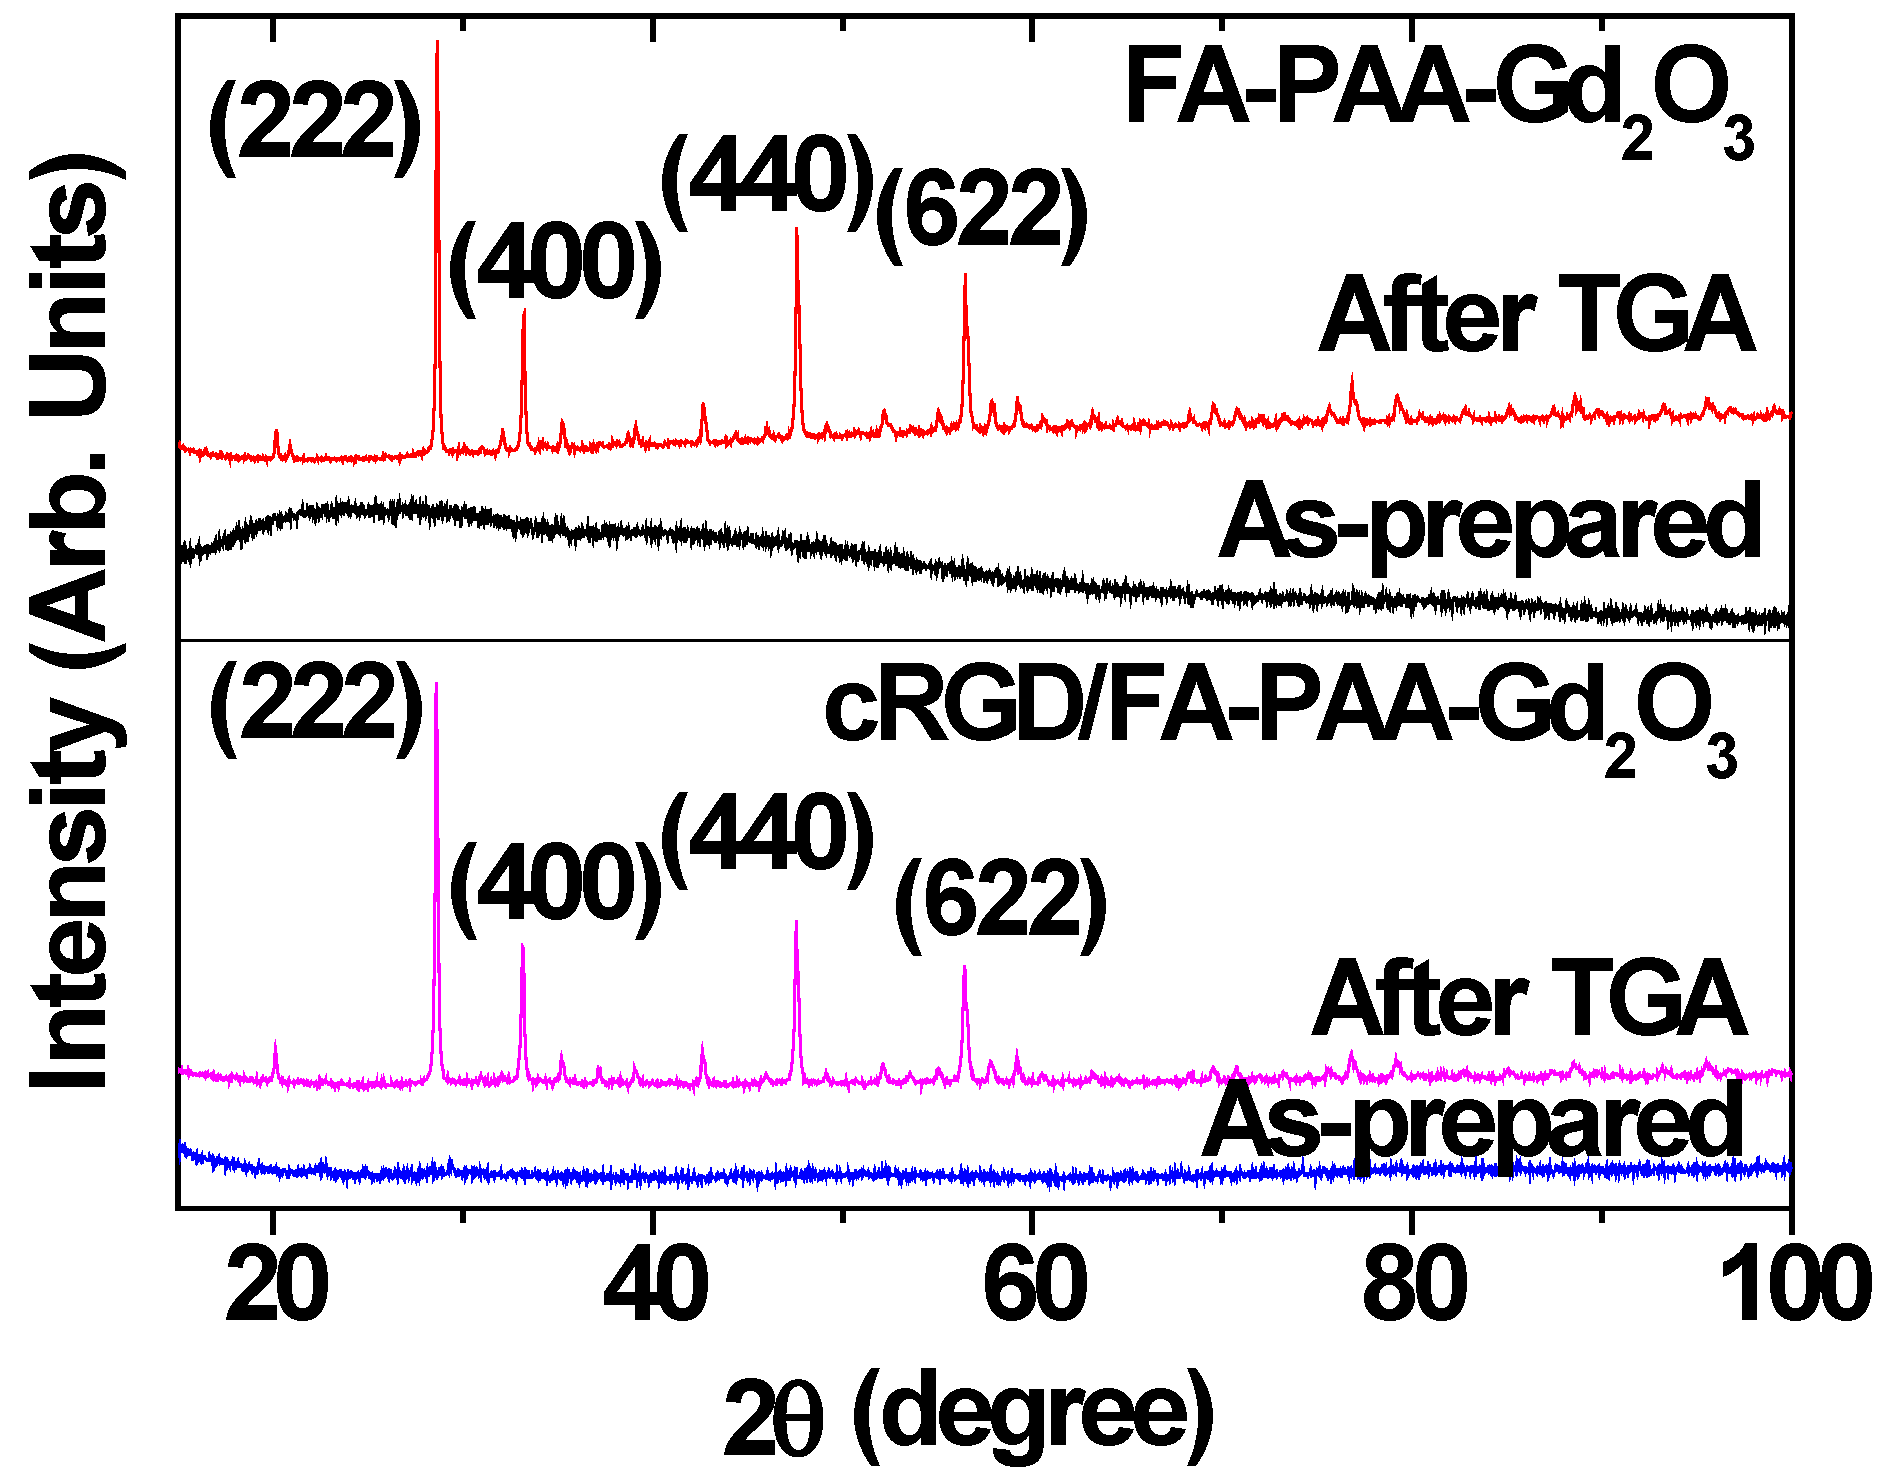
3.2. Crystal Structures of the Nanoparticles

The XRD patterns of FA-PAA-Gd2O3 and cRGD/FA-PAA-Gd2O3 nanoparticles were recorded before and after TGA (Figure 4). Prior to TGA, the nanoparticles were not fully crystallized owing to their ultrasmall particle size, resulting in broad amorphous XRD patterns [41]. However, crystal growth during TGA up to 900 °C led to sharp peaks of body-centered cubic (bcc) Gd2O3 [42]. Moreover, the powdered samples subjected to TGA showed a lattice constant of 10.814 Å, which is consistent with the reported value (10.813 Å) [42].

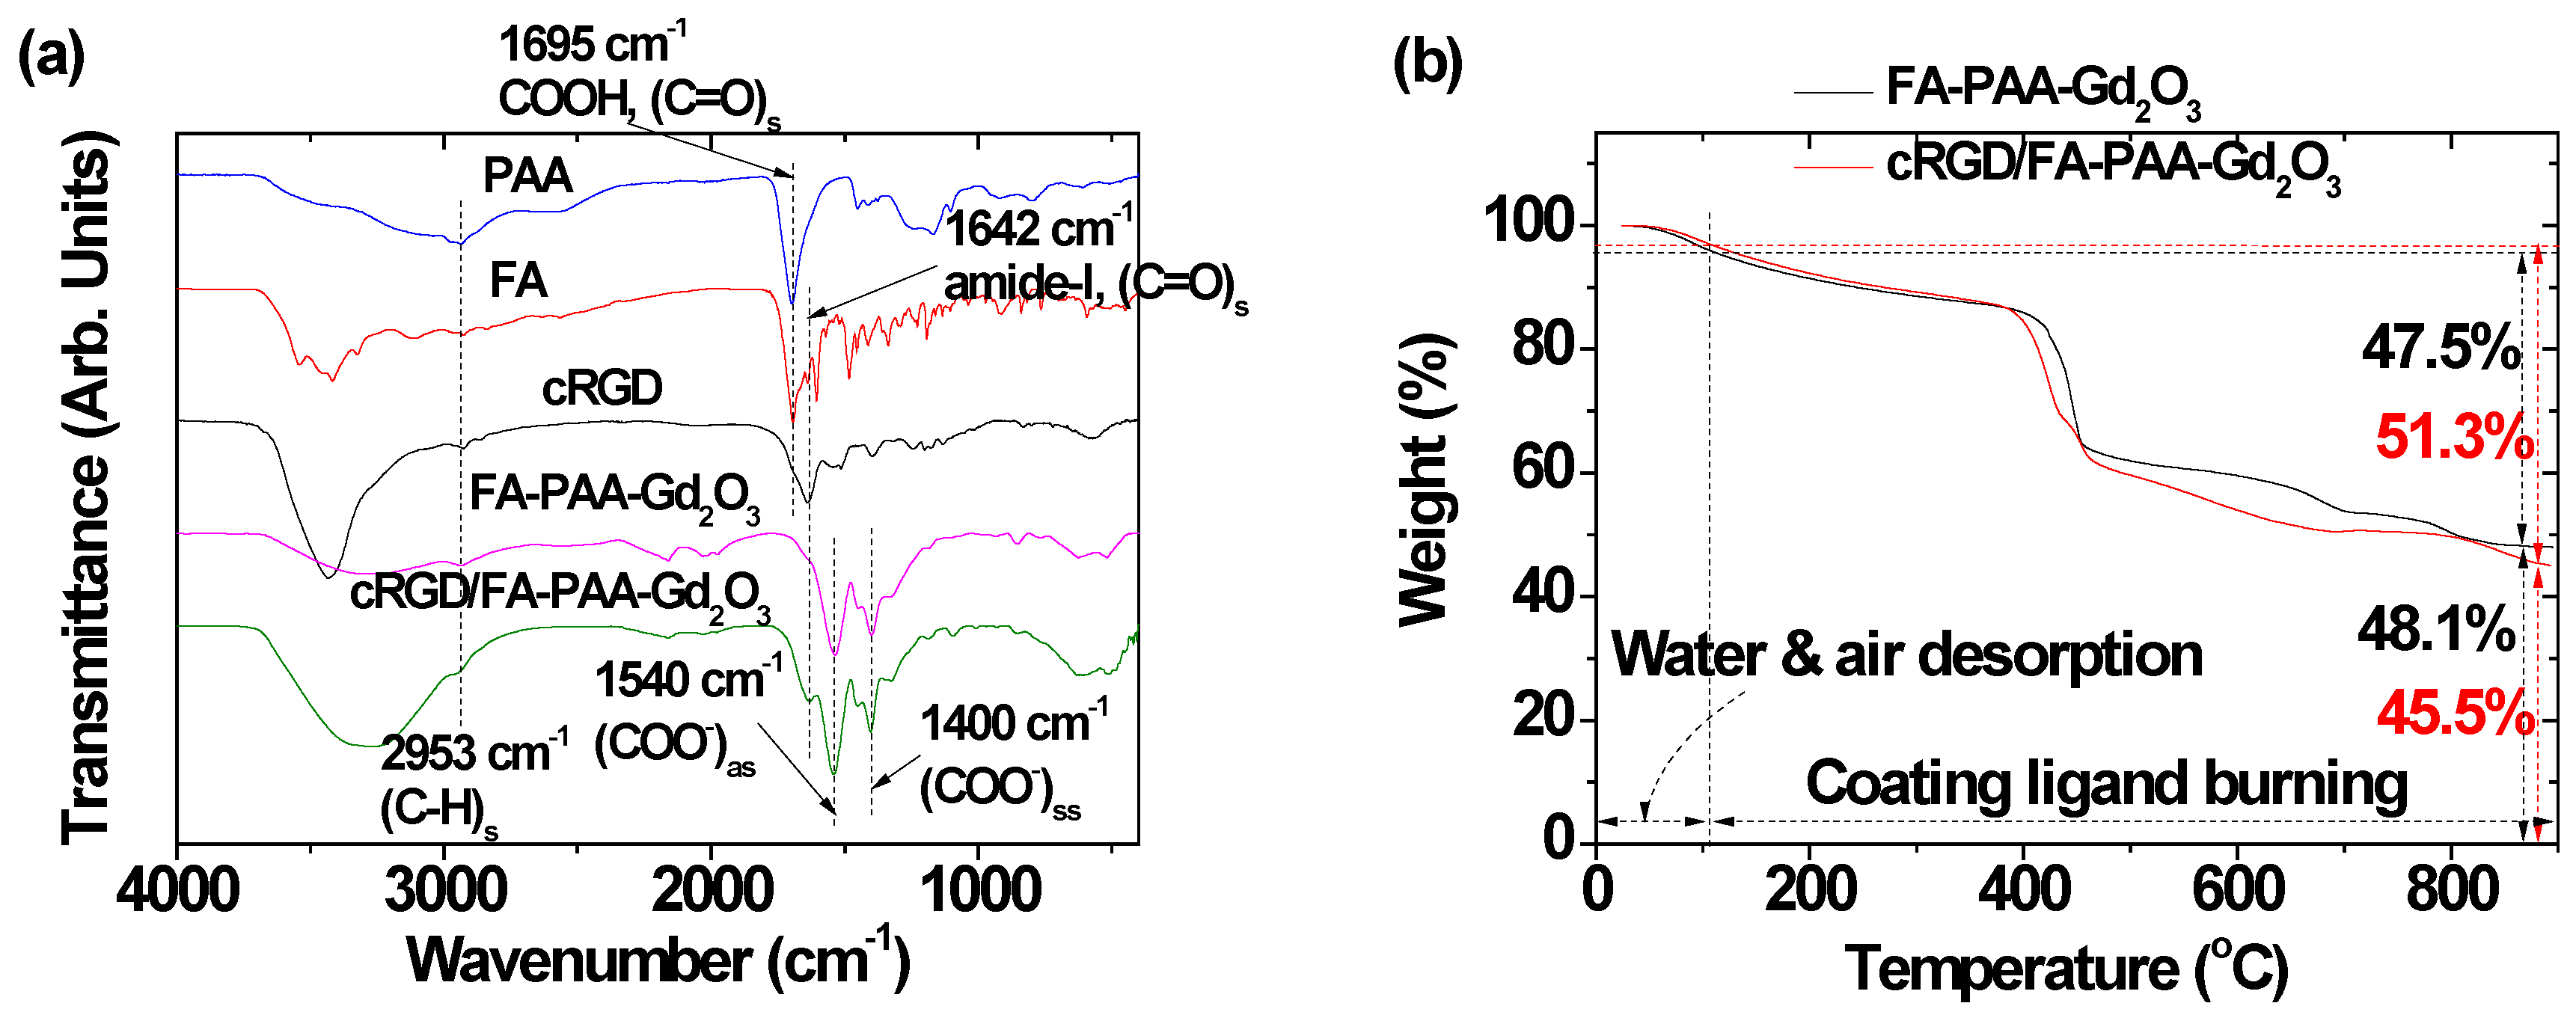
3.3. Surface Coatings

The surface coating of ultrasmall Gd2O3 nanoparticles with FA-PAA and cRGD/FA-PAA was supported by FT-IR absorption spectra (Figure 5a). The C=O stretching vibration of the COOH groups of PAA at 1695 cm−1 exhibited red-shift and split into COO antisymmetric and symmetric stretching vibrations at 1540 and 1400 cm−1, respectively [43], confirming the successful coating of PAA on the ultrasmall Gd2O3 nanoparticle surface. The red-shift and split resulted from the hard acid–base bonding between the COO (hard base) of PAA and Gd3+ (hard acid) of the Gd2O3 nanoparticles [44]. Additionally, the C–H stretching vibrations of PAA, FA, and cRGDs at ~2953 cm−1 were observed in the FT-IR absorption spectra of FA-PAA-Gd2O3 and cRGD/FA-PAA-Gd2O3 nanoparticles, supporting the presence of these ligands in the nanoparticles. Amide-I C=O stretching vibration of FA and cRGD (at 1642 cm−1) [45,46] was observed as well, confirming the successful conjugation of NH2 groups of FA and cRGD with the COOH groups of PAA.
The surface-coating amount (P; in wt.%) was obtained by TGA. As shown in Figure 5b, the p values were 47.5 and 51.3% for FA-PAA-Gd2O3 and cRGD/FA-PAA-Gd2O3 nanoparticles (Table 1), respectively, as determined by the mass loss after taking into account water and air desorption between room temperature and ~105 °C. The remaining mass was ascribed to Gd2O3 nanoparticles (Figure 5b and Table 1). The cRGD/FA-PAA-Gd2O3 nanoparticles had a higher p than that of the FA-PAA-Gd2O3 nanoparticles due to additional cRGDs in their structure. Based on the EA, p values were 52.4 and 56.8% for FA-PAA-Gd2O3 and cRGD/FA-PAA-Gd2O3 nanoparticles, respectively, as determined by adding the C/H/O/N atomic wt.%, i.e., 22.57/3.48/25.01/1.32 and 24.44/3.75/25.86/2.76, respectively. These values were slightly higher than those estimated by TGA because the water and air content in the samples could not be eliminated from the measured wt.% in EA. The estimated wt.% difference (i.e., 3.8% by TGA and 4.4% by EA, for an average of 4.1%) between cRGD/FA-PAA-Gd2O3 and FA-PAA-Gd2O3 nanoparticles represented the wt.% of cRGD. Assuming that the PAA/FA molar ratio of 1.5/0.9 used in FA-PAA synthesis was maintained in the nanoparticle samples, the wt.% of cRGD/FA/PAA was estimated as 4.1/6.8/45.9. Based on the bulk density of Gd2O3 (7.407 g/cm3) [47], p values estimated from TGA and EA, average mass of FA-PAA (2064 g) and cRGD/FA-PAA (2225 g) obtained using the above-estimated ligand wt.% ratio, and davg value determined by HRTEM imaging, the grafting density (σ, i.e., the average number of FA-PAA and cRGD/FA-PAA coating a Gd2O3 nanoparticle unit surface area) [48] was found to be 0.6–0.7 nm−2. By multiplying σ with the Gd2O3 nanoparticle surface area (πdavg2), the average number (NNP) of FA-PAA and cRGD/FA-PAA coating each Gd2O3 nanoparticle was found to be 6–7. The surface-coating results are listed in Table 1.

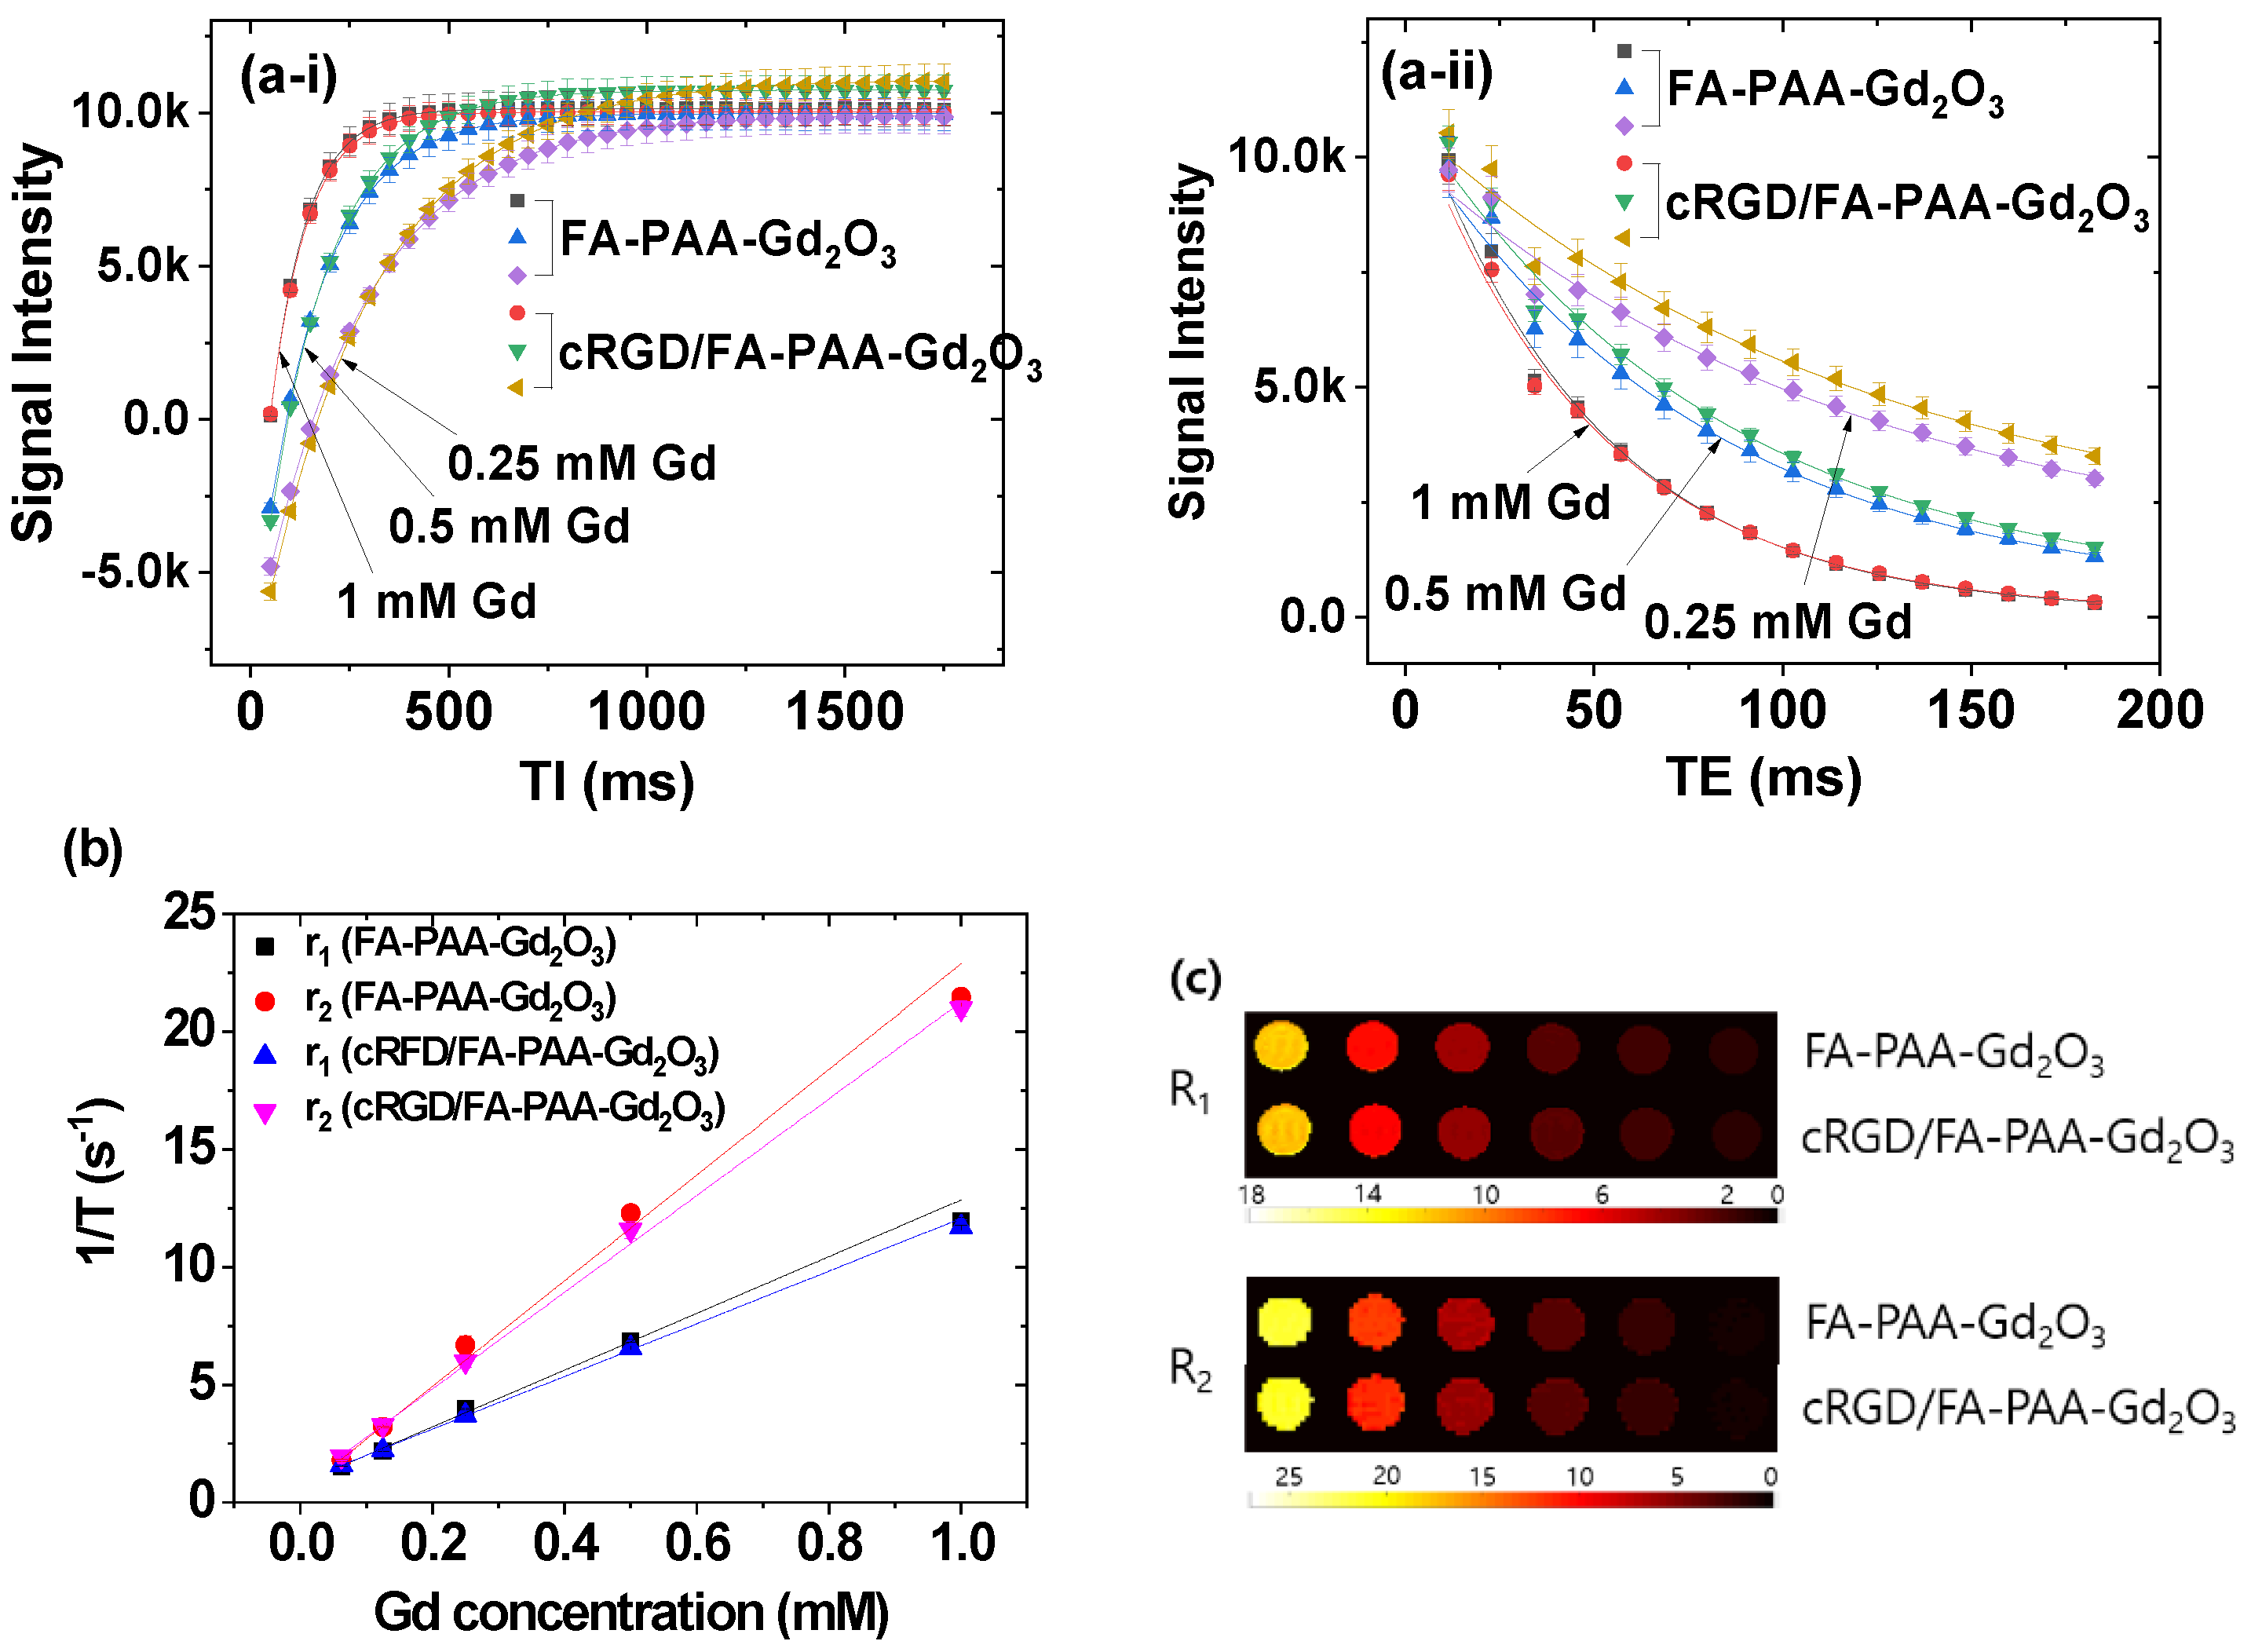
3.4. r1, r2 Values and R1, R2 Map Images

To investigate the potential of the synthesized FA-PAA-Gd2O3 and cRGD/FA-PAA-Gd2O3 nanoparticles as T1 MRI contrast agents, T1 and T2 relaxation times were measured at various Gd concentrations at 3.0 T MR field and 22 °C. For 0.25, 0.5, and 1.0 mM Gd, non-linear curve fits to obtain the T1 and T2 relaxation times are provided in Figure 6(a-i,a-ii), respectively. Subsequently, 1/T1 and 1/T2 inverse relaxation times were plotted as a function of Gd concentration to obtain r1 and r2 values from the corresponding slopes (Figure 6b and Table 2). As shown in Table 2, the estimated r1 values were approximately four times higher than those of commercial Gd-chelates [49]. In addition, the synthesized nanoparticles exhibited dose-dependent contrast changes in R1 and R2 map images (Figure 6c). Considering that the r2/r1 ratios were close to 1, these results indicate that the synthesized nanoparticles could act as high-performance T1 MRI contrast agents.
The r2/r1 ratio is greater than 1 because longitudinal relaxation accompanies transverse relaxation, whereas the reverse is not feasible. Therefore, r2/r1 ratios close to 1 and as large as possible are ideal for T1 and T2 MRI contrast agents, respectively. Therefore, Gd-chelates and iron oxide nanoparticles are suitable for use as T1 and T2 MRI contrast agents, respectively. Similarly, FA-PAA-Gd2O3 and cRGD/FA-PAA-Gd2O3 nanoparticles are potential T1 MRI contrast agents, as their r2/r1 ratios are close to 1.

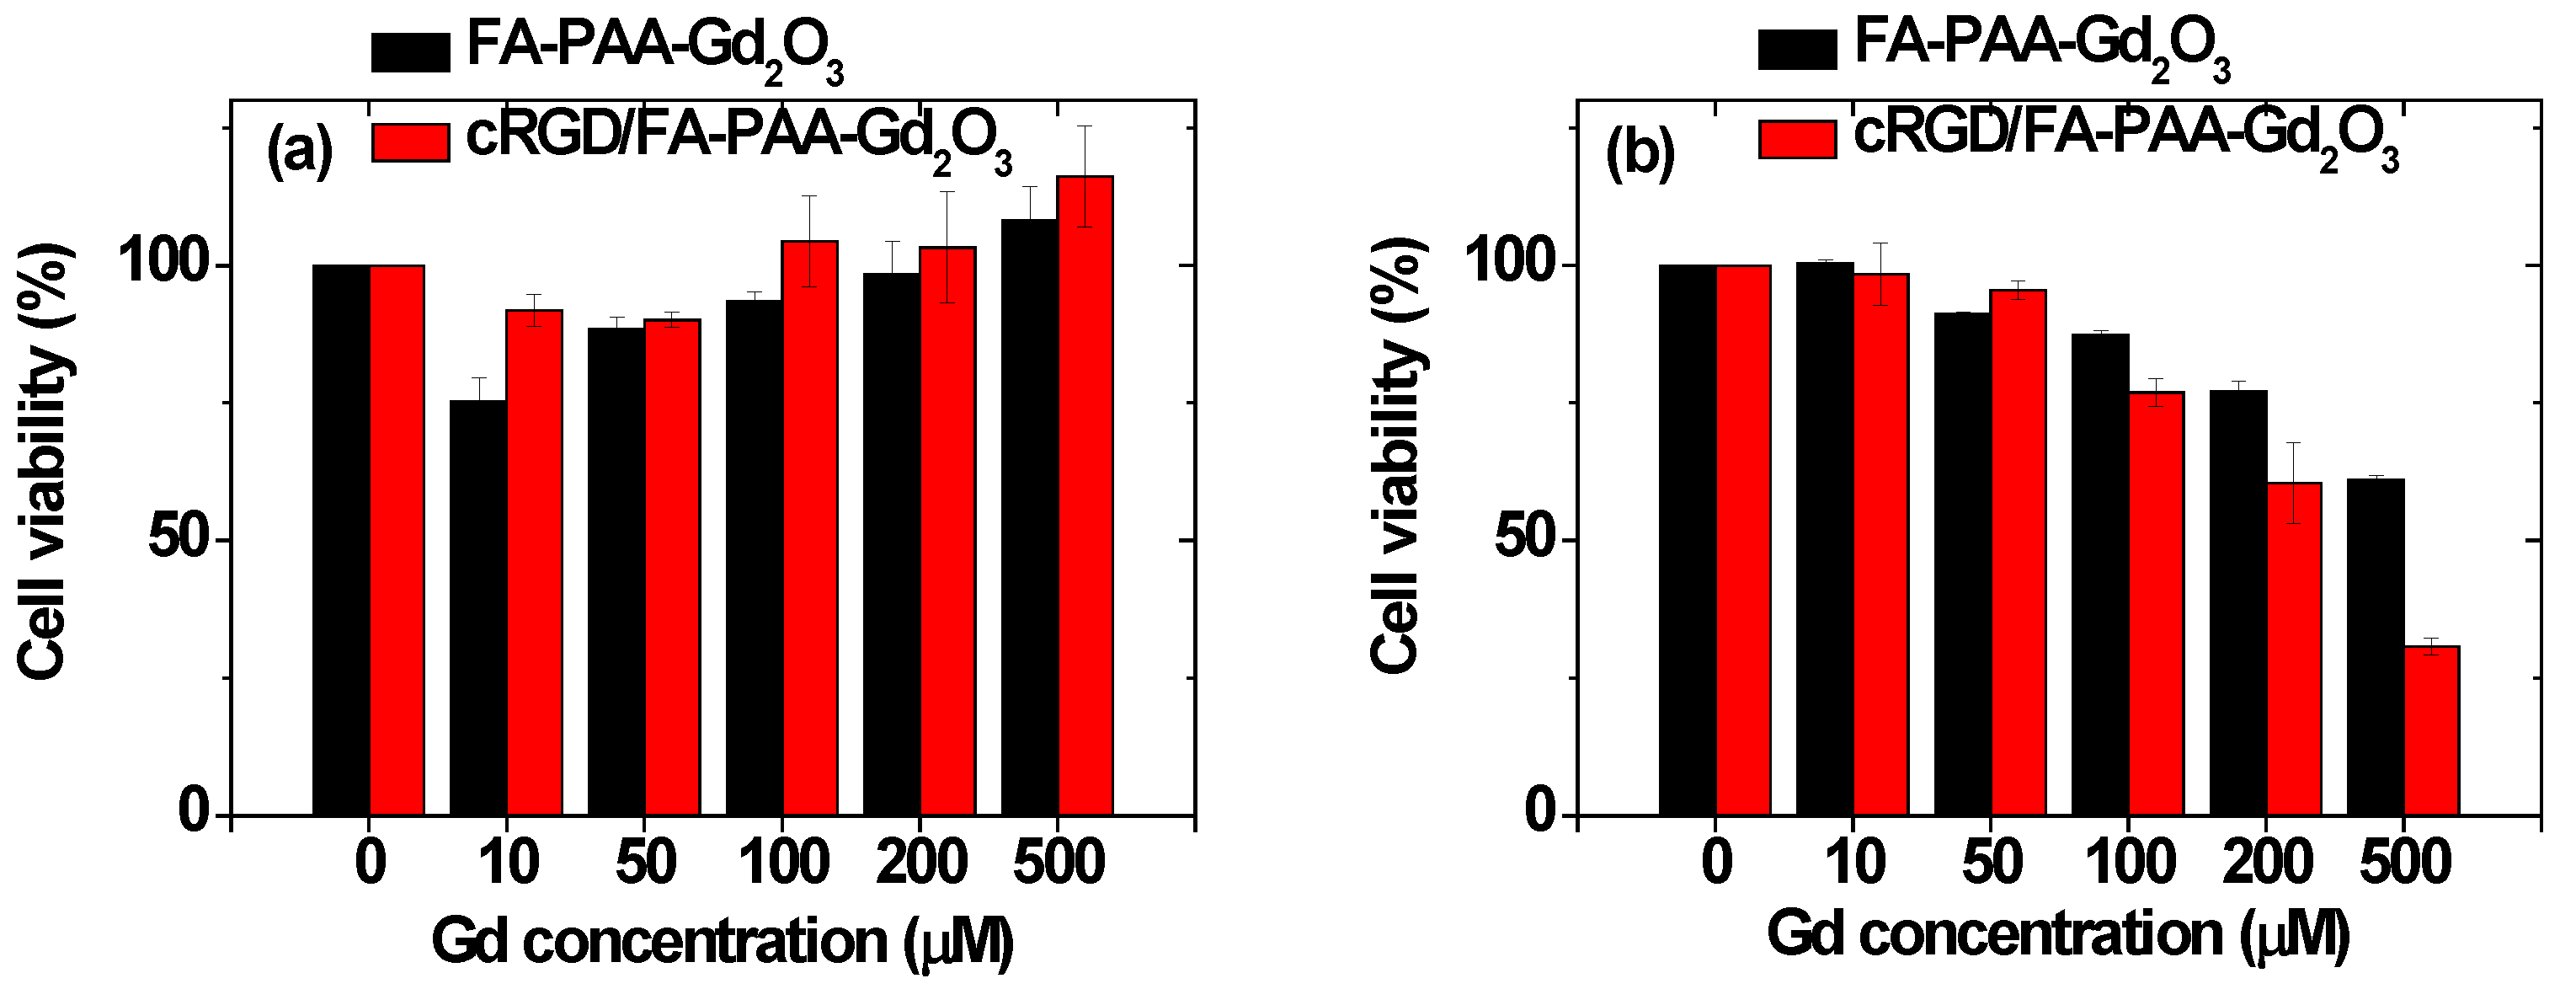
3.5. Cellular Toxicity of the Nanoparticles
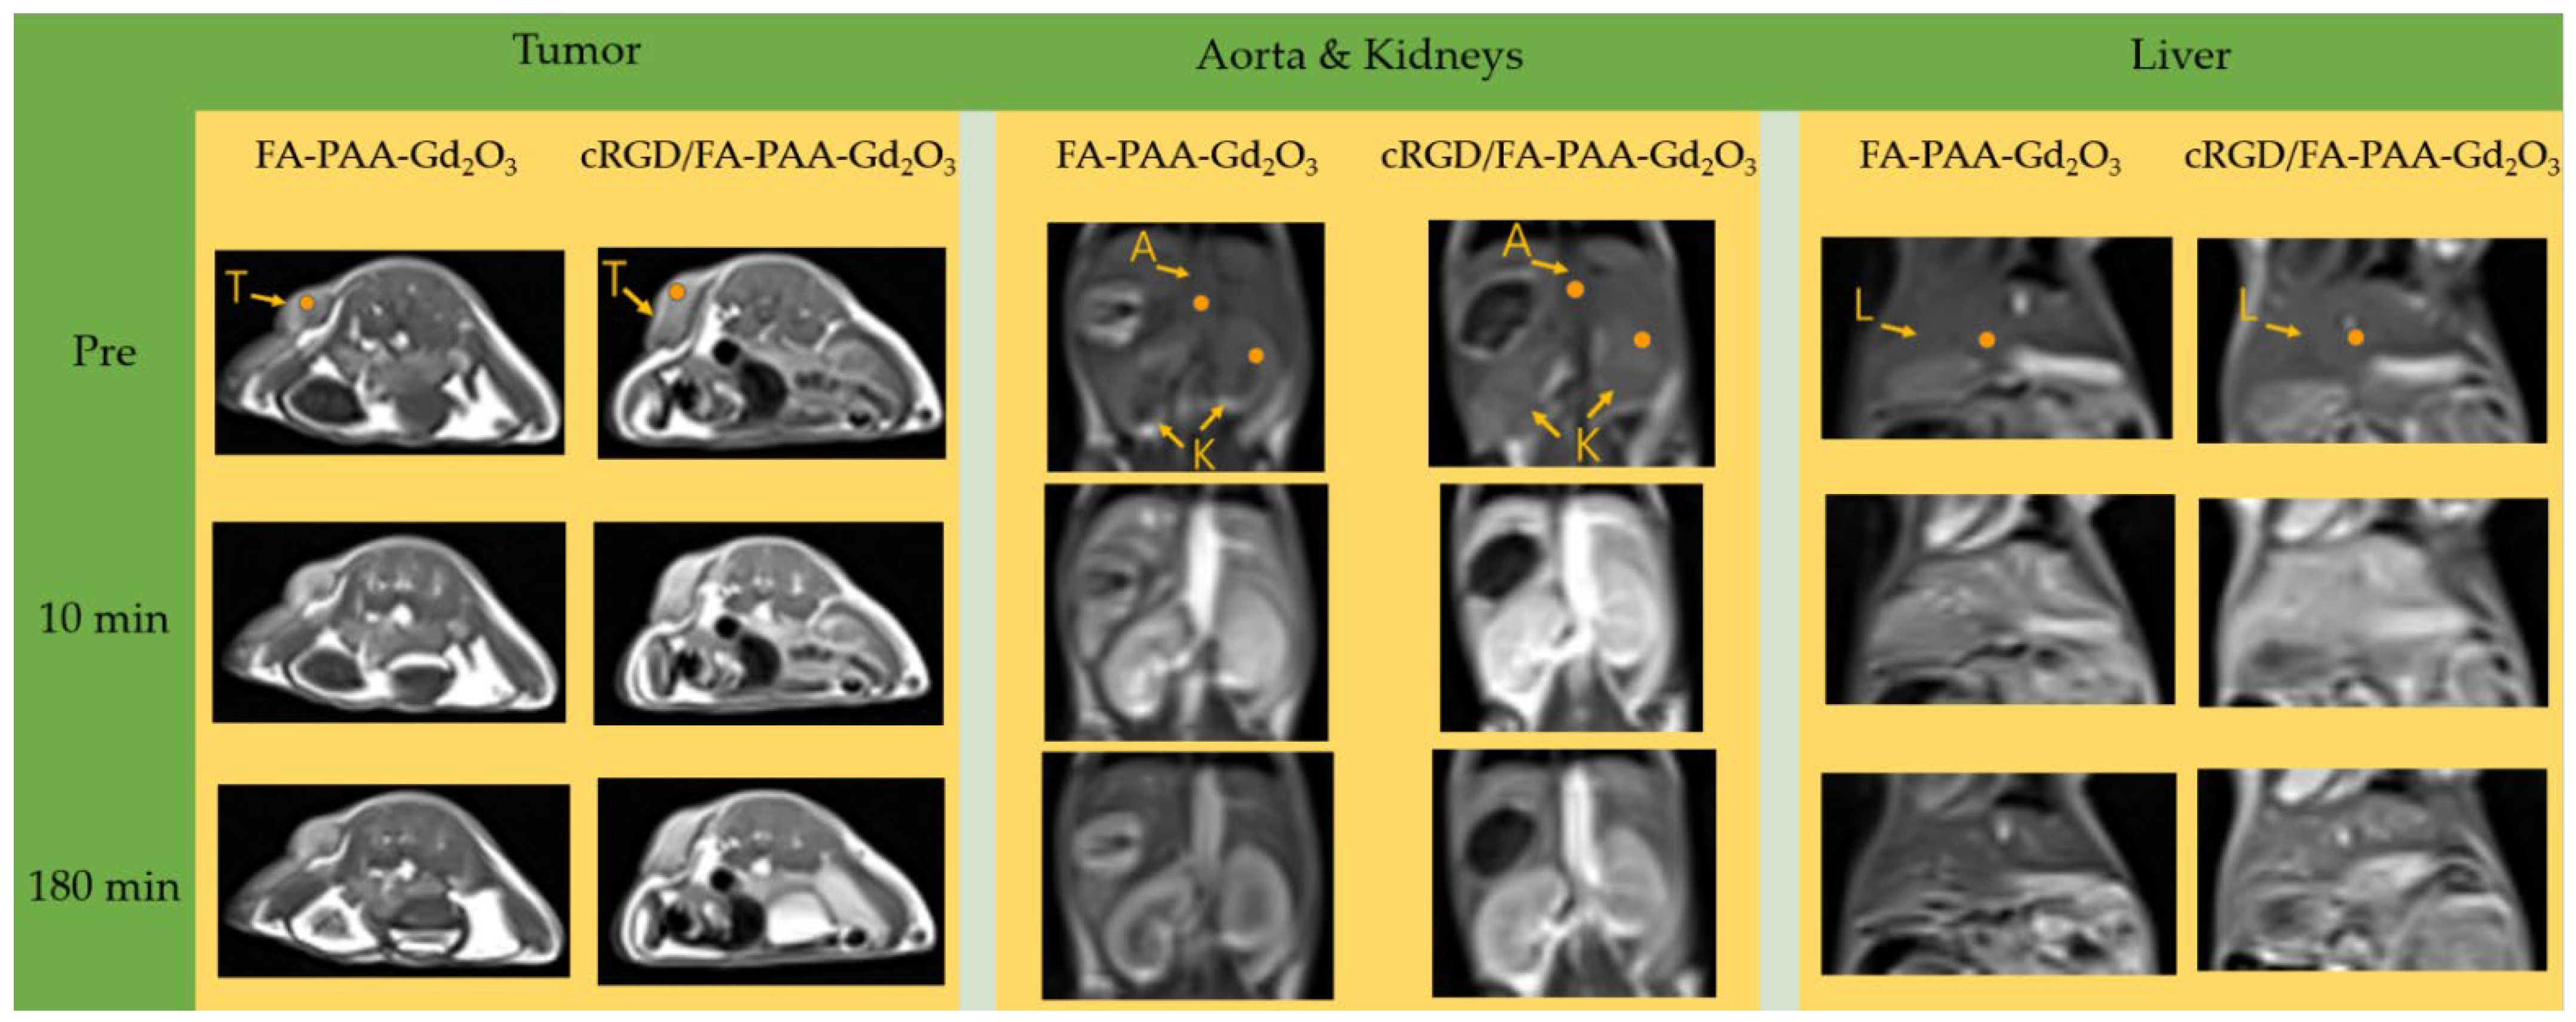
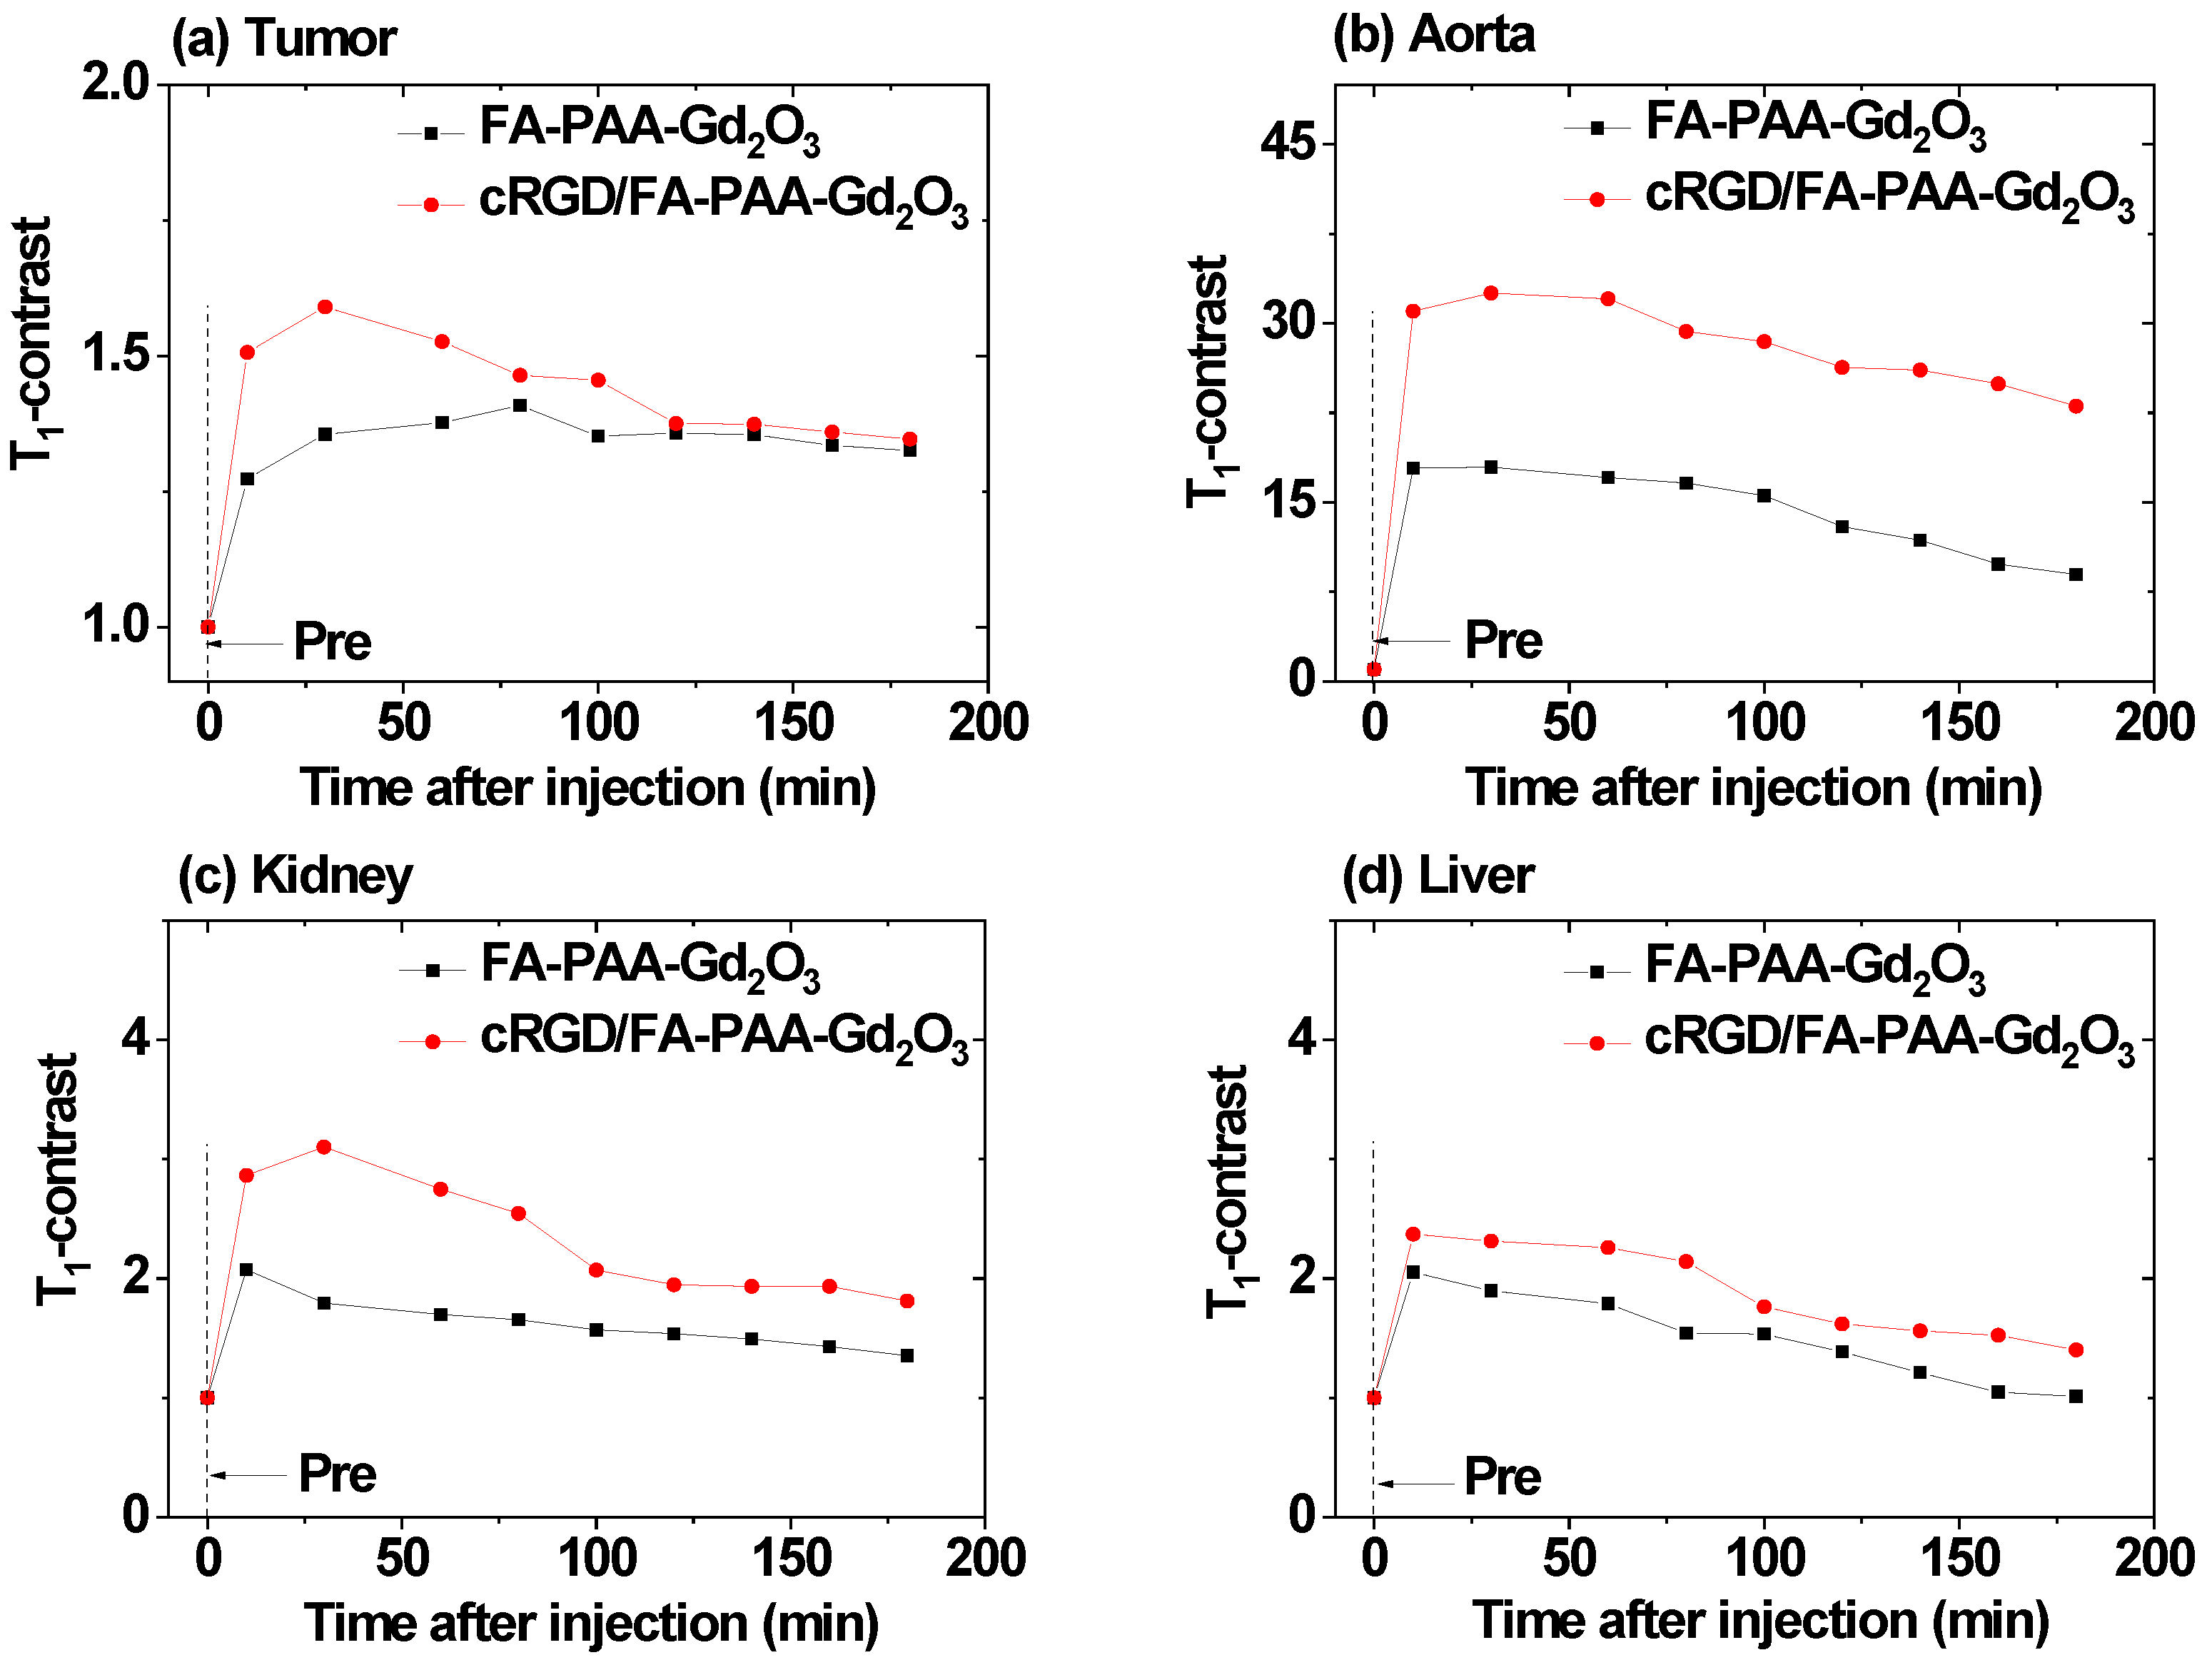
The toxicity of FA-PAA-Gd2O3 and cRGD/FA-PAA-Gd2O3 nanoparticles was investigated by measuring the viability of NCTC1469 normal and U87MG tumor cells. As shown in Figure 7a, NCTC1469 cells exhibited good viability when treated with up to 500 μM Gd in both nanoparticle samples. However, the viability of U87MG cells decreased with increasing Gd concentration (Figure 7b). The toxicity observed in U87MG cells was attributed to the overexpressed receptors and integrins in tumor cells compared with those in normal cells and the resultant targeting effect of nanoparticles [31,32,33,34,35,36,37,38,39]. In addition, at high Gd concentrations, increased cellular toxicity of the cRGD/FA-PAA-Gd2O3 nanoparticles compared to that of the FA-PAA-Gd2O3 nanoparticles was attributed to multiple targeting by cRGD and FA in the cRGD/FA-PAA-Gd2O3 nanoparticles.
Recently, enhanced cytosolic concentration of reactive oxygen species (ROS) and autophagic vesicles has been reported as a result of internalized gadolinium oxide nanoparticles in human umbilical vein endothelial and breast cancer cells (MCF-7) [50,51]. Consequently, potential mitochondrial membrane collapse, cell viability reduction, and cell death via necrosis and apoptosis were observed. In addition, growing evidence supports nanoparticle-induced ROS and subsequent ROS-mediated cellular apoptosis and necrosis for various nanoparticle systems [52,53,54]. Similar cytotoxic effects probably decreased U87MG cell viability with increasing Gd concentration in the present study. However, detailed studies are needed to unfold the mechanisms underlying FA-PAA-Gd2O3 and cRGD/FA-PAA-Gd2O3 nanoparticle-mediated cytotoxicity in U87MG tumor cells.

3.6. In Vivo T1 MRI

T1 MR images of the tumor and organs including the liver, kidneys, and aorta were measured before and after intravenous injection (up to 3 h) of the aqueous nanoparticle suspension samples into mice tails (Figure 8). Positive contrasts were observed in the tumor and all organs after injection, confirming that the nanoparticle samples acted as T1 MRI contrast agents. To study the contrast changes with time, the T1-contrast of the ROI were plotted as a function of time (Figure 9a–d), and they increased to reach maxima within an hour after injection, followed by a decrease thereafter. Notably, the T1-contrast ROIs were the highest in the aorta, followed by the kidneys for both FA-PAA-Gd2O3 and cRGD/FA-PAA-Gd2O3 nanoparticles, indicating their prolonged blood circulation and delayed renal excretion. In addition, the T1-contrast ROIs of the cRGD/FA-PAA-Gd2O3 nanoparticles were higher than those of the FA-PAA-Gd2O3 nanoparticles for tumors and all organs, confirming that cRGD enhanced tumor imaging and prolonged the blood circulation duration.

4. Discussion

In the present study, mono (i.e., FA) and multiple (i.e., cRGD and FA) tumor-targeting ligand-coated ultrasmall Gd2O3 nanoparticles were synthesized. FA-PAA-Gd2O3 and cRGD/FA-PAA-Gd2O3 nanoparticles were nearly monodispersed with an average particle diameter of 1.7 nm. The hydrodynamic diameters were 11.4 and 13.8 nm and zeta potentials were −33.9 and −16.6 mV for FA-PAA-Gd2O3 and cRGD/FA-PAA-Gd2O3 nanoparticles, respectively. Their colloidal stability was excellent, as the nanoparticles did not precipitate for more than one year after synthesis. Both nanoparticle samples exhibited approximately four times higher r1 values compared with those of the commercial molecular chelates [49], confirming their potential as high-performance T1 MRI contrast agents.
Both forms of the nanoparticles did not show any toxicity in NCTC1469 cells up to 500 μM Gd concentration. However, increased toxicity was observed in U87MG cells with increasing Gd concentration (Figure 7b). This was attributed to the tumor-targeting effect of the nanoparticles. In addition, the toxicity of the cRGD/FA-PAA-Gd2O3 nanoparticles was slightly higher than that of the FA-PAA-Gd2O3 nanoparticles because of multiple tumor targeting by cRGD and FA in the cRGD/FA-PAA-Gd2O3 nanoparticles.
Additionally, the T1-contrast ROIs of cRGD/FA-PAA-Gd2O3 nanoparticles in the tumor were higher than those of the FA-PAA-Gd2O3 nanoparticles (Figure 9a). This demonstrates the superiority of the multiple-targeting over the mono-targeting approach for tumor imaging. As shown in Figure 10, a mono tumor-targeting ligand (i.e., FA in FA-PAA-Gd2O3 nanoparticles) only targets the folate receptors overexpressed on U87MG tumor cells (termed receptor saturation phenomena; left figure in Figure 10), whereas multiple tumor-targeting ligands (i.e., FA and cRGD in cRGD/FA-PAA-Gd2O3 nanoparticles) target folate receptors as well as integrins (right figure in Figure 10), leading to improved tumor imaging as well as enhanced tumor cytotoxicity.
Both FA-PAA-Gd2O3 and cRGD/FA-PAA-Gd2O3 nanoparticles exhibited the highest positive contrasts in the aorta among the organs analyzed, which included the liver, kidneys, and tumors (Figure 9a–d), showing their prolonged circulation in the blood. Nanoparticles that can circulate in the blood for prolonged durations should have hydrodynamic diameters small enough to minimize opsonization [14,15] and evade RES uptake, and large enough (>10 nm) to delay renal excretion [14,16]. The hydrodynamic diameters of the nanoparticles synthesized in this study ranged from 11 to 14 nm, thereby satisfying these conditions.
As shown in Figure 9b–d, cRGD/FA-PAA-Gd2O3 nanoparticles exhibited higher positive contrasts in all organs, especially in the aorta, than the FA-PAA-Gd2O3 nanoparticles. This was likely due to the blood circulation-enhancing effect of the cRGD present in the cRGD/FA-PAA-Gd2O3 nanoparticles. As cRGD binds to integrins expressed on blood cells (termed cell hitchhiking) [14,55], the nanoparticles can circulate for a longer duration in the blood and provide a better contrast.
It is known that nanoparticles with ultrasmall particle and hydrodynamic diameters (d < 3 nm and a < 5 nm) are excretable via the renal system [56,57]. The synthesized nanoparticles (davg = 1.7 nm) in the present study exhibited aavg = 11.4 nm for FA-PAA-Gd2O3 nanoparticles and 13.8 nm for cRGD/FA-PAA-Gd2O3 nanoparticles. Therefore, a portion of the nanoparticles could be slowly excreted through the renal system, as can be noticed from the gradual decrease in SNR with time in the kidneys (Figure 9c). However, detailed studies are needed to clarify the excretion pathway of the nanoparticles. Ultrasmall nanoparticles exhibited no or negligible contrast enhancements in healthy normal brain MRI [58], supporting that they cannot pass the blood–brain barrier (BBB) for the normal brain; however, they can pass the BBB for brain tumors, possibly through damage to the BBB, as observed in brain tumor MRI with D-glucuronic acid-coated ultrasmall Gd2O3 nanoparticles [59]. For other organ tumors, tumor-targeting ligand-conjugated Gd2O3 nanoparticles have been successfully applied to tumor imaging via various imaging modalities [5]. The toxicity of Gd2O3 nanoparticles is of great concern owing to the release of Gd3+ ions [60,61,62]. For commercial molecular Gd3+-chelates, it is known that if free Gd3+ ions are liberated in the body, this can promote nephrogenic systemic fibrosis, which is a rare disease that can lead to hardening or thickening of the skin and deposits [63]; therefore, Gd2O3 nanoparticles should be completely excreted through the renal system after injection.

5. Conclusions

Hydrophilic and biocompatible PAA-coated ultrasmall Gd2O3 nanoparticles (davg = 1.7 nm) were successfully conjugated with the tumor-targeting ligands FA and/or cRGD. The FA-PAA-Gd2O3 and cRGD/FA-PAA-Gd2O3 nanoparticles exhibited excellent colloidal stability (no precipitation for >1 year after synthesis). They were successfully applied for tumor imaging in U87MG tumor-bearing mice via T1 MRI. The salient outcomes of our study can be summarized as follows:
(1)
Both nanoparticles displayed r1 values approximately four times higher (12.0 and 11.2 s−1 mM−1 for FA-PAA-Gd2O3 and cRGD/FA-PAA-Gd2O3 nanoparticles, respectively) than those of commercially available Gd-chelates.
(2)
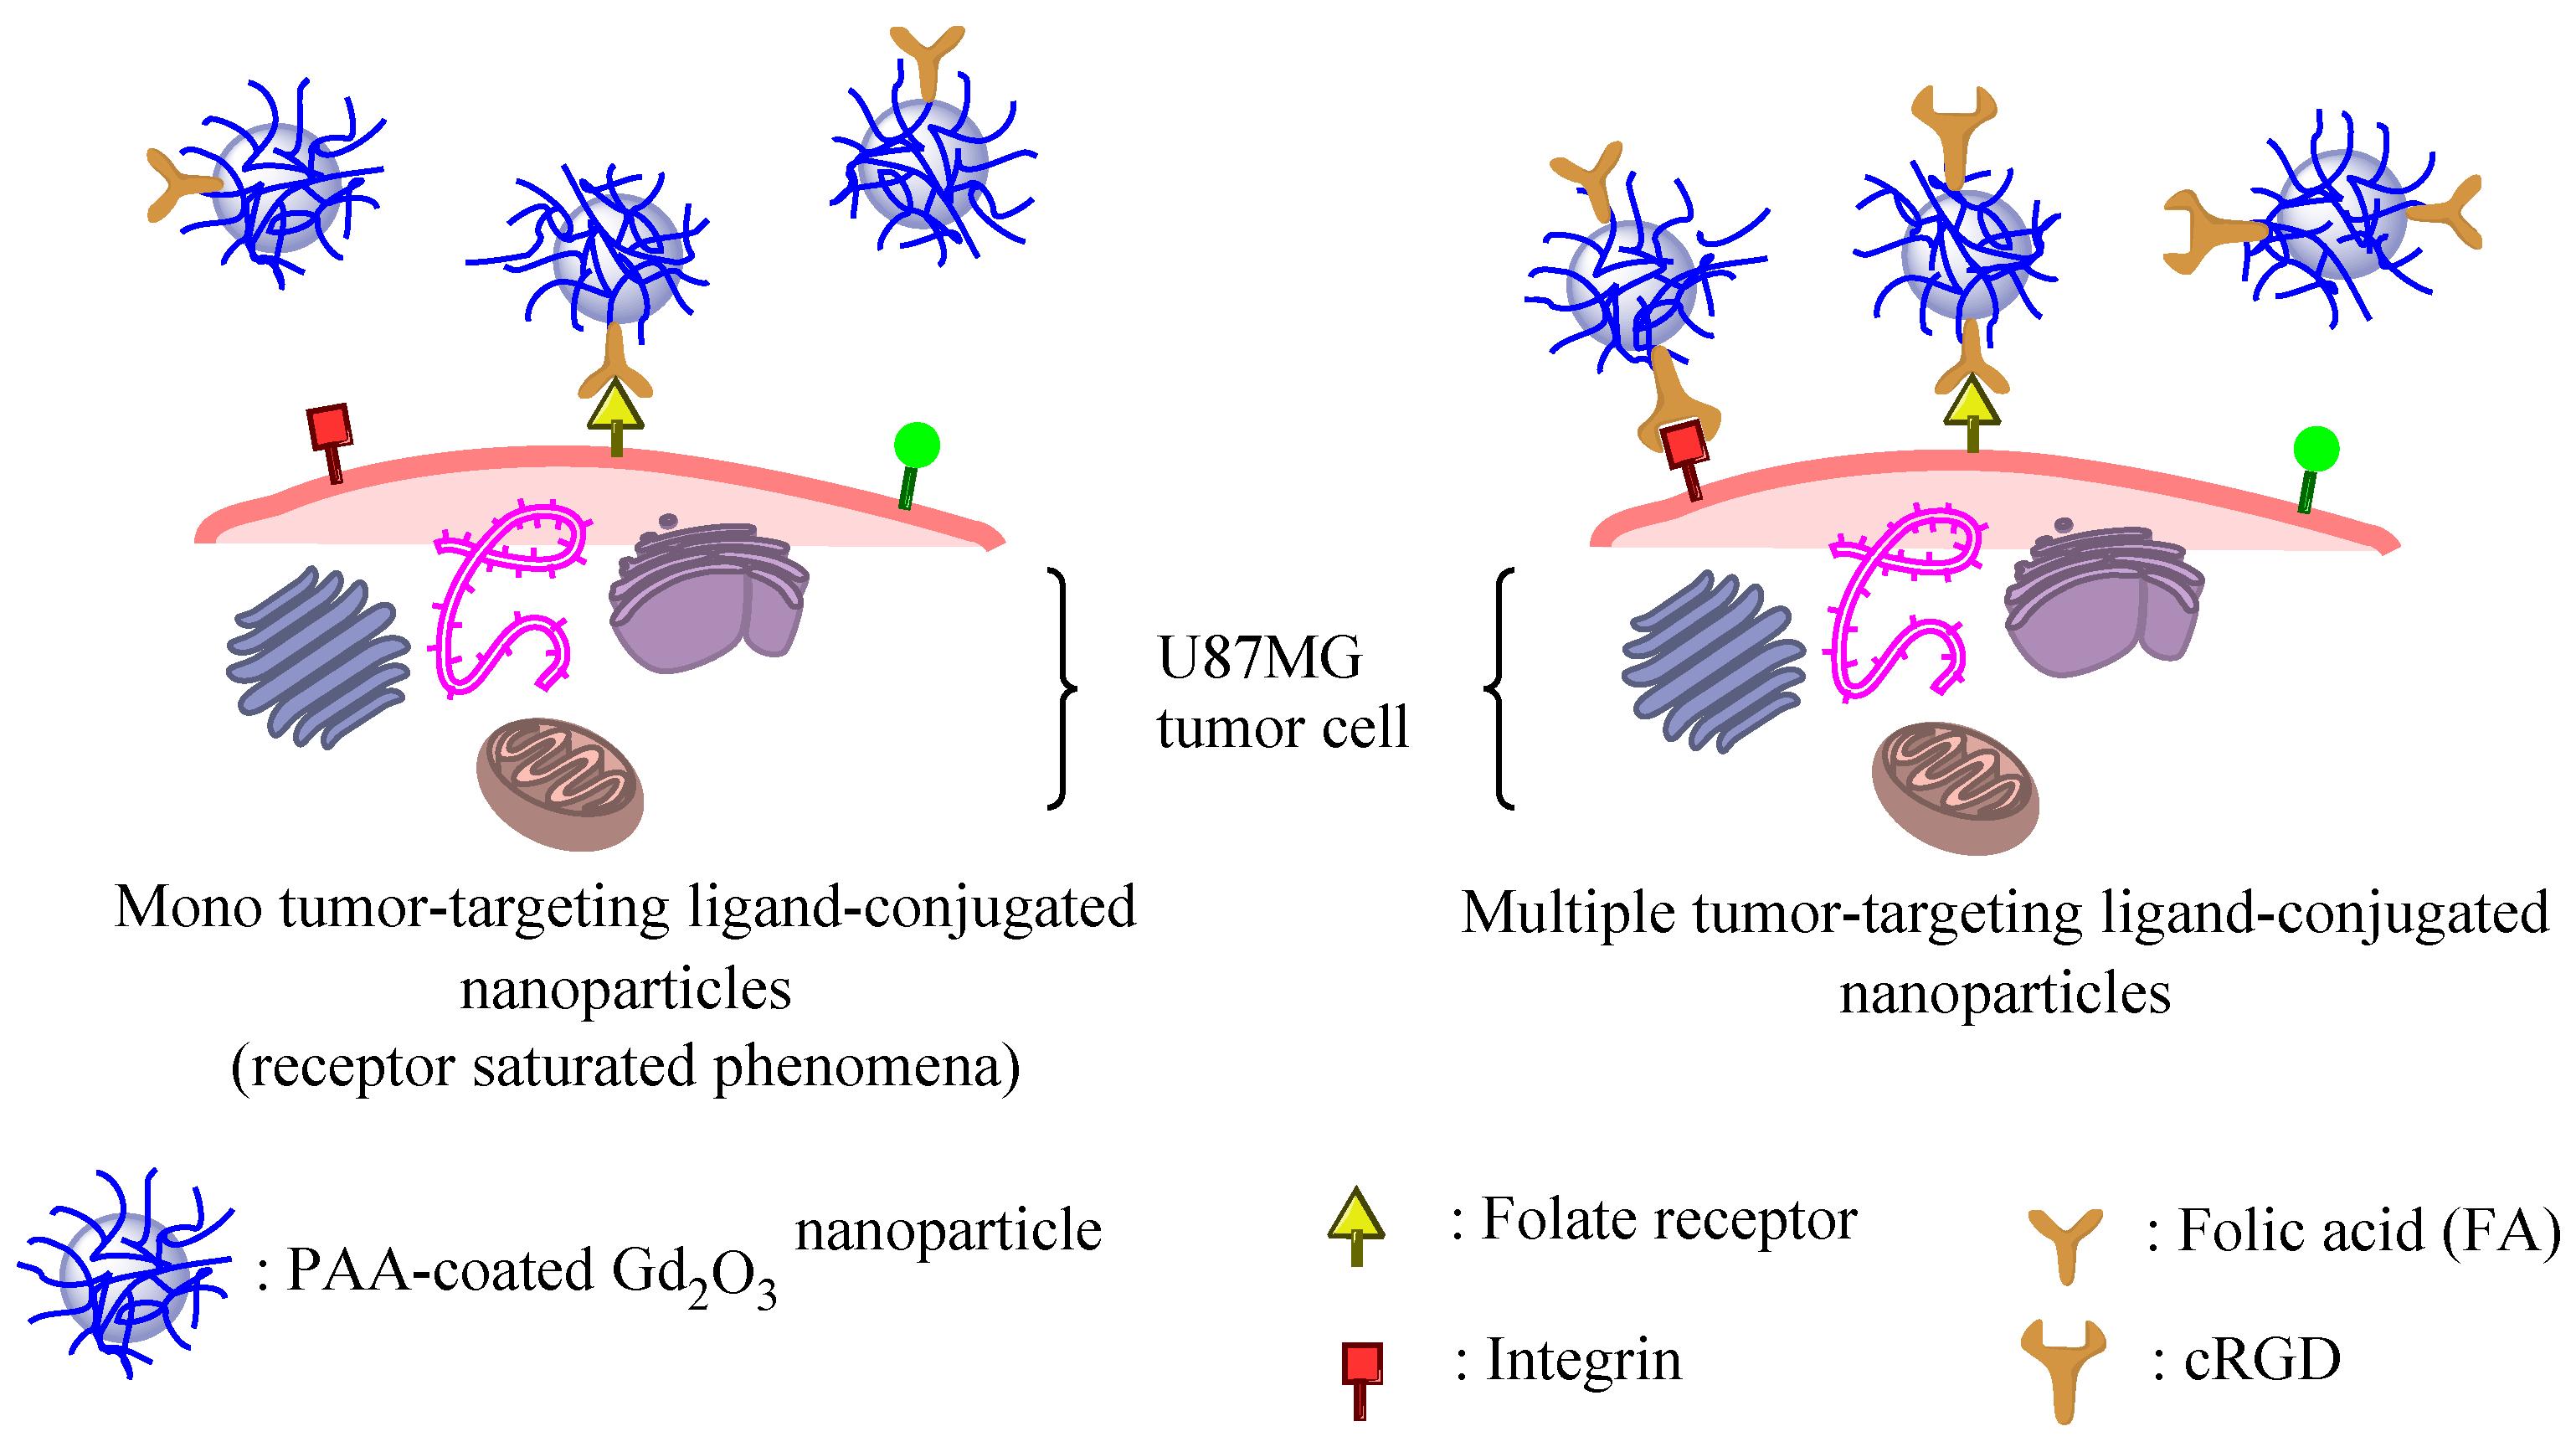
The cRGD/FA-PAA-Gd2O3 nanoparticles exhibited higher contrasts at the tumor site than the FA-PAA-Gd2O3 nanoparticles owing to their multiple tumor-targeting effects.
(3)
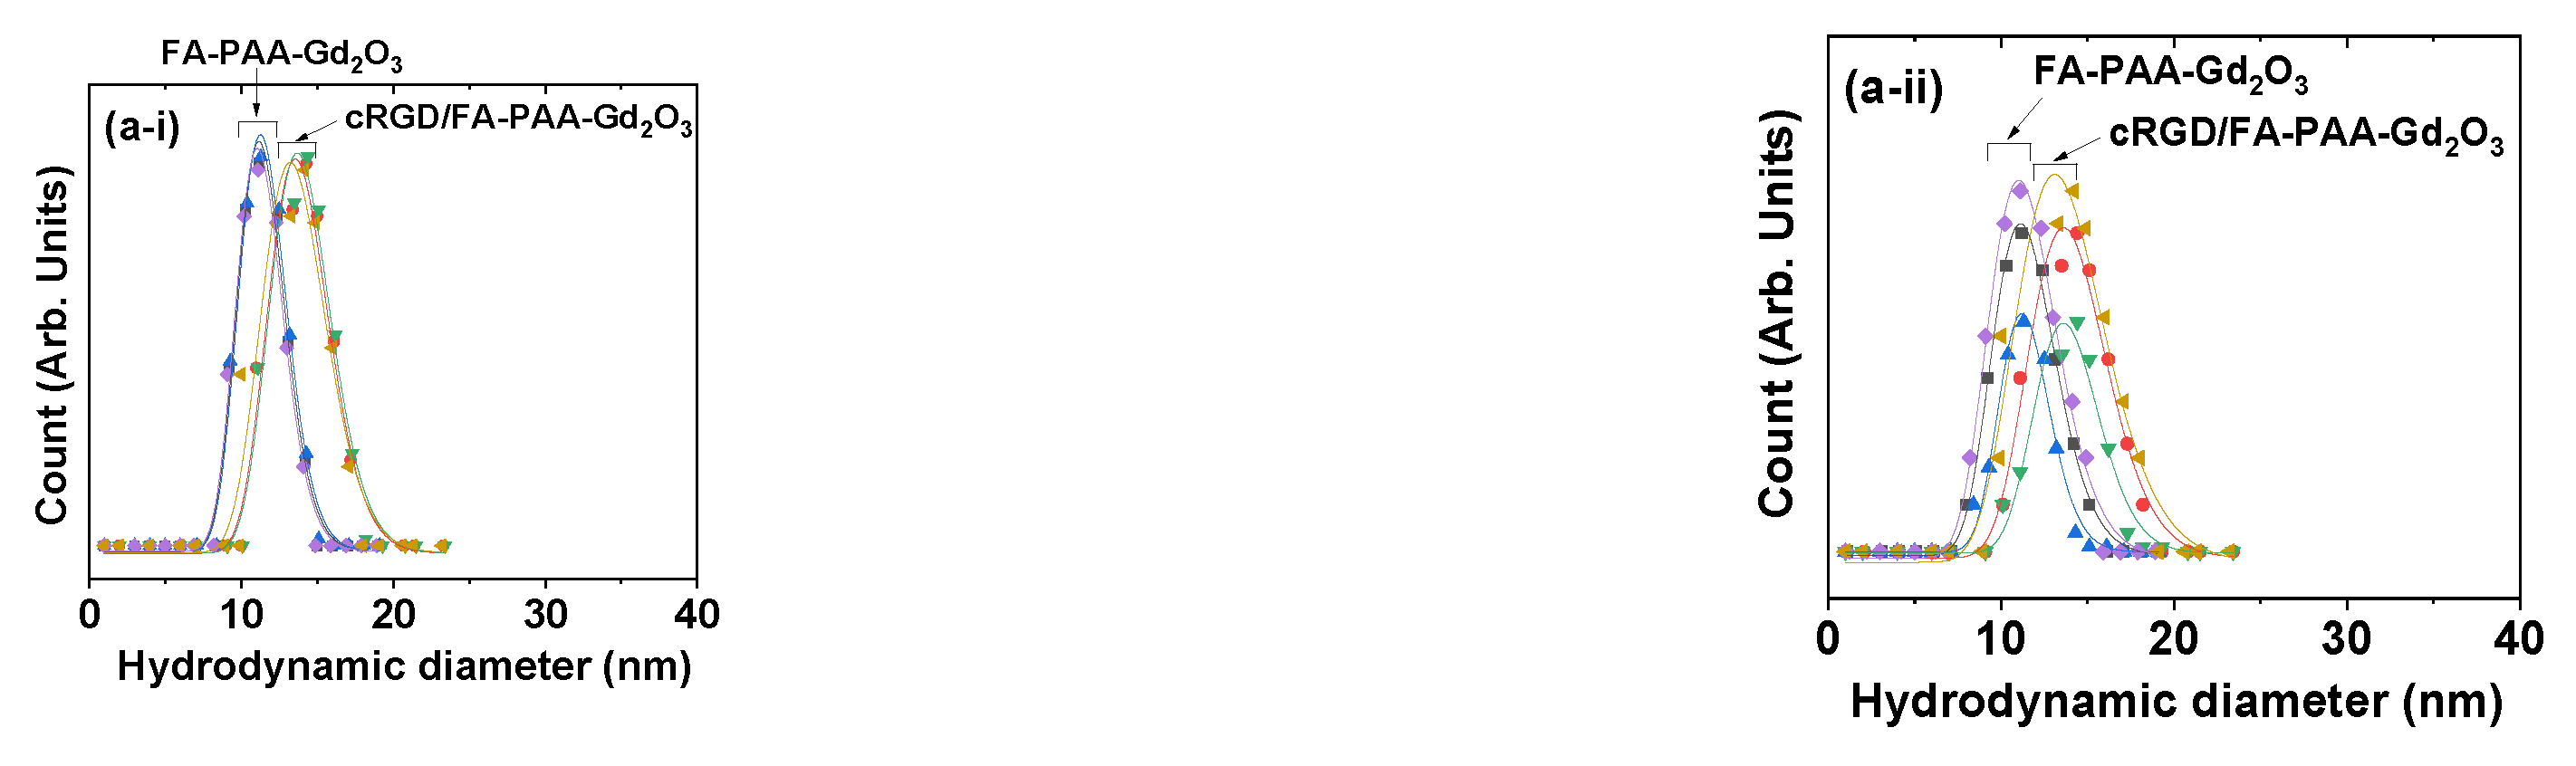
Both nanoparticles exhibited the highest contrast in the aorta among the various organs analyzed, because of prolonged blood circulation. This is due to their ideal hydrodynamic diameters (11.4 and 13.8 nm for FA-PAA-Gd2O3 and cRGD/FA-PAA-Gd2O3 nanoparticles, respectively), which are small enough to minimize opsonization and RES uptake and large enough to delay renal excretion.
(4)
The cRGD/FA-PAA-Gd2O3 nanoparticles displayed higher contrasts in all organs, especially the aorta, compared with the FA-PAA-Gd2O3 nanoparticles, because of the blood cell hitchhiking phenomenon of cRGD in the cRGD/FA-PAA-Gd2O3 nanoparticles, which prolonged their circulation in the blood.

Author Contributions

Conceptualization, S.L.H.; formal analysis, S.L.H., H.Y., S.L. (Sangyeol Lee), T.T., M.Y.A., S.L. (Shuwen Liu), A.K.A.A.S., D.Z. and Y.L.; investigation, S.L.H. and H.Y.; data curation, S.-W.N. and K.S.C.; writing—original draft preparation, S.L.H.; writing—review and editing, G.H.L.; supervision, Y.C. and G.H.L.; funding acquisition, S.-W.N., Y.C. and G.H.L. All authors have read and agreed to the published version of the manuscript.

Funding

This work was supported by the Basic Science Research Program of the National Research Foundation (NRF) funded by the Ministry of Education, Science, and Technology (No. 2016R1D1A3B01007622) and the Korean government (Ministry of Science, and Information and Communications Technology: MSIT) (No. 2021R1A4A1029433).

Institutional Review Board Statement

The animal imaging experiments were conducted according to the rules and regulations of the Animal Research Committee of Kyungpook National University (approval number: KNU2021–0225 and approval date: 24 December 2021).

Informed Consent Statement

Not applicable.

Data Availability Statement

The data presented in this study are available on request from the corresponding authors.

Acknowledgments

We thank the Korea Basic Science Institute for allowing us to use their XRD machine.

Conflicts of Interest

The authors declare no conflict of interest.

References

  1. García-Figueiras, F.; Baleato-González, S.; Padhani, A.R.; Luna-Alcalá, A.; Vallejo-Casas, J.A.; Sala, E.; Vilanova, J.C.; Koh, D.-M.; Herranz-Carnero, M.; Vargas, H.A. How clinical imaging can assess cancer biology. Insights Imaging 2019, 10, 28. [Google Scholar] [CrossRef] [PubMed]
  2. Morone, M.; Bali, M.A.; Tunariu, N.; Messiou, C.; Blackledge, M.; Grazioli, L.; Koh, D.M. Whole-body MRI: Current applications in oncology. Am. J. Roentgenol. 2017, 209, W336–W349. [Google Scholar] [CrossRef] [PubMed]
  3. Massoud, T.F.; Gambhir, S.S. Molecular imaging in living subjects: Seeing fundamental biological processes in a new light. Genes Dev. 2003, 17, 545–580. [Google Scholar] [CrossRef] [PubMed] [Green Version]
  4. Thakor, A.S.; Jokerst, J.V.; Ghanouni, P.; Campbell, J.L.; Mittra, E.; Gambhir, S.S. Clinically approved nanoparticle imaging agents. J. Nucl. Med. 2016, 57, 1833–1837. [Google Scholar] [CrossRef] [Green Version]
  5. Ahmad, M.Y.; Yue, H.; Tegafaw, T.; Liu, S.; Ho, S.L.; Lee, G.H.; Nam, S.-W.; Chang, Y. Functionalized lanthanide oxide nanoparticles for tumor targeting, medical imaging, and therapy. Pharmaceutics 2021, 13, 1890. [Google Scholar] [CrossRef] [PubMed]
  6. Suk, J.S.; Xu, Q.; Kim, N.; Hanes, J.; Ensign, L.M. PEGylation as a strategy for improving nanoparticle-based drug and gene delivery. Adv. Drug Deliv. Rev. 2016, 99, 28–51. [Google Scholar] [CrossRef] [Green Version]
  7. Jang, C.; Lee, J.H.; Sahu, A.; Tae, G. The synergistic effect of folate and RGD dual ligand of nanographene oxide on tumor targeting and photothermal therapy in vivo. Nanoscale 2015, 7, 18584–18594. [Google Scholar] [CrossRef]
  8. Kibria, G.; Hatakeyama, H.; Ohga, N.; Hida, K.; Harashima, H. Dual-ligand modification of PEGylated liposomes shows better cell selectivity and efficient gene delivery. J. Control. Release 2011, 153, 141. [Google Scholar] [CrossRef] [Green Version]
  9. Yan, H.; You, Y.; Li, X.; Liu, L.; Gou, F.; Zhang, Q.; Liu, D.; Tong, Y.; Ding, S.; Wang, J. Preparation of RGD peptide/folate acid double-targeted mesoporous silica nanoparticles and its application in human breast cancer MCF-7 cells. Front. Pharmacol. 2020, 11, 893. [Google Scholar] [CrossRef]
  10. Owens, D.E.; Peppas, N.A. Opsonization, biodistribution, and pharmacokinetics of polymeric nanoparticles. Int. J. Pharm. 2006, 307, 93–102. [Google Scholar] [CrossRef]
  11. Moghimi, S.; Szebeni, J. Stealth liposomes and long circulating nanoparticles: Critical issues in pharmacokinetics, opsonization and protein-binding properties. Prog. Lipid Res. 2003, 42, 463–478. [Google Scholar] [CrossRef]
  12. Li, S.-D.; Huang, L. Nanoparticles evading the reticuloendothelial system: Role of the supported bilayer. Biochim. Biophys. Acta Biomembr. 2009, 1788, 2259–2266. [Google Scholar] [CrossRef] [PubMed] [Green Version]
  13. Tang, Y.; Wang, X.; Li, J.; Nie, Y.; Liao, G.; Yu, Y.; Li, C. Overcoming the reticuloendothelial system barrier to drug delivery with a “Don’t-Eat-Us” strategy. ACS Nano 2019, 13, 13015–13026. [Google Scholar] [CrossRef] [PubMed]
  14. Yoo, J.-W.; Chambers, E.; Mitragotri, S. Factors that control the circulation time of nanooarticles in blood: Challenges, solutions and future prospects. Curr. Pharm. Des. 2010, 16, 2298–2307. [Google Scholar] [CrossRef] [PubMed]
  15. Nie, S. Understanding and overcoming major barriers in cancer nanomedicine. Nanomedicine 2010, 5, 523–528. [Google Scholar] [CrossRef] [Green Version]
  16. Gagliardini, E.; Conti, S.; Benigni, A.; Remuzzi, G.; Remuzzi, A. Imaging of the porous ultrastructure of the glomerular epithelial filtration slit. J. Am. Soc. Nephrol. 2010, 21, 2081–2089. [Google Scholar] [CrossRef] [Green Version]
  17. Chang, Y.; Chae, K.S.; Lee, G.H. Gadolinium agents for theragnosis of malignant tumors. Bioinspired Biomim. Nanobiomater. 2016, 5, 167–170. [Google Scholar] [CrossRef]
  18. Lauffer, R.B. Paramagnetic metal complexes as water proton relaxation agents for NMR imaging: Theory and design. Chem. Rev. 1987, 87, 901–927. [Google Scholar] [CrossRef]
  19. Wahsner, J.; Gale, E.M.; Rodríguez-Rodríguez, A.; Caravan, P. Chemistry of MRI contrast agents: Current challenges and new frontiers. Chem. Rev. 2018, 119, 957–1057. [Google Scholar] [CrossRef]
  20. Caravan, P.; Ellison, J.J.; McMurry, T.J.; Lauffer, R.B. Gadolinium(III) chelates as MRI contrast agents: Structure, dynamics, and applications. Chem. Rev. 1999, 99, 2293–2352. [Google Scholar] [CrossRef]
  21. Enger, S.A.; Giusti, V.; Fortin, M.A.; Lundqvist, H.; Rosenschöld, P.M. Dosimetry for gadolinium neutron capture therapy (GdNCT). Radiat. Meas. 2013, 59, 233–240. [Google Scholar] [CrossRef]
  22. Leinweber, G.; Barry, D.P.; Trbovich, M.J.; Burke, J.A.; Drindak, N.J.; Knox, H.D.; Ballad, R.V.; Block, R.C.; Danon, Y.; Severnyak, L.I. Neutron capture and total cross-section measurements and resonance parameters of gadolinium. Nucl. Sci. Eng. 2006, 154, 261–279. [Google Scholar] [CrossRef]
  23. Cerullo, N.; Bufalino, D.; Daquino, G. Progress in the use of gadolinium for NCT. Appl. Rad. Isot. 2009, 67, S157–S160. [Google Scholar] [CrossRef] [PubMed]
  24. Ho, S.L.; Huan, Y.; Tegafaw, T.; Ahmad, M.Y.; Liu, S.; Nam, S.-W.; Chang, Y.; Lee, G.H. Gadolinium Neutron Capture Therapy (GdNCT) Agents from Molecular to Nano: Current Status and Perspectives. ACS Omega 2022, 7, 2533–2553. [Google Scholar] [CrossRef]
  25. Bridot, J.L.; Faure, A.-C.; Laurent, S.; Rivière, C.; Billotey, C.; Hiba, B.; Janier, M.; Josserand, V.; Coll, J.-L.; Vander Elst, L.; et al. Hybrid gadolinium oxides nanoparticles: Multimodal contrast agents for in vivo imaging. J. Am. Chem. Soc. 2007, 129, 5076–5084. [Google Scholar] [CrossRef]
  26. Roux, S.; Faure, A.-C.; Mandon, C.; Dufort, S.; Rivière, C.; Bridot, J.L.; Mutelet, B.; Marquette, C.A.; Josserand, V.; Le Duc, G.; et al. Multifunctional gadolinium oxide nanoparticles: Towards image-guided therapy. Imaging Med. 2010, 2, 211–223. [Google Scholar] [CrossRef]
  27. Faucher, L.; Tremblay, M.; Lagueux, J.; Gossuin, Y.; Fortin, M.-A. Rapid synthesis of PEGylated ultrasmall gadolinium oxide nanoparticles for cell labeling and tracking with MRI. ACS Appl. Mater. Interfaces 2012, 4, 4506–4515. [Google Scholar] [CrossRef]
  28. Lee, G.H.; Chang, Y.; Kim, T.J. Blood-pool and targeting MRI contrast agents: From Gd-chelates to Gd-nanoparticles. Eur. J. Inorg. Chem. 2012, 2012, 1924–1933. [Google Scholar] [CrossRef]
  29. Park, J.Y.; Chang, Y.M.; Lee, G.H. Multi-modal imaging and cancer therapy using lanthanide oxide nanoparticles: Current status and perspectives. Curr. Med. Chem. 2015, 22, 569–581. [Google Scholar] [CrossRef]
  30. Dong, H.; Du, S.-R.; Zheng, X.-Y.; Lyu, G.-M.; Sun, L.-D.; Li, L.D.; Zhang, P.-Z.; Zhang, C.; Yan, C.-H. Lanthanide nanoparticles: From design toward bioimaging and therapy. Chem. Rev. 2015, 115, 10725–10815. [Google Scholar] [CrossRef]
  31. Fernandez, M.; Javaid, F.; Chudasama, V. Advances in targeting the folate receptor in the treatment/imaging of cancers. Chem. Sci. 2018, 9, 790–810. [Google Scholar] [CrossRef] [PubMed] [Green Version]
  32. Angelopoulou, A.; Kolokithas-Ntoukas, A.; Fytas, C.; Avgoustakis, K. Folic acid-functionalized, condensed magnetic nanoparticles for targeted delivery of doxorubicin to tumor cancer cells overexpressing the folate receptor. ACS Omega 2019, 4, 22214–22227. [Google Scholar] [CrossRef] [PubMed]
  33. Saul, J.M.; Annapragada, A.; Natarajan, J.V.; Bellamkonda, R.V. Controlled targeting of liposomal doxorubicin via the folate receptor in vitro. J. Control. Release 2003, 92, 49–67. [Google Scholar] [CrossRef]
  34. Hu, S.; Dong, F.-L.; Yao, C.-F.; Wang, X.-M.; Hu, C.-H. RGD peptide-mediated molecular imaging for targeting integrin Alpha(v) Beta(3) in tumors: A review. Curr. Med. Imaging Rev. 2018, 14, 186–195. [Google Scholar] [CrossRef]
  35. Shi, J.; Liu, S.; Yu, Y.; He, C.; Tan, L.; Shen, Y.-M. RGD peptide-decorated micelles assembled from polymer-paclitaxel conjugates towards gastric cancer therapy. Colloids Surf. B Biointerfaces 2019, 180, 58–67. [Google Scholar] [CrossRef]
  36. Park, S.-H.; Zheng, J.H.; Nguyen, V.H.; Jiang, S.-N.; Kim, D.-Y.; Szardenings, M.; Min, J.H.; Hong, Y.; Choy, H.E.; Min, J.-J. RGD peptide cell-surface display enhances the targeting and therapeutic efficacy of attenuated salmonella-mediated cancer therapy. Theranostics 2016, 6, 1672. [Google Scholar] [CrossRef] [Green Version]
  37. Biscaglia, F.; Ripani, G.; Rajendran, S.; Benna, C.; Mocellin, S.; Bocchinfuso, G.; Meneghetti, M.; Palleschi, A.; Gobbo, M. Gold nanoparticle aggregates functionalized with cyclic RGD peptides for targeting and imaging of colorectal cancer cells. ACS Appl. Nano Mater. 2019, 2, 6436–6444. [Google Scholar] [CrossRef]
  38. Zou, Y.; Wei, Y.; Sun, Y.; Bao, J.; Yao, F.; Li, Z.; Meng, F.; Hu, C.; Storm, G.; Zhong, Z. Cyclic RGD-functionalized and disulfide-crosslinked iodine-rich polymersomes as a robust and smart theranostic agent for targeted CT imaging and chemotherapy of tumor. Theranostics 2019, 9, 8061. [Google Scholar] [CrossRef]
  39. Yong, K.-T.; Roy, I.; Law, W.-C.; Hu, R. Synthesis of cRGD-peptide conjugated near-infrared CdTe/ZnSe core-shell quantum dots for in vivo cancer targeting and imaging. Chem. Commun. 2010, 46, 7136–7138. [Google Scholar] [CrossRef]
  40. Marasini, S.; Yue, H.; Ho, S.L.; Park, J.A.; Kim, S.; Yang, J.U.; Cha, H.; Liu, S.; Tegafaw, T.; Ahmad, M.Y.; et al. In vivo positive magnetic resonance imaging of brain cancer (U87MG) using folic acid-conjugated polyacrylic acid-coated ultrasmall manganese oxide nanoparticles. Appl. Sci. 2021, 11, 2596. [Google Scholar] [CrossRef]
  41. Söderlind, F.; Pedersen, H.; Petoral, R.M.; Käll, P.-O.; Uvdal, K. Synthesis and characterisation of Gd2O3 nanocrystals functionalised by organic acids. J. Colloid Interface Sci. 2005, 288, 140–148. [Google Scholar] [CrossRef]
  42. Heiba, Z.; Okuyucu, H.; Hascicek, Y.S. X-ray structure determination of the rare earth oxides (Er1-uGd)2O3 applying the Rietveld method. J. Appl. Crystallogr. 2002, 35, 577–580. [Google Scholar] [CrossRef] [Green Version]
  43. Deacon, G.B.; Phillips, R.J. Relationships between the carbon-oxygen stretching frequencies of carboxylato complexes and the type of carboxylate coordination. Coord. Chem. Rev. 1980, 33, 227–250. [Google Scholar] [CrossRef]
  44. Pearson, R.G. Hard and Soft Acids and Bases. J. Am. Chem. Soc. 1963, 85, 3533–3539. [Google Scholar] [CrossRef]
  45. Yin, H.-Q.; Bi, F.-L.; Gan, F. Rapid synthesis of cyclic RGD conjugated gold nanoclusters for targeting and fluorescence imaging of melanoma A375 cells. Bioconjugate Chem. 2015, 26, 243–249. [Google Scholar] [CrossRef]
  46. Ahmad, M.Y.; Ahmad, M.W.; Cha, H.; Oh, I.T.; Tegafaw, T.; Miao, X.; Ho, S.L.; Marasini, S.; Ghazanfari, A.; Yue, H.; et al. Cyclic RGD-coated ultrasmall Gd2O3 nanoparticles as tumor-targeting positive magnetic resonance imaging contrast agents. Eur. J. Inorg. Chem. 2018, 26, 3070–3079. [Google Scholar] [CrossRef]
  47. Haynes, W.M.; Lide, D.R.; Bruno, T.J. CRC Handbook of Chemistry and Physics, 96th ed.; CRC Press: Boca Raton, FL, USA, 2015; pp. 4–64. [Google Scholar]
  48. Benoit, D.N.; Zhu, H.; Lilierose, M.H.; Verm, R.A.; Ali, N.; Morrison, A.N.; Fortner, J.D.; Avendano, C.; Colvin, V.L. Measuring the grafting density of nanoparticles in solution by analytical ultracentrifugation and total organic carbon analysis. Anal. Chem. 2012, 84, 9238–9245. [Google Scholar] [CrossRef] [Green Version]
  49. Rohrer, M.; Bauer, H.; Mintorovitch, J.; Requardt, M.; Weinmann, H.-J. Comparison of magnetic properties of MRI contrast media solutions at different magnetic field strengths. Invest. Radiol. 2005, 40, 715–724. [Google Scholar] [CrossRef] [Green Version]
  50. Akhtar, M.J.; Ahamed, M.; Alhadlaq, H.; Alrokayan, S. Toxicity mechanism of gadolinium oxide nanoparticles and gadolinium ions in human breast cancer cells. Curr. Drug Metab. 2019, 20, 907–917. [Google Scholar] [CrossRef]
  51. Akhtar, M.J.; Ahamed, M.; Alhadlaq, H. Gadolinium oxide nanoparticles induce toxicity in human endothelial HUVECs via lipid peroxidation, mitochondrial dysfunction and autophagy modulation. Nanomaterials 2020, 10, 1675. [Google Scholar] [CrossRef]
  52. Bae, J.-E.; Huh, M.-I.; Ryu, B.-K.; Do, J.-Y.; Jin, S.-U.; Moon, M.-J.; Jung, J.-C.; Chang, Y.; Kim, E.; Chi, S.-G.; et al. The effect of static magnetic fields on the aggregation and cytotoxicity of magnetic nanoparticles. Biomaterials 2011, 32, 9401–9414. [Google Scholar] [CrossRef] [PubMed]
  53. Mohammadinejad, R.; Moosavi, M.A.; Tavakol, S.; Vardar, D.Ö.; Hosseini, A.; Rahmati, M.; Dini, L.; Hussain, S.; Mandegary, A.; Klionsky, D.J. Necrotic, apoptotic and autophagic cell fates triggered by nanoparticles. Autophagy 2019, 15, 4–33. [Google Scholar] [CrossRef] [PubMed] [Green Version]
  54. Horie, M.; Tabei, Y. Role of oxidative stress in nanoparticles toxicity. Free Radic. Res. 2021, 55, 331–342. [Google Scholar] [CrossRef] [PubMed]
  55. Jin, P.; Sha, R.; Zhang, Y.; Liu, L.; Bian, Y.; Qian, J.; Qian, J.; Lin, J.; Ishimwe, N.; Hu, Y.; et al. Blood circulation-prolonging peptides for engineered nanoparticles indentified via phage display. Nano Lett. 2019, 19, 1467–1478. [Google Scholar] [CrossRef]
  56. Choi, H.S.; Liu, W.; Misra, P.; Tanaka, E.; Zimmer, J.P.; Ipe, B.I.; Bawendi, M.G.; Frangioni, J.V. Renal clearance of nano-particles. Nat. Biotechnol. 2007, 25, 1165–1170. [Google Scholar]
  57. Longmire, M.; Choyke, P.L.; Kobayashi, H. Clearance properties of nano-sized particles and molecules as imaging agents: Con-siderations and caveats. Nanomedcine 2008, 3, 703–717. [Google Scholar] [CrossRef] [Green Version]
  58. Kattel, K.; Park, J.Y.; Xu, W.; Kim, H.G.; Lee, E.J.; Bony, B.A.; Heo, W.C.; Lee, J.J.; Jin, S.; Baeck, J.S.; et al. A facile synthesis, in vitro and in vivo MR studies of D-glucuronic acid-coated ultrasmall Ln2O3 (Ln = Eu, Gd, Dy, Ho, and Er) nanoparticles as a new potential MRI contrast agent. ACS Appl. Mater. Interfaces 2011, 3, 3325–3334. [Google Scholar] [CrossRef]
  59. Park, J.Y.; Baek, M.J.; Choi, E.S.; Woo, S.; Kim, J.H.; Kim, T.J.; Jung, J.C.; Chae, K.S.; Chang, Y.; Lee, G.H. Paramagnetic ultrasmall gadolinium oxide nanoparticles as advanced T1 MRI contrast agent: Account for large longitudinal relaxivity, optimal particle diameter, and in vivo T1 MR images. ACS Nano 2009, 3, 3663–3669. [Google Scholar] [CrossRef]
  60. Tweedle, M.F. Gadolinium deposition: Is it chelated or dissociated gadolinium? How can we tell? Magn. Reson. Imaging 2016, 34, 1377–1382. [Google Scholar] [CrossRef]
  61. Frenzel, T.; Apte, C.; Jost, G.; Schöckel, L.; Lohrke, J.; Pietsch, H. Quantification and assessment of the chemical form of residual gadolinium in the brain after repeated administration of gadolinium-based contrast agents: Comparative study in rats. Invest. Radiol. 2017, 52, 396–404. [Google Scholar] [CrossRef] [Green Version]
  62. Kanal, E. Gadolinium based contrast agents (GBCA): Safety overview after 3 decades of clinical experience. Magn. Reson. Imaging 2016, 34, 1341–1345. [Google Scholar] [CrossRef] [PubMed]
  63. Grobner, T.; Prischl, F.C. Gadolinium and nephrogenic systemic fibrosis. Kidney Int. 2007, 72, 260–264. [Google Scholar] [CrossRef] [PubMed] [Green Version]
Figure 1. (a) Synthesis of FA-PA, (b) one-pot polyol synthesis of FA-PAA-Gd2O3 nanoparticles, and (c) synthesis of cRGD/FA-PAA-Gd2O3 nanoparticles.
Pharmaceutics 14 01458 g001aPharmaceutics 14 01458 g001b
Figure 2. TEM images of (a-i,a-ii) FA-PAA-Gd2O3 and (b-i,b-ii) cRGD/FA-PAA-Gd2O3 nanoparticles at 20 and 2 nm scales. The yellow circles indicate individual nanoparticles. (c) Log-normal function fit of the observed particle diameter distributions to estimate davg values. EDS spectra of (d) FA-PAA-Gd2O3 and (e) cRGD/FA-PAA-Gd2O3 nanoparticles to confirm presence of C, O, N, and Gd in the nanoparticles.
Pharmaceutics 14 01458 g002
Figure 3. DLS patterns of the FA-PAA-Gd2O3 and cRGD/FA-PAA-Gd2O3 nanoparticles in (a-i) aqueous media and (a-ii) physiological solution (0.9 NaCl wt.% in water); the aavg values as estimated using log-normal function fits to the observed DLS patterns. DLS patterns were measured three times; (, , ) for FA-PAA-Gd2O3 nanoparticles and (, , ) for cRGD/FA-PAA-Gd2O3 nanoparticles. (b) Zeta potentials of the FA-PAA-Gd2O3 and cRGD/FA-PAA-Gd2O3 nanoparticles in aqueous media. (c) FA-PAA-Gd2O3 and cRGD/FA-PAA-Gd2O3 nanoparticles in aqueous media, exhibiting excellent colloidal stability (no precipitation for >1 year after synthesis). (d) Tyndall effect, confirming the colloidal dispersion of the FA-PAA-Gd2O3 and cRGD/FA-PAA-Gd2O3 nanoparticles in aqueous media; no laser light scattering is observed in triple-distilled water. Arrows indicate laser light scattering by the nanoparticle colloids.
Pharmaceutics 14 01458 g003aPharmaceutics 14 01458 g003b
Figure 4. XRD patterns of the FA-PAA-Gd2O3 and cRGD/FA-PAA-Gd2O3 nanoparticles before (i.e., as-prepared) and after TGA. The representative assignments on XRD peaks after TGA are the (hkl) Miller indices of cubic Gd2O3. All observed peaks could be assigned with the (hkl) Miller indices of cubic Gd2O3.
Pharmaceutics 14 01458 g004
Figure 5. (a) FT-IR absorption spectra of PAA, FA, cRGD, FA-PAA-Gd2O3, and cRGD/FA-PAA-Gd2O3 nanoparticles. (b) TGA curves of the FA-PAA-Gd2O3 and cRGD/FA-PAA-Gd2O3 nanoparticles.
Pharmaceutics 14 01458 g005
Figure 6. Nonlinear least-square fits to (a-i) the measured mean signal intensities at various TI values to obtain T1 relaxation times and (a-ii) the mean signal intensities of multiple spin-echo measurements at various TE values to obtain T2 relaxation times. (b) Plots of 1/T1 and 1/T2 inverse relaxation times as a function of Gd concentration for FA-PAA-Gd2O3 and cRGD/FA-PAA-Gd2O3 nanoparticles in aqueous media at H = 3.0 T and 22 °C. The slopes correspond to r1 and r2 values, respectively. (c) R1 and R2 map images showing dose-dependent contrast enhancements.
Pharmaceutics 14 01458 g006
Figure 7. Plots showing viability of (a) NCTC1469 (normal) and (b) U87MG (tumor) cells after 48 h of incubation with FA-PAA-Gd2O3 and cRGD/FA-PAA-Gd2O3 nanoparticles.
Pharmaceutics 14 01458 g007
Figure 8. T1 MR images at a 3.0 T MR field as a function of time before (labeled as “Pre”) and after intravenous injection of aqueous FA-PAA-Gd2O3 and cRGD/FA-PAA-Gd2O3 nanoparticle suspension samples into mice tails. “T” denotes the tumor, “A” denotes the aorta, “K” denotes the kidneys, and “L” denotes the liver. The regions of interest (ROIs) are labeled with small dots.
Pharmaceutics 14 01458 g008
Figure 9. Plots and comparison of T1-contrast ROIs between the FA-PAA-Gd2O3 and cRGD/FA-PAA-Gd2O3 nanoparticles in (a) the tumor, (b) aorta, (c) kidneys, and (d) liver as a function of time before and after intravenous injection of the nanoparticle suspension samples into mice tails. T1-contrast ROI = SNR (t)/SNR (0).
Pharmaceutics 14 01458 g009
Figure 10. Schematic diagram showing enhanced tumor imaging by the cRGD/FA-PAA-Gd2O3 nanoparticles (right) compared with the FA-PAA-Gd2O3 nanoparticles (left).
Pharmaceutics 14 01458 g010
Table 1. Physicochemical properties of FA-PAA-Gd2O3 and cRGD/FA-PAA-Gd2O3 nanoparticles.
Nanoparticle Sampledavg
(nm)
aavg
(nm)
ζ
(mV)
Surface Coating
P aGd2O3 Nanoparticleσ bNNP c
(wt.%)(wt.%)(1/nm2)
TGAEATGAEATGAEATGAEA
FA-PAA-Gd2O31.711.4−33.947.552.448.147.60.60.75.56.1
cRGD/FA-PAA-Gd2O31.713.8−16.651.356.8 45.543.20.60.75.86.8
a Average ligand surface-coating amount in wt.%. b Grafting density, i.e., average number of ligands (FA-PAA or cRGD/FA-PAA) coating a unit surface area of a nanoparticle. c Average number of ligands coating a nanoparticle.
Table 2. r1 and r2 values of FA-PAA-Gd2O3 and cRGD/FA-PAA-Gd2O3 nanoparticles.
ChemicalWater Proton Spin Relaxivities in Aqueous Media at 3.0 T
(s−1 mM−1)
Ref.
r1r2r2/r1
FA-PAA-Gd2O312.022.41.9This work
cRGD/FA-PAA-Gd2O311.220.61.8This work
Gd-DTPA3.13.71.2[49]
Gd-DOTA2.83.31.2[49]
Publisher’s Note: MDPI stays neutral with regard to jurisdictional claims in published maps and institutional affiliations.

