
Transfection by Electroporation of Cancer and Primary Cells Using Nanosecond and Microsecond Electric Fields

 , ,
, ,
Abstract
:1. Introduction
2. Materials and Methods
2.1. Electroporation Setup and Parameters
2.2. Cell Culture
2.3. In Vitro Generation of Bone Marrow Dendritic Cells (BMDCs)
2.4. Cell Permeabilization
2.5. Cell Electrotransfection
2.6. Plasmid Restriction
2.7. CHO-K1 Stable Transfection
2.8. Bioluminescence Detection Assay
2.9. Viability Assay
2.10. Fluorescence Microscopy
2.11. Statistical Analysis
3. Results
3.1. PEF-Induced Electropermeabilization
3.2. Electrotransfection of CHO-K1 Cell Line
3.3. Electrotransfection of 4T1 Cell Line
3.4. Electrotransfection of Primary Murine DCs
3.5. Viability Results
3.6. CHO-K1-Stable Transfection with pcDNA3.1(+)/Luc2 = tdT Plasmid
4. Discussion
5. Conclusions
Author Contributions
Funding
Institutional Review Board Statement
Informed Consent Statement
Data Availability Statement
Conflicts of Interest
References
- Carlsten, M.; Childs, R.W. Genetic Manipulation of NK Cells for Cancer Immunotherapy: Techniques and Clinical Implications. Front. Immunol. 2015, 6, 266. [Google Scholar] [CrossRef] [PubMed] [Green Version]
- Boissel, L.; Betancur, M.; Wels, W.S.; Tuncer, H.; Klingemann, H. Transfection with mRNA for CD19 specific chimeric antigen receptor restores NK cell mediated killing of CLL cells. Leuk. Res. 2009, 33, 1255–1259. [Google Scholar] [CrossRef] [PubMed] [Green Version]
- Kotnik, T.; Kramar, P.; Pucihar, G.; Miklavčič, D.; Tarek, M. Cell membrane electroporation—Part 1: The phenomenon. IEEE Electr. Insul. Mag. 2012, 28, 14–23. [Google Scholar] [CrossRef] [Green Version]
- Kumar, A.R.K.; Shou, Y.; Chan, B.; Krishaa, L.; Tay, A. Materials for Improving Immune Cell Transfection. Adv. Mater. 2021, 33, 2007421. [Google Scholar] [CrossRef]
- Vaessen, E.M.J.; Timmermans, R.A.H.; Tempelaars, M.H.; Schutyser, M.A.I.; den Besten, H.M.W. Reversibility of membrane permeabilization upon pulsed electric field treatment in Lactobacillus plantarum WCFS1. Sci. Rep. 2019, 9, 19990. [Google Scholar] [CrossRef] [PubMed]
- Li, L.H.; Ross, P.; Hui, S.W. Improving electrotransfection efficiency by post-pulse centrifugation. Gene Ther. 1999, 6, 364–372. [Google Scholar] [CrossRef] [PubMed] [Green Version]
- Sherba, J.J.; Hogquist, S.; Lin, H.; Shan, J.W.; Shreiber, D.I.; Zahn, J.D. The effects of electroporation buffer composition on cell viability and electro-transfection efficiency. Sci. Rep. 2020, 10, 3053. [Google Scholar] [CrossRef] [Green Version]
- Golzio, M.; Mora, M.-P.; Raynaud, C.; Delteil, C.; Teissie, J.; Rols, M.-P. Control by Osmotic Pressure of Voltage-Induced Permeabilization and Gene Transfer in Mammalian Cells. Biophys. J. 1998, 74, 3015–3022. [Google Scholar] [CrossRef] [Green Version]
- Desai, P.; Yagnik, B.; Sharma, D.; Khan, A.; Desai, N.; Padh, H. Transfecting CHO-K1 Cells: Comparison of CaPO4, Electroporation and Lipoplex Method with In-house Prepared Polyplex. Indian J. Pharm. Sci. 2017, 79, 655–662. [Google Scholar] [CrossRef]
- Čegovnik, U.; Novaković, S. Setting optimal parameters for in vitro electrotransfection of B16F1, SA1, LPB, SCK, L929 and CHO cells using predefined exponentially decaying electric pulses. Bioelectrochemistry 2004, 62, 73–82. [Google Scholar] [CrossRef]
- Van Meirvenne, S.; Straetman, L.; Heirman, C.; Dullaers, M.; De Greef, C.; Van Tendeloo, V.; Thielemans, K. Efficient genetic modification of murine dendritic cells by electroporation with mRNA. Cancer Gene Ther. 2002, 9, 787–797. [Google Scholar] [CrossRef] [PubMed] [Green Version]
- Chopra, S.; Ruzgys, P.; Maciulevičius, M.; Jakutavičiūtė, M.; Šatkauskas, S. Investigation of Plasmid DNA Delivery and Cell Viability Dynamics for Optimal Cell Electrotransfection In Vitro. Appl. Sci. 2020, 10, 6070. [Google Scholar] [CrossRef]
- Lesueur, L.L.; Mir, L.M.; André, F.M. Overcoming the Specific Toxicity of Large Plasmids Electrotransfer in Primary Cells In Vitro. Mol. Ther. Nucleic Acids 2016, 5, e291. [Google Scholar] [CrossRef] [PubMed] [Green Version]
- Novickij, V.; Balevičiūtė, A.; Ruzgys, P.; Šatkauskas, S.; Novickij, J.; Zinkevičienė, A.; Girkontaitė, I. Sub-microsecond electrotransfection using new modality of high frequency electroporation. Bioelectrochemistry 2020, 136, 107594. [Google Scholar] [CrossRef] [PubMed]
- Chopinet, L.; Batista-Napotnik, T.; Montigny, A.; Rebersek, M.; Teissié, J.; Rols, M.-P.; Miklavčič, D. Nanosecond Electric Pulse Effects on Gene Expression. J. Membr. Biol. 2013, 246, 851–859. [Google Scholar] [CrossRef] [PubMed] [Green Version]
- Čepurnienė, K.; Ruzgys, P.; Treinys, R.; Šatkauskienė, I.; Šatkauskas, S. Influence of Plasmid Concentration on DNA Electrotransfer In Vitro Using High-Voltage and Low-Voltage Pulses. J. Membr. Biol. 2010, 236, 81–85. [Google Scholar] [CrossRef] [PubMed]
- Radzevičiūtė, E.; Murauskas, A.; Ruzgys, P.; Šatkauskas, S.; Girkontaitė, I.; Novickij, J.; Novickij, V. Dielectrophoretic Manipulation of Cell Transfection Efficiency during Electroporation Using a Center Needle Electrode. Appl. Sci. 2021, 11, 7015. [Google Scholar] [CrossRef]
- Fus-Kujawa, A.; Prus, P.; Bajdak-Rusinek, K.; Teper, P.; Gawron, K.; Kowalczuk, A.; Sieron, A.L. An Overview of Methods and Tools for Transfection of Eukaryotic Cells in vitro. Front. Bioeng. Biotechnol. 2021, 9, 634. [Google Scholar] [CrossRef]
- Ruzgys, P.; Šatkauskas, S. Cell electrotransfection and viability dependence on electrotransfection and viability dependence on electoporation medium. Biologija 2016, 62, 98–104. [Google Scholar] [CrossRef] [Green Version]
- Cukjati, D.; Batiuškaitė, D.; André, F.; Miklavčič, D.; Mir, L.M. Real time electroporation control for accurate and safe in vivo non-viral gene therapy. Bioelectrochemistry 2007, 70, 501–507. [Google Scholar] [CrossRef]
- Zhang, B.; Liu, F.; Fang, Z.; Ding, L.; Moser, M.A.J.; Zhang, W. An in vivo study of a custom-made high-frequency irreversible electroporation generator on different tissues for clinically relevant ablation zones. Int. J. Hyperth. 2021, 38, 593–603. [Google Scholar] [CrossRef] [PubMed]
- Guo, S.; Jackson, D.L.; Burcus, N.I.; Chen, Y.-J.; Xiao, S.; Heller, R. Gene electrotransfer enhanced by nanosecond pulsed electric fields. Mol. Ther. Methods Clin. Dev. 2014, 1, 14043. [Google Scholar] [CrossRef] [PubMed]
- Ruzgys, P.; Novickij, V.; Novickij, J.; Šatkauskas, S. Nanosecond range electric pulse application as a non-viral gene delivery method: Proof of concept. Sci. Rep. 2018, 8, 15502. [Google Scholar] [CrossRef] [PubMed]
- Cools, N.; Van Tendeloo, V.F.I.; Smits, E.L.J.M.; Lenjou, M.; Nijs, G.; Van Bockstaele, D.R.; Berneman, Z.N.; Ponsaerts, P. Immunosuppression induced by immature dendritic cells is mediated by TGF-β/IL-10 double-positive CD4+ regulatory T cells. J. Cell. Mol. Med. 2008, 12, 690–700. [Google Scholar] [CrossRef] [Green Version]
- Tibúrcio, R.; Nunes, S.; Nunes, I.; Ampuero, M.R.; Silva, I.B.; Lima, R.; Tavares, N.M.; Brodskyn, C. Molecular Aspects of Dendritic Cell Activation in Leishmaniasis: An Immunobiological View. Front. Immunol. 2019, 10, 227. [Google Scholar] [CrossRef] [Green Version]
- Mastelic-Gavillet, B.; Balint, K.; Boudousquie, C.; Gannon, P.O.; Kandalaft, L.E. Personalized dendritic cell vaccines-recent breakthroughs and encouraging clinical results. Front. Immunol. 2019, 10, 766. [Google Scholar] [CrossRef] [Green Version]
- Cella, M.; Salio, M.; Sakakibara, Y.; Langen, H.; Julkunen, I.; Lanzavecchia, A. Maturation, Activation, and Protection of Dendritic Cells Induced by Double-stranded RNA. J. Exp. Med. 1999, 189, 821–829. [Google Scholar] [CrossRef] [Green Version]
- Michiels, A.; Tuyaerts, S.; Bonehill, A.; Corthals, J.; Breckpot, K.; Heirman, C.; Van Meirvenne, S.; Dullaers, M.; Allard, S.; Brasseur, F.; et al. Electroporation of immature and mature dendritic cells: Implications for dendritic cell-based vaccines. Gene Ther. 2005, 12, 772–782. [Google Scholar] [CrossRef] [Green Version]
- Fite, R.F.; Creusot, R.J. Nanoparticles versus Dendritic Cells as Vehicles to Deliver mRNA Encoding Multiple Epitopes for Immunotherapy. Mol. Ther. Methods Clin. Dev. 2020, 16, 50–62. [Google Scholar] [CrossRef] [Green Version]
- The Application of Electroporation to Transfect Hematopoietic Cells and to Deliver Drugs and Vaccines Transcutaneously for Cancer Treatment. Available online: www.tcrt.org (accessed on 30 March 2022).
- Javorovic, M.; Pohla, H.; Frankenberger, B.; Wölfel, T.; Schendel, D.J. RNA Transfer by Electroporation into Mature Dendritic Cells Leading to Reactivation of Effector-Memory Cytotoxic T Lymphocytes: A Quantitative Analysis. Mol. Ther. 2005, 12, 734–743. [Google Scholar] [CrossRef]
- Imamura, T.; Saitou, T.; Kawakami, R. In vivo optical imaging of cancer cell function and tumor microenvironment. Cancer Sci. 2018, 109, 912–918. [Google Scholar] [CrossRef] [PubMed]
- Xu, Q.; Zhang, J.; Telfer, B.A.; Zhang, H.; Ali, N.; Chen, F.; Risa, B.; Pearson, A.J.; Zhang, W.; Finegan, K.G.; et al. The extracellular-regulated protein kinase 5 (ERK5) enhances metastatic burden in triple-negative breast cancer through focal adhesion protein kinase (FAK)-mediated regulation of cell adhesion. Oncogene 2021, 40, 3929–3941. [Google Scholar] [CrossRef] [PubMed]
- Horibe, T.; Torisawa, A.; Akiyoshi, R.; Hatta-Ohashi, Y.; Suzuki, H.; Kawakami, K. Transfection efficiency of normal and cancer cell lines and monitoring of promoter activity by single-cell bioluminescence imaging. Luminescence 2014, 29, 96–100. [Google Scholar] [CrossRef] [PubMed]
- Condeelis, J.; Weissleder, R. In Vivo Imaging in Cancer. Cold Spring Harb. Perspect. Biol. 2010, 2, a003848. [Google Scholar] [CrossRef] [PubMed] [Green Version]
- Novickij, V.; Grainys, A.; Butkus, P.; Tolvaišienė, S.; Švedienė, J.; Paškevičius, A.; Novickij, J. High-frequency submicrosecond electroporator. Biotechnol. Biotechnol. Equip. 2016, 30, 607–613. [Google Scholar] [CrossRef] [Green Version]
- Maes, W.; Rosas, G.G.; Verbinnen, B.; Boon, L.; De Vleeschouwer, S.; Ceuppens, J.L.; Van Gool, S.W. DC vaccination with anti-CD25 treatment leads to long-term immunity against experimental glioma. Neuro-Oncology 2009, 11, 529–542. [Google Scholar] [CrossRef] [Green Version]
- Lutz, M.B.; Kukutsch, N.; Ogilvie, A.L.; Rößner, S.; Koch, F.; Romani, N.; Schuler, G. An advanced culture method for generating large quantities of highly pure dendritic cells from mouse bone marrow. J. Immunol. Methods 1999, 223, 77–92. [Google Scholar] [CrossRef]
- Baert, T.; Garg, A.D.; Vindevogel, E.; Van Hoylandt, A.; Verbist, G.; Agostinis, P.; Vergote, I.; Coosemans, A.N.; Agonistinis, P. In Vitro Generation of Murine Dendritic Cells for Cancer Immunotherapy: An Optimized Protocol. Anticancer Res. 2016, 36, 5793–5802. [Google Scholar] [CrossRef] [Green Version]
- Patel, M.R.; Chang, Y.-F.; Chen, I.Y.; Bachmann, M.; Yan, X.; Contag, C.; Gambhir, S.S. Longitudinal, Noninvasive Imaging of T-Cell Effector Function and Proliferation in Living Subjects. Cancer Res. 2010, 70, 10141–10149. [Google Scholar] [CrossRef] [Green Version]
- Wang, Y.; Yang, Y.; Yoshitomi, T.; Kawazoe, N.; Yang, Y.; Chen, G. Regulation of gene transfection by cell size, shape and elongation on micropatterned surfaces. J. Mater. Chem. B 2021, 9, 4329–4339. [Google Scholar] [CrossRef]
- Flanagan, M.; Gimble, J.M.; Yu, G.; Wu, X.; Xia, X.; Hu, J.; Yao, S.; Li, S. Competitive electroporation formulation for cell therapy. Cancer Gene Ther. 2011, 18, 579–586. [Google Scholar] [CrossRef] [PubMed] [Green Version]
- Van Tendeloo, V.; Ponsaerts, P.; Lardon, F.; Nijs, G.; Lenjou, M.; Van Broeckhoven, C.; Van Bockstaele, D.R.; Berneman, Z.N. Highly efficient gene delivery by mRNA electroporation in human hematopoietic cells: Superiority to lipofection and passive pulsing of mRNA and to electroporation of plasmid cDNA for tumor antigen loading of dendritic cells. Blood 2001, 98, 49–56. [Google Scholar] [CrossRef] [PubMed]
- Chung, D.J.; Romano, E.; Pronschinske, K.B.; A Shyer, J.; Mennecozzi, M.; Angelo, E.T.S.; Young, J.W. Langerhans-type and monocyte-derived human dendritic cells have different susceptibilities to mRNA electroporation with distinct effects on maturation and activation: Implications for immunogenicity in dendritic cell-based immunotherapy. J. Transl. Med. 2013, 11, 166. [Google Scholar] [CrossRef] [PubMed] [Green Version]
- Potter, H.; Heller, R. Transfection by electroporation. Curr. Protoc. Immunol. 2018, 2018, 9.3.1–9.3.13. [Google Scholar] [CrossRef] [PubMed]
- Garcia, P.A.; Rossmeisl, J.H.; Neal, R.E.; Ellis, T.L.; Davalos, R.V. A parametric study delineating irreversible electroporation from thermal damage based on a minimally invasive intracranial procedure. BioMed. Eng. 2011, 10, 34. [Google Scholar] [CrossRef] [Green Version]
- Ruzgys, P.; Novickij, V.; Novickij, J.; Šatkauskas, S. Influence of the electrode material on ROS generation and electroporation efficiency in low and high frequency nanosecond pulse range. Bioelectrochemistry 2019, 127, 87–93. [Google Scholar] [CrossRef]
- Rubinsky, L.; Guenther, E.; Mikus, P.; Stehling, M.; Rubinsky, B. Electrolytic Effects during Tissue Ablation by Electroporation. Technol. Cancer Res. Treat. 2016, 15, NP95–NP103. [Google Scholar] [CrossRef] [Green Version]
- Yao, C.; Zhao, Y.; Mi, Y.; Dong, S.; Lv, Y.; Liu, H.; Wang, X.; Tang, L. Comparative Study of the Biological Responses to Conventional Pulse and High-Frequency Monopolar Pulse Bursts. IEEE Trans. Plasma Sci. 2017, 45, 2629–2638. [Google Scholar] [CrossRef]
- Mi, Y.; Xu, J.; Tang, X.; Bian, C.; Liu, H.; Yang, Q.; Tang, J. Scaling relationship of in vivo muscle contraction strength of rabbits exposed to high-frequency nanosecond pulse bursts. Technol. Cancer Res. Treat. 2018, 17, 1533033818788078. [Google Scholar] [CrossRef] [Green Version]
- Aycock, K.N.; Zhao, Y.; Lorenzo, M.F.; Davalos, R.V. A theoretical argument for extended interpulse delays in therapeutic high-frequency irreversible electroporation treatments. IEEE Trans. Biomed. Eng. 2021, 68, 1999–2010. [Google Scholar]
- Vižintin, A.; Marković, S.; Ščančar, J.; Miklavčič, D. Electroporation with nanosecond pulses and bleomycin or cisplatin results in efficient cell kill and low metal release from electrodes. Bioelectrochemistry 2021, 140, 107798. [Google Scholar] [CrossRef] [PubMed]


 and nanosecond
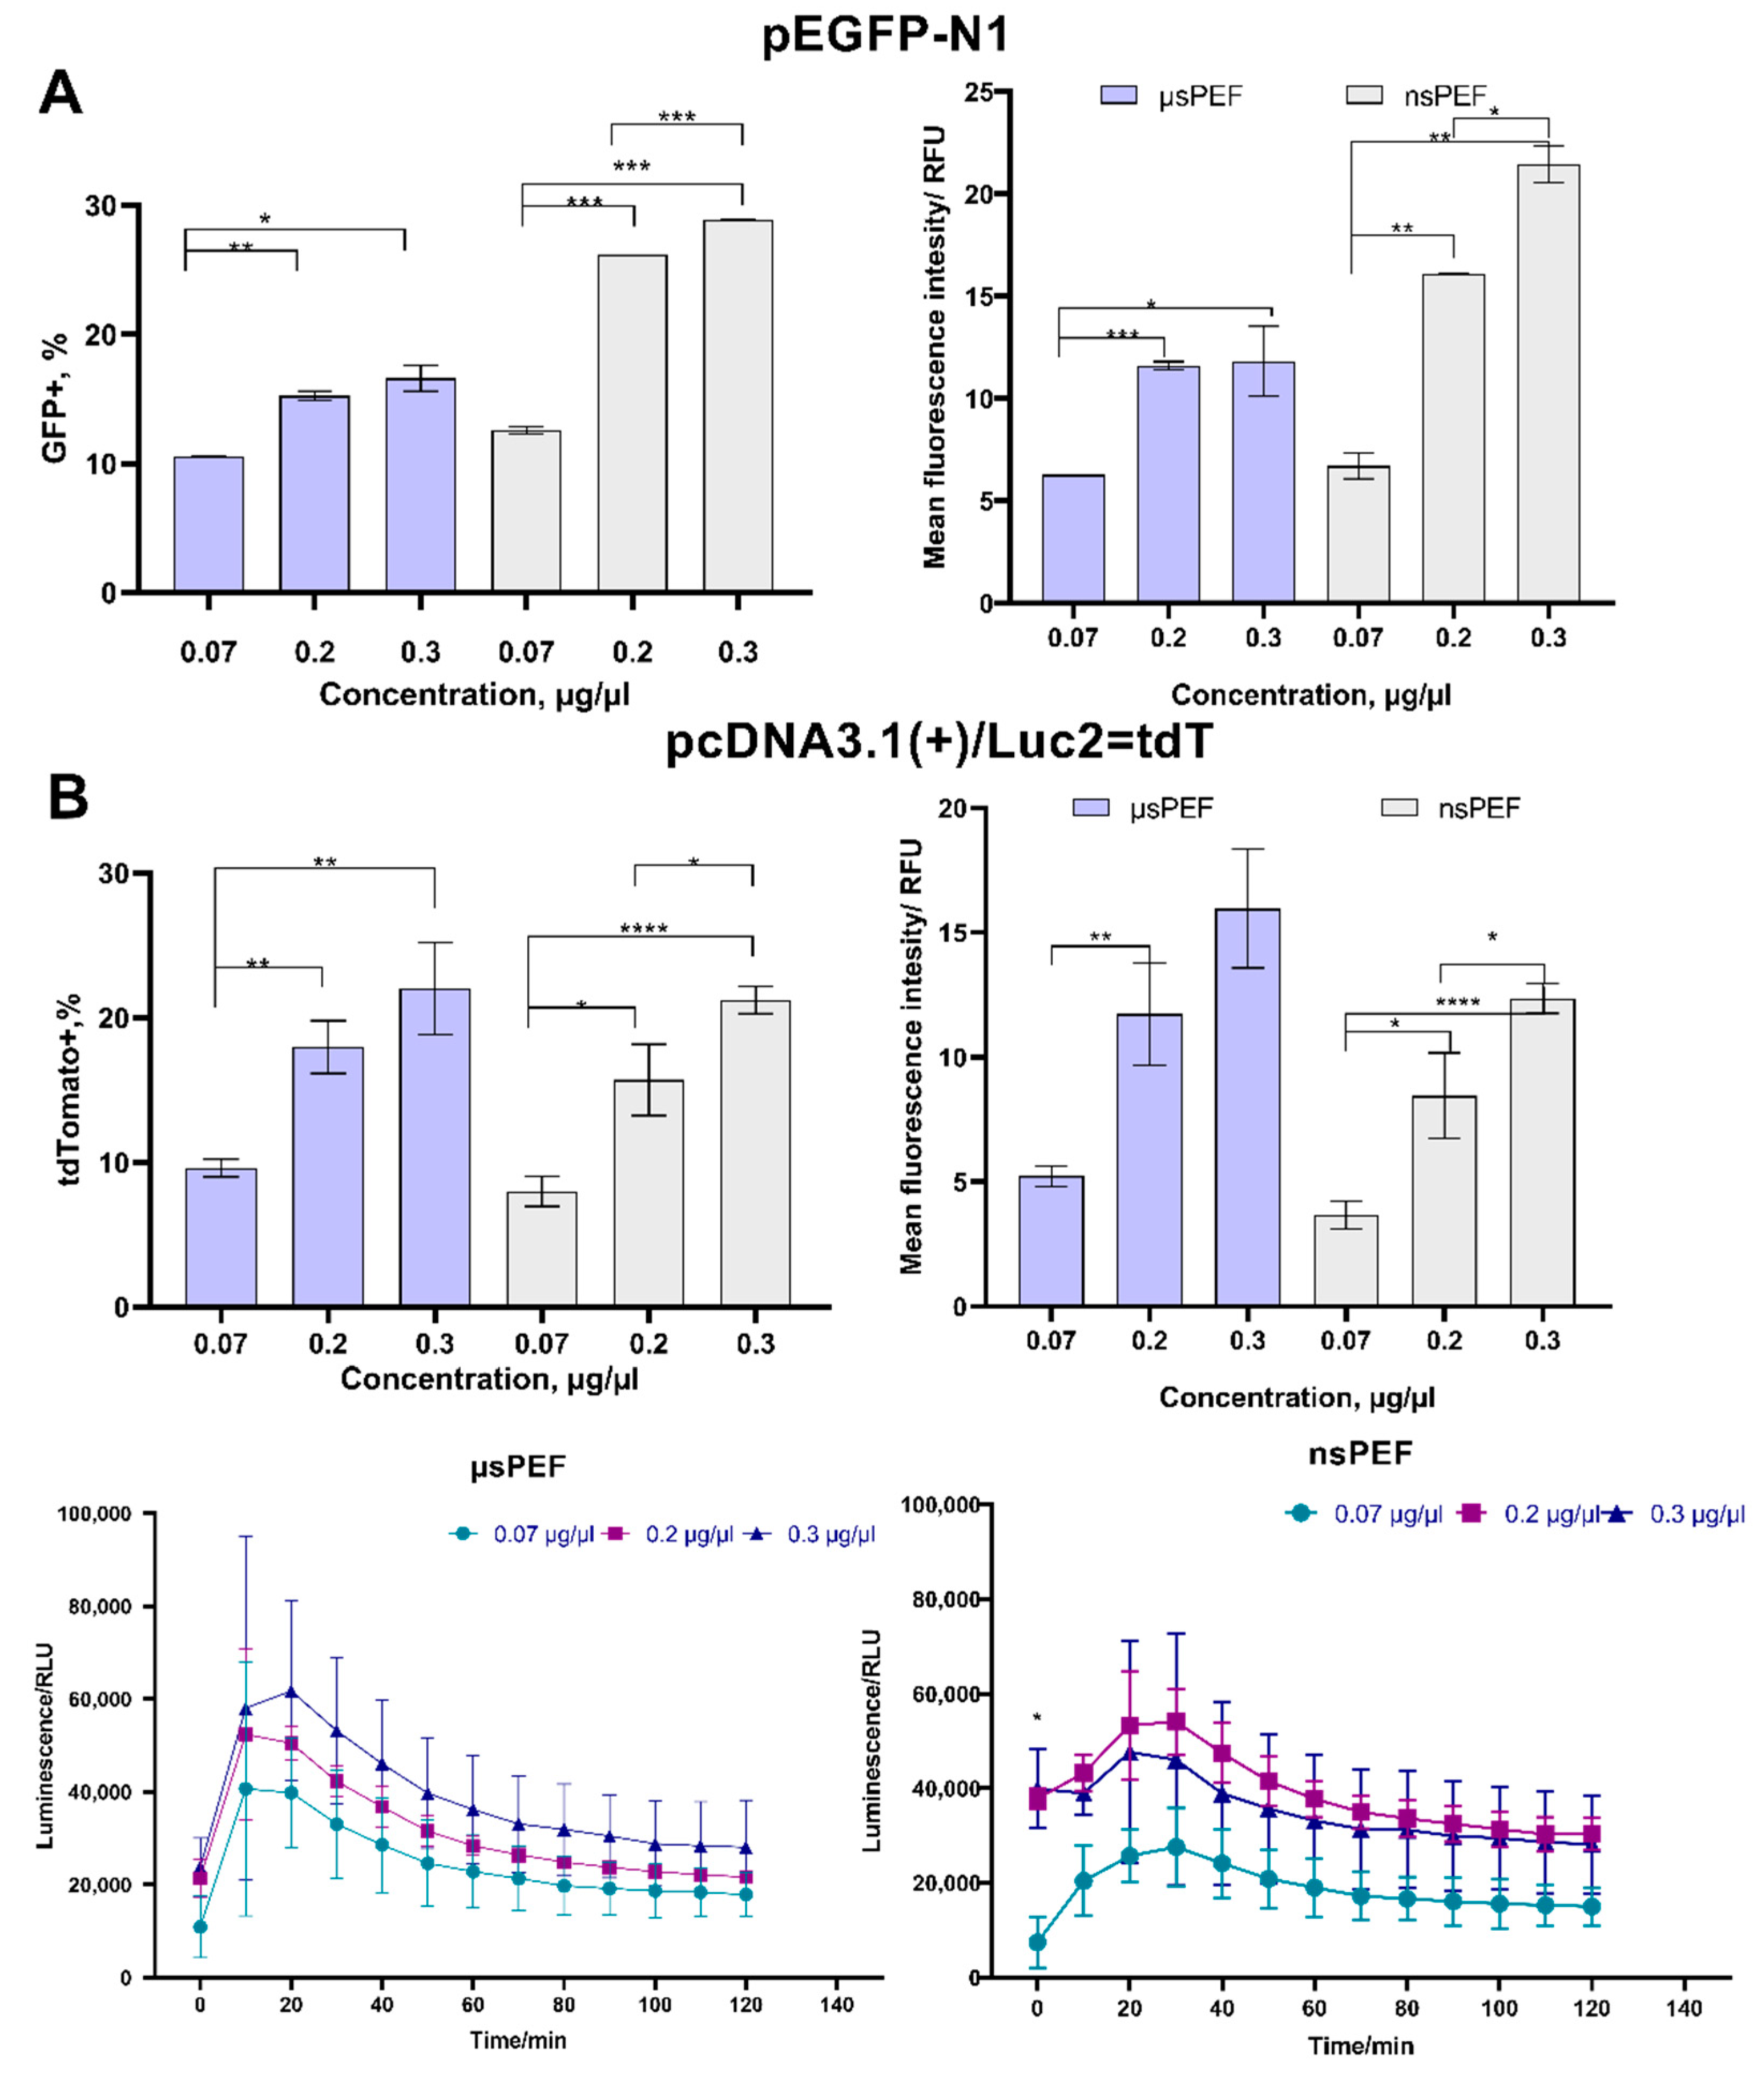
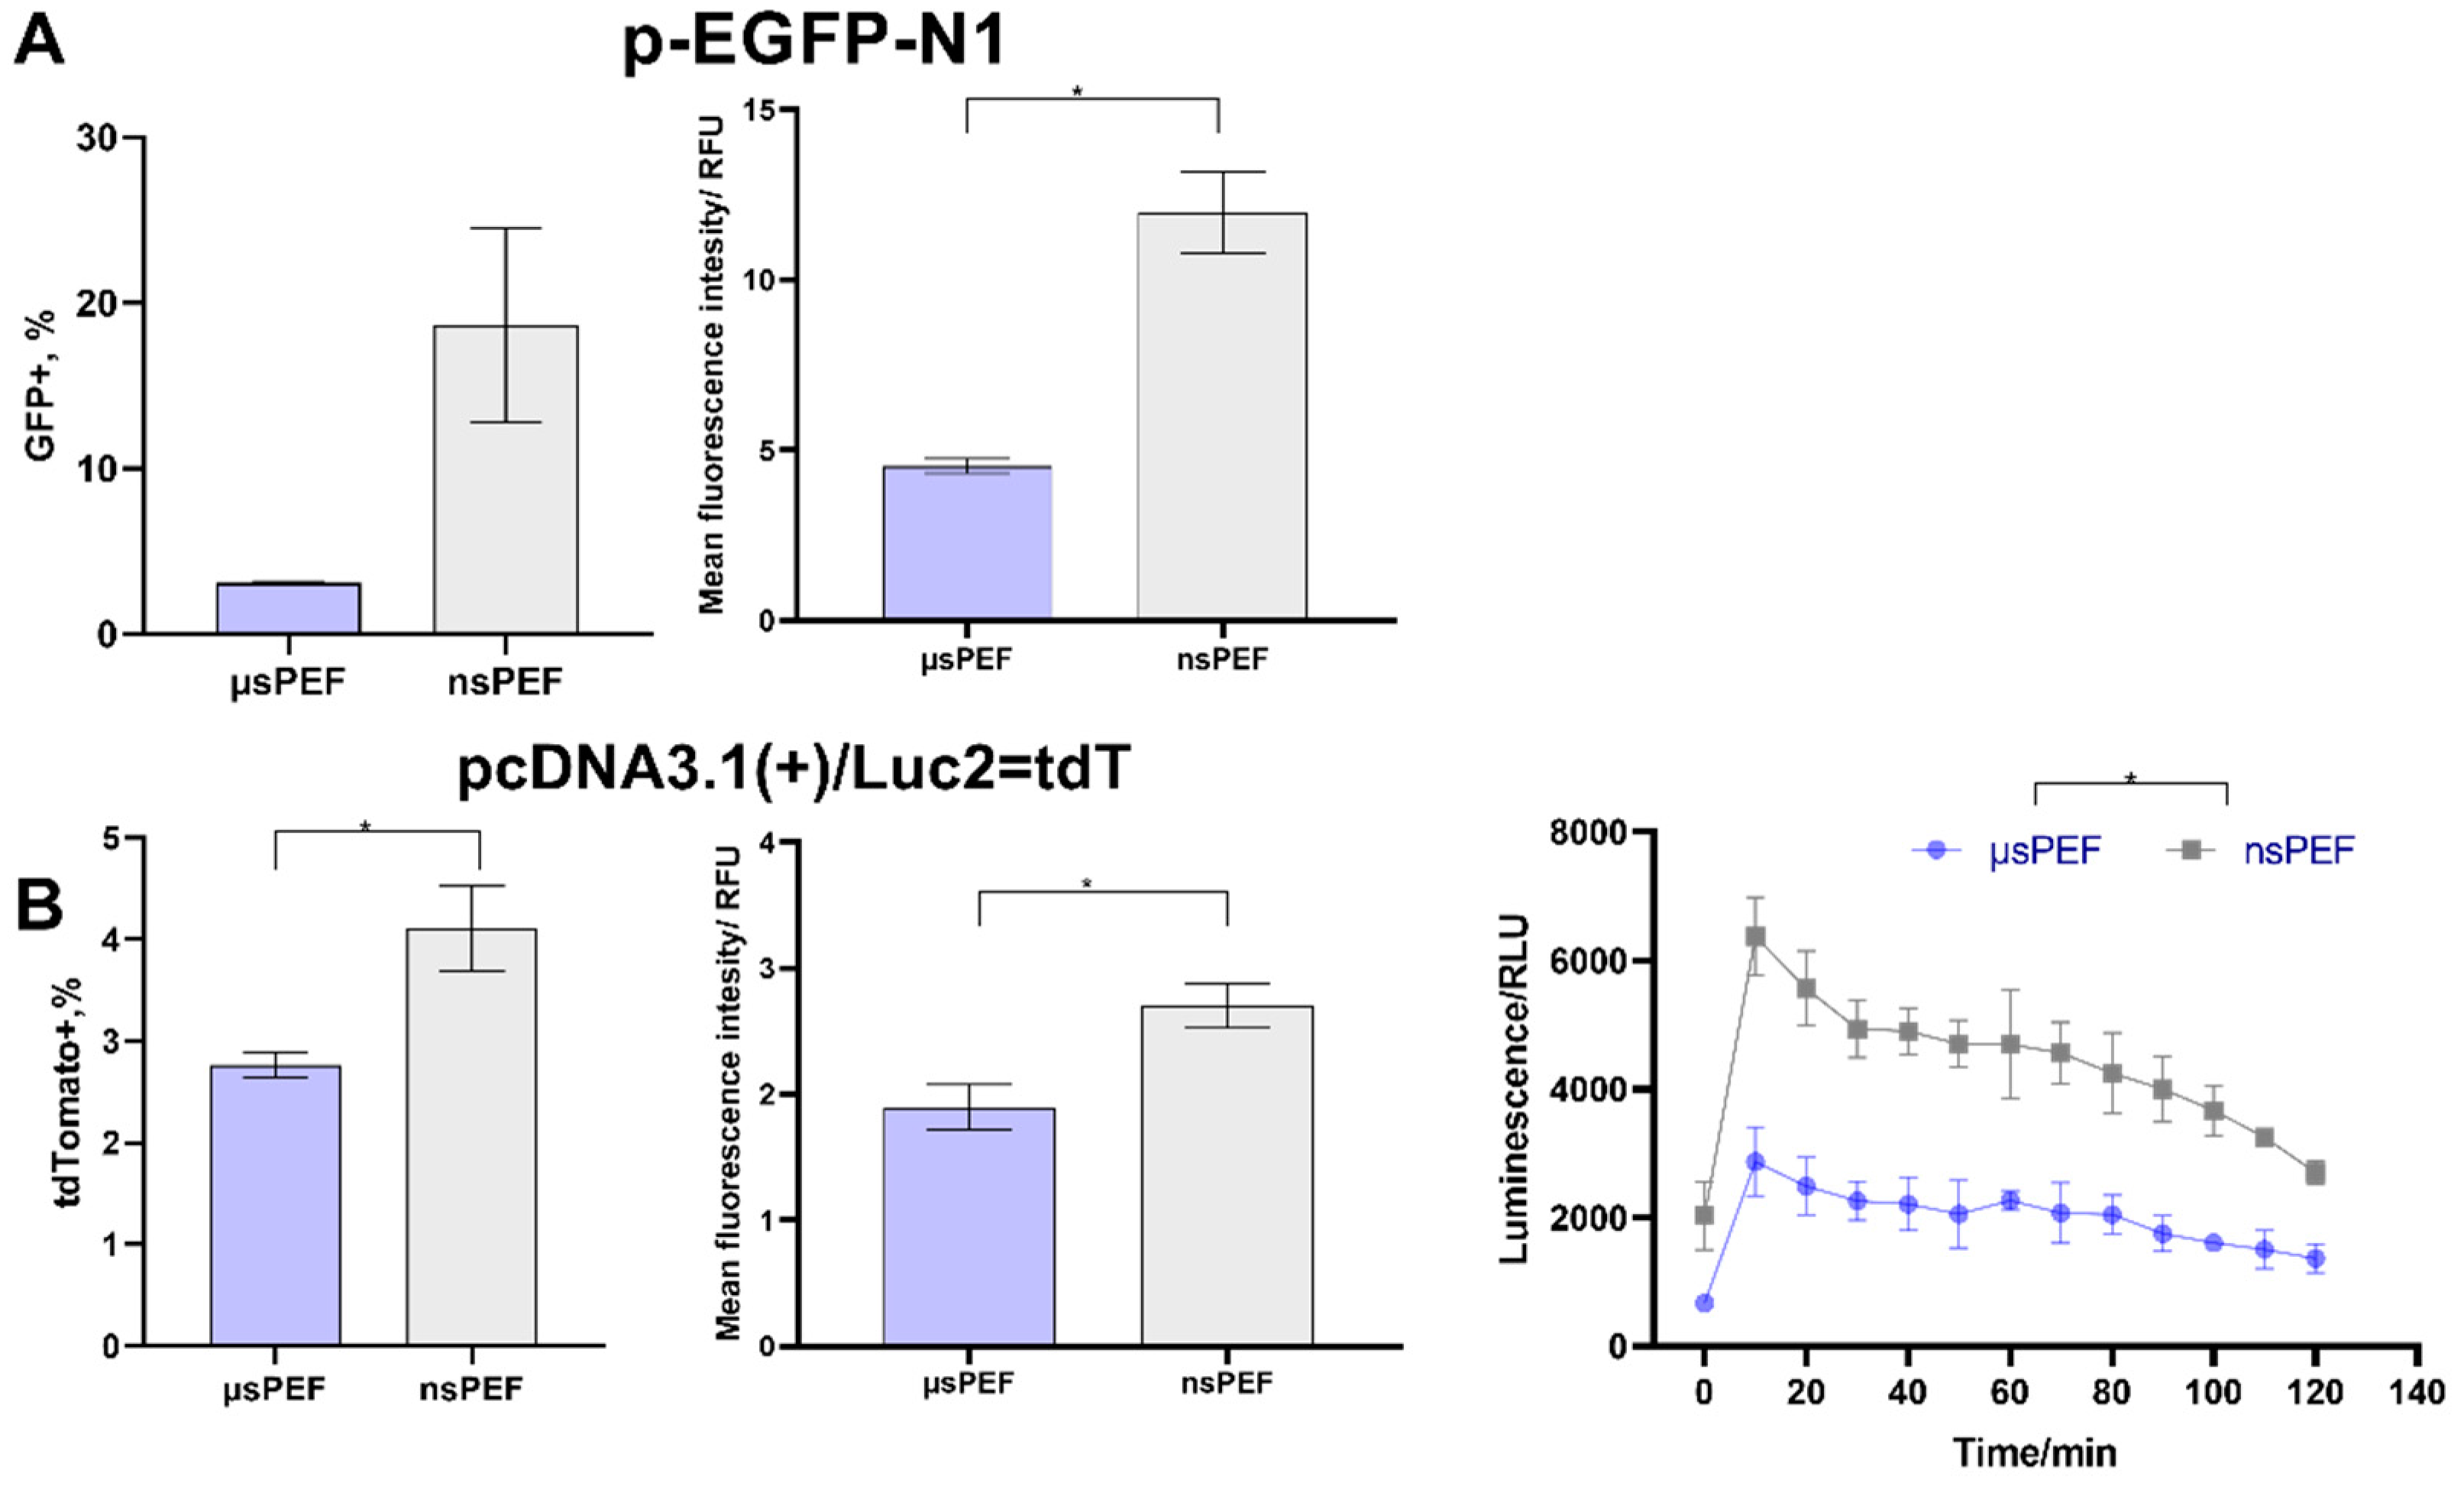
  electroporation, using (A) pEGFP-N1 plasmid and (B) pcDNA3.1(+)/Luc2 = tdT plasmid. The MFI was normalized to the negative control. Asterisk (*) corresponds to statistically significant (* p < 0.05; ** p < 0.01; *** p < 0.001; **** p < 0.0001) difference.
and nanosecond electroporation, using (A) pEGFP-N1 plasmid and (B) pcDNA3.1(+)/Luc2 = tdT plasmid. The MFI was normalized to the negative control. Asterisk (*) corresponds to statistically significant (* p < 0.05; ** p < 0.01; *** p < 0.001; **** p < 0.0001) difference.
electroporation, using (A) pEGFP-N1 plasmid and (B) pcDNA3.1(+)/Luc2 = tdT plasmid. The MFI was normalized to the negative control. Asterisk (*) corresponds to statistically significant (* p < 0.05; ** p < 0.01; *** p < 0.001; **** p < 0.0001) difference.
and nanosecond electroporation, using (A) pEGFP-N1 plasmid and (B) pcDNA3.1(+)/Luc2 = tdT plasmid. The MFI was normalized to the negative control. Asterisk (*) corresponds to statistically significant (* p < 0.05; ** p < 0.01; *** p < 0.001; **** p < 0.0001) difference. and nanosecond electroporation, using (A) pEGFP-N1 plasmid and (B) pcDNA3.1(+)/Luc2 = tdT plasmid. The MFI was normalized to negative control. Asterisk (*) corresponds to statistically significant difference (p < 0.05).
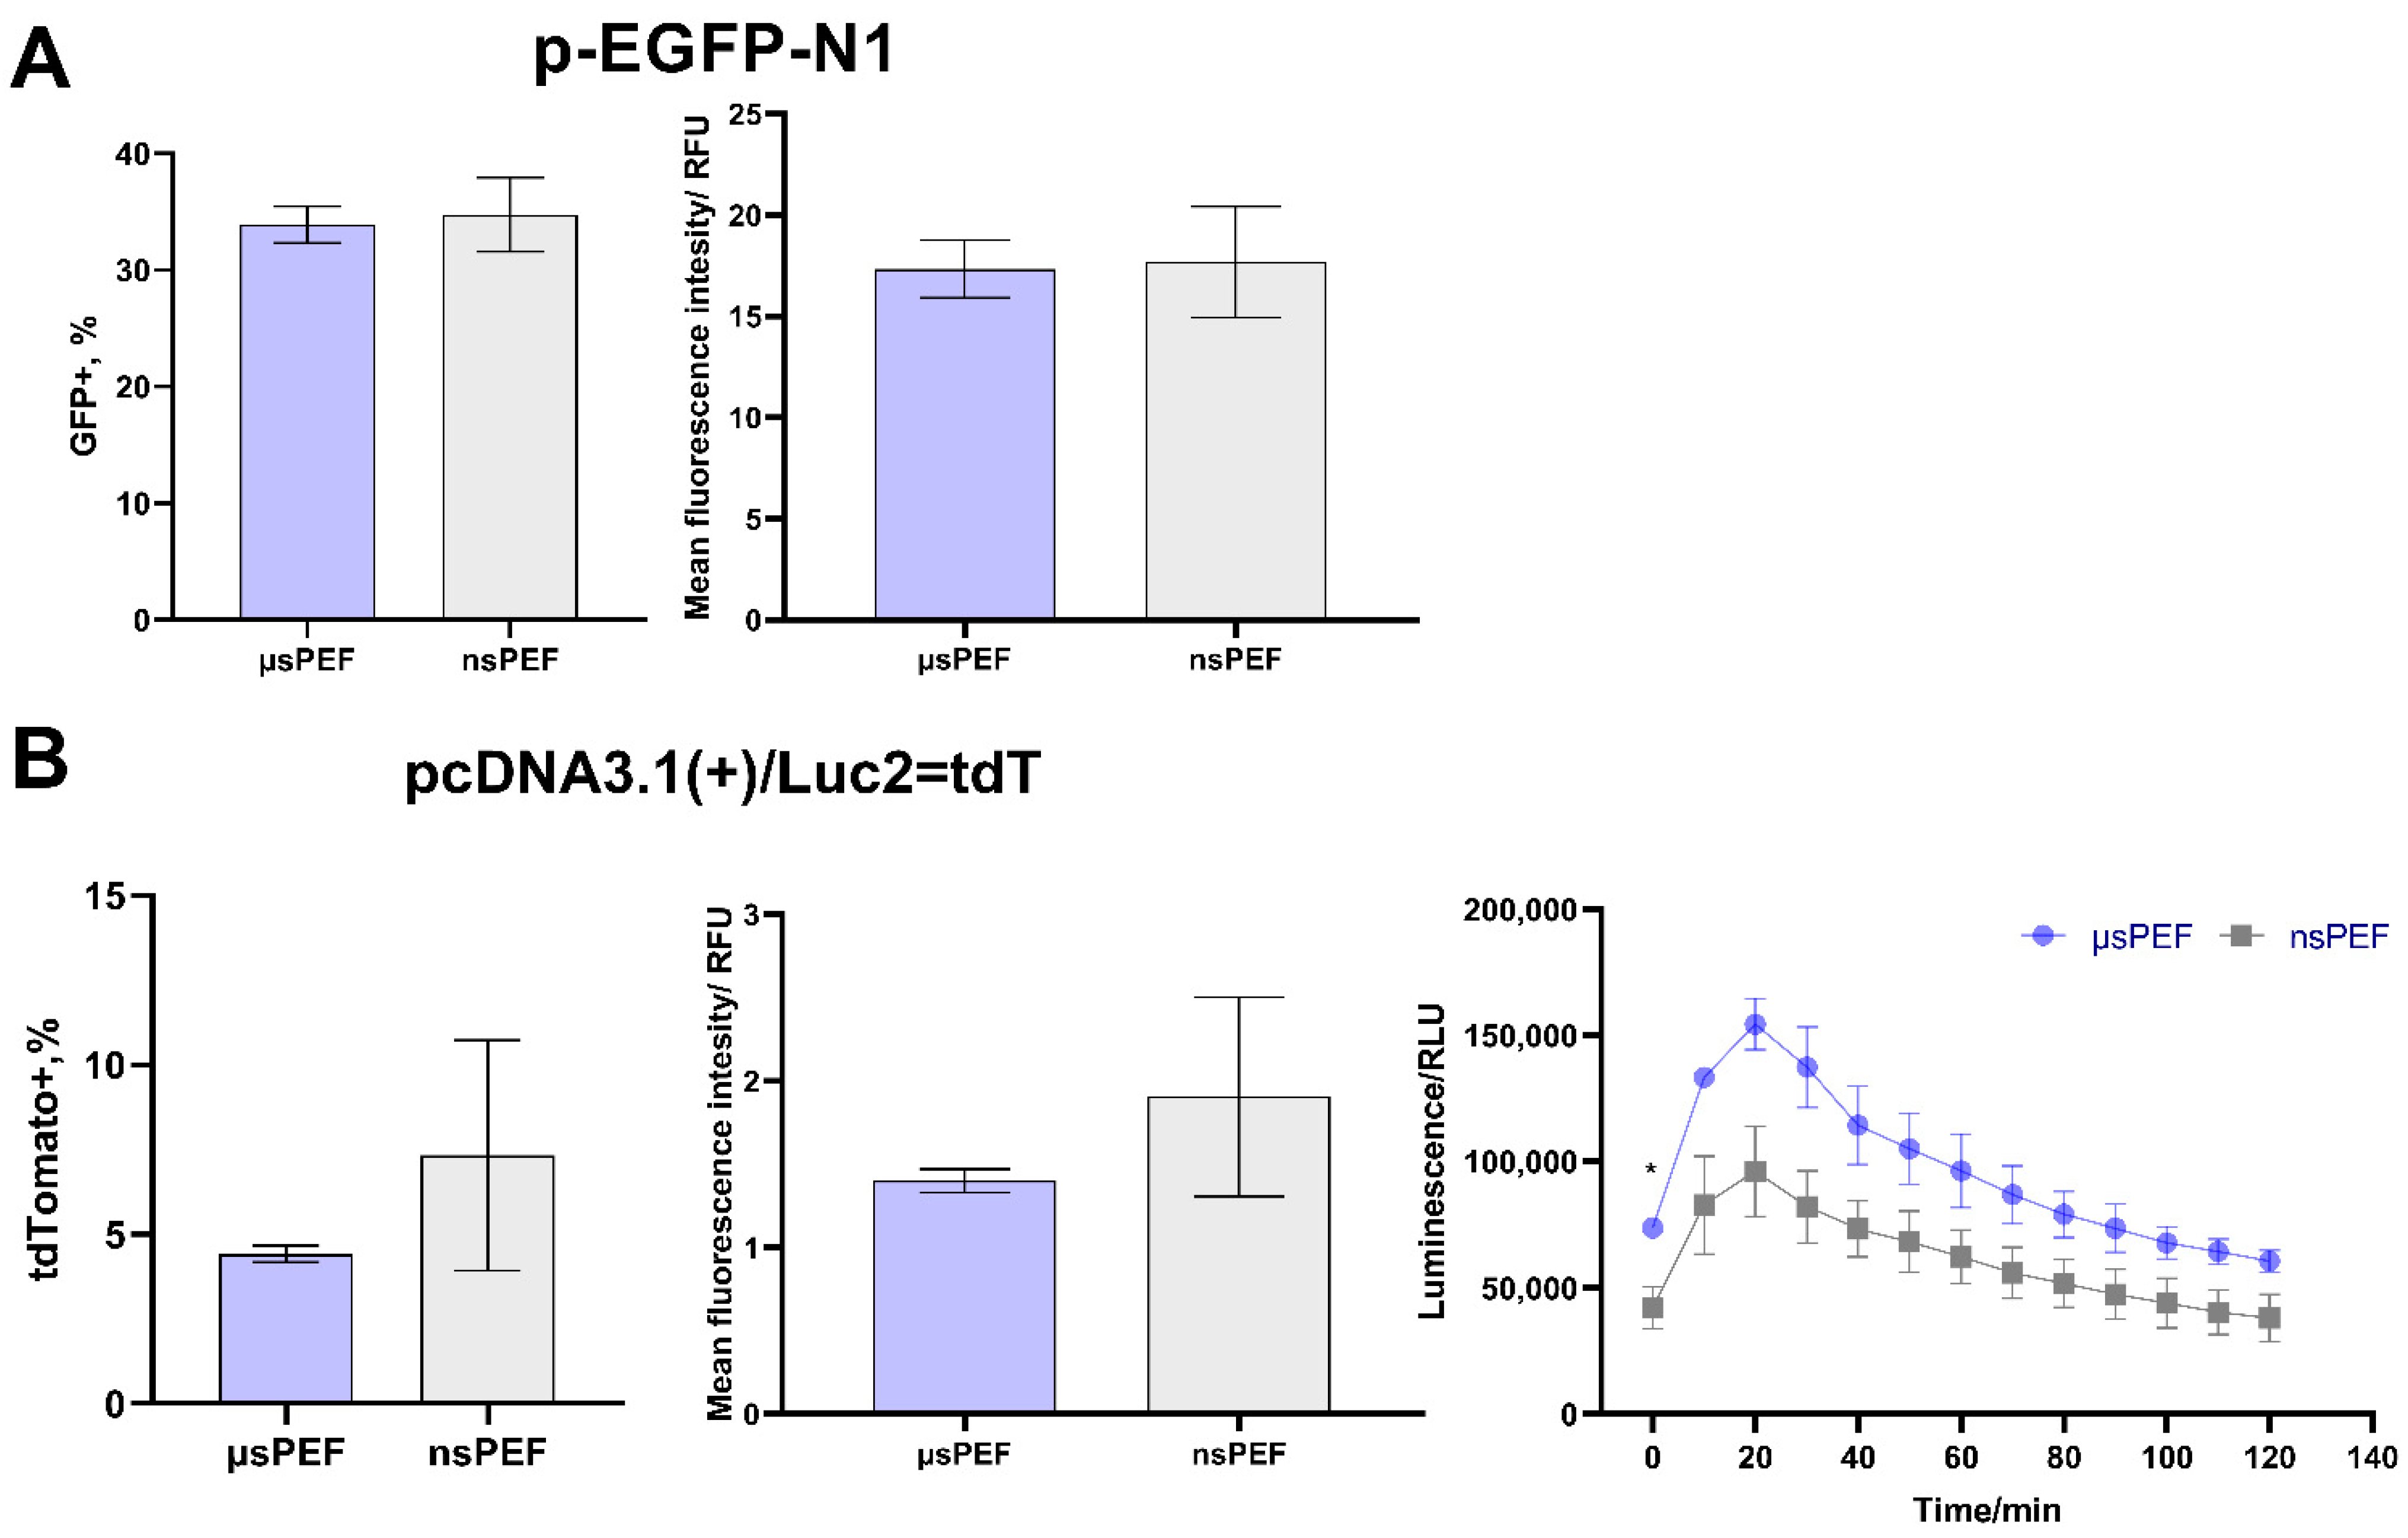
and nanosecond electroporation, using (A) pEGFP-N1 plasmid and (B) pcDNA3.1(+)/Luc2 = tdT plasmid. The MFI was normalized to negative control. Asterisk (*) corresponds to statistically significant difference (p < 0.05).
and nanosecond electroporation, using (A) pEGFP-N1 plasmid and (B) pcDNA3.1(+)/Luc2 = tdT plasmid. The MFI was normalized to negative control. Asterisk (*) corresponds to statistically significant difference (p < 0.05). and nanosecond electroporation, using (A) pEGFP-N1 plasmid and (B) pcDNA3.1(+)/Luc2 = tdT plasmid. The MFI was normalized to negative control. Asterisk (*) corresponds to statistically significant (p < 0.05) difference.
and nanosecond electroporation, using (A) pEGFP-N1 plasmid and (B) pcDNA3.1(+)/Luc2 = tdT plasmid. The MFI was normalized to negative control. Asterisk (*) corresponds to statistically significant (p < 0.05) difference.
and nanosecond electroporation, using (A) pEGFP-N1 plasmid and (B) pcDNA3.1(+)/Luc2 = tdT plasmid. The MFI was normalized to negative control. Asterisk (*) corresponds to statistically significant (p < 0.05) difference.


| Cells | CHO-K1 | 4T1 | DCs | |||
|---|---|---|---|---|---|---|
| Treatment | μsPEF | nsPEF | μsPEF | nsPEF | μsPEF | nsPEF |
| p-EGFP-N1 | 95 ± 3% | 94 ± 4% | 74 ± 3% | 96 ± 2% * | 65 ± 15% | 72 ± 8% |
| pcDNA3.1(+)/Luc2 = tdT | 94 ± 5% | 98 ± 4% | 70 ± 7% | 84 ± 5% * | 63 ± 5% | 73 ± 10% |
Publisher’s Note: MDPI stays neutral with regard to jurisdictional claims in published maps and institutional affiliations. |
© 2022 by the authors. Licensee MDPI, Basel, Switzerland. This article is an open access article distributed under the terms and conditions of the Creative Commons Attribution (CC BY) license (https://creativecommons.org/licenses/by/4.0/).
Share and Cite
Radzevičiūtė, E.; Malyško-Ptašinskė, V.; Novickij, J.; Novickij, V.; Girkontaitė, I. Transfection by Electroporation of Cancer and Primary Cells Using Nanosecond and Microsecond Electric Fields. Pharmaceutics 2022, 14, 1239. https://doi.org/10.3390/pharmaceutics14061239
Radzevičiūtė E, Malyško-Ptašinskė V, Novickij J, Novickij V, Girkontaitė I. Transfection by Electroporation of Cancer and Primary Cells Using Nanosecond and Microsecond Electric Fields. Pharmaceutics. 2022; 14(6):1239. https://doi.org/10.3390/pharmaceutics14061239
Chicago/Turabian StyleRadzevičiūtė, Eivina, Veronika Malyško-Ptašinskė, Jurij Novickij, Vitalij Novickij, and Irutė Girkontaitė. 2022. "Transfection by Electroporation of Cancer and Primary Cells Using Nanosecond and Microsecond Electric Fields" Pharmaceutics 14, no. 6: 1239. https://doi.org/10.3390/pharmaceutics14061239