
Peptide Targeted Gold Nanoplatform Carrying miR-145 Induces Antitumoral Effects in Ovarian Cancer Cells


 , and
, and 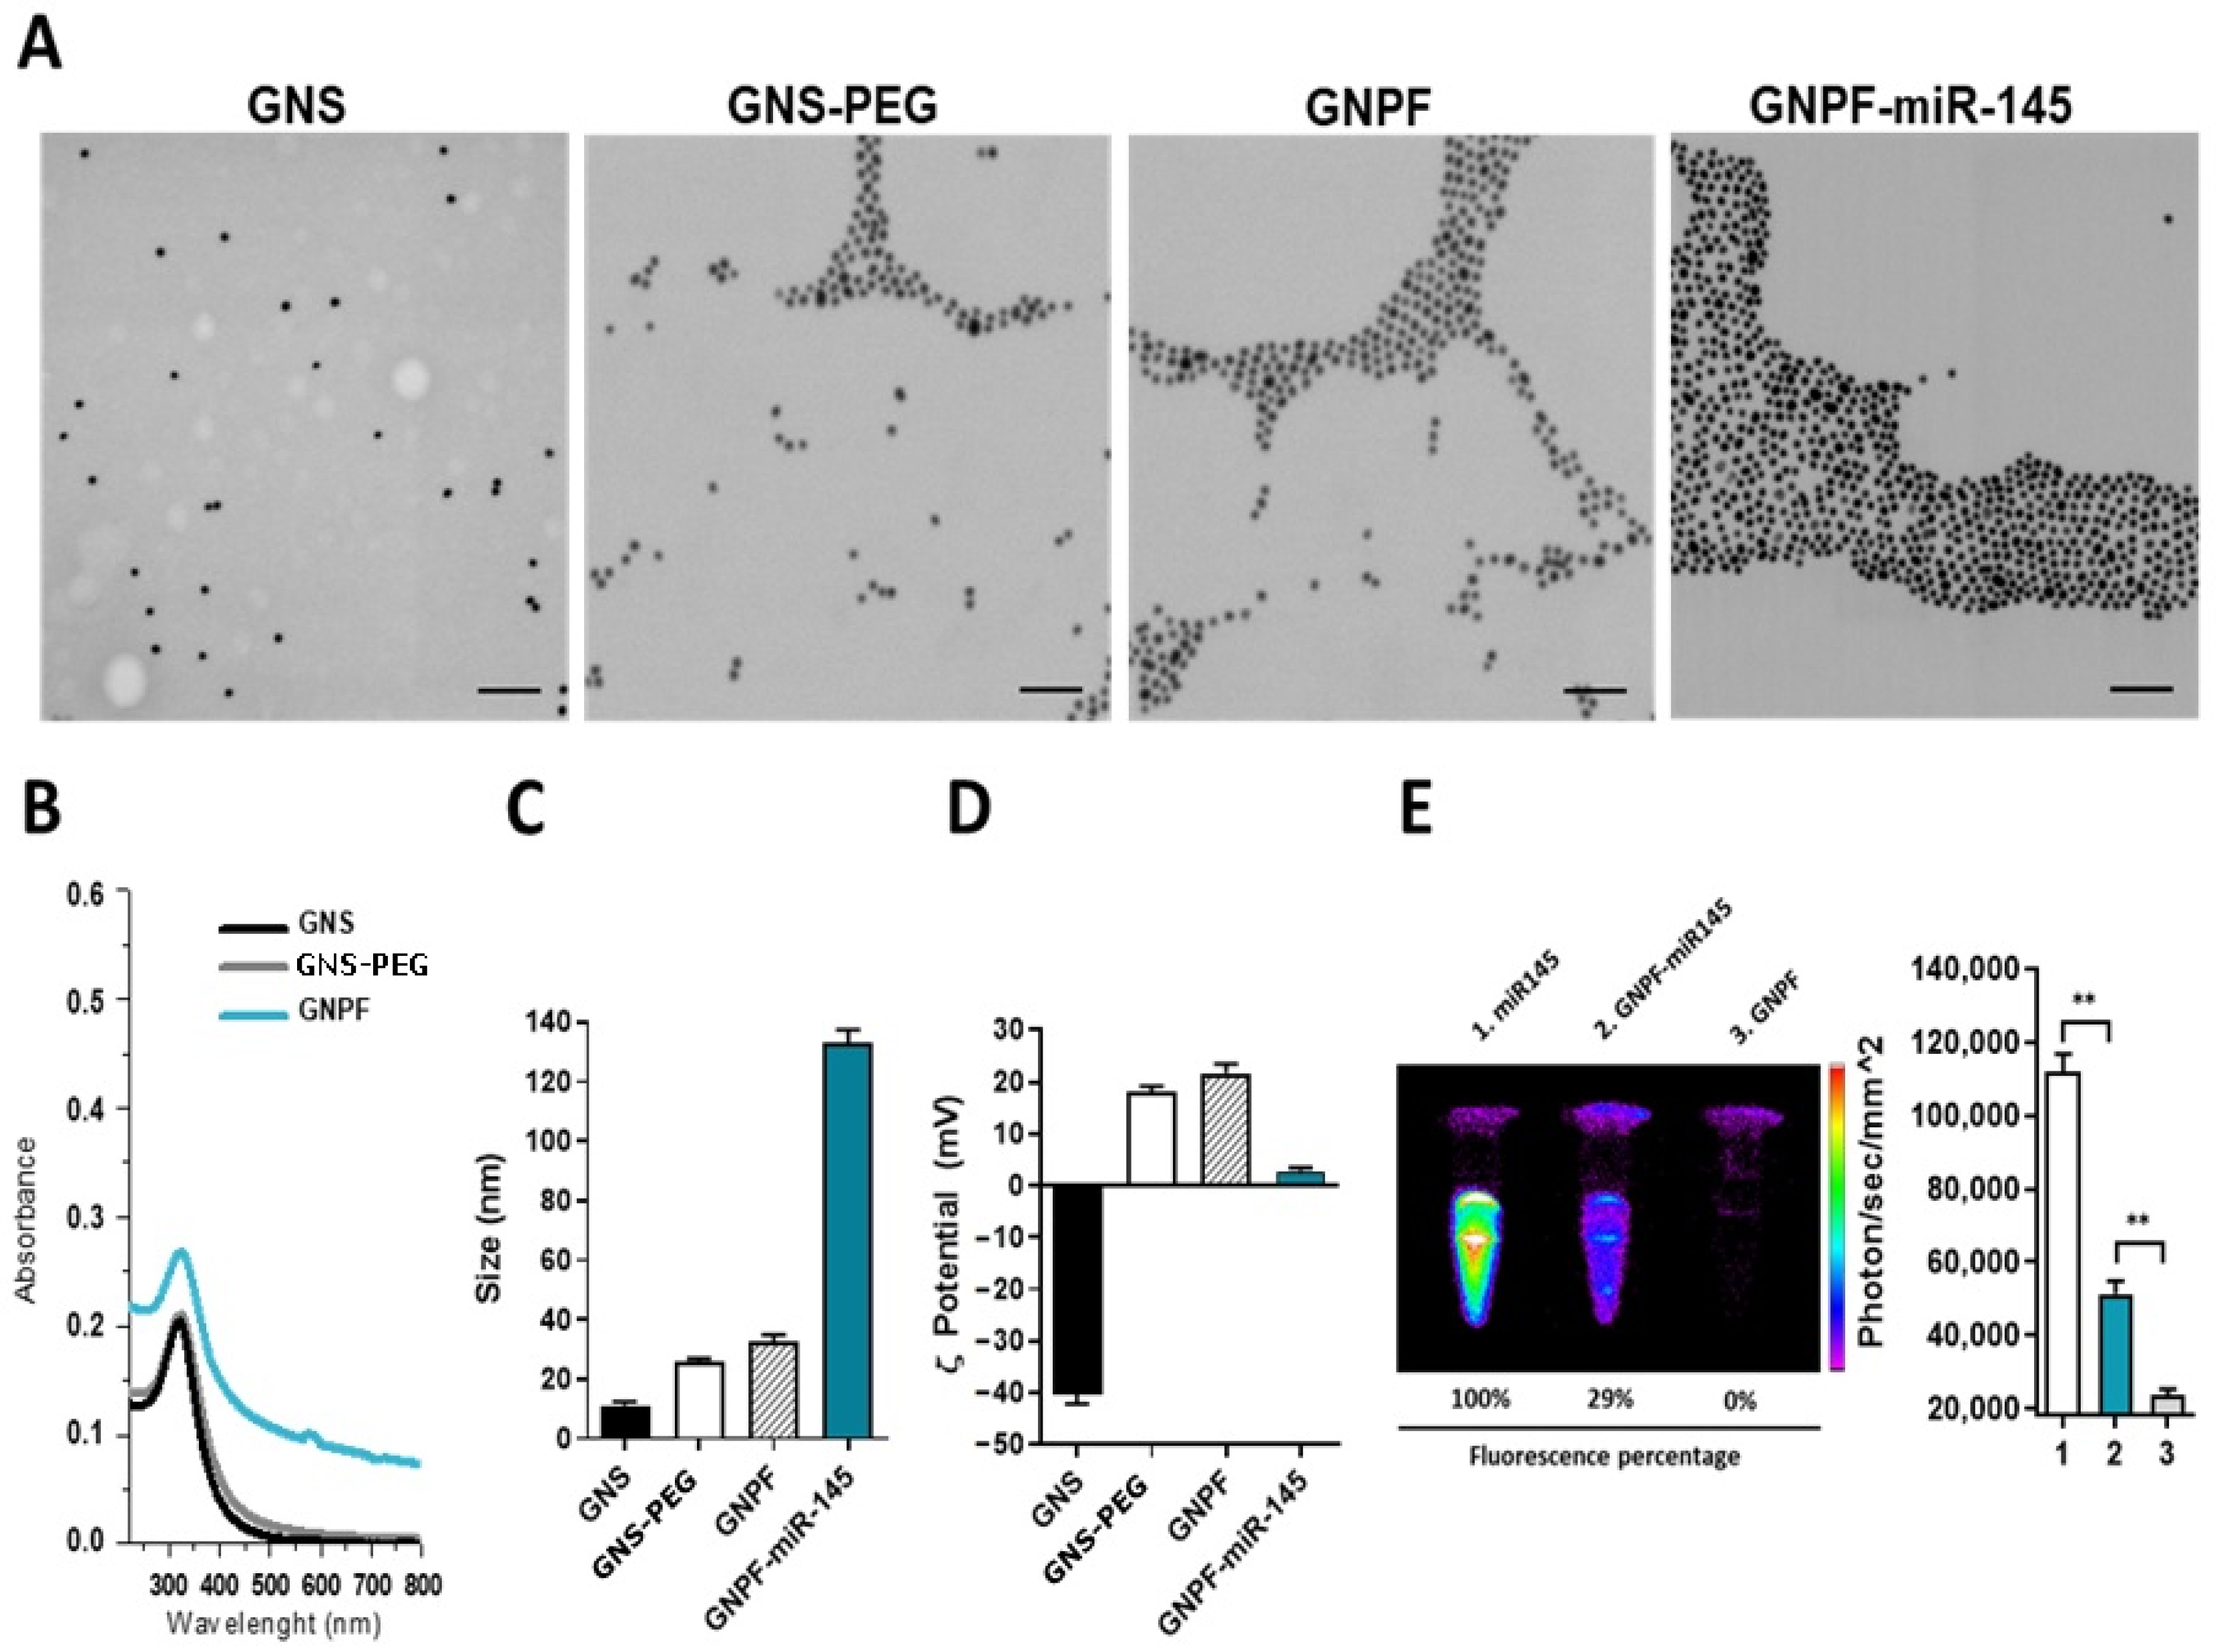
Abstract
:1. Introduction
2. Materials and Methods
2.1. Reagents
2.2. Gold Nanosystem Preparation
2.3. Molecular Absorption Spectrophotometry
2.4. Raman Spectroscopy
2.5. Dynamic Light Scattering (DLS)
2.6. Zeta Potential (ƺP)
2.7. Estimation of miR Coated on Nanoparticles
2.8. Scanning Transmission Electronic Microscopy (STEM)
2.9. Cell Viability
2.10. Nanoparticle Cell Incorporation
2.11. miR Quantification
2.12. Proliferation Assay
2.13. Wound Healing Assay
2.14. VEGF Release
2.15. Endothelial Cell (EA.hy926) Proliferation with Conditioned Medium from EOC Cells
2.16. Clonogenic Assay
2.17. Cancer Tumoroid Model
3. Results
3.1. Nanoplatform Obtention and Characterization
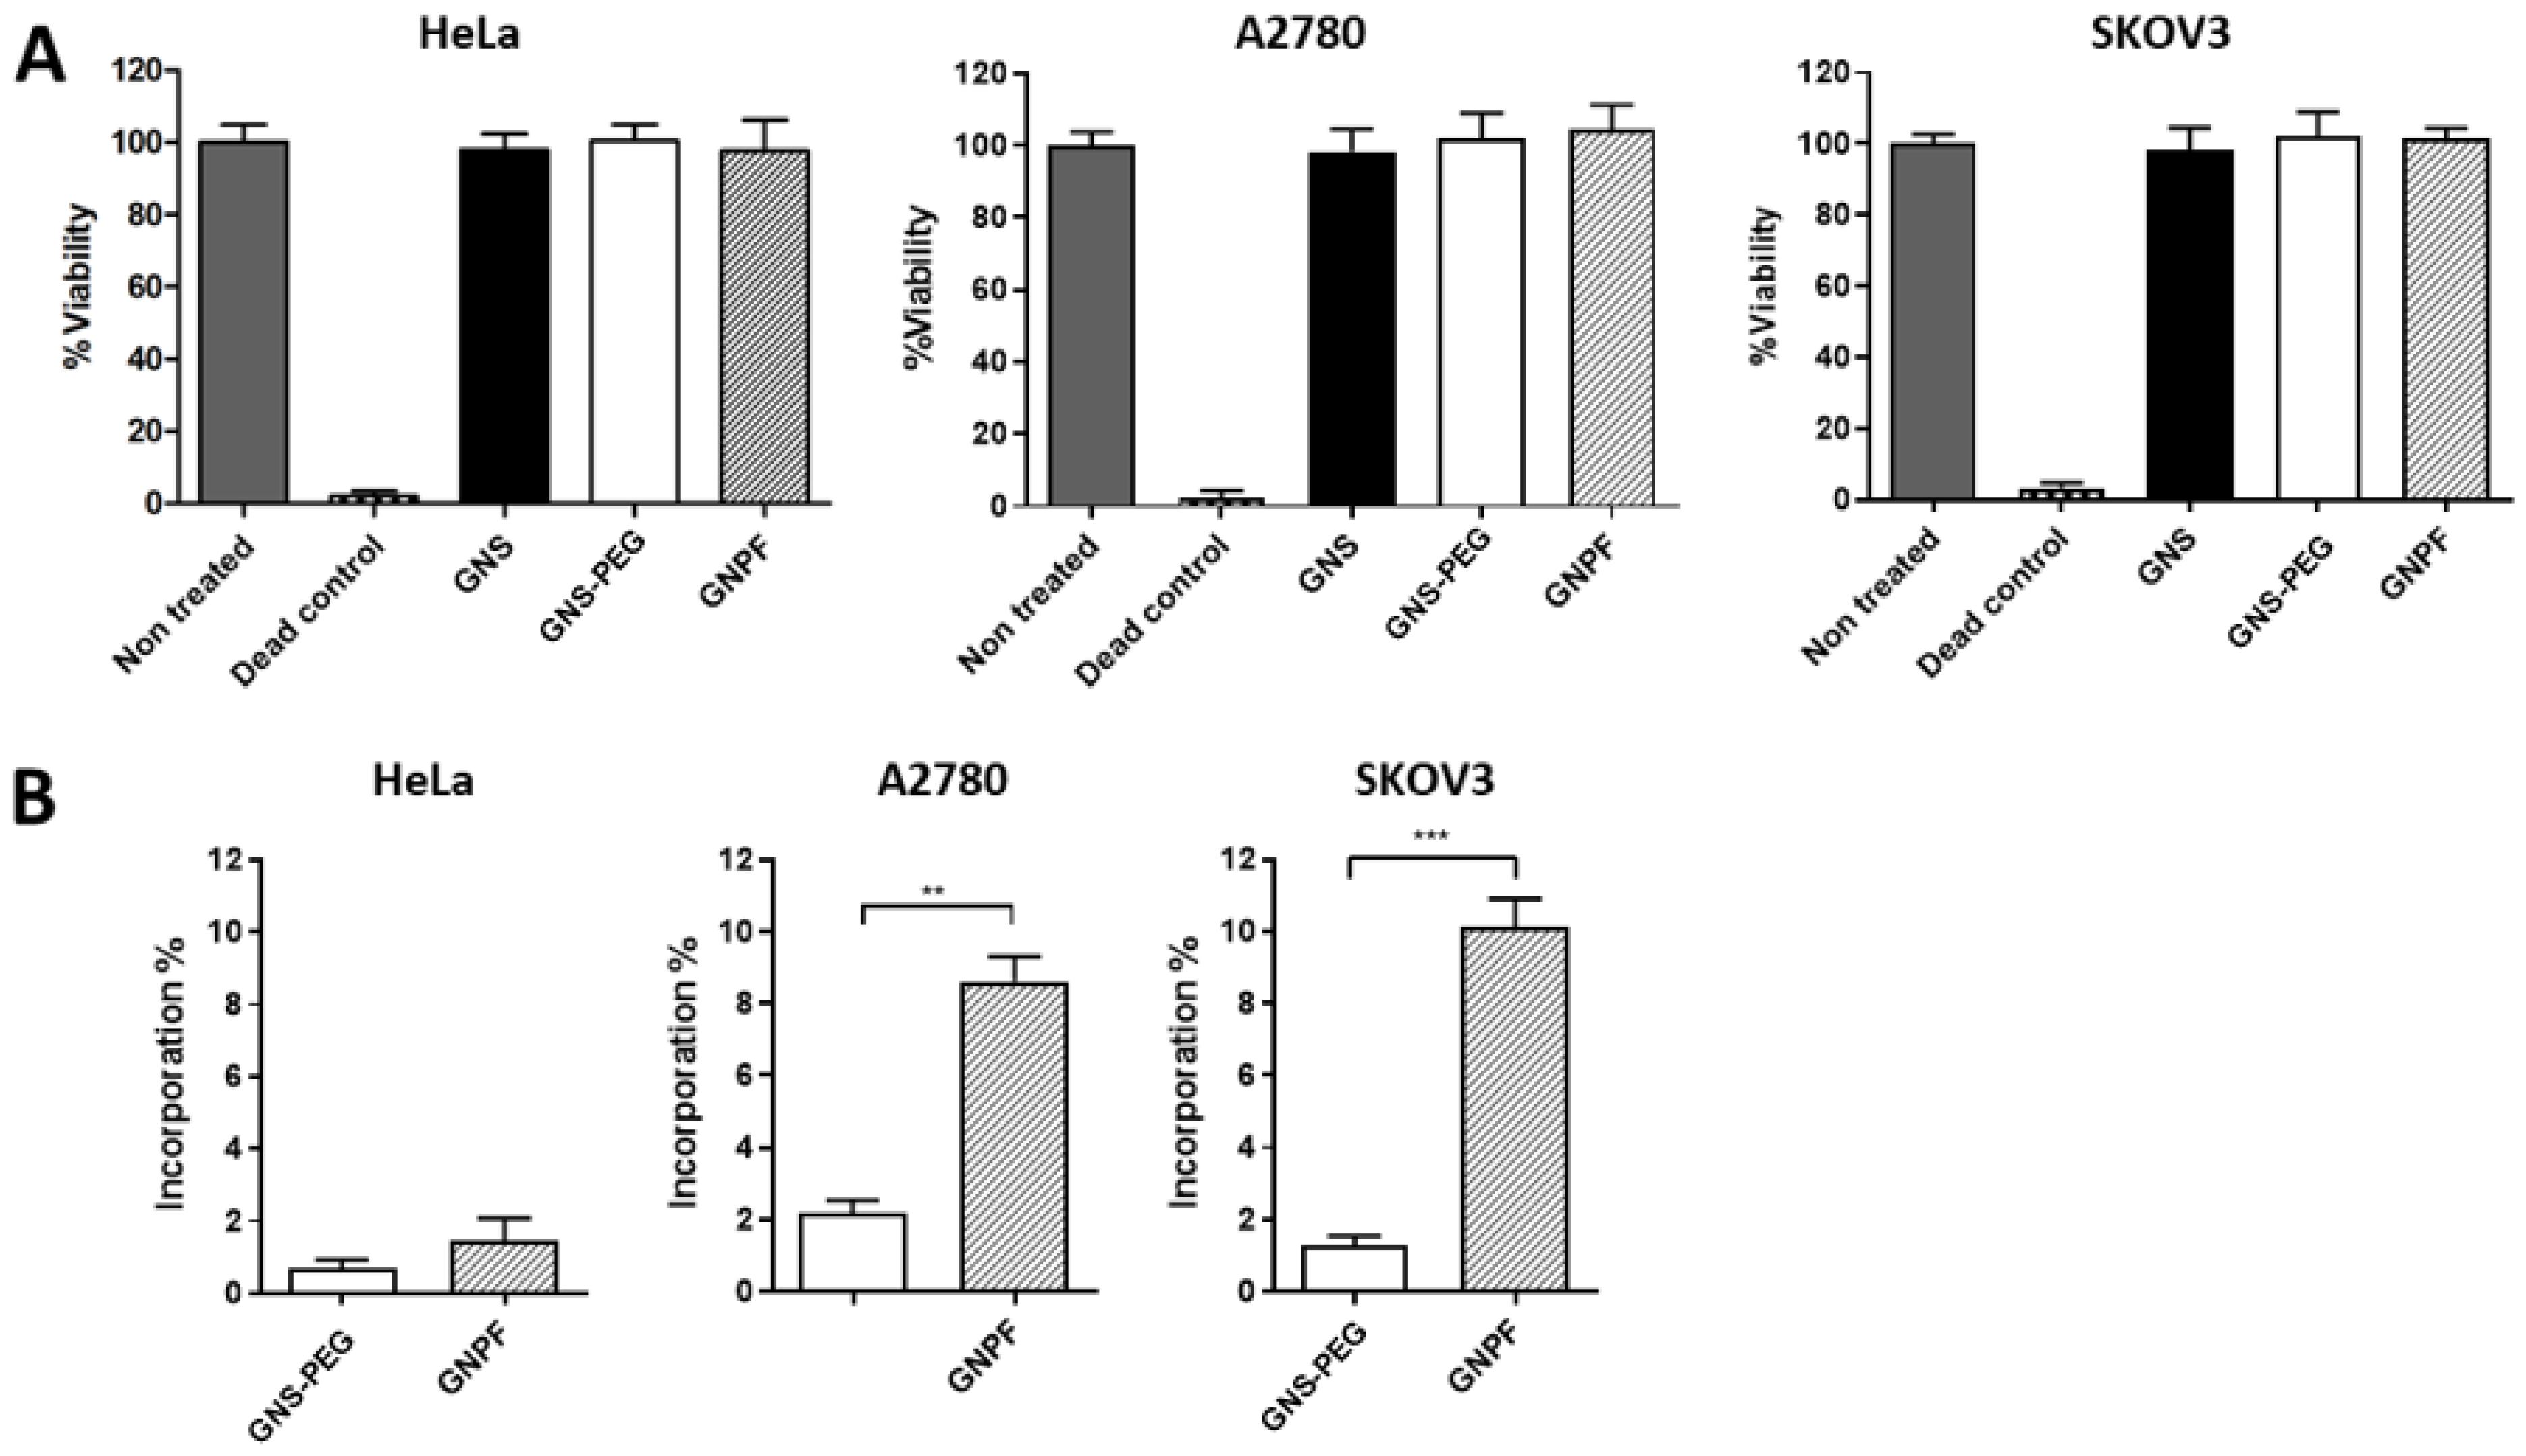
3.2. Gold Nanoplatforms Do Not Affect Cell Viability and Selectively Interact with Ovarian Cancer Cells
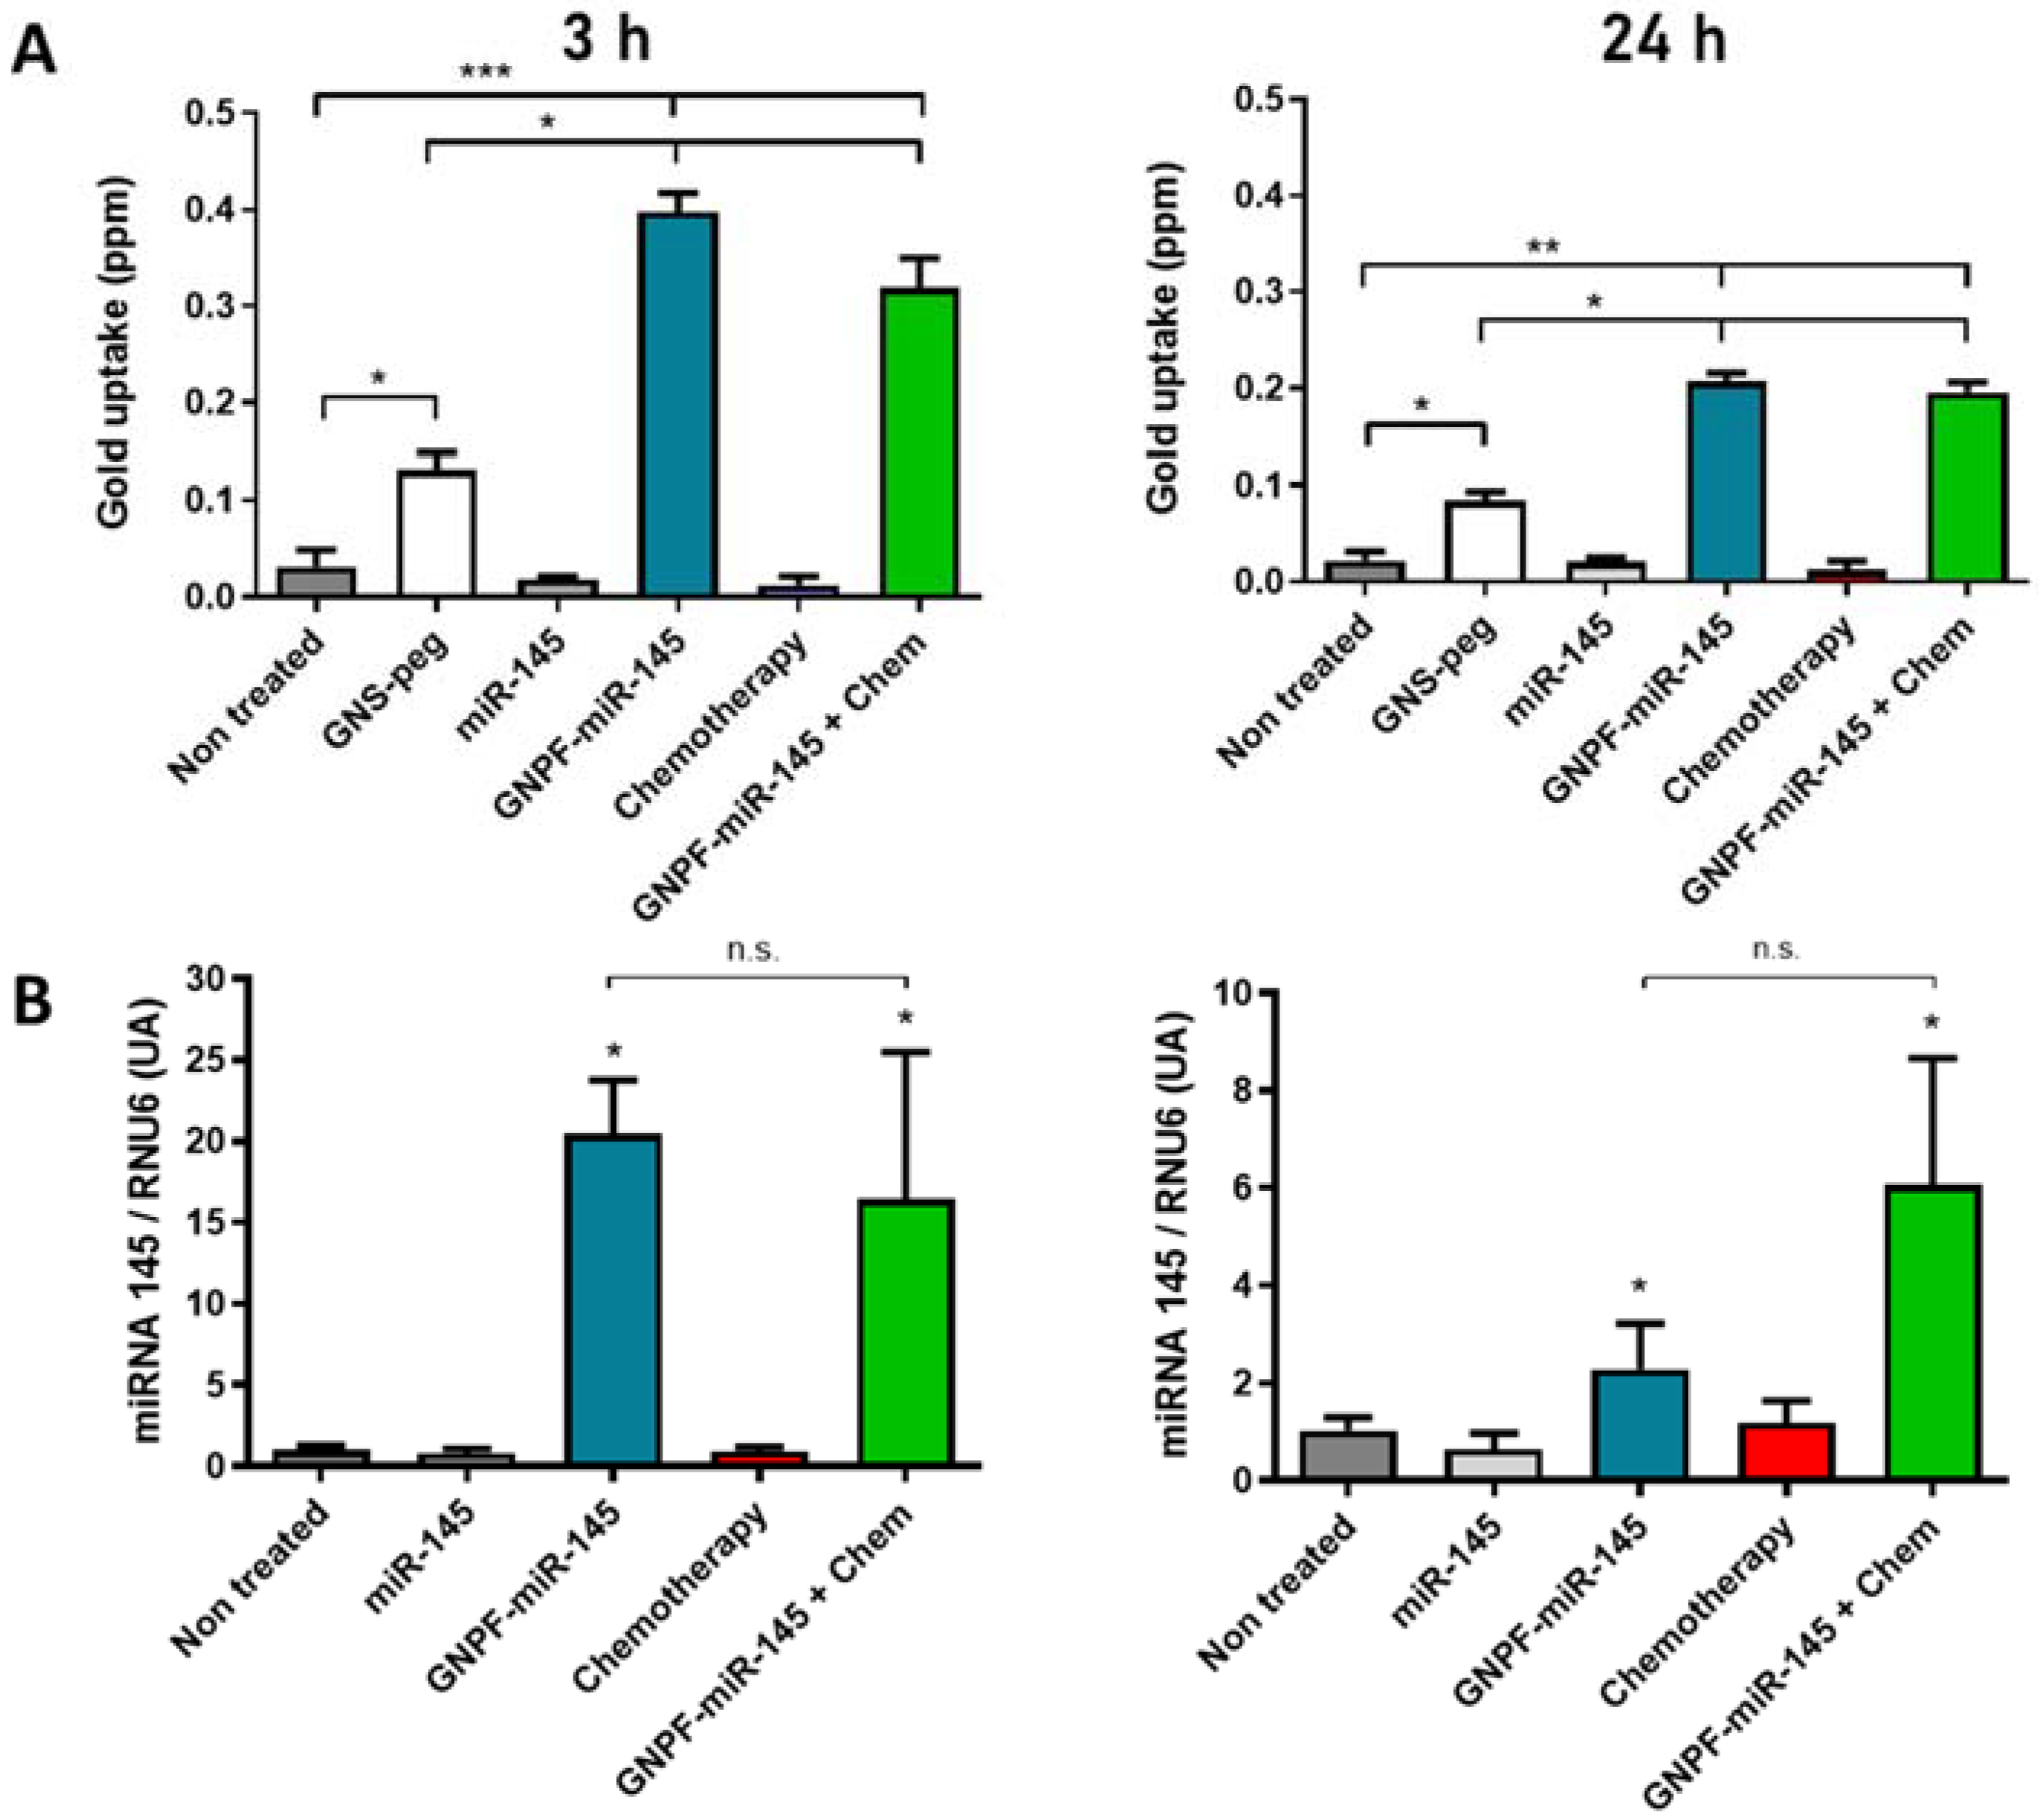
3.3. GNPF-miR-145 Can Reach the Cells and Deliver miR-145
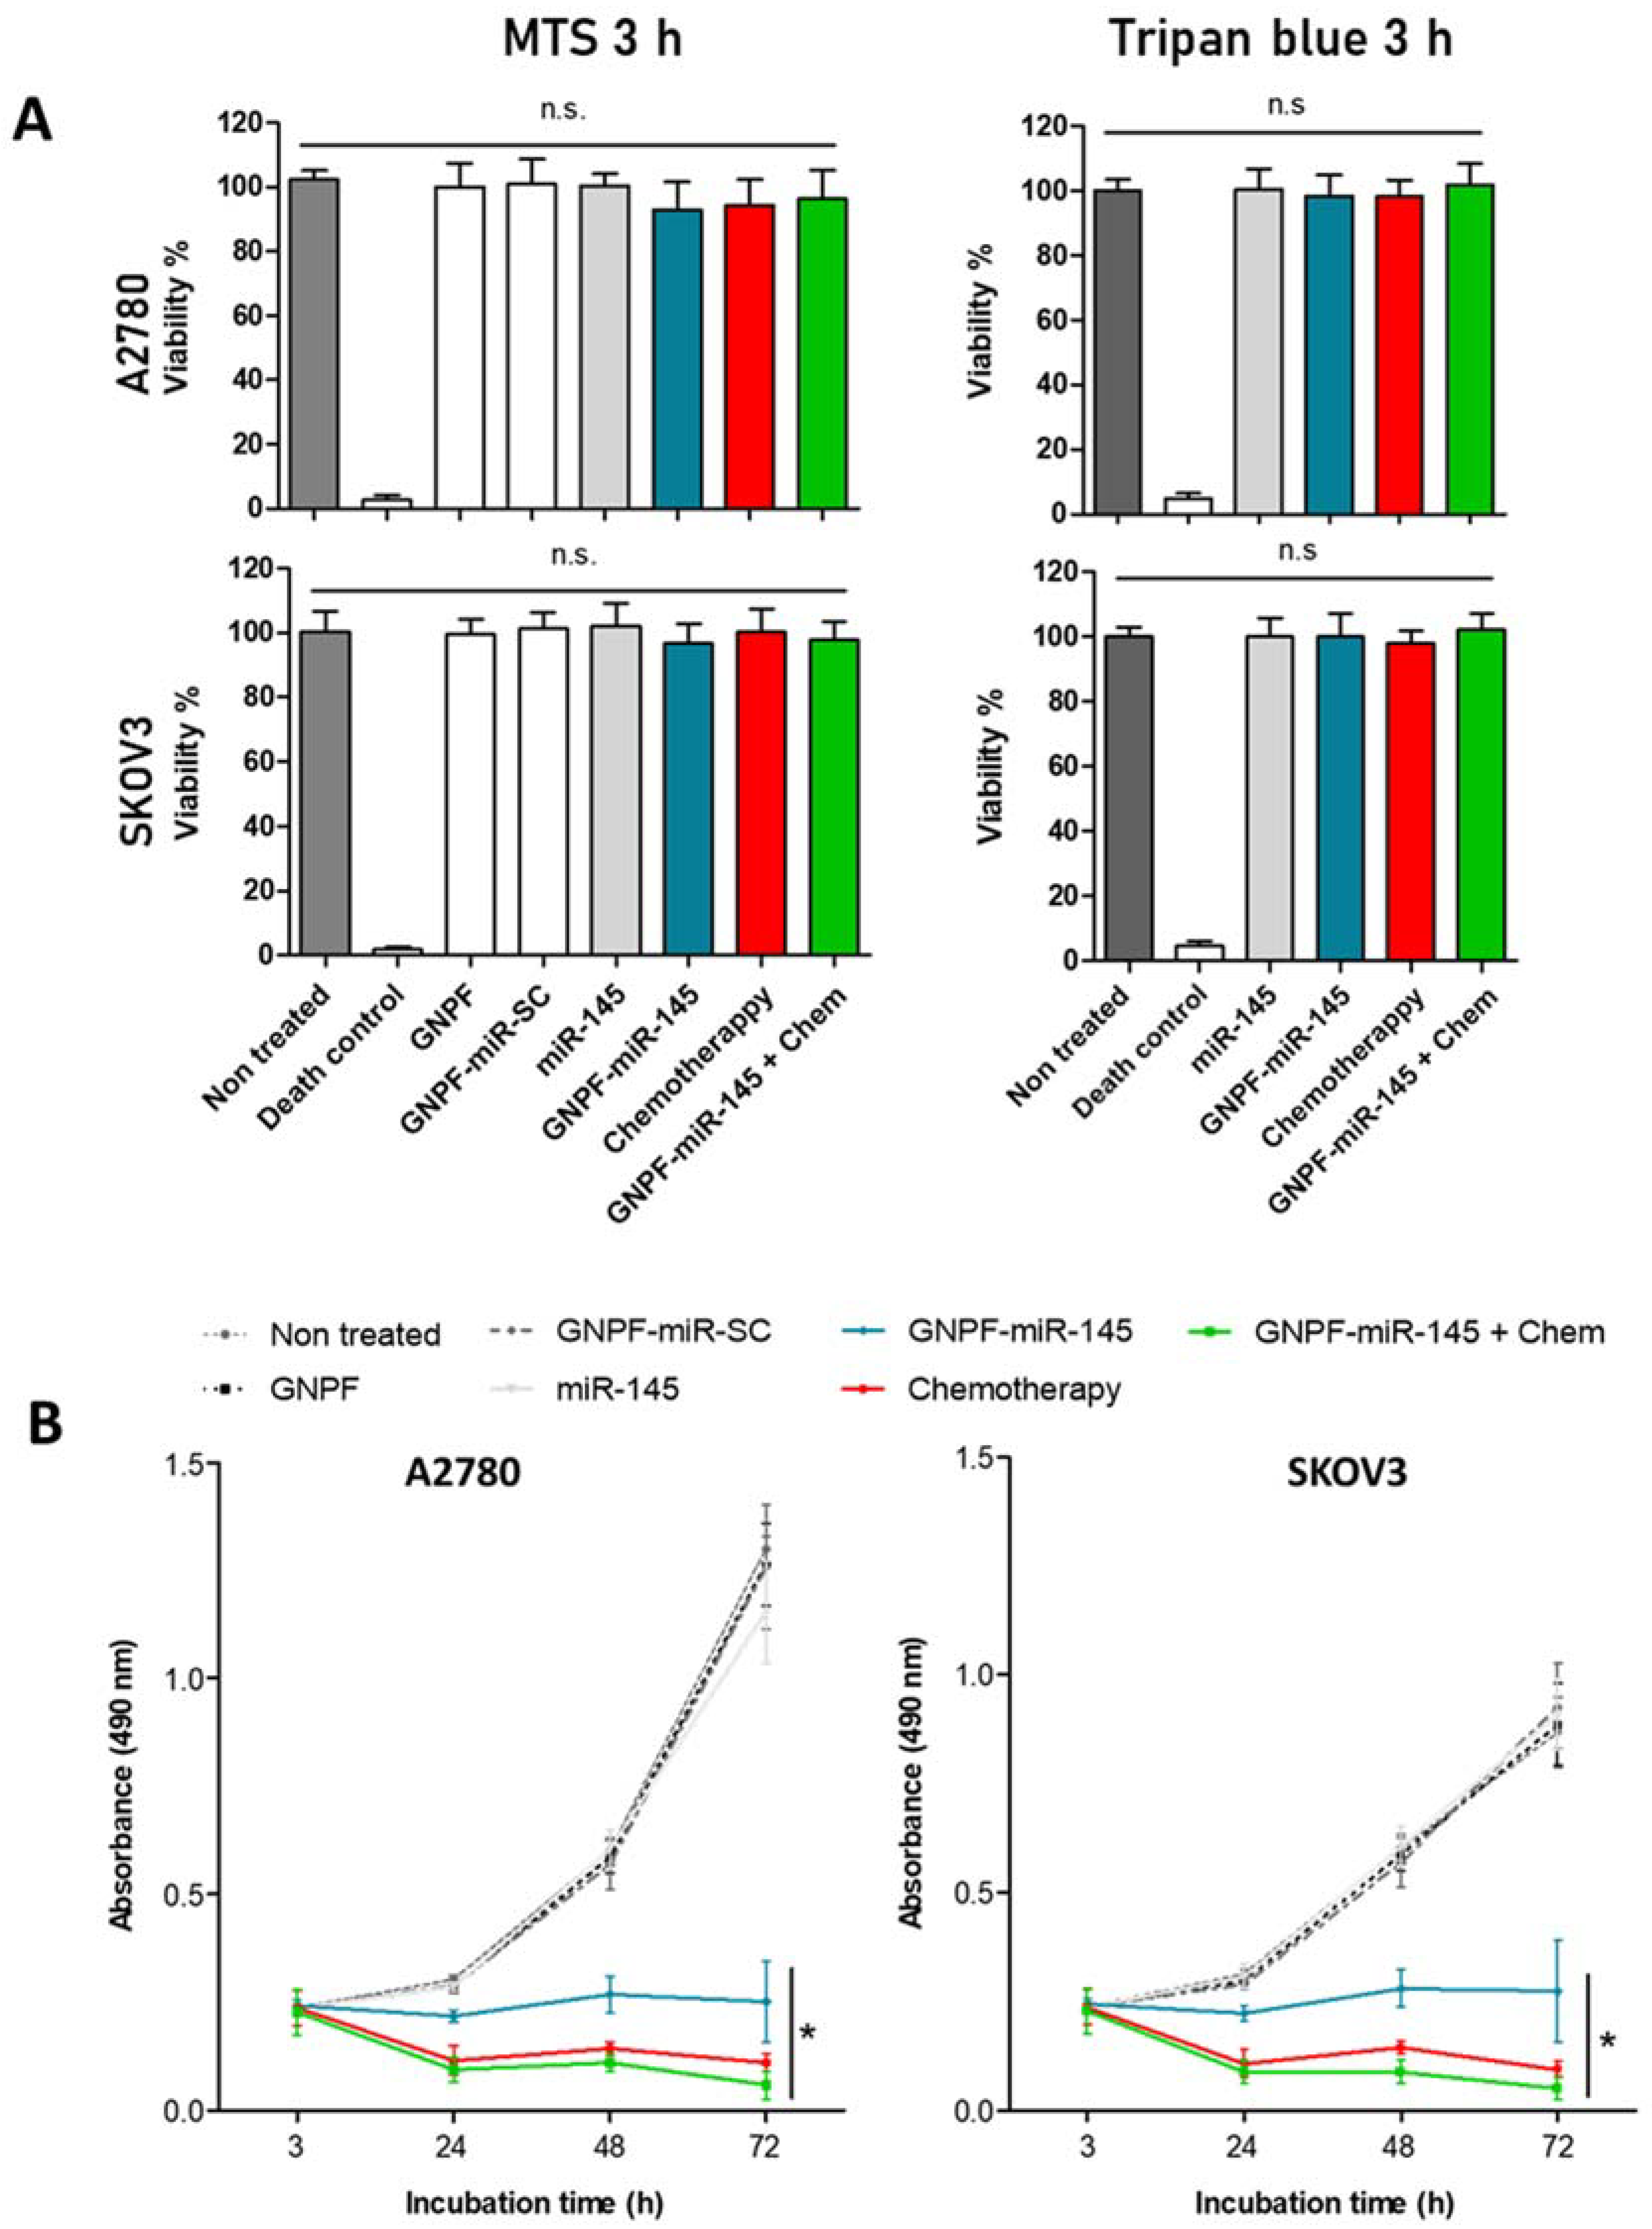
3.4. Cell Viability and Antiproliferative Effects
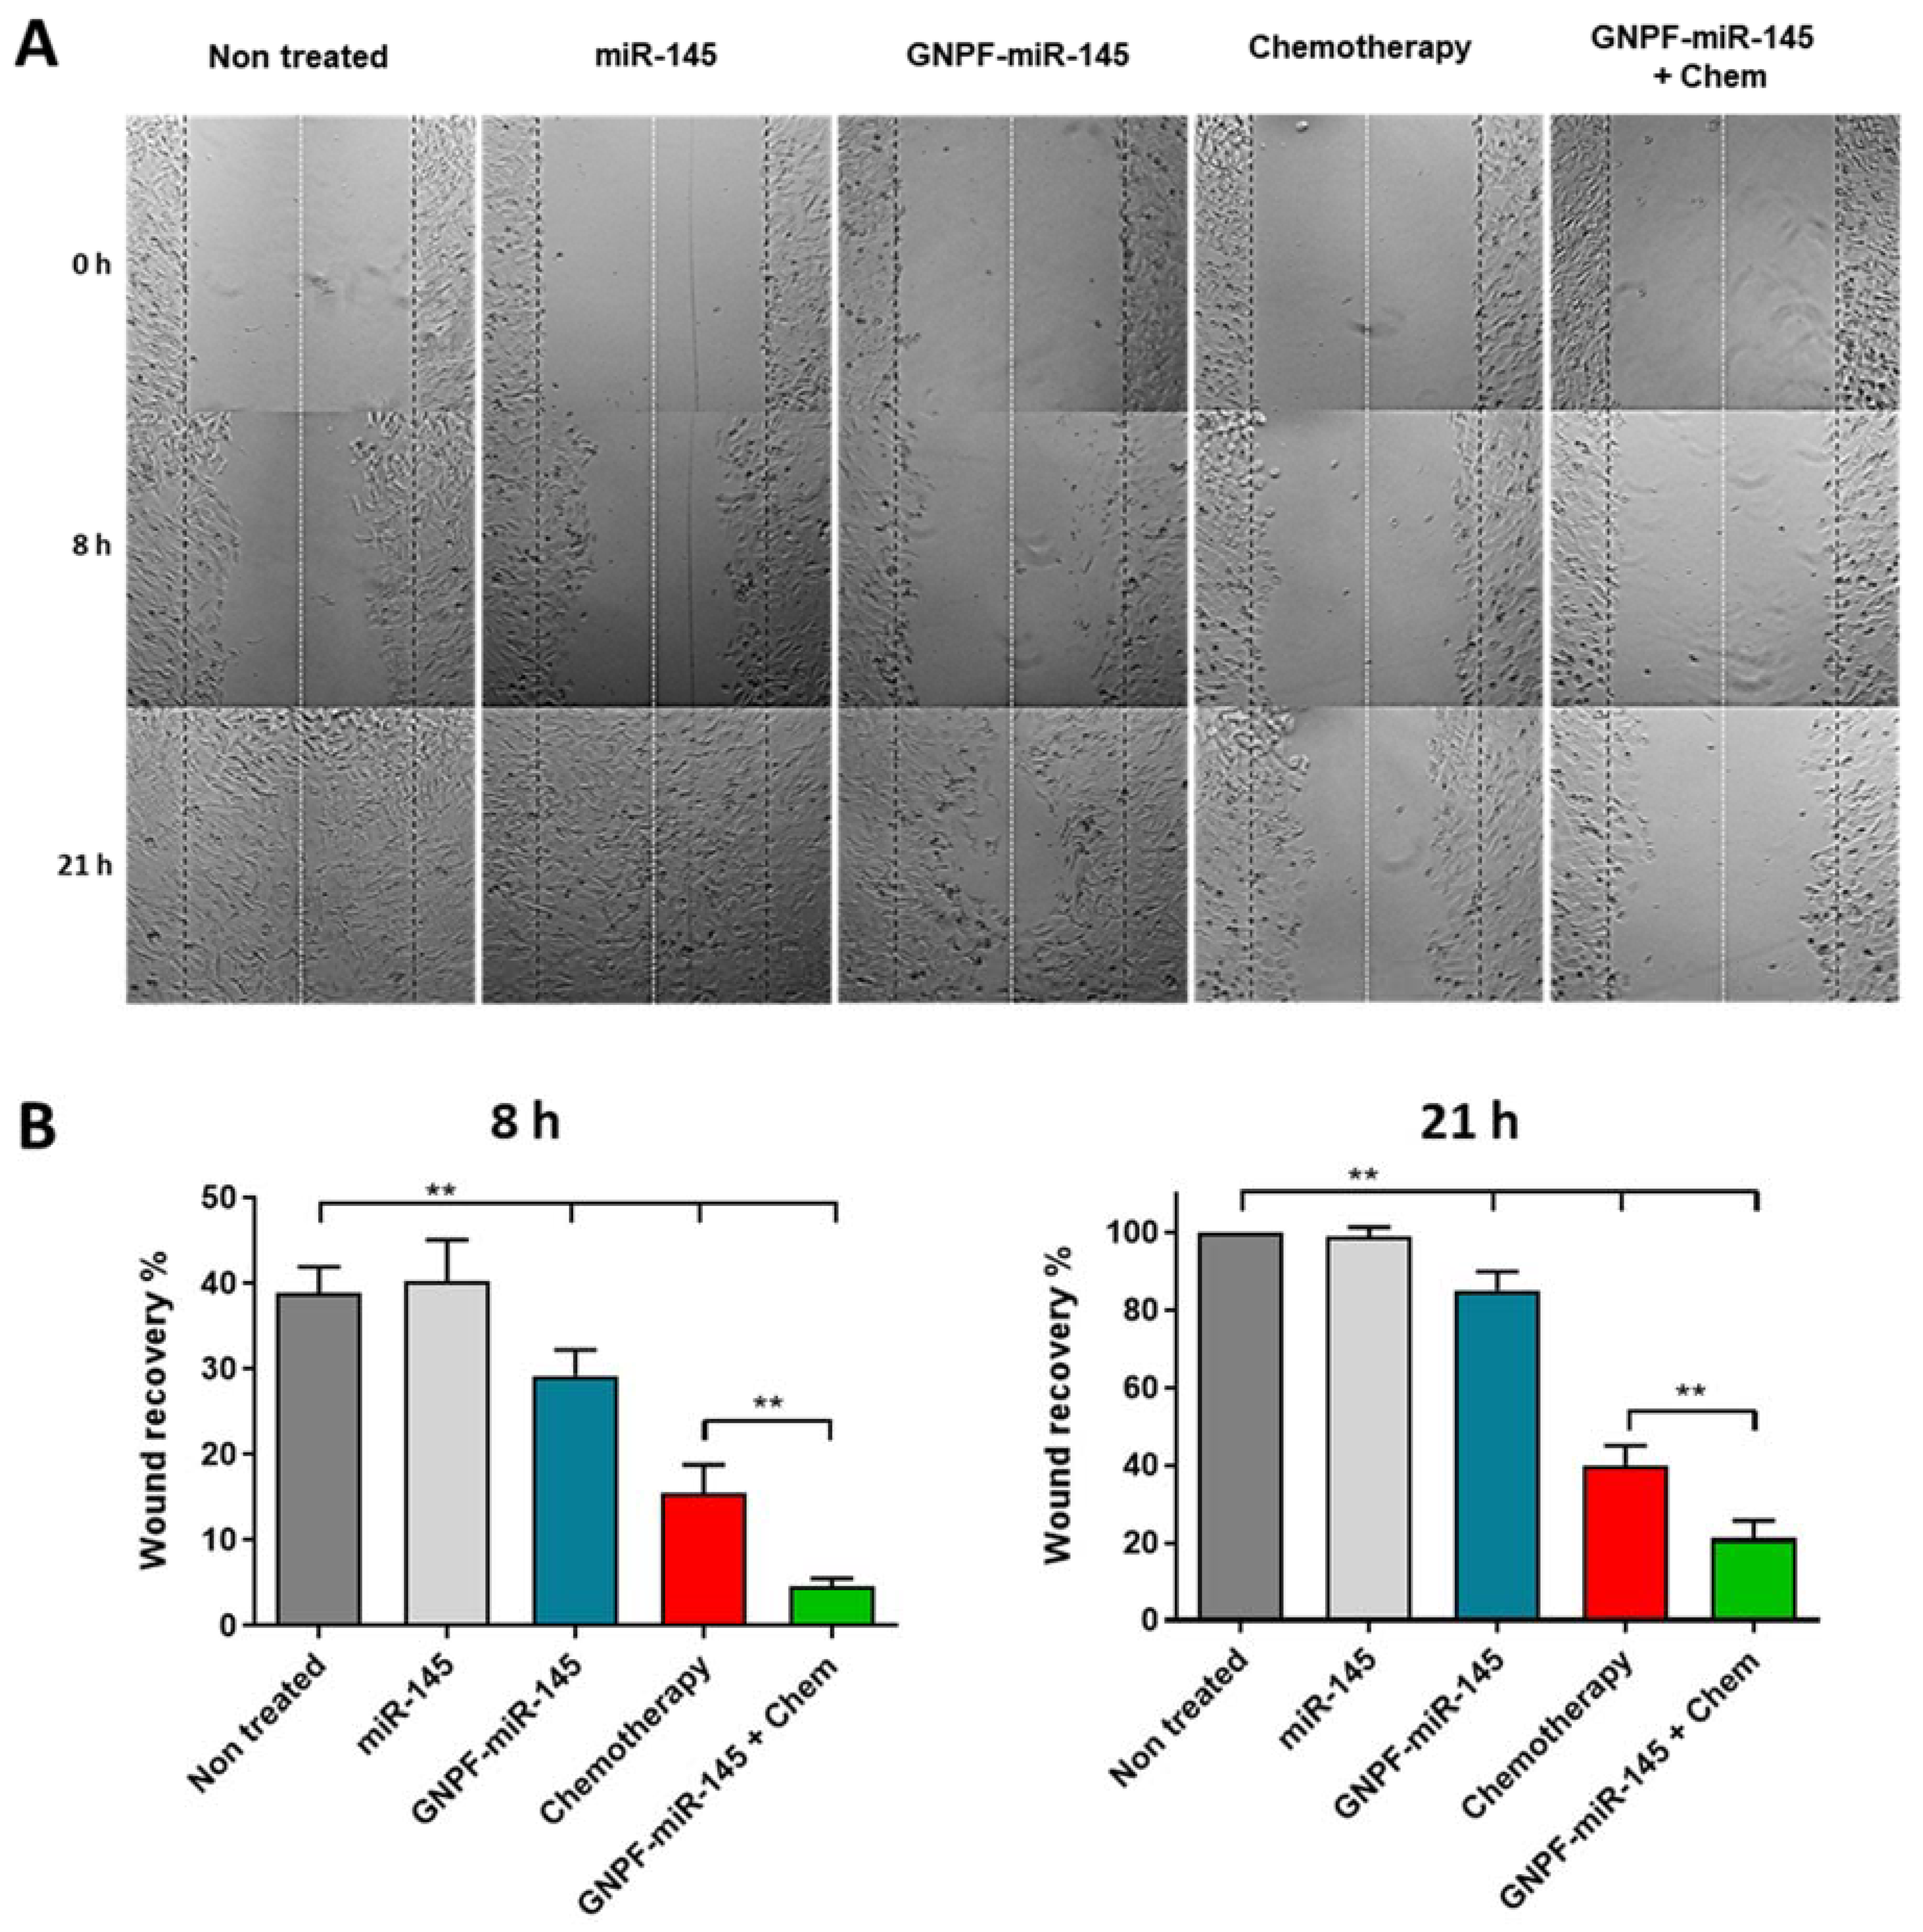
3.5. Nanoplatform Carrying miR-145 Inhibits Cell Migration
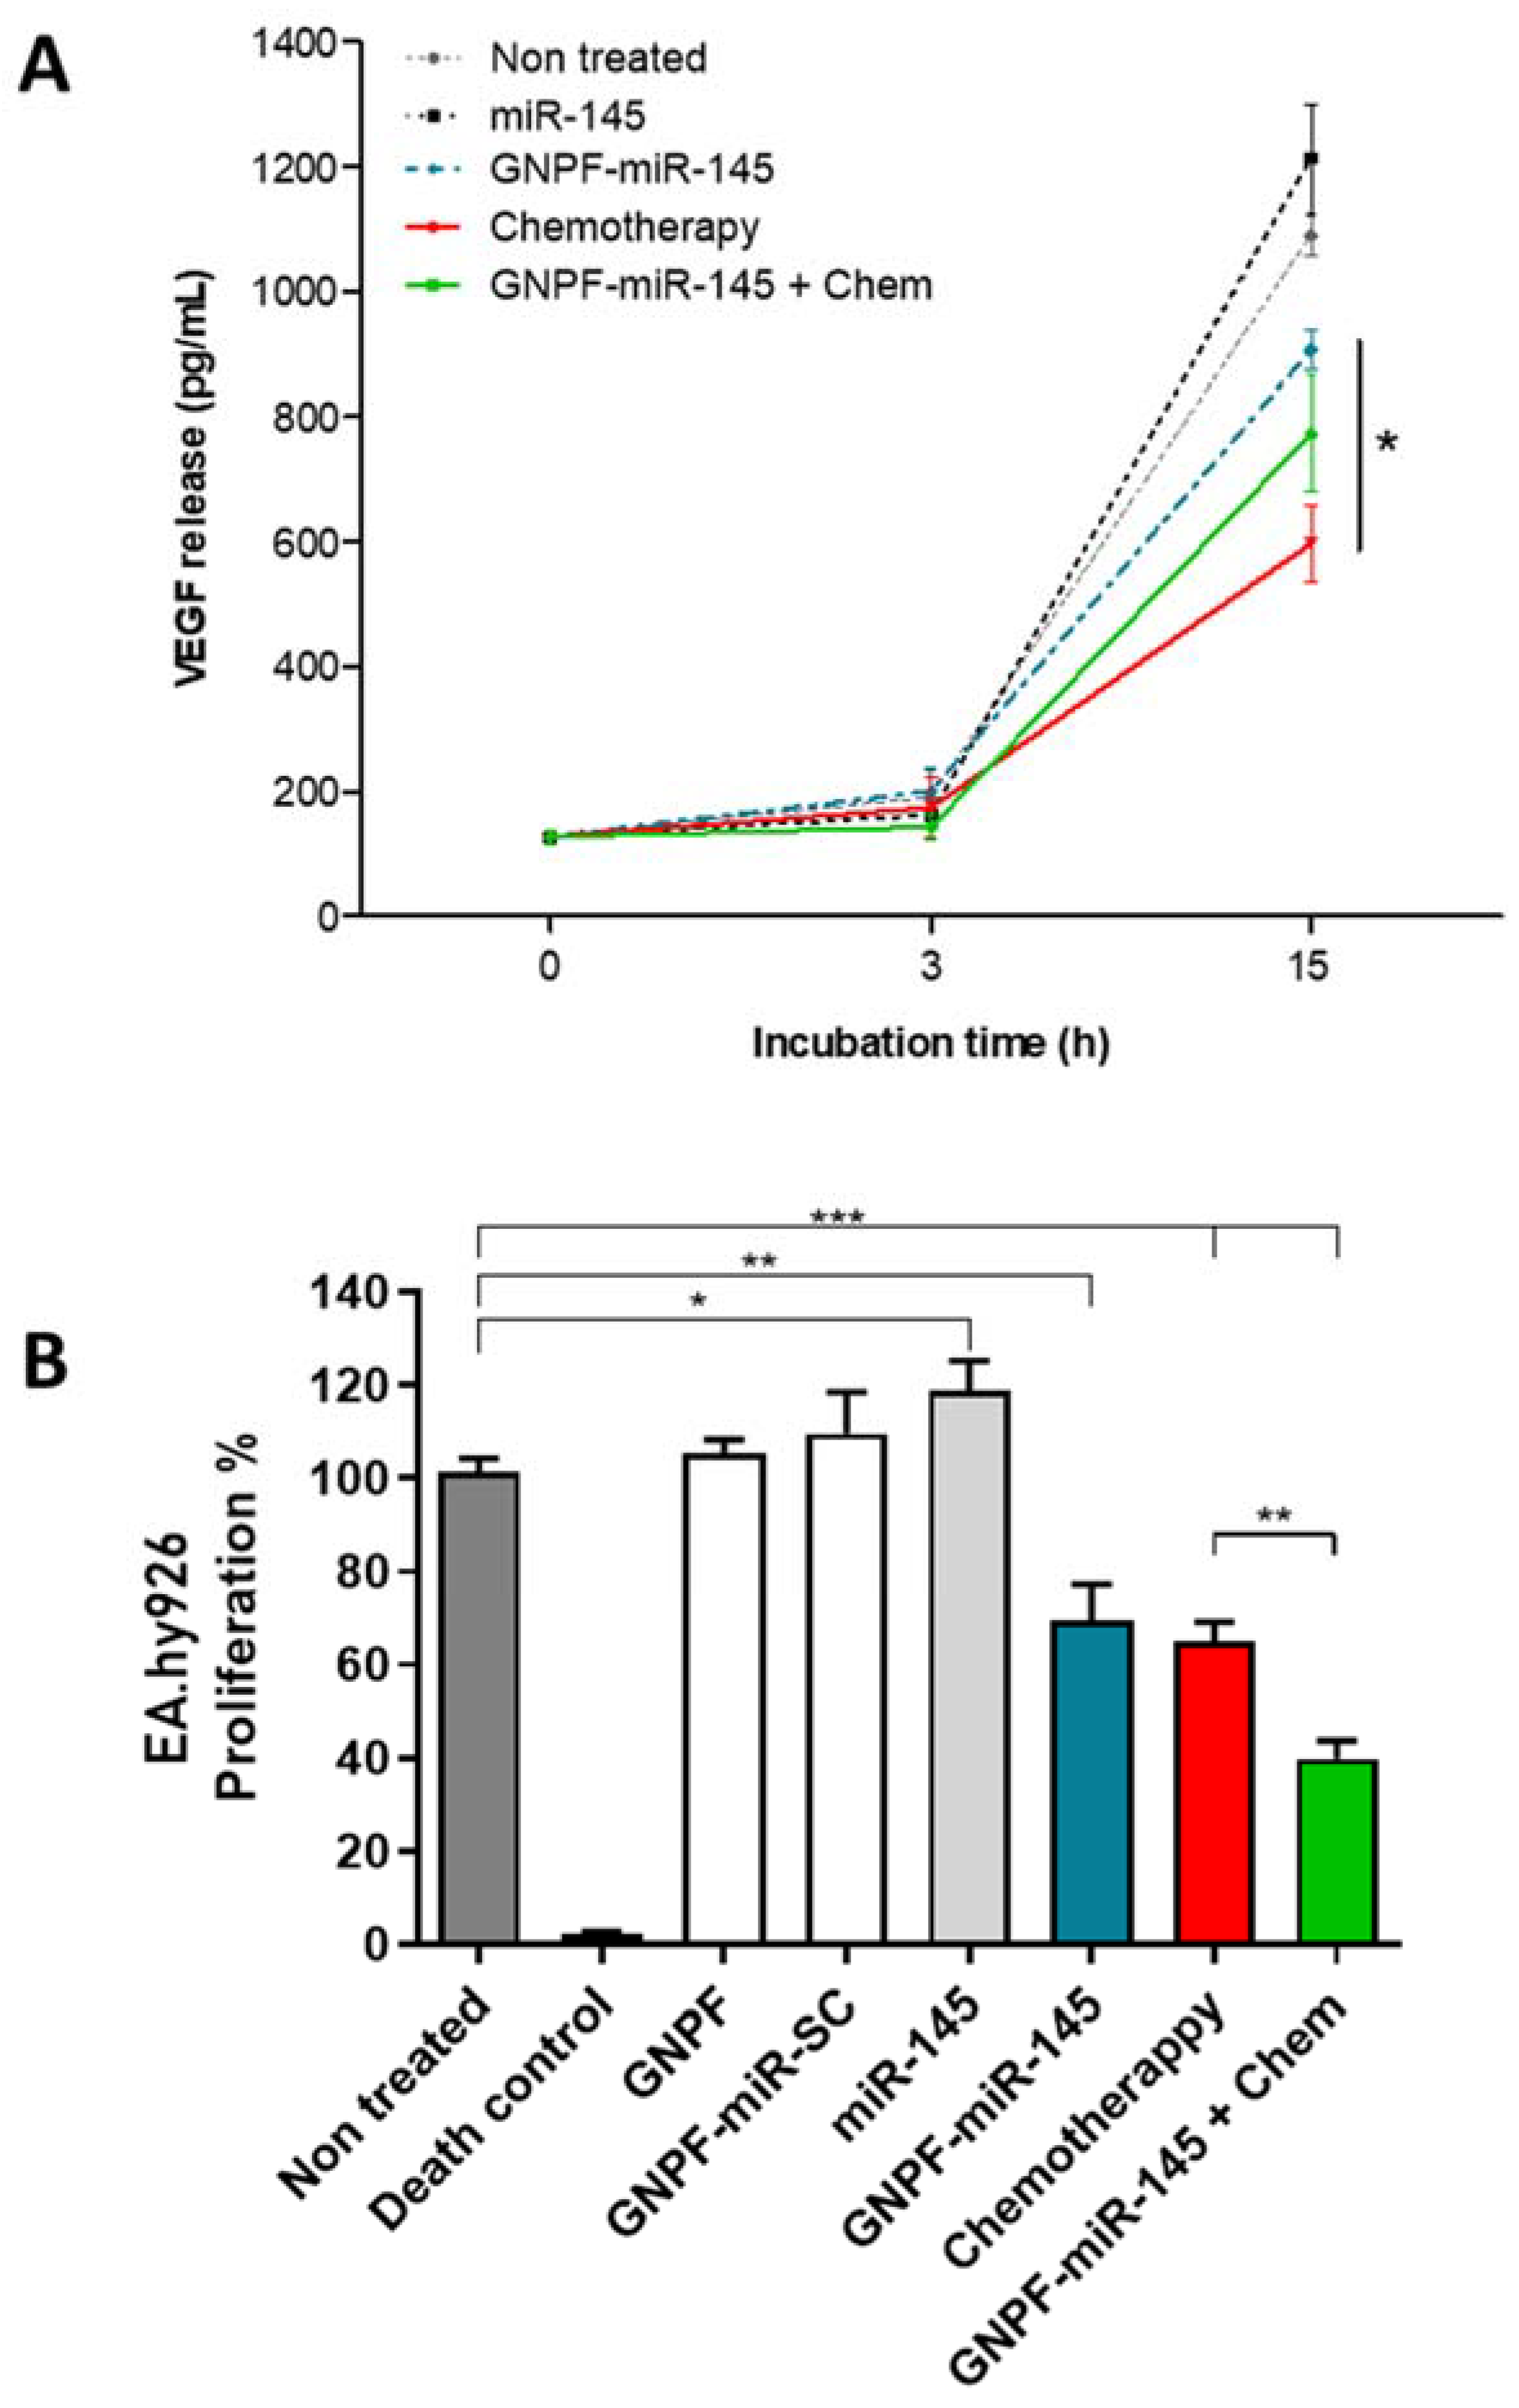
3.6. GNPF-miR-145 Inhibits VEGF Release from A2780 Cells
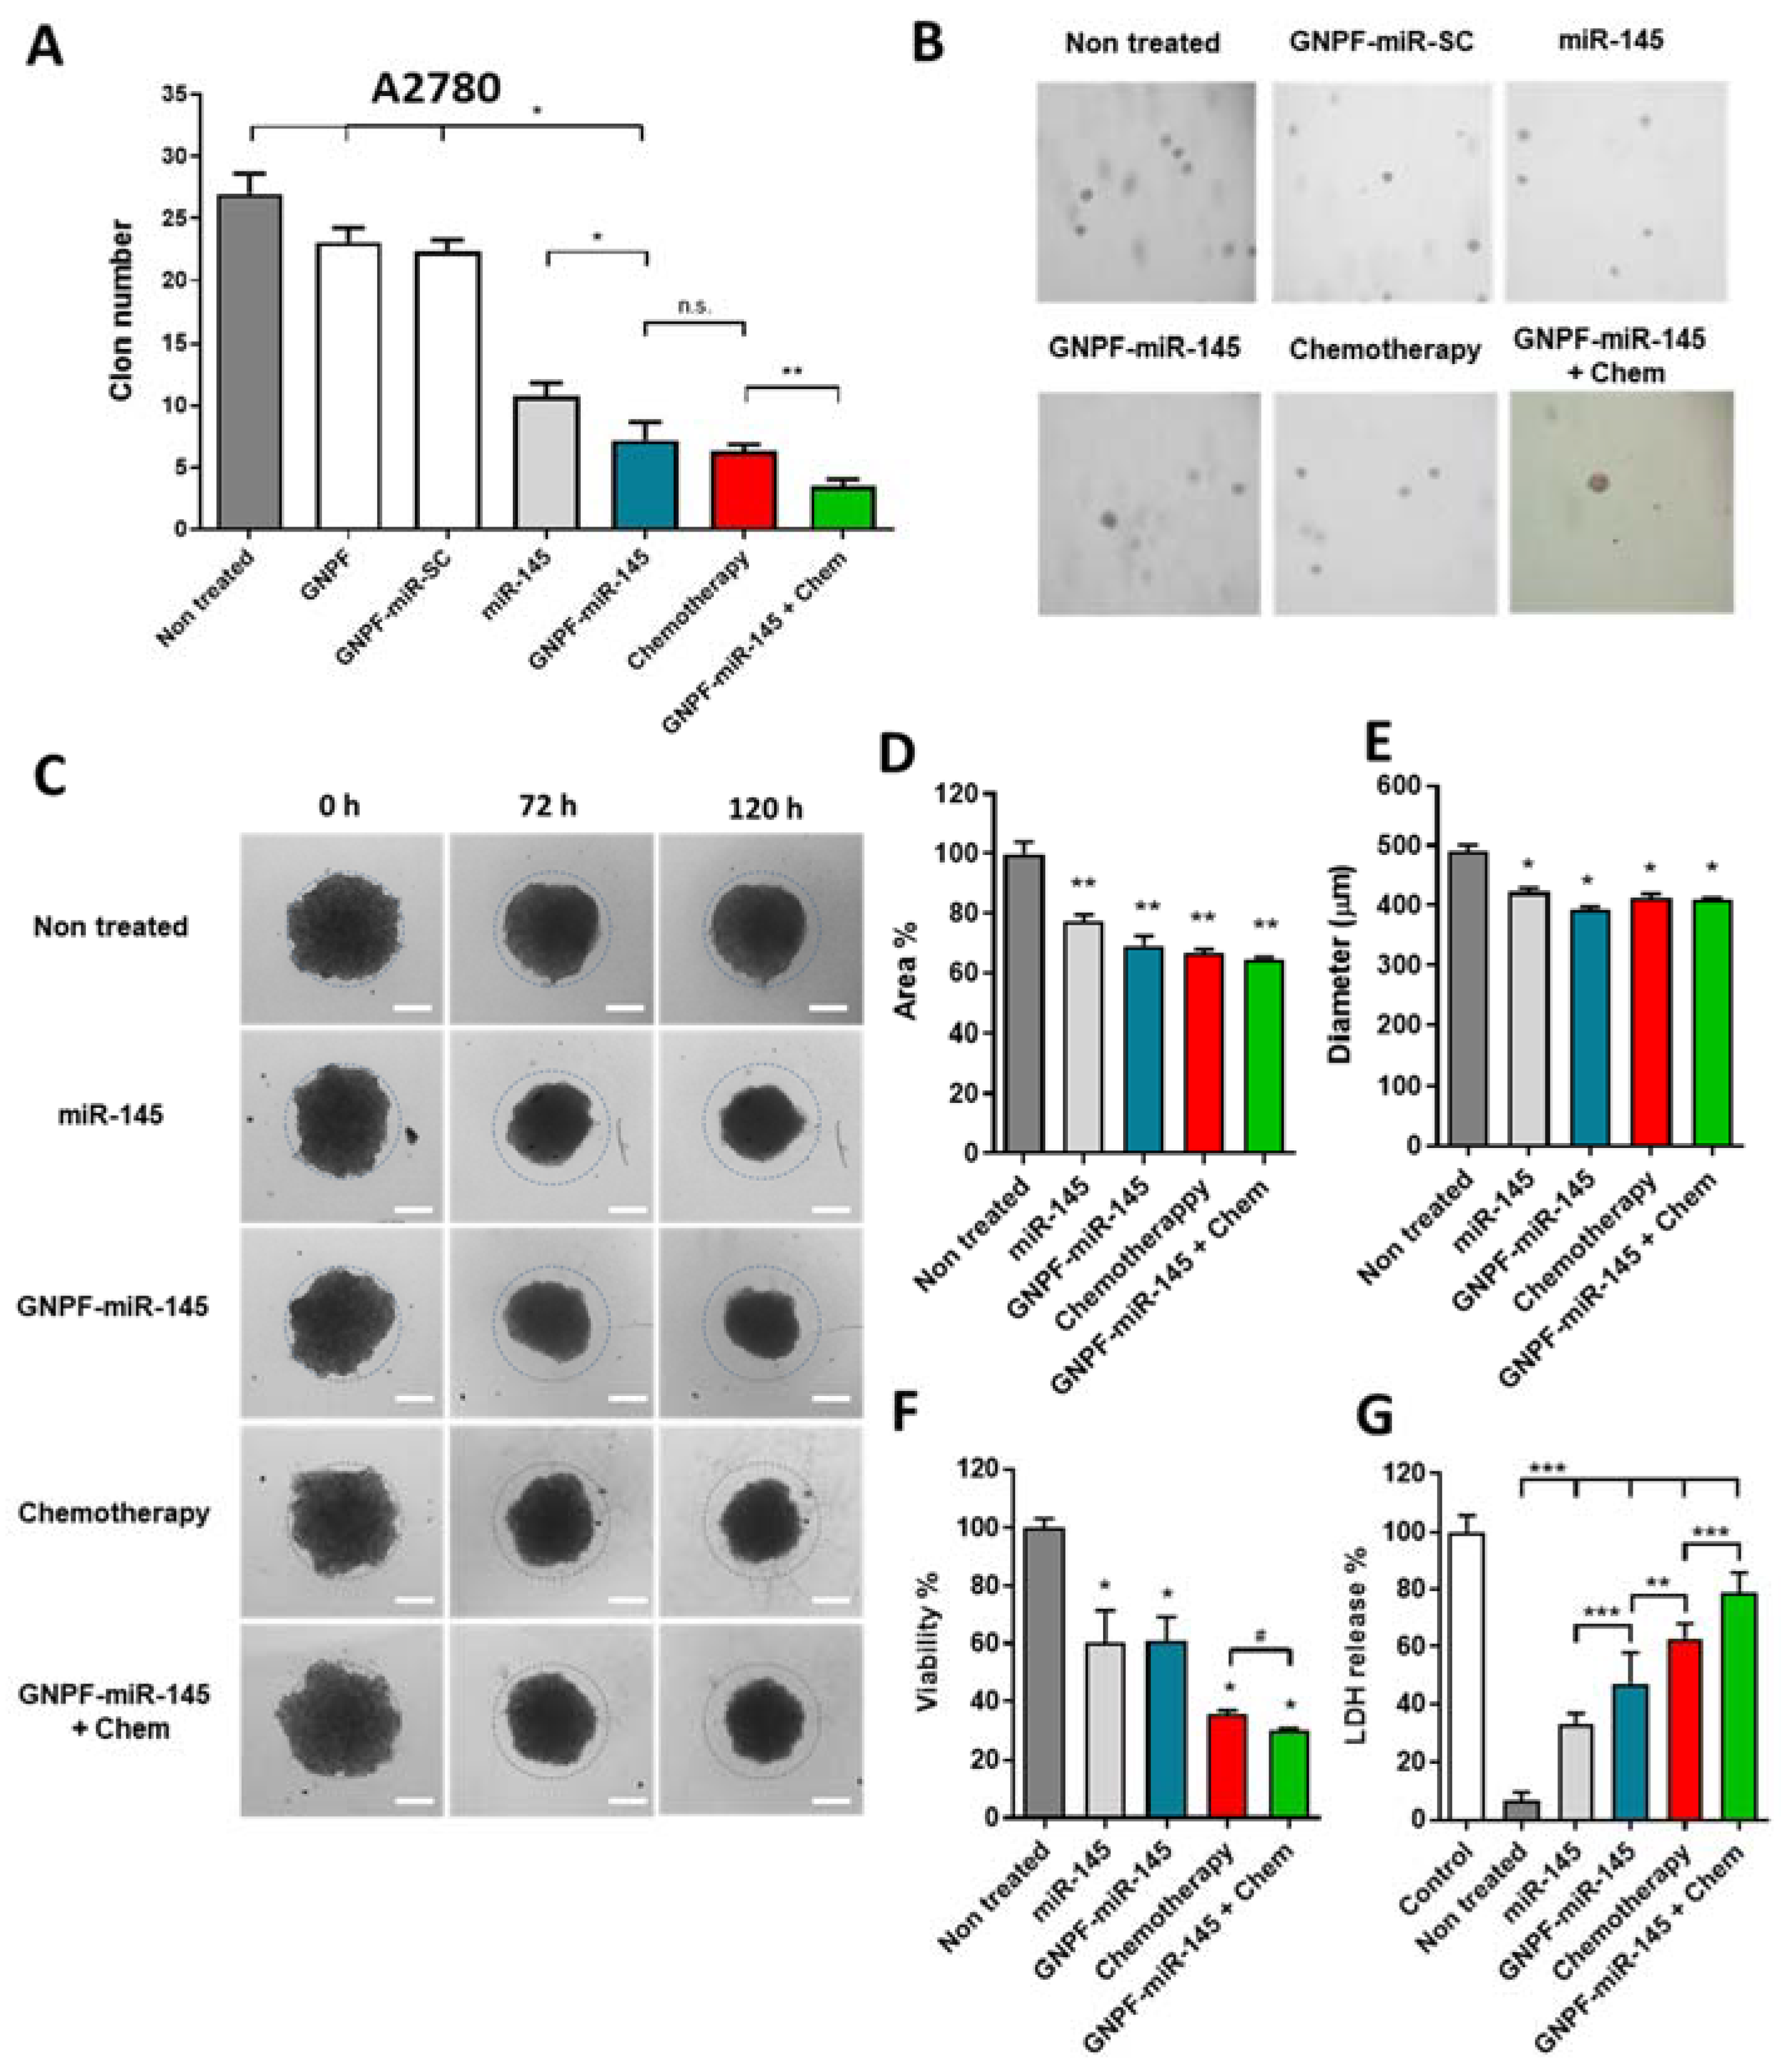
3.7. GNPF-miR-145 Effects on Anchor-Independent Growth and Tumoroid Formation
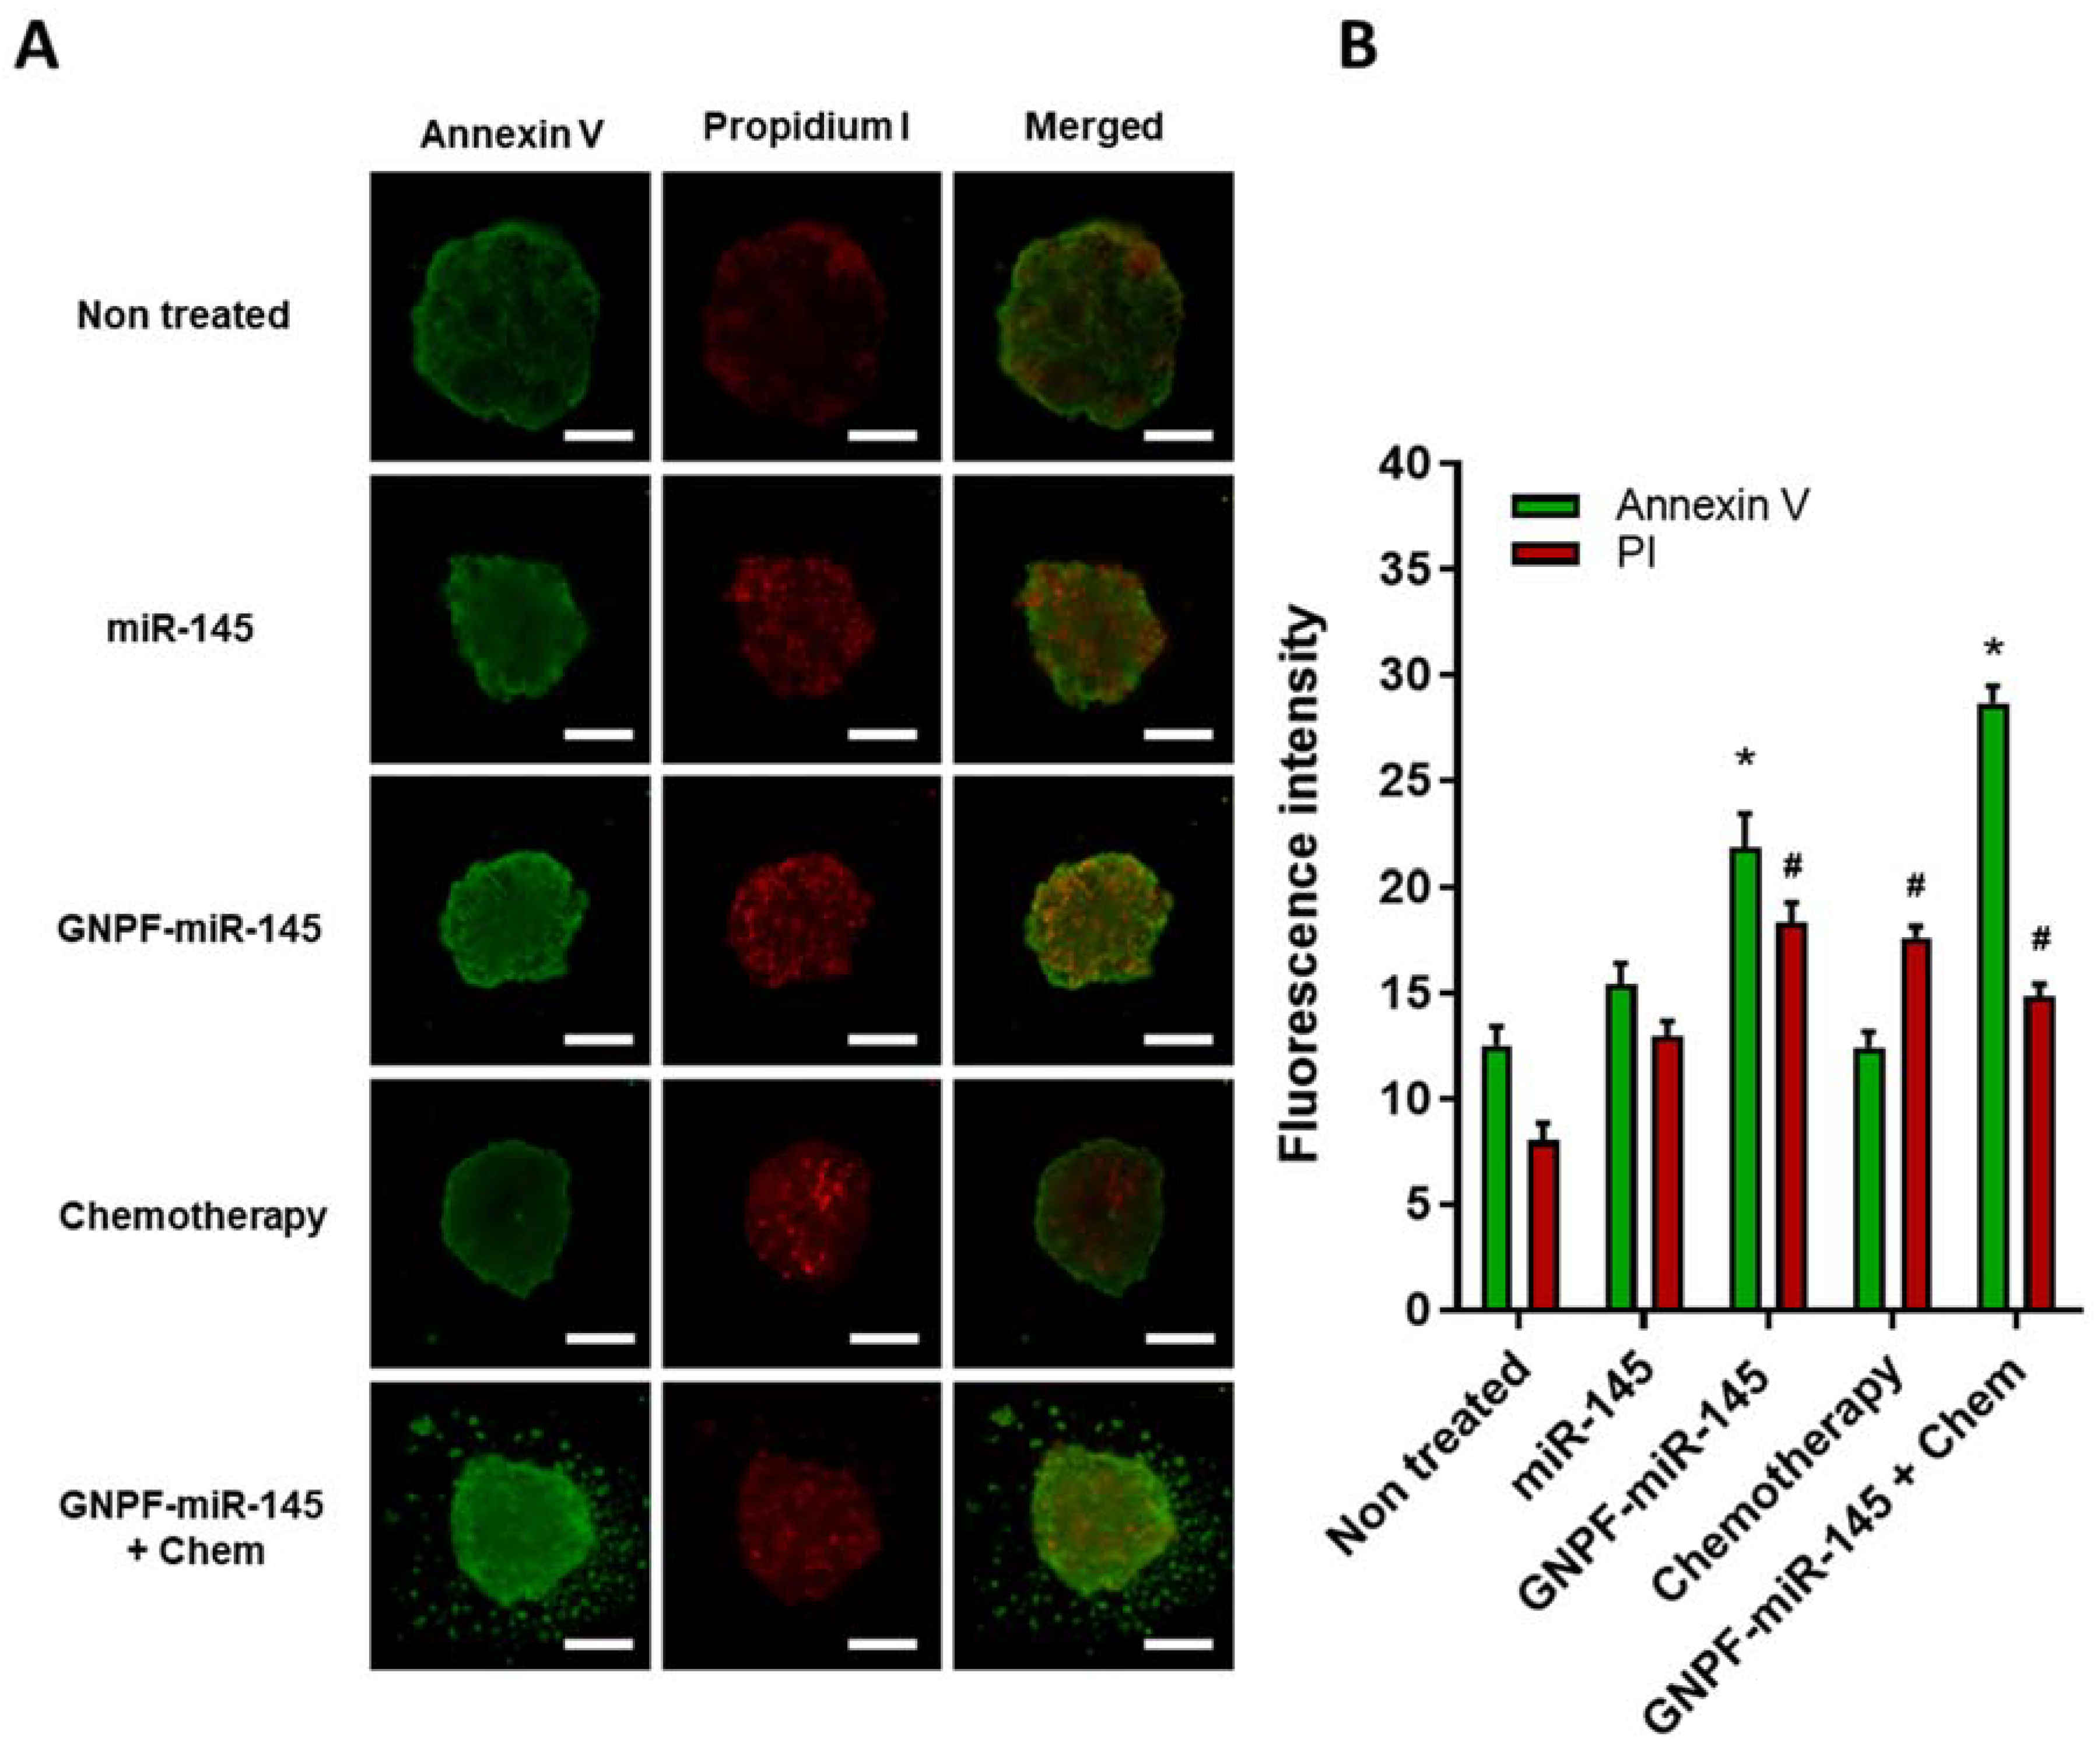
3.8. GNPF-miR-145 Induces Cell Damage on Formed Tumoroids
4. Discussion
5. Conclusions
Supplementary Materials
Author Contributions
Funding
Institutional Review Board Statement
Informed Consent Statement
Data Availability Statement
Acknowledgments
Conflicts of Interest
Abbreviations
| AuNP | gold nanoparticles |
| miR-145 | microRNA-145 |
| GNS | gold nanosphere |
| GNPF | gold nanoplatform |
| GNPF-miR-145 | gold nanoplatform carrying miR-145 |
| EPR | enhanced permeation and retention |
| GNPF-SC-miR | gold nanoplatform carrying scrambled miR |
| 3D | three-dimensional |
| LOT | liquid overlay technique |
| AV | annexin V |
| PI | propidium iodide |
| PEG | polyethylene glycol, HS-PEG-NH2 |
| MQ | milli-Q |
| MES | 4-morpholineethanolsulfonic acid buffer |
| EDC | 1-ethyl-3-(3-dymethylaminopropyl |
| DLS | dynamic light scattering |
| STEM | scanning transmission electronic microscopy |
References
- Liu, C.; Zhang, N. Nanoparticles in gene therapy principles, prospects, and challenges. Prog. Mol. Biol. Transl. Sci. 2011, 104, 509–562. [Google Scholar] [PubMed]
- Martínez-Ballesta, M.; Gil-Izquierdo, A.; García-Viguera, C.; Domínguez-Perles, R. Nanoparticles and Controlled Delivery for Bioactive Compounds: Outlining Challenges for New “Smart-Foods” for Health. Foods 2018, 7, 72. [Google Scholar] [CrossRef] [PubMed] [Green Version]
- Prades, R.; Guerrero, S.; Araya, E.; Molina, C.; Salas, E.; Zurita, E.; Selva, J.; Egea, G.; López-Iglesias, C.; Teixidó, M.; et al. Delivery of gold nanoparticles to the brain by conjugation with a peptide that recognizes the transferrin receptor. Biomaterials 2012, 33, 7194–7205. [Google Scholar] [CrossRef] [PubMed]
- Lasagna-Reeves, C.; Gonzalez-Romero, D.; Barria, M.A.; Olmedo, I.; Clos, A.; Sadagopa-Ramanujam, V.M.; Urayama, A.; Vergara, L.; Kogan, M.J.; Soto, C. Bioaccumulation and toxicity of gold nanoparticles after repeated administration in mice. Biochem. Biophys. Res. Commun. 2010, 393, 649–655. [Google Scholar] [CrossRef]
- Ray, P.; Clément, M.; Martini, C.; Abdellah, I.; Beaunier, P.; Rodríguez-Lopez, J.L.; Huc, V.; Remita, H.; Lampre, I. Stabilisation of small mono- and bimetallic gold–silver nanoparticles using calix[8]arene derivatives. New J. Chem. 2018, 42, 14128–14137. [Google Scholar] [CrossRef]
- Zare, I.; Tavakkoli-Yaraki, M.; Speranza, G.; Hassani-Najafabadi, A.; Shourangiz-Haghighi, A.; Bakhsian-Nik, A.; Manshian, B.B.; Saraiva, C.; Soenen, S.J.; Kogan, M.J.; et al. Gold nanostructures: Synthesis, properties, and neurological applications. Chem. Soc. Rev. 2022, 51, 2601–2680. [Google Scholar] [CrossRef]
- Bouché, M.; Hsu, J.C.; Dong, Y.C.; Kim, J.; Taking, K.; Cormode, D.P. Recent Advances in Molecular Imaging with Gold Nanoparticles. Bioconjug. Chem. 2020, 31, 303–314. [Google Scholar] [CrossRef]
- Kumar, D.; Mutreja, I.; Chitcholtan, K.; Sykes, P. Cytotoxicity and cellular uptake of different sized gold nanoparticles in ovarian cancer cells. Nanotechnology 2017, 28, 475101. [Google Scholar] [CrossRef]
- Maity, R.; Chatterjee, M.; Banerjee, A.; Das, A.; Mushra, R.; Mazumdar, S.; Chanda, N. Gold nanoparticle-assisted enhancement in the anti-cancer properties of theaflavin against human ovarian cancer cells. Mater. Sci. Eng. 2019, 104, 109909. [Google Scholar] [CrossRef]
- Medici, S.; Peana, M.; Coradduzza, D.; Zoroddu, M.A. Gold nanoparticles and cancer: Detection, diagnosis and therapy. In Seminars in Cancer Biology; Academic Press: Cambridge, MA, USA, 2021; Volume 76, pp. 27–37. [Google Scholar]
- Dasgupta, I.; Chatterjee, A. Recent advances in miRNA delivery systems. Methods Protoc. 2021, 4, 10. [Google Scholar] [CrossRef]
- Garrido, M.P.; Bruneau, N.; Vega, M.; Selman, A.; Tapia, J.C.; Romero, O. Follicle-stimulating hormone promotes nerve growth factor and vascular endothelial growth factor expression in epithelial ovarian cells. Histol. Histopathol. 2020, 35, 961–971. [Google Scholar] [PubMed]
- He, Y.Q.; Liu, S.P.; Kong, L.; Liu, Z.F. A study on the sizes and concentrations of gold nanoparticles by spectra of absorption, resonance Rayleigh scattering and resonance non-linear scattering. Spectrochim. Acta A Mol. Biomol. Spectrosc. 2005, 61, 2861–2866. [Google Scholar] [CrossRef] [PubMed]
- Piella, J.; Bastus, N.G.; Puntes, V. Size-Dependent Protein-Nanoparticle Interactions in Citrate-Stabilized Gold Nanoparticles: The Emergence of the Protein Corona. Bioconjug. Chem. 2017, 28, 88–97. [Google Scholar] [CrossRef] [PubMed]
- Uz, M.; Bulmus, V.; Altinkaya, S.A. Effect of PEG Grafting Density and Hydrodynamic Volume on Gold Nanoparticle-Cell Interactions: An Investigation on Cell Cycle, Apoptosis, and DNA Damage. Langmuir 2016, 32, 5997–6009. [Google Scholar] [CrossRef] [PubMed] [Green Version]
- Kuzmin, V.V.; Novikov, V.S.; Ustynyuk, L.Y.; Prokhorov, K.A.; Sagitova, E.A.; Nikolaeva, G.Y. Raman spectra of polyethylene glycols: Comparative experimental and DFT study. J. Mol. Struct. 2020, 5, 128331. [Google Scholar] [CrossRef]
- Socrates, G. Infrared and Raman Characteristic Group Frequencies: Tables and Charts, 3rd ed.; John Wiley & Sons: New York, NY, USA, 2004. [Google Scholar]
- Podstawka, E.; Ozaki, Y.; Proniewicz, L.M. Part III: Surface-Enhanced Raman Scattering of Amino Acids and Their Homodipeptide Monolayers Deposited onto Colloidal Gold Surface. Appl. Spectrosc. 2005, 59, 12. [Google Scholar] [CrossRef]
- Dulkeith, E.; Ringler, M.; Klar, T.A.; Feldmann, J.; Muñoz-Javier, A.; Parak, W.J. Gold nanoparticles quench fluorescence by phase induced radiative rate suppression. Nano Lett. 2005, 5, 585–589. [Google Scholar] [CrossRef]
- Fan, L.; Chen, J.; Zhang, X.; Liu, Y.; Xu, C. Follicle-stimulating hormone polypeptide modified nanoparticle drug delivery system in the treatment of lymphatic metastasis during ovarian carcinoma therapy. Gynecol. Oncol. 2014, 135, 125–132. [Google Scholar] [CrossRef]
- Fan, L.; Wu, Q.; Xing, X.; Wei, Y.; Shao, Z. MicroRNA-145 targets vascular endothelial growth factor and inhibits invasion and metastasis of osteosarcoma cells. Acta Biochim. Biophys. Sin. 2012, 44, 407–414. [Google Scholar] [CrossRef] [Green Version]
- Costa, E.C.; Gaspar, V.M.; Coutinho, P.; Correia, I.J. Optimization of liquid overlay technique to formulate heterogenic 3D co-cultures models. Biotechnol. Bioeng. 2014, 111, 1672–1685. [Google Scholar] [CrossRef]
- Barani, M.; Bilal, M.; Sabir, F.; Rahdar, A.; Kyzas, G.Z. Nanotechnology in ovarian cancer: Diagnosis and treatment. Life Sci. 2021, 266, 118914. [Google Scholar] [CrossRef] [PubMed]
- Greish, K. Enhanced permeability and retention (EPR) effect for anticancer nanomedicine drug targeting. Methods Mol. Biol. 2010, 624, 25–37. [Google Scholar]
- Rejman, J.; Oberle, v.; Zuhorn, I.S.; Hoekstra, D. Size-dependent internalization of particles via the pathways of clathrin- and caveolae-mediated endocytosis. Biochem. J. 2004, 377, 159–169. [Google Scholar] [CrossRef] [PubMed]
- Ivošev, V.; Jiménez-Sánchez, G.; Stefancikova, L.; Haidar, D.A.; González-Vargas, C.R.; Yang, X.; Bazzi, R.; Porcel, E.; Roux, S.; Lacombe, S. Uptake and excretion dynamics of gold nanoparticles in cancer cells and fibroblasts. Nanotechnology 2020, 31, 135102. [Google Scholar] [CrossRef] [PubMed]
- Sayers, N.; Hanyaloglu, A.C. Intracellular Follicle-Stimulating Hormone Receptor Trafficking and Signaling. Front. Endocrinol. 2018, 9, 653. [Google Scholar] [CrossRef] [PubMed]
- Marzi, M.J.; Ghini, F.; Cerruti, B.; de Pretis, S.; Bonetti, P.; Giacomelli, C.; Gorski, M.M.; Kress, T.; Pelizzola, M.; Muller, H. Degradation dynamics of microRNAs revealed by a novel pulse-chase approach. Genome. Res. 2016, 26, 554–565. [Google Scholar] [CrossRef] [Green Version]
- Ramachandran, V.; Chen, X. Degradation of microRNAs by a family of exoribonucleases in Arabidopsis. Science 2008, 321, 1490–1492. [Google Scholar] [CrossRef] [Green Version]
- De la Mata, M.; Gaidatzis, D.; Vitanescu, M.; Stadler, M.b.; Wentzel, C.; Scheiffele, P.; Filipowicz, W.; Großhans, H. Potent degradation of neuronal miRNAs induced by highly complementary targets. EMBO Rep. 2015, 16, 500–511. [Google Scholar] [CrossRef] [Green Version]
- De, N.; Young, L.; Lau, P.w.; Meisner, N.C.; Morrissey, D.V.; MacRae, I.J. Highly complementary target RNAs promote release of guide RNAs from human Argonaute2. Mol. Cell 2013, 50, 344–355. [Google Scholar] [CrossRef] [Green Version]
- Connor, E.E.; Mwamuka, J.; Gole, A.; Murphy, J.C.; Wyatt, M.D. Gold nanoparticles are taken up by human cells but do not cause acute cytotoxicity. Small 2005, 1, 325–327. [Google Scholar] [CrossRef]
- Shukla, R.; Bansal, V.; Chaudhary, M.; Basu, A.; Bhonde, R.R.; Sastry, M. Biocompatibility of gold nanoparticles and their endocytotic fate inside the cellular compartment: A microscopic overview. Langmuir 2005, 21, 10644–10654. [Google Scholar] [CrossRef] [PubMed]
- Zhao, J.; Zhou, K.; Ma, J.; Zhang, H. MicroRNA-145 overexpression inhibits neuroblastoma tumorigenesis in vitro and in vivo. Bioengineered 2020, 11, 219–228. [Google Scholar] [CrossRef] [PubMed] [Green Version]
- Liu, S.; Gao, G.; Yan, D.; Chen, X.; Yao, X.; Guo, S.; Li, G.; Zhao, Y. Effects of miR-145-5p through NRAS on the cell proliferation, apoptosis, migration, and invasion in melanoma by inhibiting MAPK and PI3K/AKT pathways. Cancer Med. 2017, 6, 819–833. [Google Scholar] [CrossRef] [PubMed]
- Cioce, M.; Ganci, F.; Canu, V.; Sacconi, A.; Mori, F.; Canino, C.; Korita, E.; Casini, B.; Alessandrini, G.; Cambria, A.; et al. Protumorigenic effects of mir-145 loss in malignant pleural mesothelioma. Oncogene 2014, 33, 5319–5331. [Google Scholar] [CrossRef] [PubMed] [Green Version]
- Hua, M.; Qin, Y.; Sheng, M.; Cui, X.; Chen, W.; Zhong, J.; Yan, J.; Chen, Y. miR145 suppresses ovarian cancer progression via modulation of cell growth and invasion by targeting CCND2 and E2F3. Mol. Med. Rep. 2019, 19, 3575–3583. [Google Scholar]
- Garrido, M.P.; Torres, I.; Avila, A.; Chnaiderman, J.; Valenzuela-Valderrama, M.; Aramburo, J.; Oróstica, L.; Durán-Jara, E.; Lobos-González, L.; Romero, C. 1 NGF/TRKA Decrease miR-145-5p Levels in Epithelial Ovarian Cancer Cells. Int. J. Mol. Sci. 2020, 21, 7657. [Google Scholar] [CrossRef]
- Zou, C.; Xu, Q.; Mao, f.; Li, D.; Bian, C.; Liu, L.Z.; Jiang, Y.; Chen, X.; Qi, Y.; Zhang, X.; et al. MiR-145 inhibits tumor angiogenesis and growth by N-RAS and VEGF. Cell Cycle 2012, 11, 2137–2145. [Google Scholar] [CrossRef] [Green Version]
- Tchoryk, A.; Taresco, V.; Argent, R.H.; Ashford, M.; Gellert, P.R.; Stolnik, S.; Grabowska, A.; Garnett, M.C. Penetration and Uptake of Nanoparticles in 3D Tumor Spheroids. Bioconjug. Chem. 2019, 30, 1371–1384. [Google Scholar] [CrossRef]
- Wang, R.K.; Shao, X.M.; Yang, J.P.; Yan, H.L.; Shao, Y. MicroRNA-145 inhibits proliferation and promotes apoptosis of HepG2 cells by targeting ROCK1 through the ROCK1/NF-kappaB signaling pathway. Eur. Rev. Med. Pharmacol. Sci. 2019, 23, 2777–2785. [Google Scholar]
- Huang, S.; Guo, W.; Tang, Y.; Ren, D.; Zou, X.; Peng, X. miR-143 and miR-145 inhibit stem cell characteristics of PC-3 prostate cancer cells. Oncol. Rep. 2012, 28, 1831–1837. [Google Scholar] [CrossRef] [Green Version]
- Zhu, Y.; Wang, C.; Becker, S.A.; Hurst, K.; Nogueira, L.M.; Findlay, V.J.; Cam, E.R. miR-145 Antagonizes SNAI1-Mediated Stemness and Radiation Resistance in Colorectal Cancer. Mol. Ther. 2018, 26, 744–754. [Google Scholar] [CrossRef] [PubMed] [Green Version]
- Huang, K.; Boerhan, R.; Liu, C.; Jiang, G. Nanoparticles Penetrate into the Multicellular Spheroid-on-Chip: Effect of Surface Charge, Protein Corona, and Exterior Flow. Mol. Pharm. 2017, 14, 4618–4627. [Google Scholar] [CrossRef] [PubMed]
- Durymanov, M.; Kroll, C.; Permyakova, A.; Reineke, J. Role of Endocytosis in Nanoparticle Penetration of 3D Pancreatic Cancer Spheroids. Mol. Pharm. 2019, 16, 1074–1082. [Google Scholar] [CrossRef]
- Wang, Y.; Xie, Y.; Kilchrist, K.V.; Li, J.; Duvall, C.L.; Oupický, D. Endosomolytic and Tumor-Penetrating Mesoporous Silica Nanoparticles for siRNA/miRNA Combination Cancer Therapy. ACS Appl. Mater. Interfaces 2020, 12, 4308–4322. [Google Scholar] [CrossRef] [PubMed]
- Carlsson, J.; Acker, H. Relations between pH, oxygen partial pressure and growth in cultured cell spheroids. Int. J. Cancer 1988, 42, 715–720. [Google Scholar] [CrossRef] [PubMed]
- Poland, J.; Sinha, P.; Siegert, A.; Schnölzer, M.; Korf, U.; Hauptmann, S. Comparison of protein expression profiles between monolayer and spheroid cell culture of HT-29 cells revealed fragmentation of CK18 in three-dimensional cell culture. Electrophoresis 2002, 23, 1174–1184. [Google Scholar] [CrossRef]


Publisher’s Note: MDPI stays neutral with regard to jurisdictional claims in published maps and institutional affiliations. |
© 2022 by the authors. Licensee MDPI, Basel, Switzerland. This article is an open access article distributed under the terms and conditions of the Creative Commons Attribution (CC BY) license (https://creativecommons.org/licenses/by/4.0/).
Share and Cite
Salas-Huenuleo, E.; Hernández, A.; Lobos-González, L.; Polakovičová, I.; Morales-Zavala, F.; Araya, E.; Celis, F.; Romero, C.; Kogan, M.J. Peptide Targeted Gold Nanoplatform Carrying miR-145 Induces Antitumoral Effects in Ovarian Cancer Cells. Pharmaceutics 2022, 14, 958. https://doi.org/10.3390/pharmaceutics14050958
Salas-Huenuleo E, Hernández A, Lobos-González L, Polakovičová I, Morales-Zavala F, Araya E, Celis F, Romero C, Kogan MJ. Peptide Targeted Gold Nanoplatform Carrying miR-145 Induces Antitumoral Effects in Ovarian Cancer Cells. Pharmaceutics. 2022; 14(5):958. https://doi.org/10.3390/pharmaceutics14050958
Chicago/Turabian StyleSalas-Huenuleo, Edison, Andrea Hernández, Lorena Lobos-González, Iva Polakovičová, Francisco Morales-Zavala, Eyleen Araya, Freddy Celis, Carmen Romero, and Marcelo J. Kogan. 2022. "Peptide Targeted Gold Nanoplatform Carrying miR-145 Induces Antitumoral Effects in Ovarian Cancer Cells" Pharmaceutics 14, no. 5: 958. https://doi.org/10.3390/pharmaceutics14050958