
Thermal, Mechanical and Biocompatibility Analyses of Photochemically Polymerized PEGDA250 for Photopolymerization-Based Manufacturing Processes

 , ,
, ,  ,
,
Abstract
:
1. Introduction
- PEGDA in composition with gelatin methacrylate as injectable hydrogels for periodontal treatments [15]
- PEGDA hydrogel microneedles patches as a drug delivery for the treatment of skin diseases [16]
- PEGDA as an in vitro 3D cancer model for different types of cancer cells [17]
- Compositions of PEGDA hydrogels with different molecular masses for cartilage repair [18]
- PEGDA/chitosan films as a wound-dressing material [19]
- 3D-printed PEGDA anti-inflammatory scaffolds for regeneration of osteochondral defects [20]
- Composite hydrogels for cartilage tissue engineering [21]
- Lobule-like hepatocyte-laden 3D constructs in combination with gelatin methacrylate [22]
- 3D bioinks for cardiac tissue engineering [23]
2. Materials and Methods
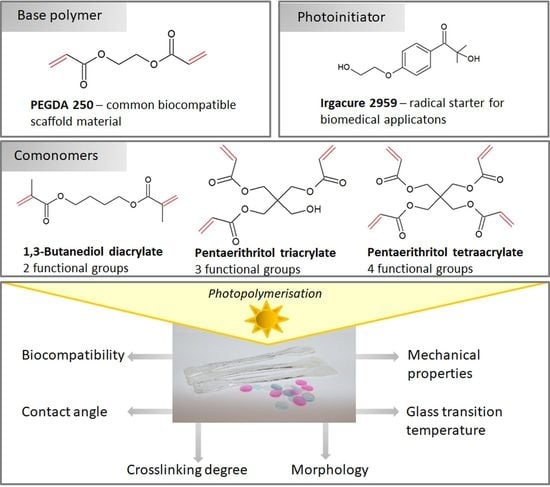
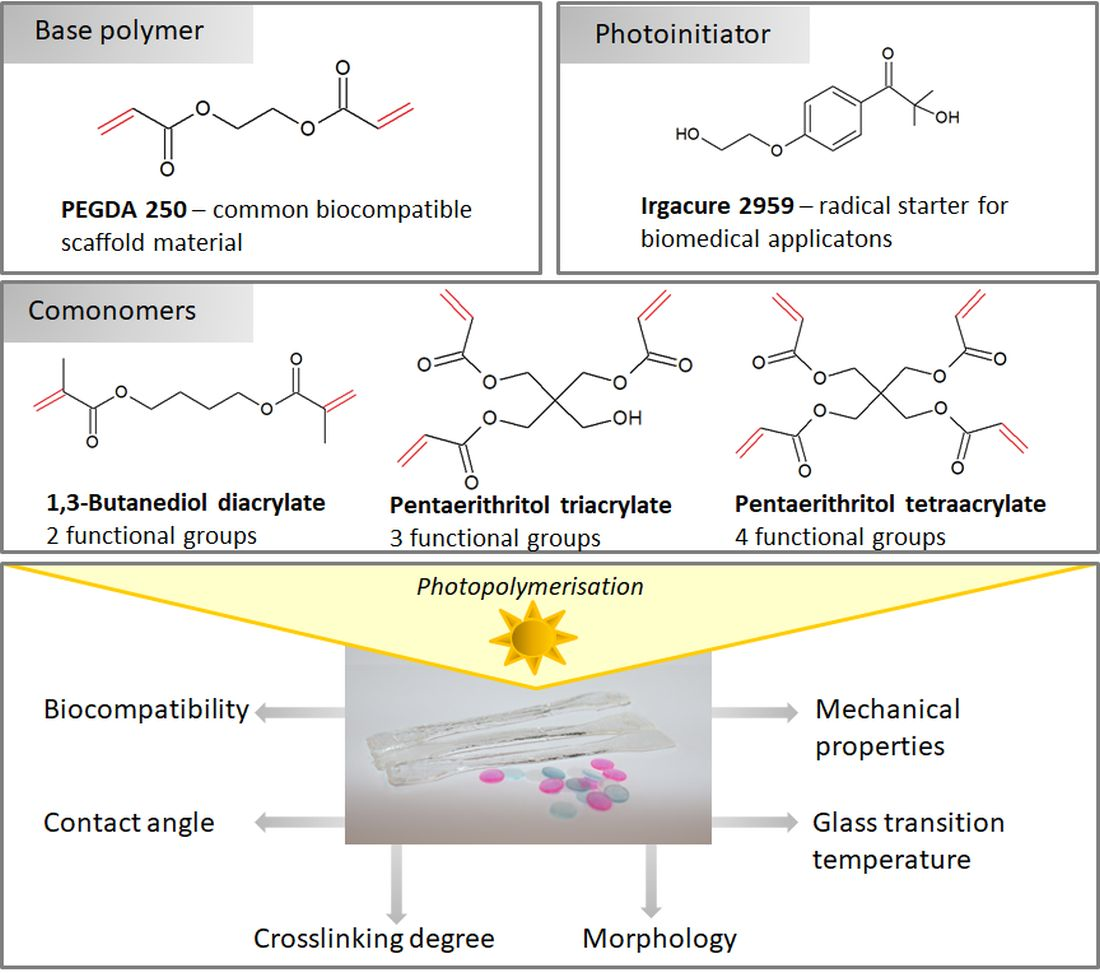
2.1. Materials
2.2. PEGDA Polymerization
- PEGDA containing 0.5%, 0.75%, 1% and 1.25% (w/v) PI
- PEGDA with 1%, 5% and 10% 1,3-butanediol diacrylate (v/v) each with 0.5%, 0.75%, 1% and 1.25% (w/v) PI
- PEGDA with 1%, 5% and 10% pentaerythritol triacrylate (v/v) each with 0.5%, 0.75%, 1% and 1.25% (w/v) PI
- PEGDA with 1%, 5% and 10% pentaerythritol tetraacrylate (v/v) each with 0.5%, 0.75%, 1% and 1.25% (w/v) PI
2.3. Washing Procedure
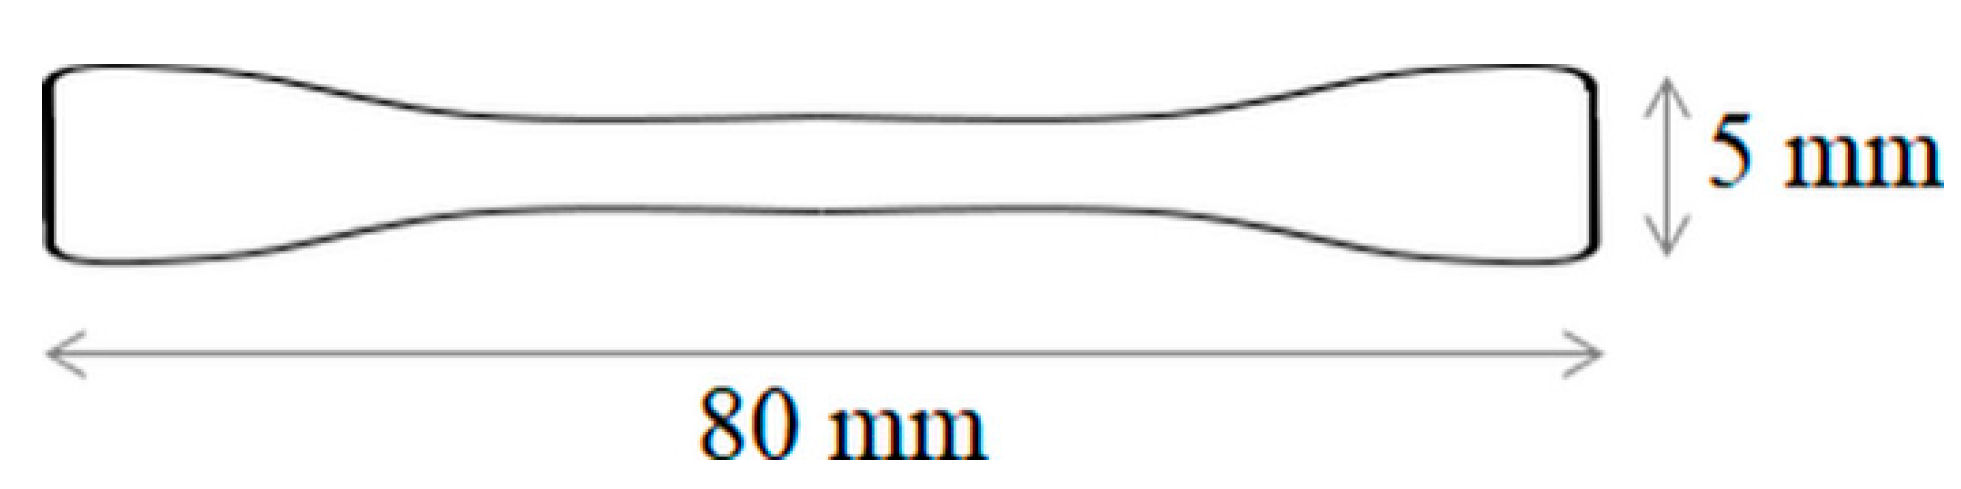
2.4. Uniaxial Tensile Tests
2.5. Contact Angle Measurements
2.6. Morphology Analysis
2.7. Differential Scanning Calorimetry
2.8. Cell Culture and Cell Viability Assay
2.9. Fourier Transform Infrared Spectroscopy (FTIR) Characterization
2.10. Statistical Analysis
3. Results
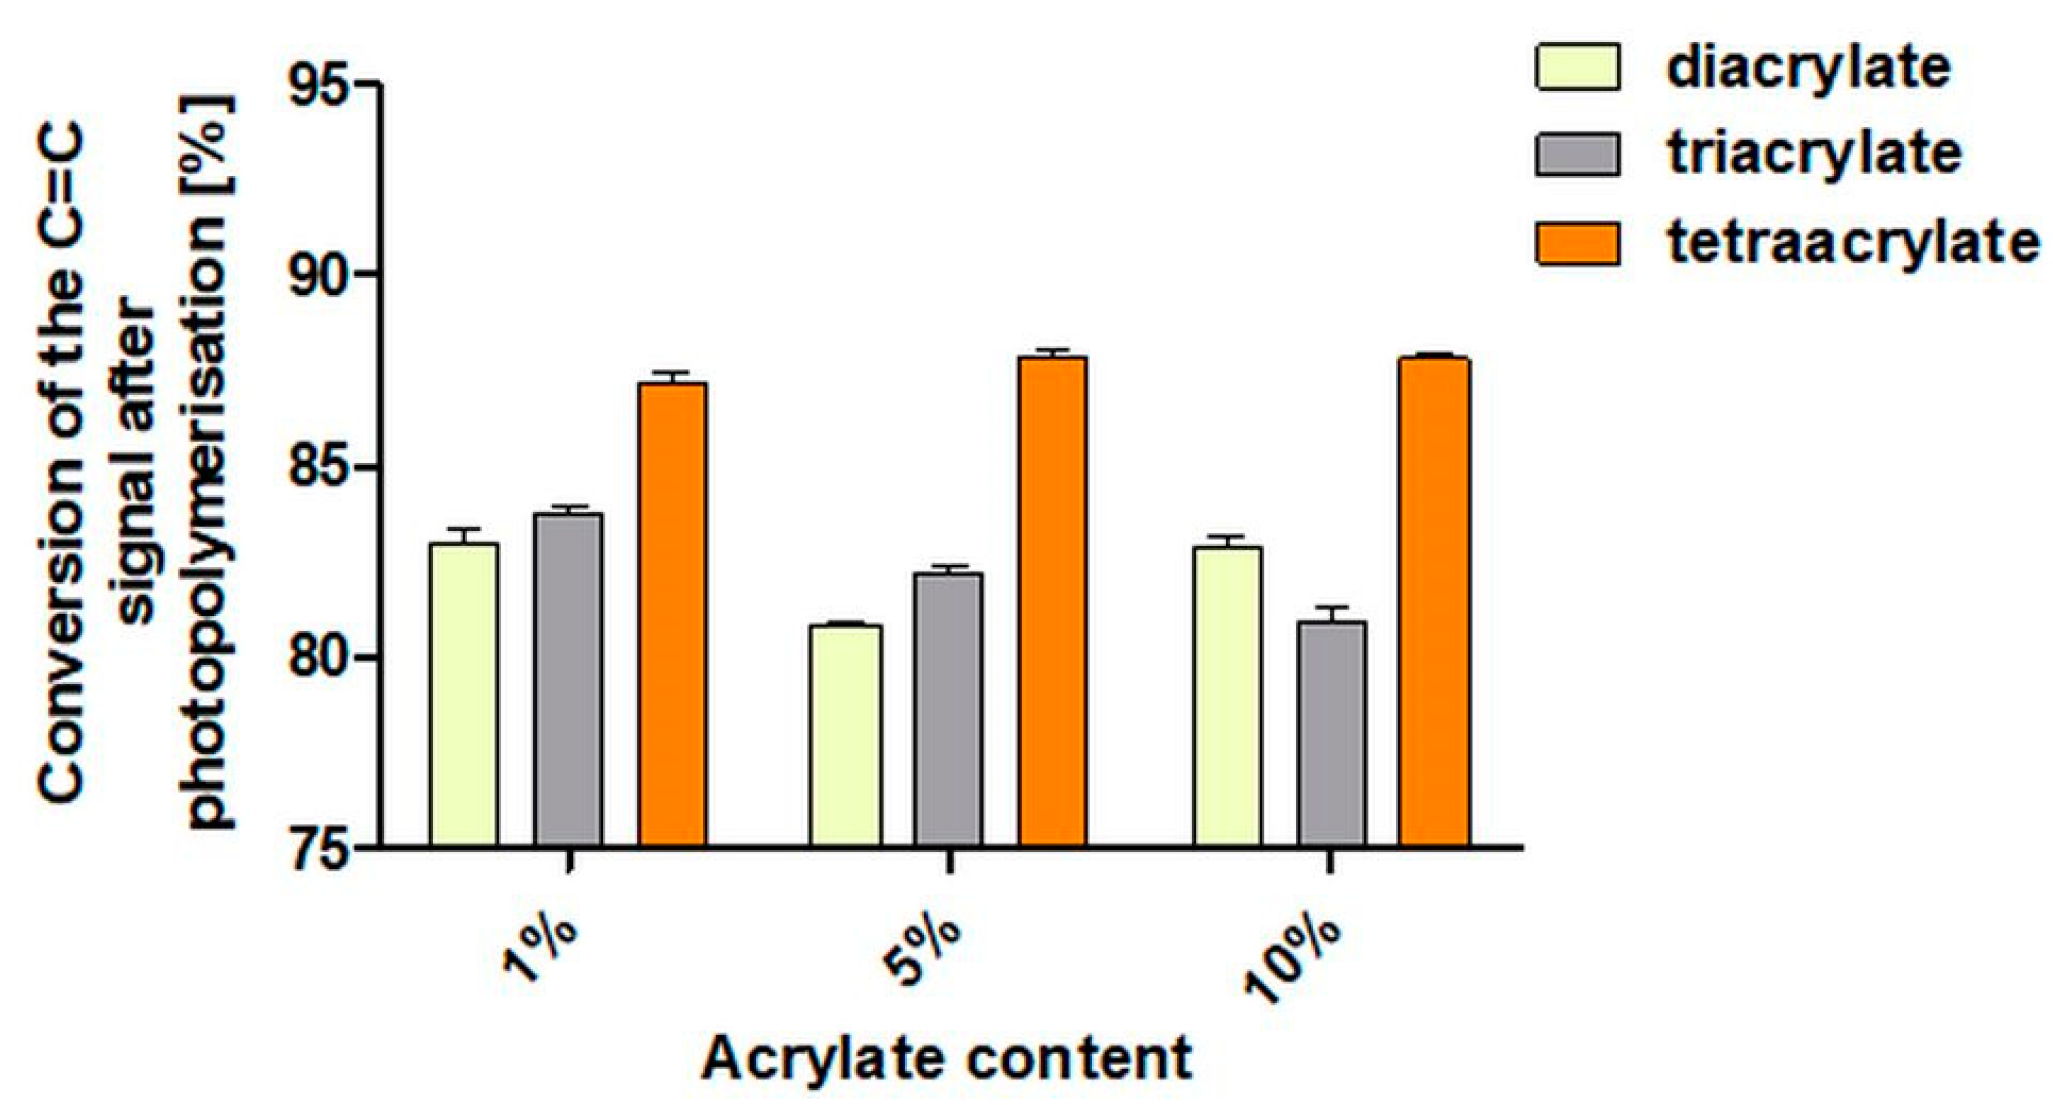
3.1. IR
3.2. Contact Angle Measurements
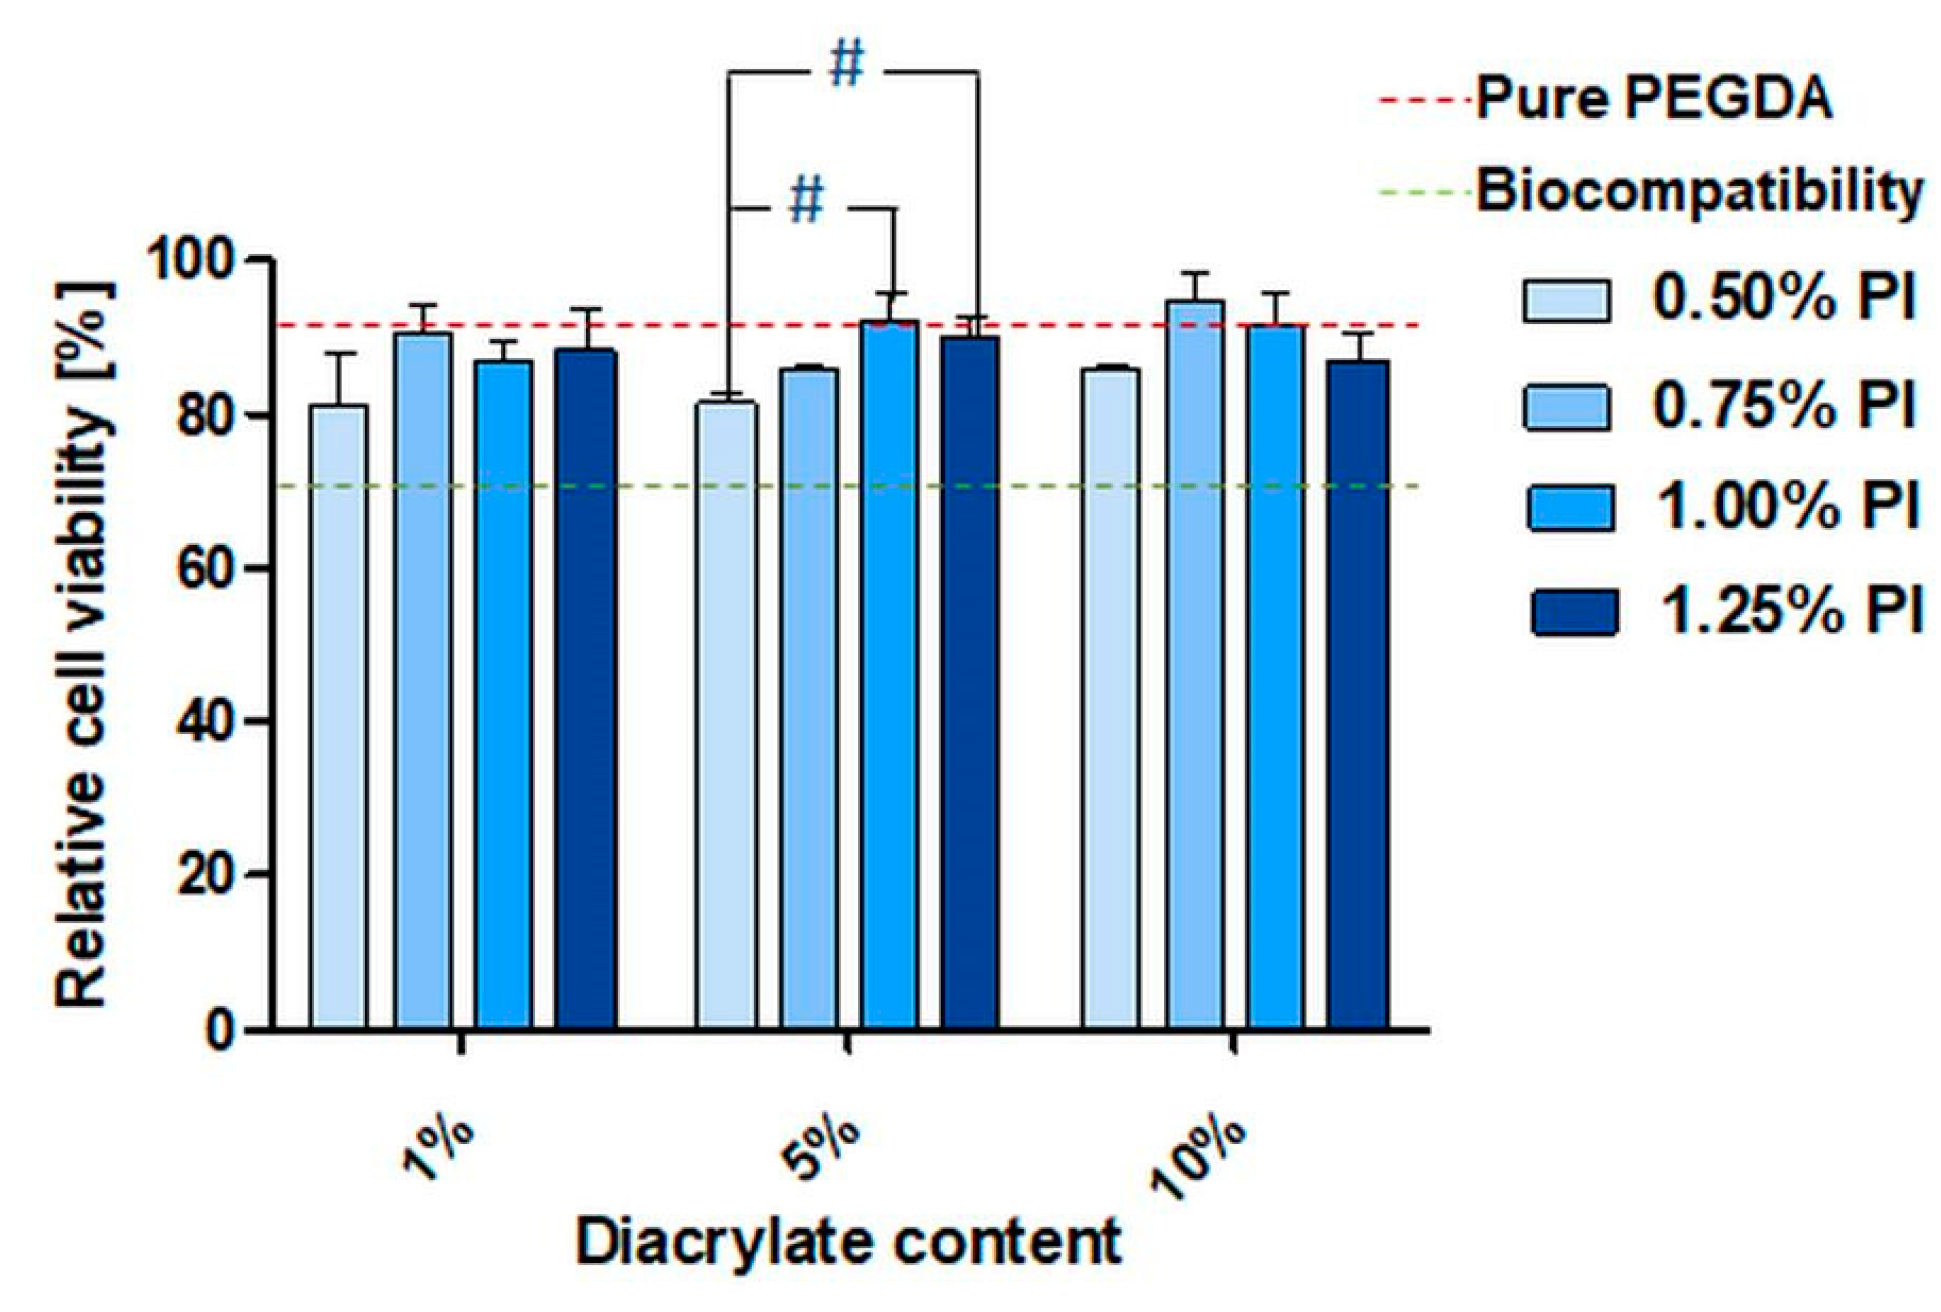
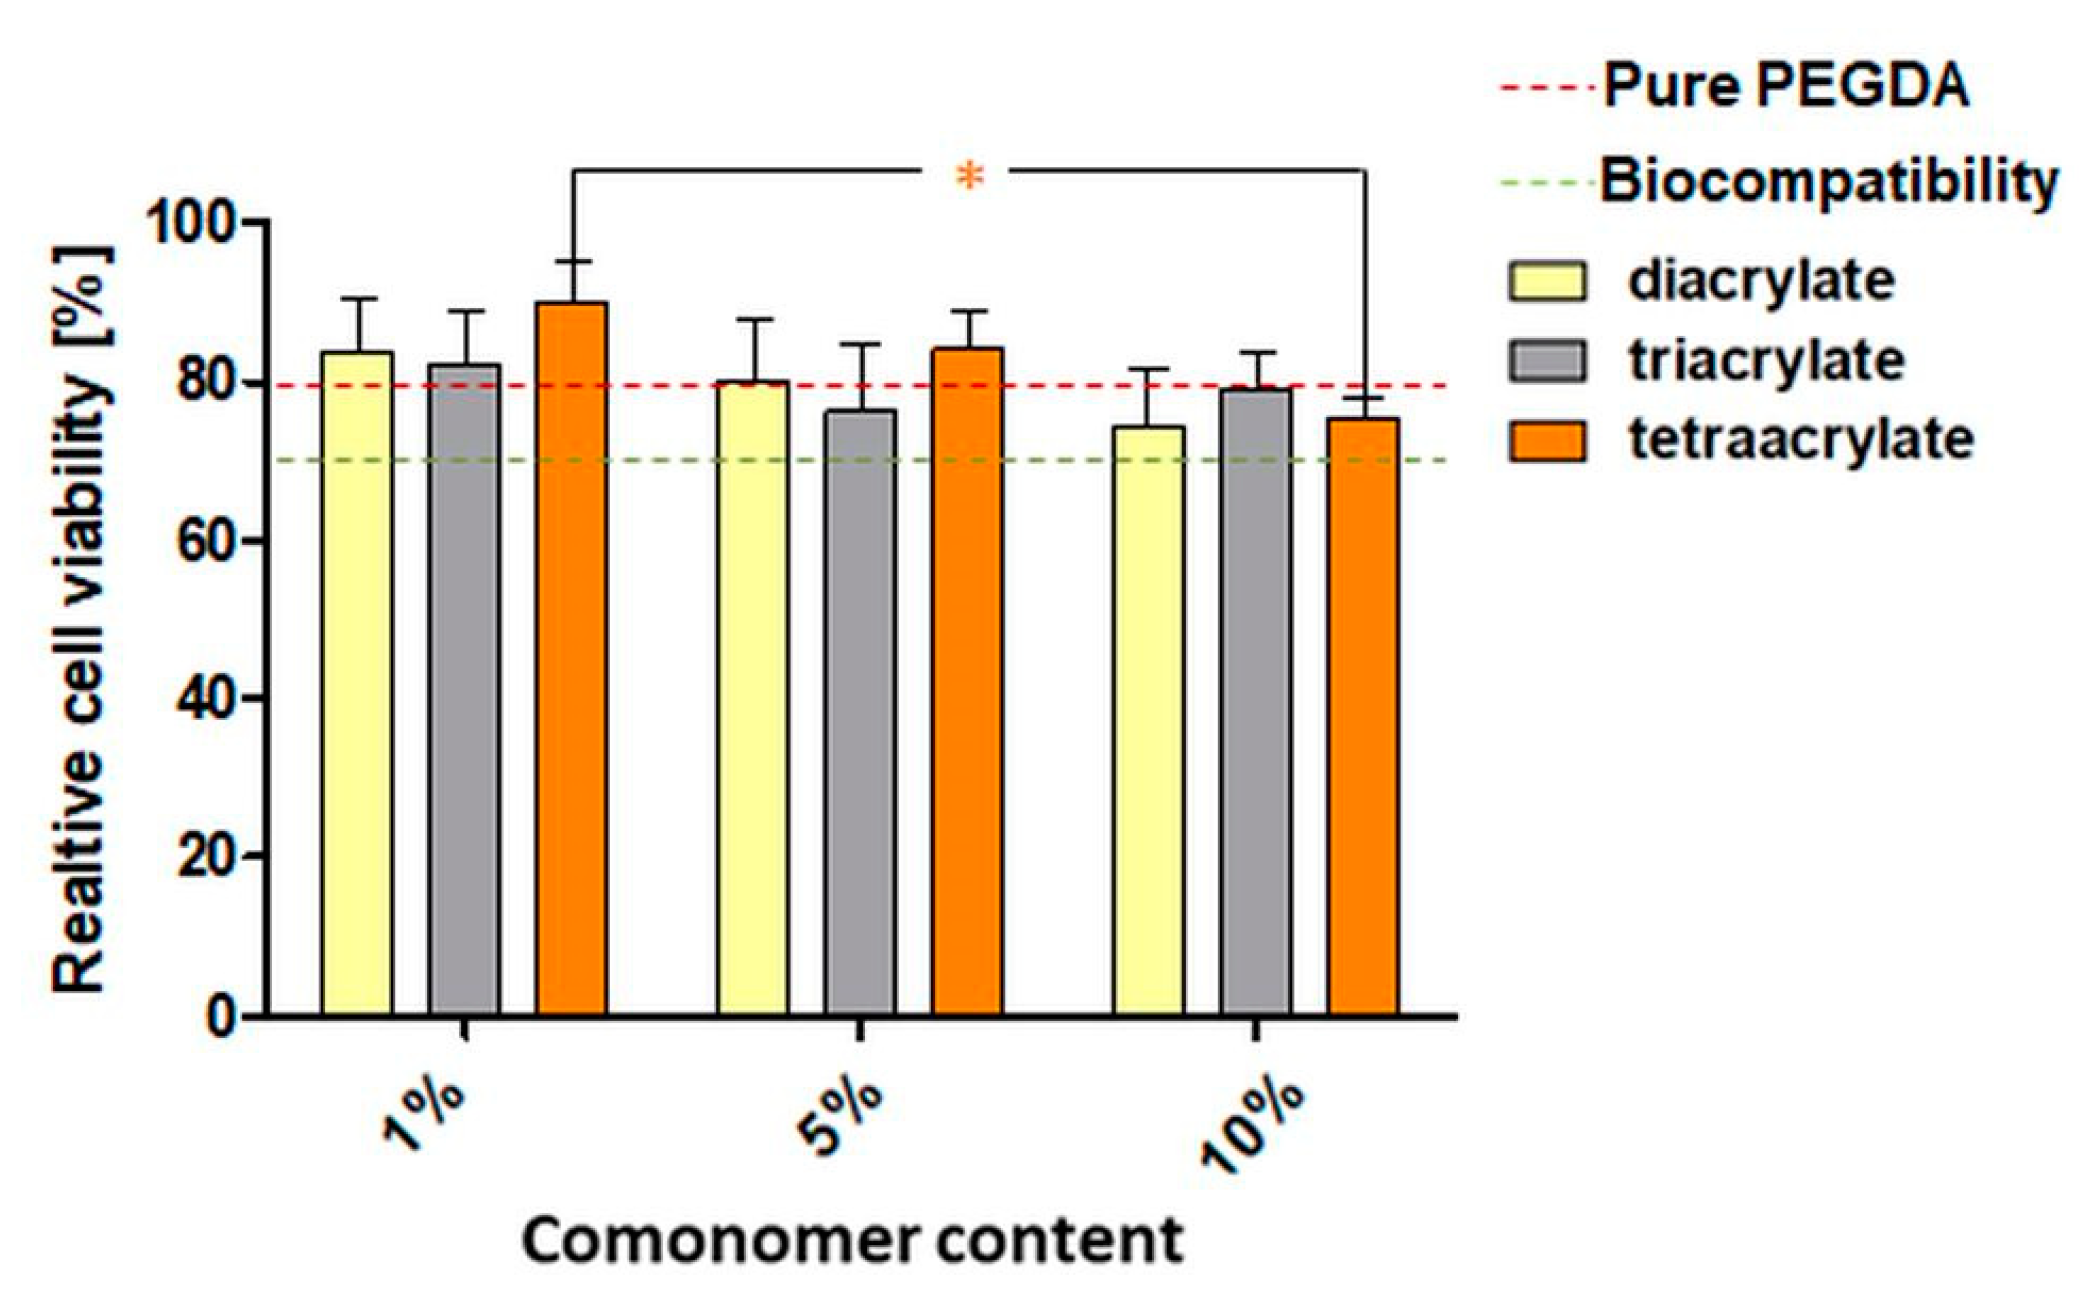
3.3. In Vitro Biocompatibility of PEGDA Copolymers Determined by Eluate Test
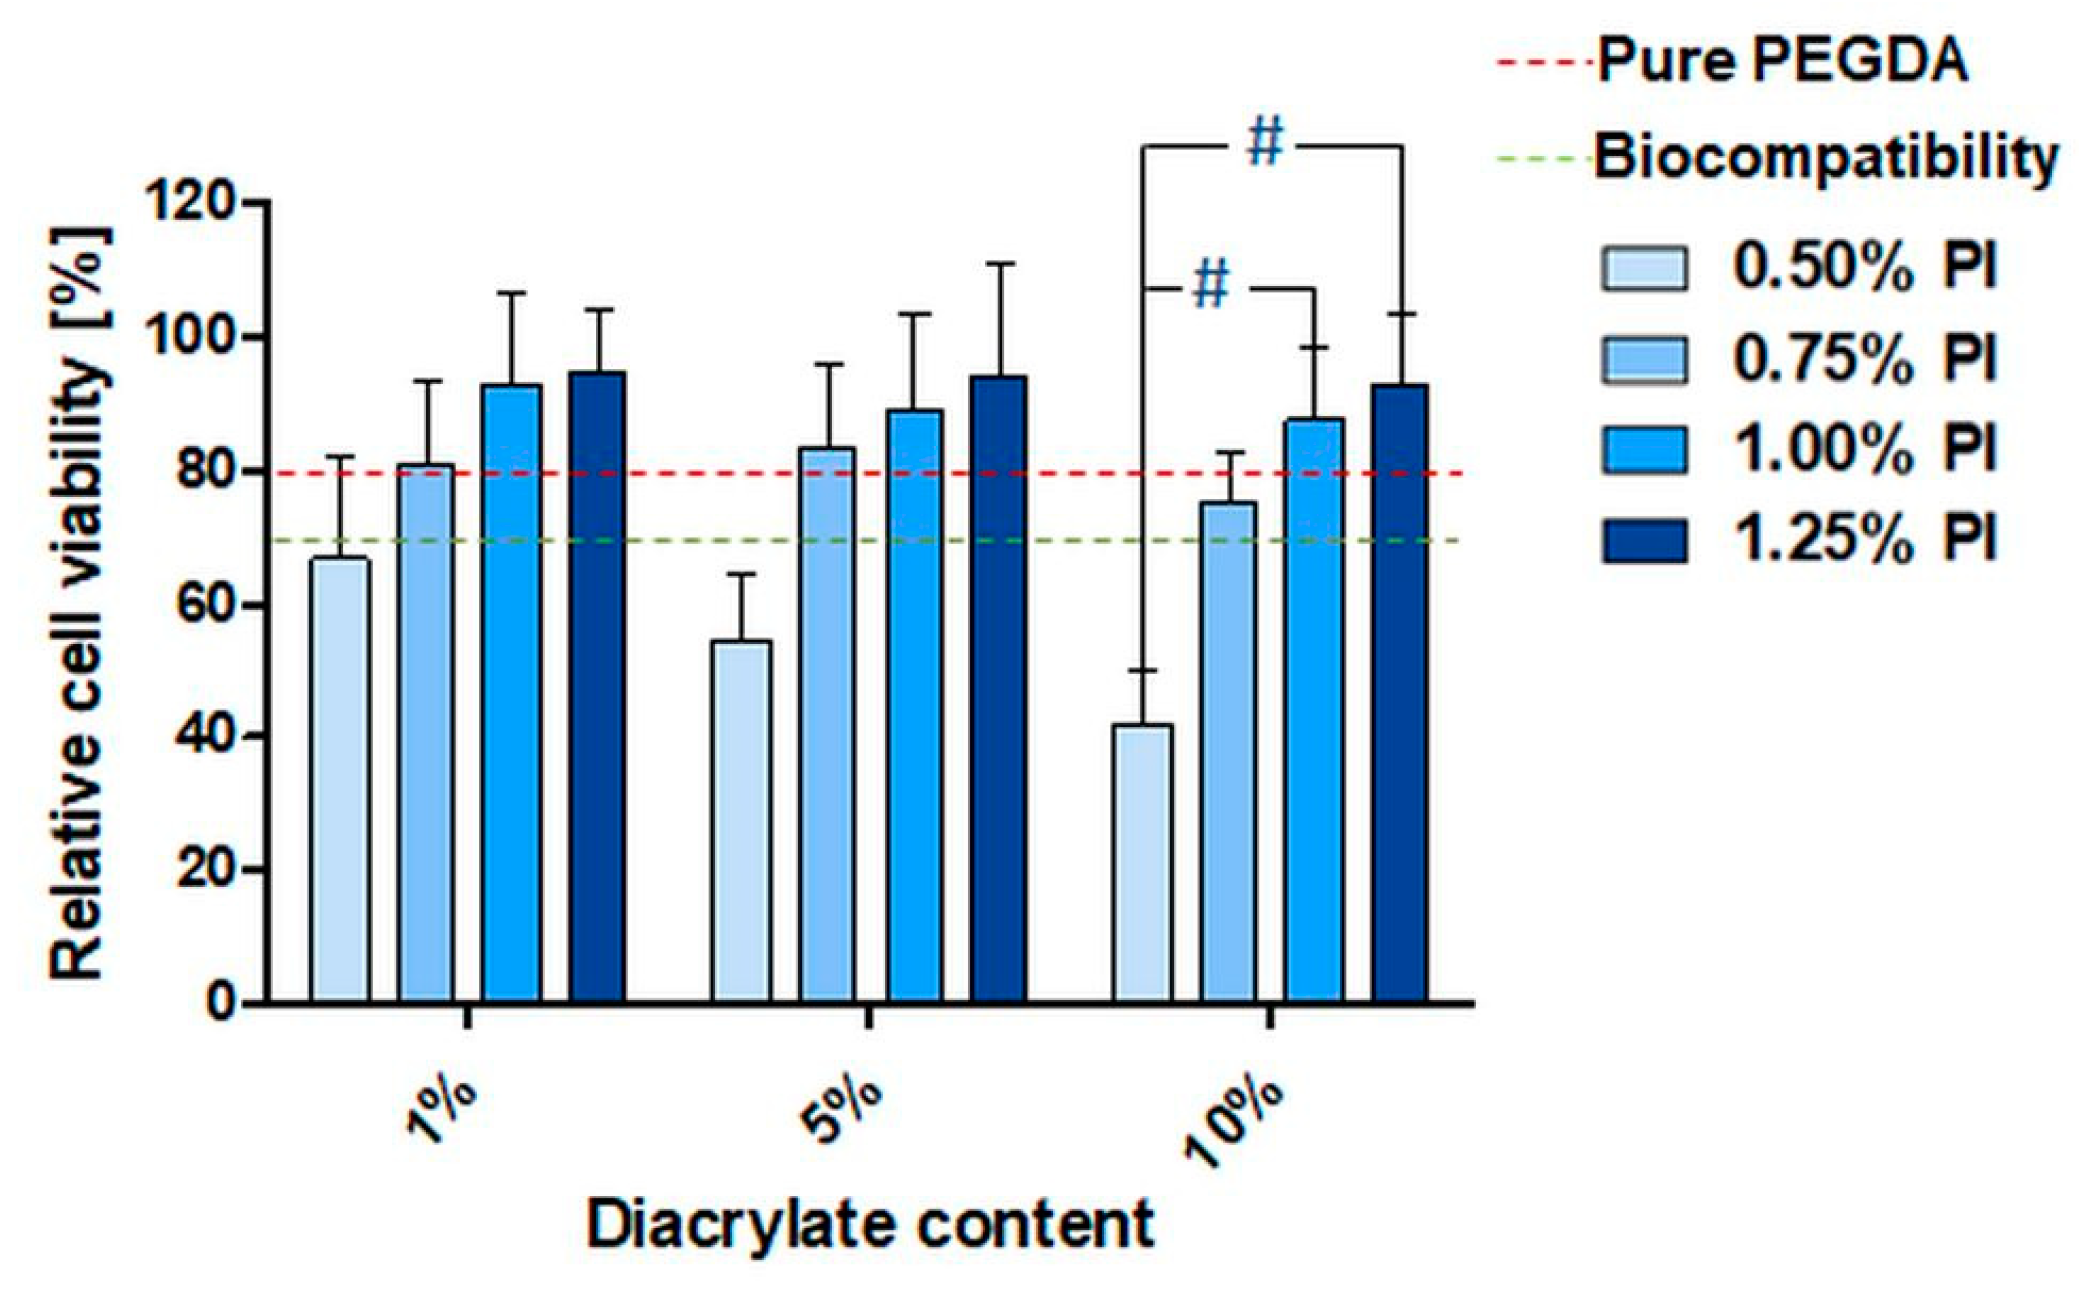
3.4. In Vitro Biocompatibility of PEGDA Copolymers Determined by Direct Contact Test
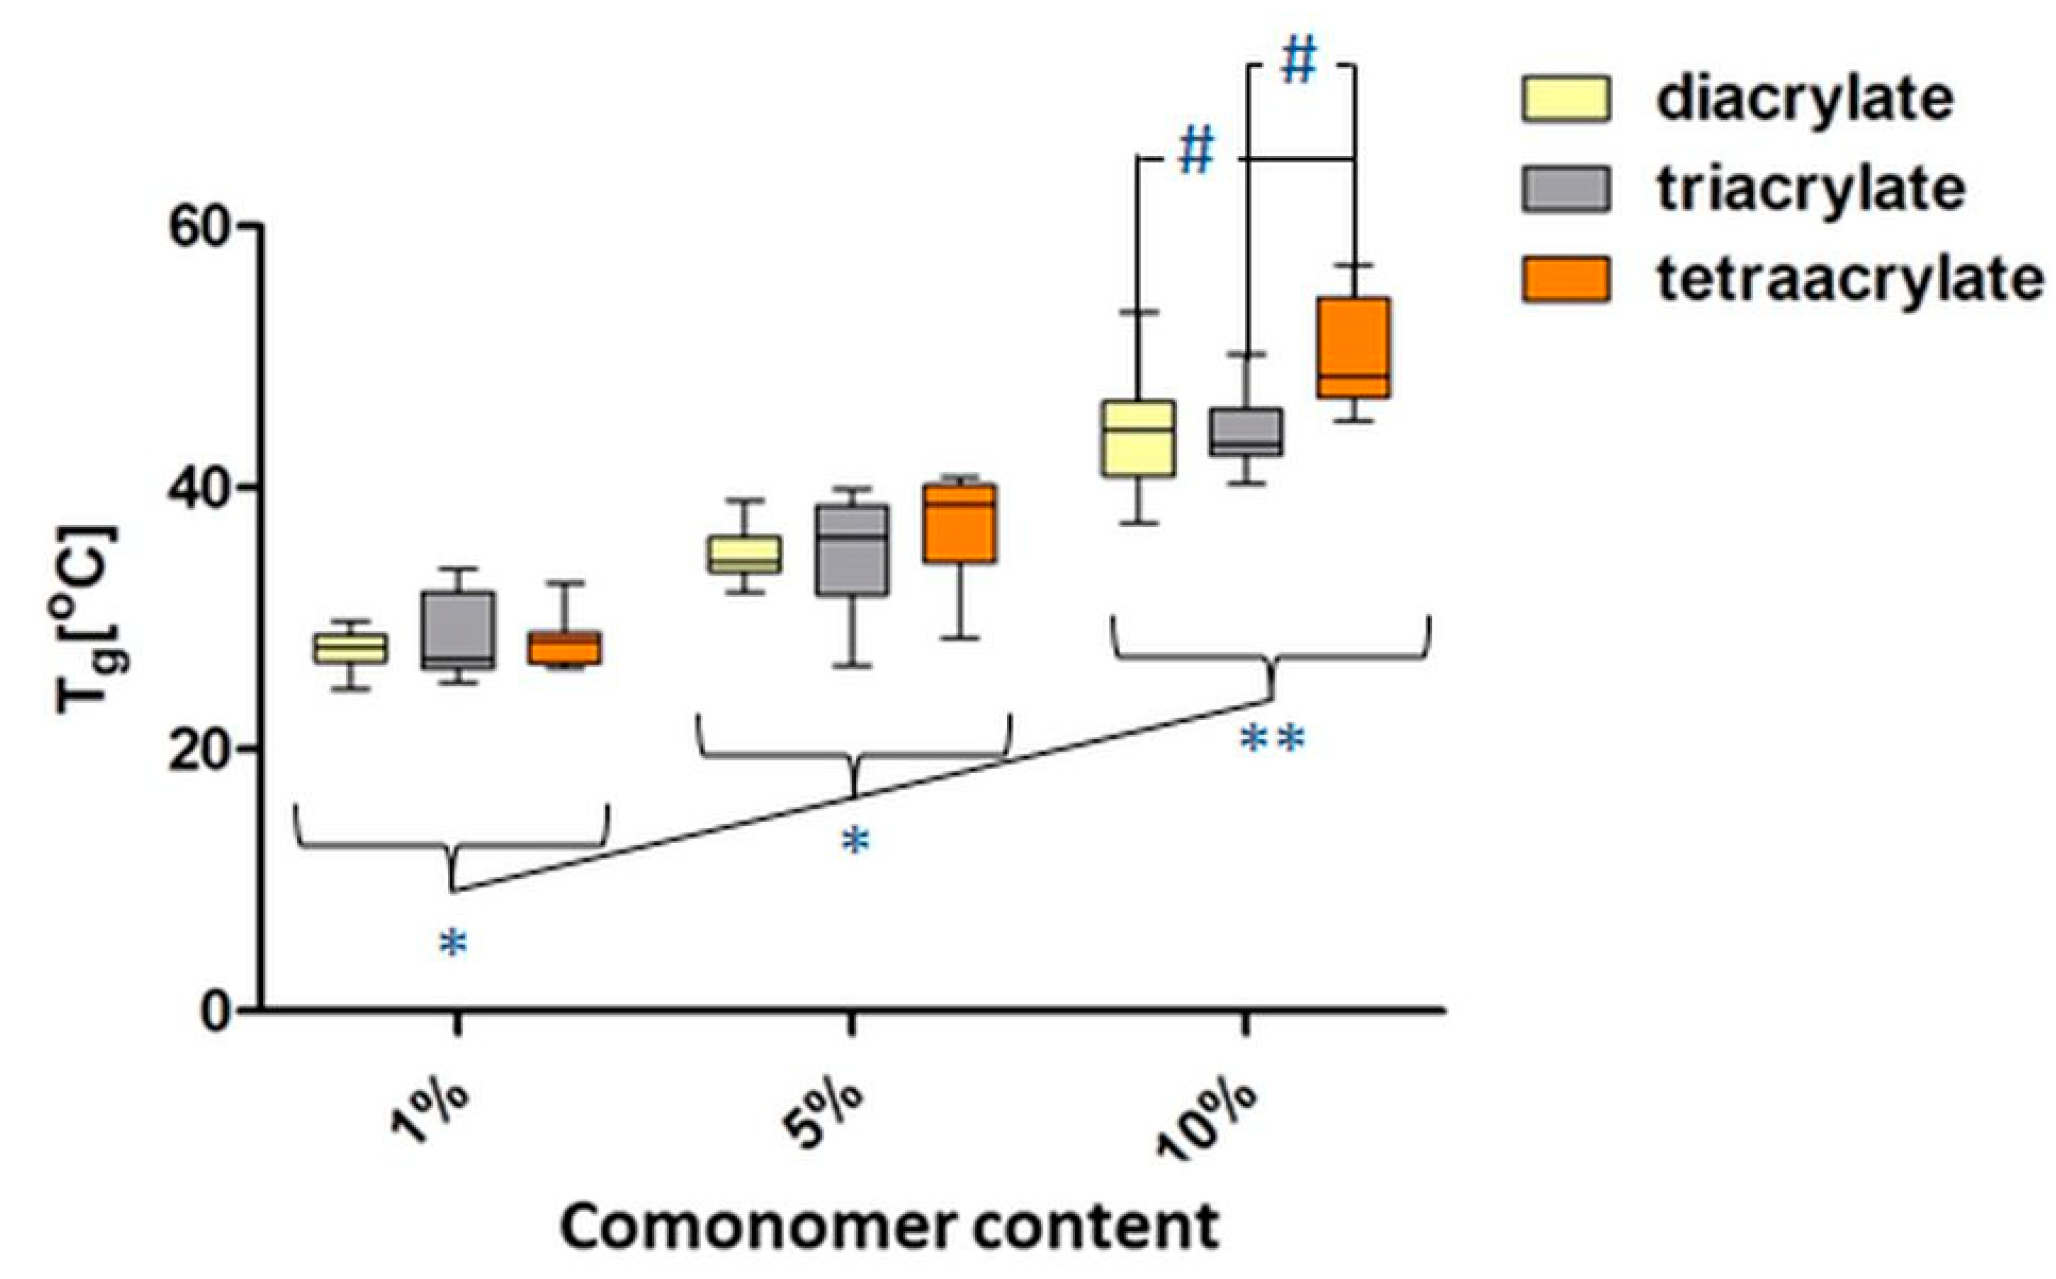
3.5. Thermal Properties of PEGDA Using Differential Scanning Calorimetry (DSC)
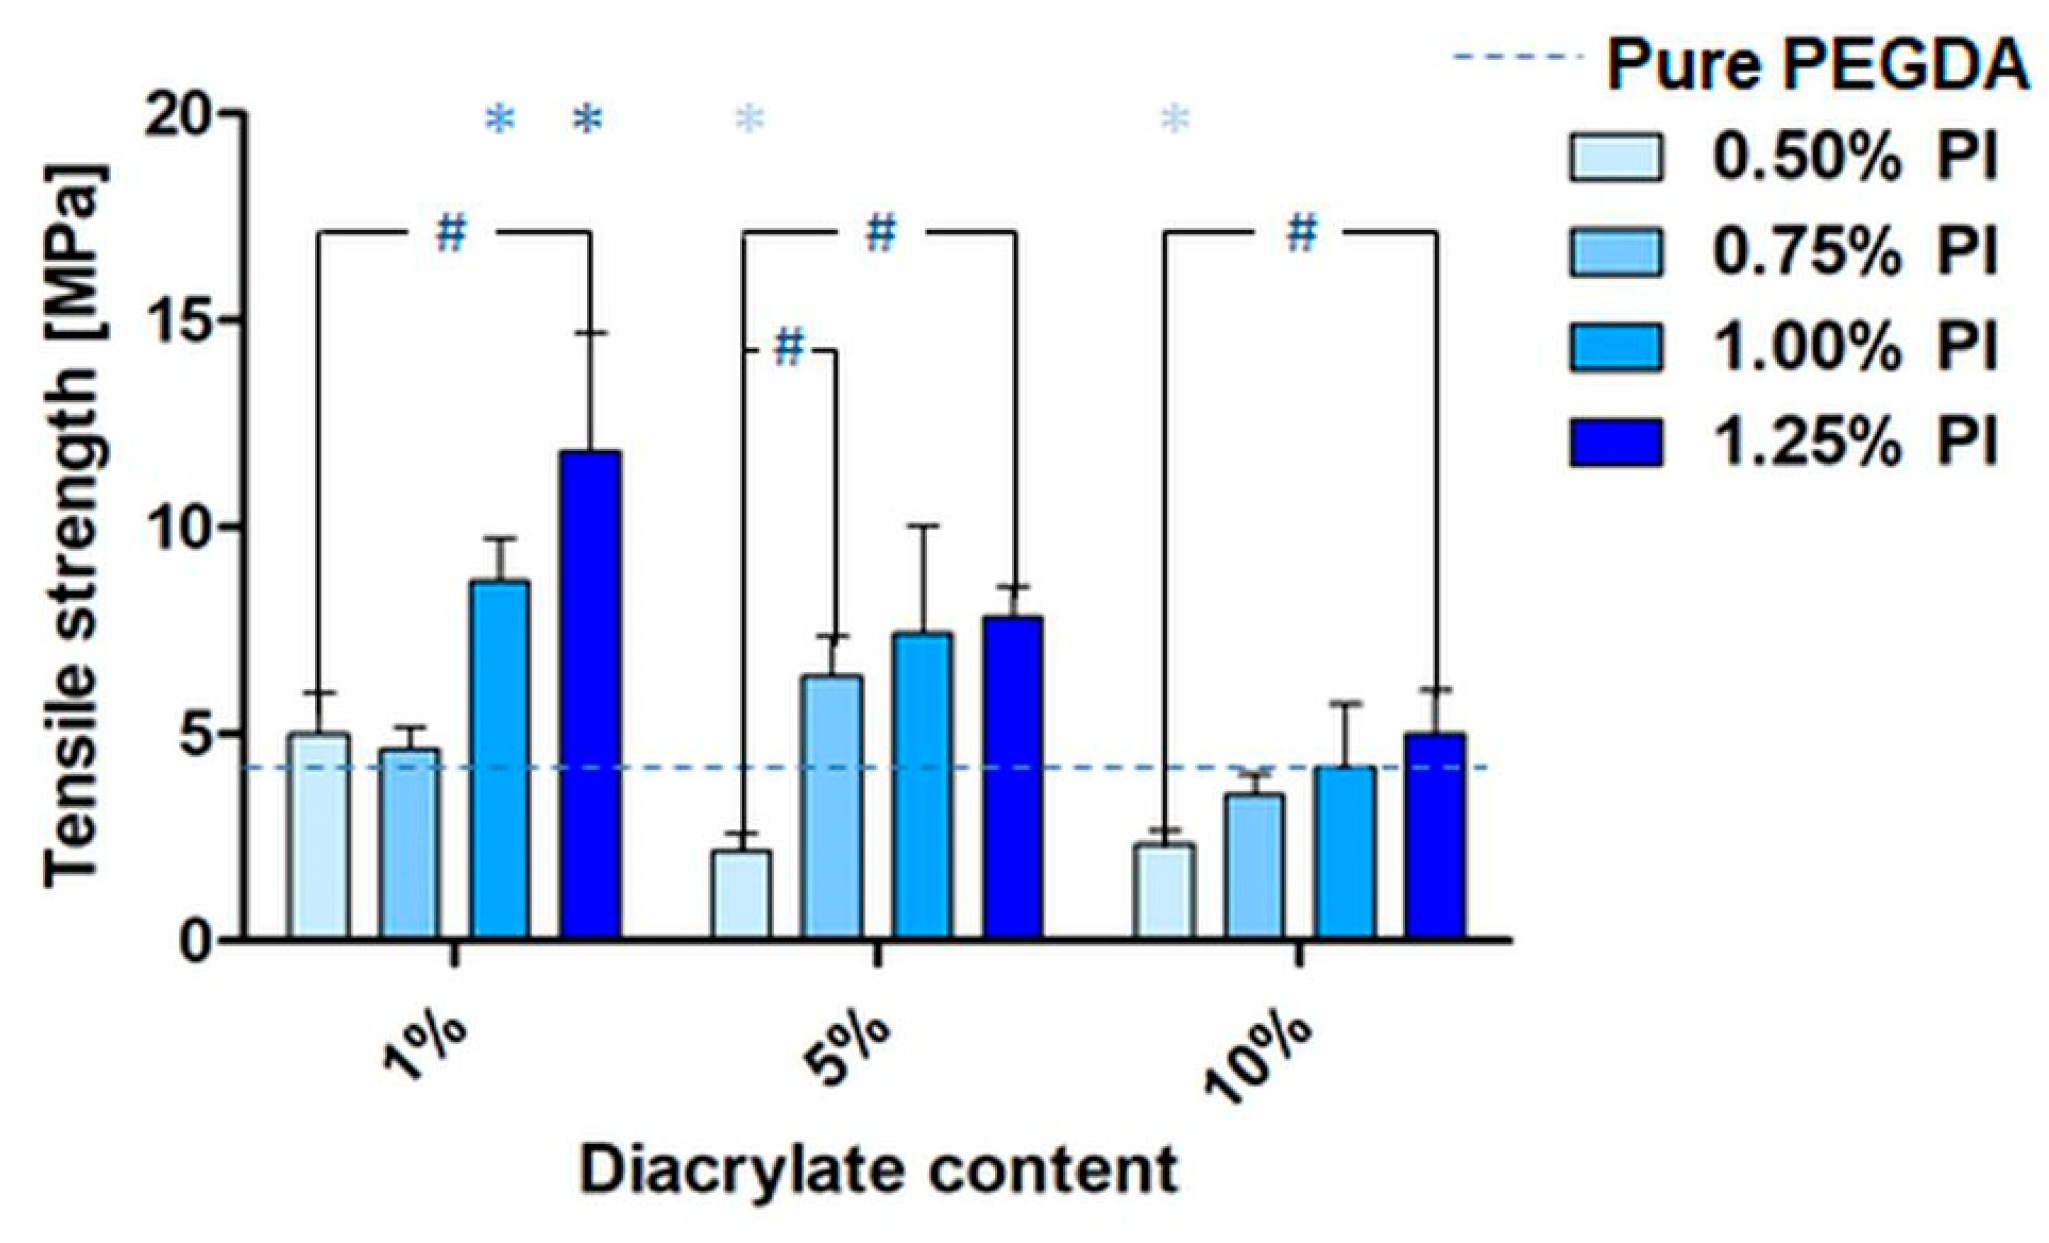
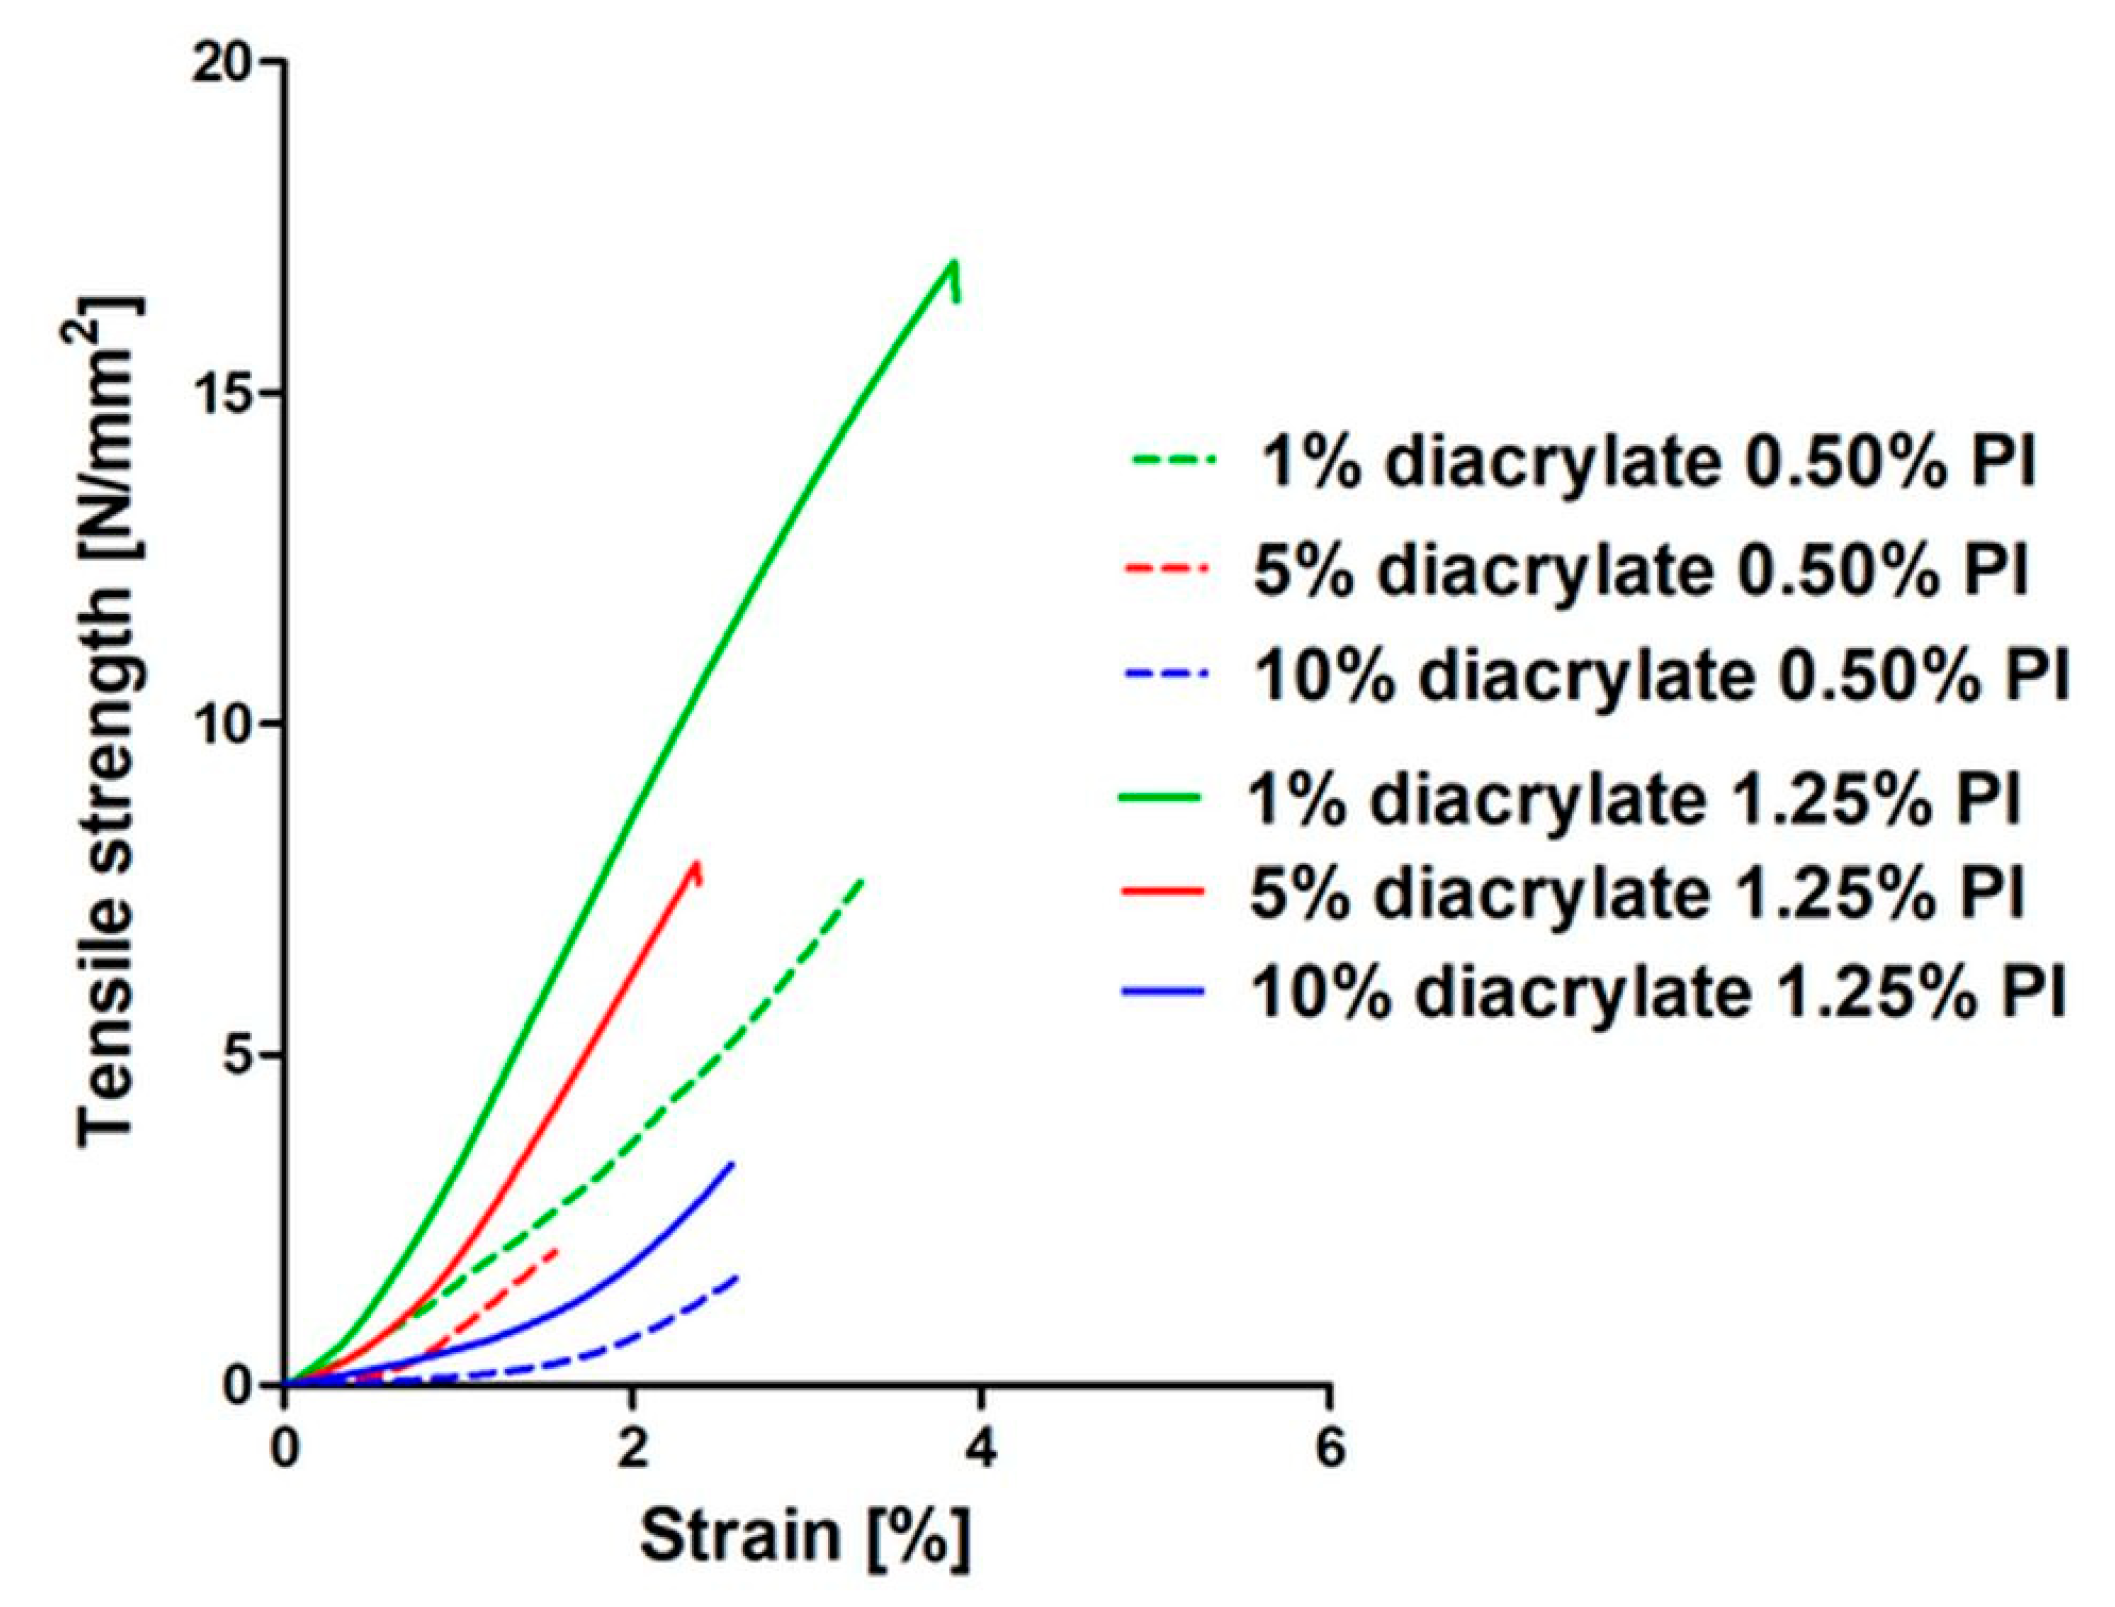
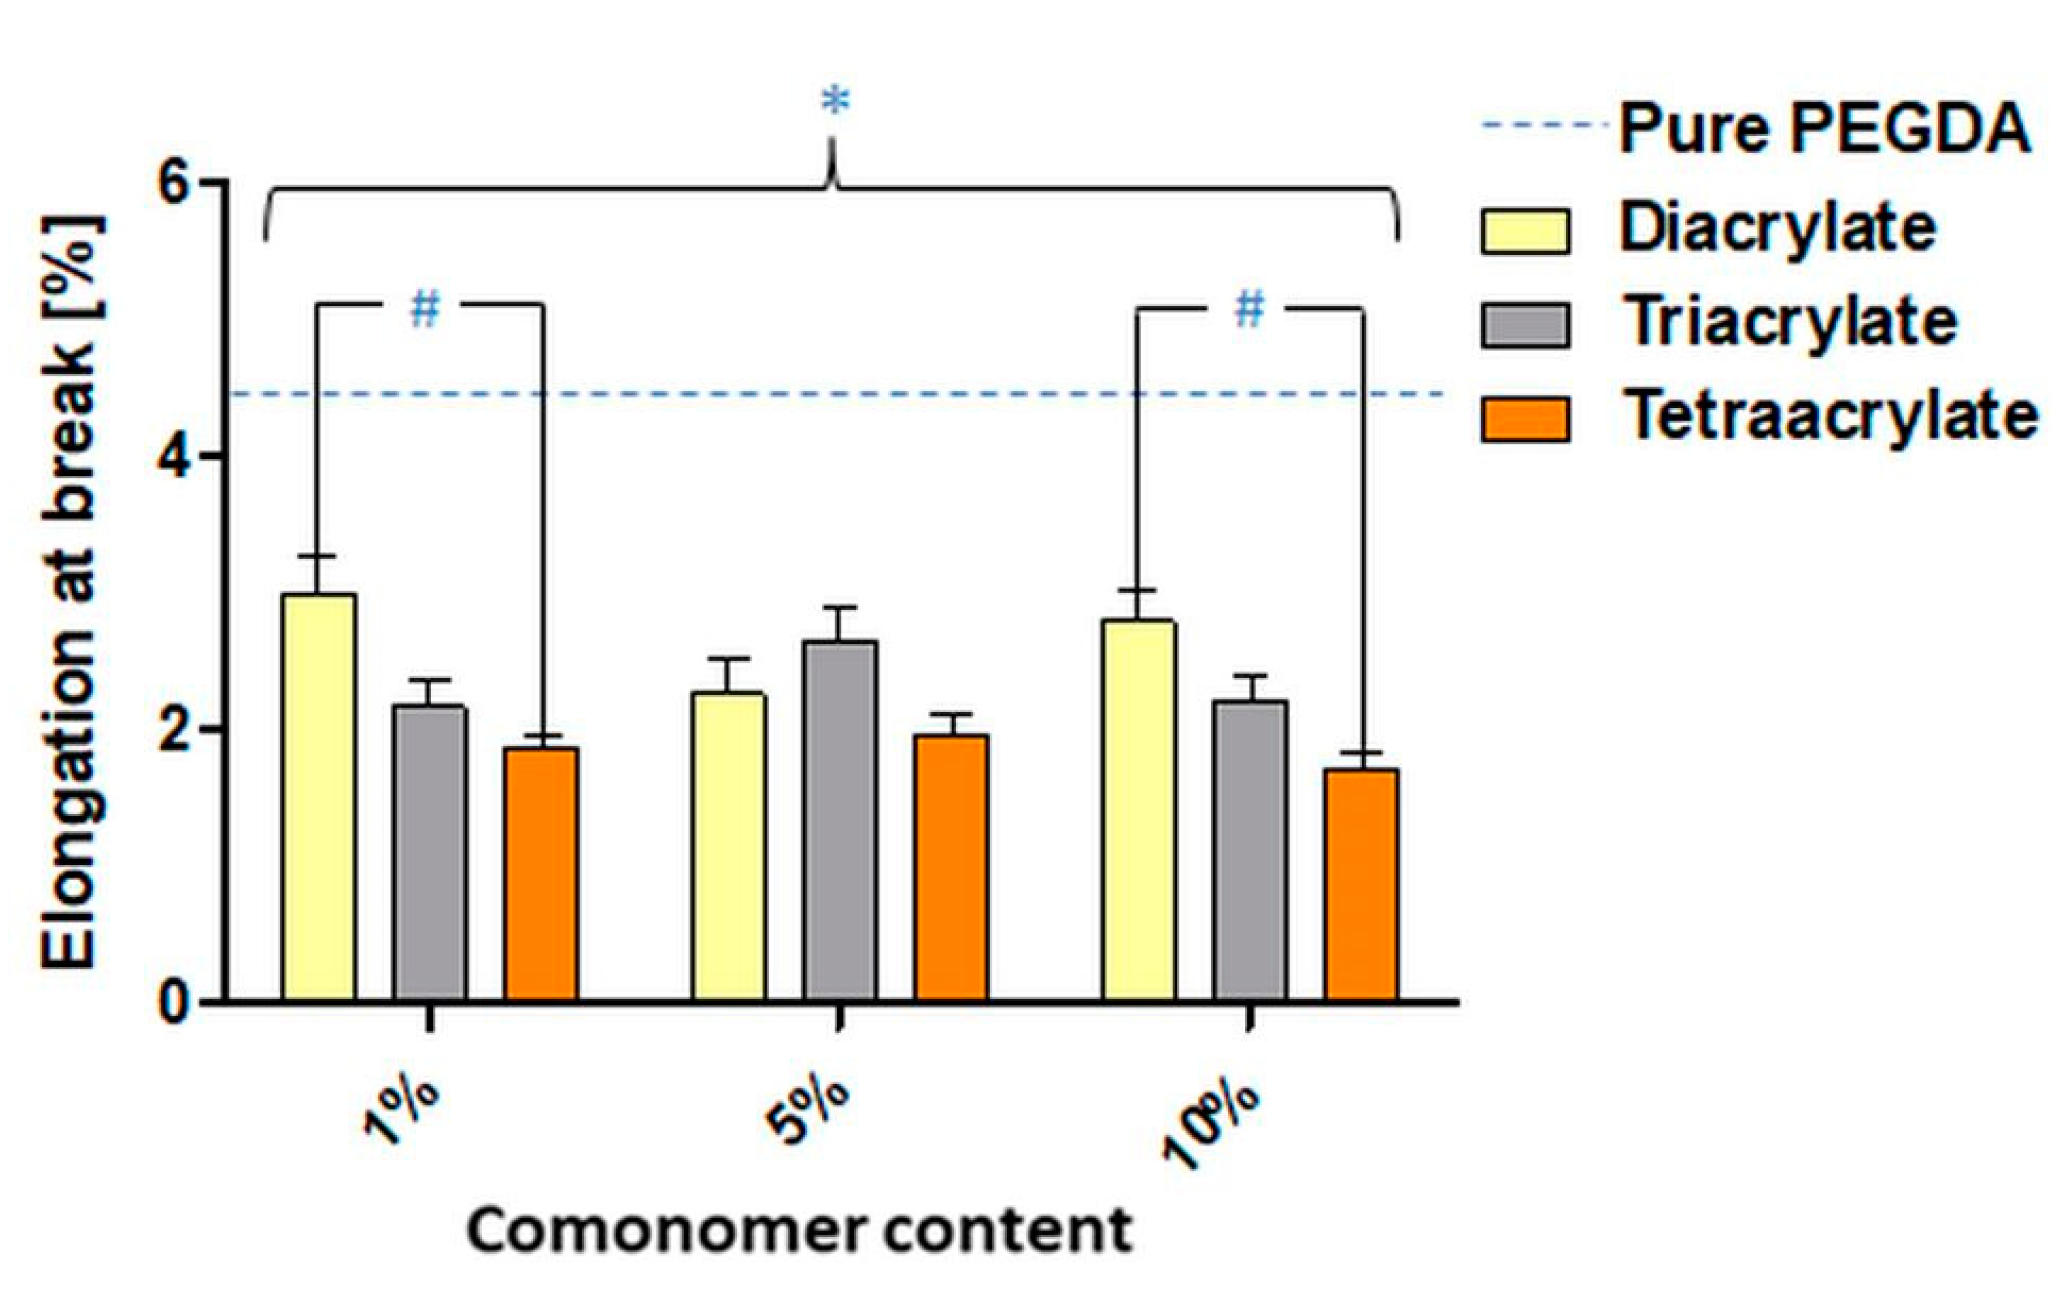
3.6. Mechanical Results
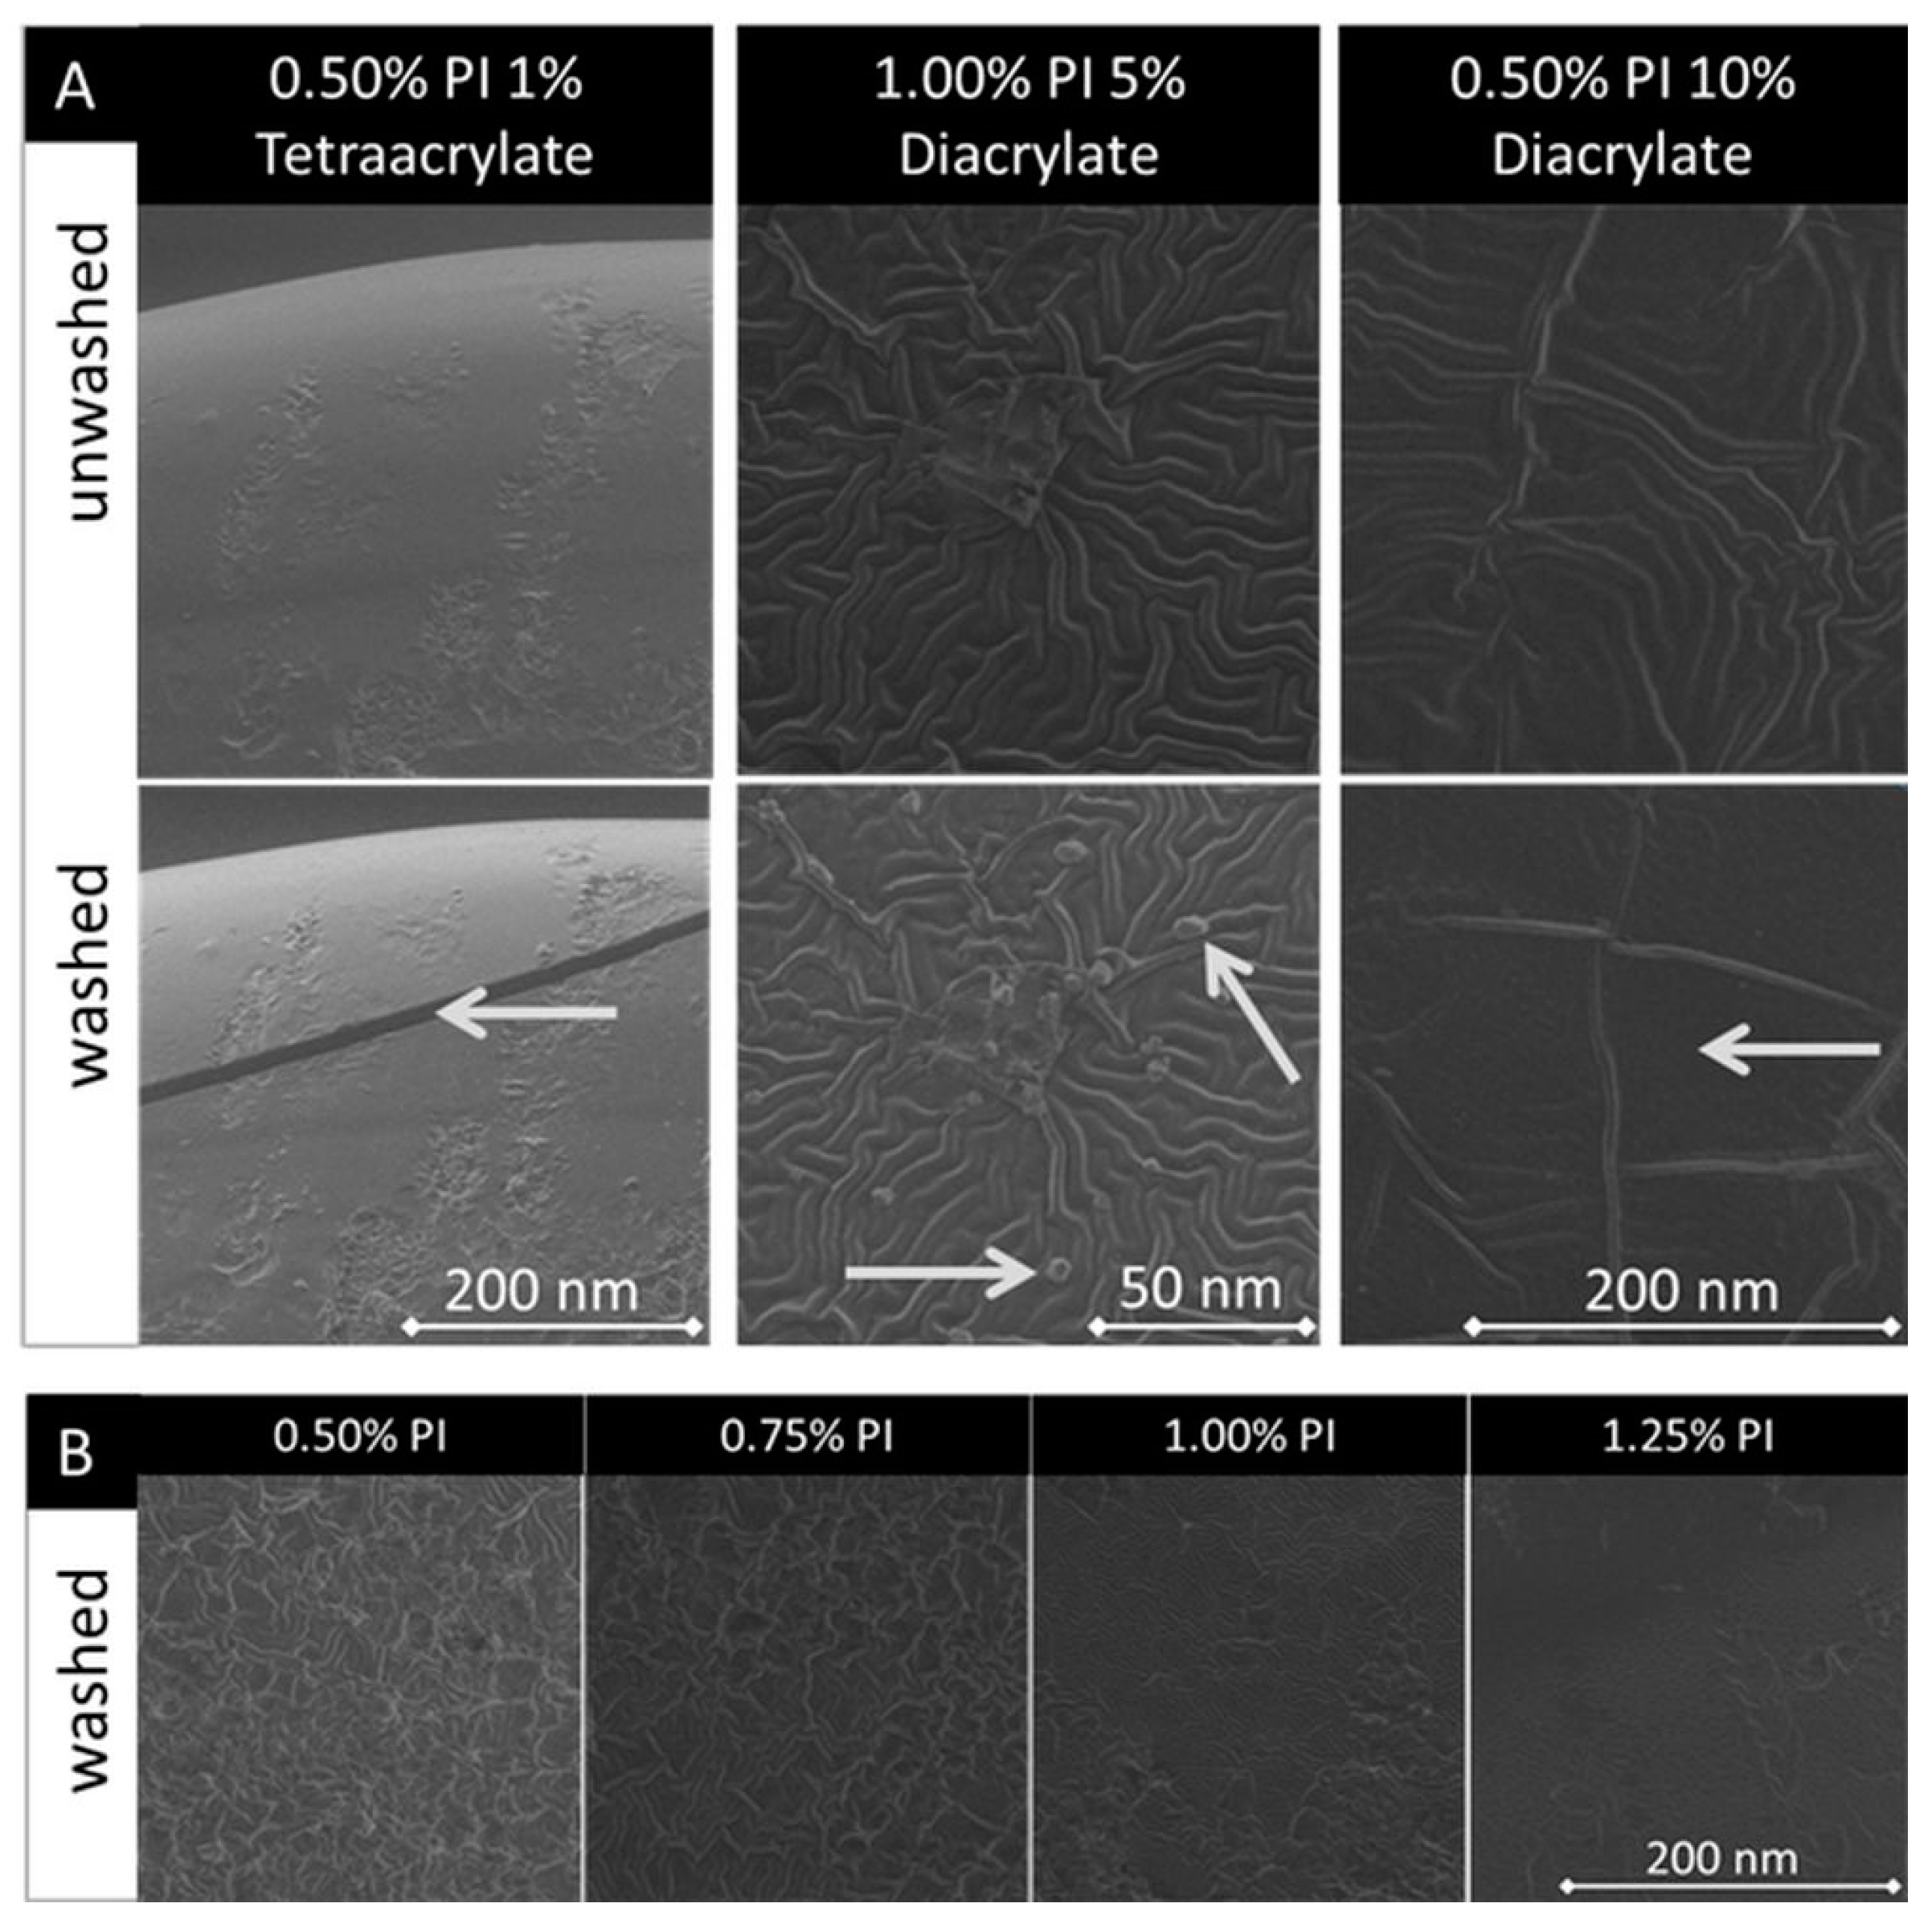
3.7. Morphology—SEM
4. Discussion
4.1. Influence of the Washing Procedure
4.2. Influence of the PI Concentration
4.3. Influence of the Comonomer Type and Concentration
5. Conclusions
Supplementary Materials
Author Contributions
Funding
Institutional Review Board Statement
Informed Consent Statement
Data Availability Statement
Acknowledgments
Conflicts of Interest
References
- Lyu, S.; Untereker, D. Degradability of polymers for implantable biomedical devices. Int. J. Mol. Sci. 2009, 10, 4033–4065. [Google Scholar] [CrossRef] [PubMed] [Green Version]
- Song, R.; Murphy, M.; Li, C.; Ting, K.; Soo, C.; Zheng, Z. Current development of biodegradable polymeric materials for biomedical applications. Drug Des. Dev. Ther. 2018, 12, 3117–3145. [Google Scholar] [CrossRef] [PubMed] [Green Version]
- Tejas, D.V.T.V. A glimpse of biodegradable polymers and their biomedical applications. e-Polymers 2019, 19, 385–410. [Google Scholar]
- Francis, J. Biomedical Applications of Polymers—An Overview. Curr. Trends Biomed. Eng. Biosci. 2018, 15, 44–45. [Google Scholar] [CrossRef]
- Wei, Q.; Deng, N.-N.; Guo, J.; Deng, J. Synthetic Polymers for Biomedical Applications. Int. J. Biomater. 2018, 2018, 7158621. [Google Scholar] [CrossRef] [PubMed]
- Mahapatro, A.S.; Kulshrestha, A. Polymers for Biomedical Applications; ACS Symposium Series; American Chemical Society: Washington, DC, USA, 2008. [Google Scholar]
- Tibbitt, M.W.; Rodell, C.B.; Burdick, J.A.; Anseth, K.S. Progress in material design for biomedical applications. Proc. Natl. Acad. Sci. USA 2015, 112, 14444–14451. [Google Scholar] [CrossRef] [PubMed] [Green Version]
- Musumeci, G.; Loreto, C.; Castorina, S.; Imbesi, R.; Leonardi, R.; Castrogiovanni, P. New perspectives in the treatment of cartilage damage. Poly(ethylene glycol) diacrylate (PEGDA) scaffold. Ital. J. Anat. Embryol. 2013, 118, 204–210. [Google Scholar] [PubMed]
- Duan, A.; Li, Y.; Li, B.; Zhu, P. 3D-printable thermochromic acrylic resin with excellent mechanical performance. J. Appl. Polym. Sci. 2019, 137, 48277. [Google Scholar] [CrossRef]
- Fairbanks, B.D.; Schwartz, M.P.; Bowman, C.N.; Anseth, K.S. Photoinitiated polymerization of PEG-diacrylate with lithium phenyl-2,4,6-trimethylbenzoylphosphinate: Polymerization rate and cytocompatibility. Biomaterials 2009, 30, 6702–6707. [Google Scholar] [CrossRef] [Green Version]
- Ito, Y. Photochemistry for Biomedical Applications—From Device Fabrication to Diagnosis and Therapy; Springer Nature: Singapore, 2018. [Google Scholar]
- Choi, J.R.; Yong, K.W.; Choi, J.Y.; Cowie, A.C. Recent advances in photo-crosslinkable hydrogels for biomedical applications. BioTechniques 2019, 66, 40–53. [Google Scholar] [CrossRef] [PubMed] [Green Version]
- Vaz, V.M.; Kumar, L. 3D Printing as a Promising Tool in Personalized Medicine. AAPS PharmSciTech 2021, 49, 1–20. [Google Scholar] [CrossRef] [PubMed]
- Chartrain, N.A.; Williams, C.B.; Whittington, A.R. A review on fabricating tissue scaffolds using vat photopolymerization. Acta Biomater. 2018, 74, 90–111. [Google Scholar] [CrossRef] [PubMed]
- Ma, Y.; Ji, Y.; Zhong, T.; Wan, W.; Yang, Q.; Li, A.; Zhang, X.; Lin, M. Bioprinting-Based PDLSC-ECM Screening for in Vivo Repair of Alveolar Bone Defect Using Cell-Laden, Injectable and Photocrosslinkable Hydrogels. ACS Biomater. Sci. Eng. 2017, 3, 3534–3545. [Google Scholar] [CrossRef] [PubMed]
- Liu, S.; Yeo, D.C.; Wiraja, C.; Tey, H.L.; Mrksich, M.; Xu, C. Peptide delivery with poly (eth-ylene glycol) diacrylate microneedles through swelling effect. Bioeng. Transl. Med. 2017, 2, 258–267. [Google Scholar] [CrossRef] [PubMed]
- Jabbari, E.; Sarvestani, S.K.; Daneshian, L.; Moeinzadeh, S. Optimum 3D Matrix Stiffness for Maintenance of Cancer Stem Cells Is Dependent on Tissue Origin of Cancer Cells. PLoS ONE 2015, 10, e0132377. [Google Scholar] [CrossRef] [PubMed] [Green Version]
- Nguyen, Q.T.; Hwang, Y.; Chen, A.C.; Varghese, S.; Sah, R.L. Cartilage-like mechanical properties of poly (ethylene glycol)-diacrylate hydrogels. Biomaterials 2012, 33, 6682–6690. [Google Scholar] [CrossRef] [PubMed] [Green Version]
- Zhang, X.; Yang, D.; Nie, J. Chitosan/polyethylene glycol diacrylate films as potential wound dressing material. Int. J. Biol. Macromol. 2008, 43, 456–462. [Google Scholar] [CrossRef] [PubMed]
- Zhu, S.; Chen, P.; Chen, Y.; Li, M.; Chen, C.; Lu, H. 3D-Printed Extracellular Matrix/Polyethylene Glycol Diacrylate Hydrogel Incorporating the Anti-inflammatory Phytomolecule Honokiol for Regeneration of Osteochondral Defects. Am. J. Sports Med. 2020, 48, 2808–2818. [Google Scholar] [CrossRef] [PubMed]
- Qin, X.; He, R.; Chen, H.; Fu, D.; Peng, Y.; Meng, S.; Chen, C.; Yang, L. Methacrylated pullulan/polyethylene (glycol) diacrylate composite hydrogel for cartilage tissue engineering. J. Biomater. Sci. 2021, 32, 1057–1071. [Google Scholar] [CrossRef] [PubMed]
- Cui, J.; Wang, H.; Shi, Q.; Ferraro, P.; Sun, T.; Dario, P.; Huang, Q.; Fukuda, T. Permeable hollow 3D tissue-like constructs engineered by on-chip hydrodynamic-driven assembly of multicellular hierarchical micromodules. Acta Biomater. 2020, 113, 328–338. [Google Scholar] [CrossRef]
- Shin, Y.J.; Shafranek, R.T.; Tsui, J.H.; Walcott, J.; Nelson, A.; Kim, D.-H. 3D bioprinting of mechanically tuned bioinks derived from cardiac decellularized extracellular matrix. Acta Biomater. 2021, 119, 75–88. [Google Scholar] [CrossRef] [PubMed]
- Sabatini, V.; Pargoletti, E.; Longoni, M.; Farina, H.; Ortenzi, M.A.; Cappelletti, G. Stearyl methacrylate co-polymers: Towards new polymer coatings for mortars protection. Appl. Surf. Sci. 2019, 488, 213–220. [Google Scholar] [CrossRef]
- Allen, N.S.; Lo, D. Aspects of the inhibition of post-cure photo-yellowing of novel amine-diacrylate- terminated ultraviolet- and electron-beam- cured TMPTA-based coatings. Polym. Degrad. Stab. 1994, 45, 277–283. [Google Scholar] [CrossRef]
- Tripathy, R.; Crivello, J.V.; Faust, R. Photoinitiated polymerization of acrylate, methacrylate, and vinyl ether end-functional polyisobutylene macromonomers. J. Polym. Sci. Part A Polym. Chem. 2013, 51, 305–317. [Google Scholar] [CrossRef]
- Pradeep, P.V.; Paul, L. Review on novel biomaterials and innovative 3D printing techniques in biomedical applications. Mater. Today Proc. 2022; in press. [Google Scholar] [CrossRef]
- McAvoy, K.; Jones, D.; Thakur, R.R.S. Synthesis and Characterisation of Photocrosslinked poly(ethylene glycol) diacrylate Implants for Sustained Ocular Drug Delivery. Pharm. Res. 2018, 35, 36. [Google Scholar] [CrossRef] [PubMed] [Green Version]
- Yoshii, E. Cytotoxic effects of acrylates and methacrylates: Relationships of monomer structures and cytotoxicity. J. Biomed. Mater. Res. 1997, 37, 517–524. [Google Scholar] [CrossRef]
- Williams, C.G.; Malik, A.N.; Kim, T.K.; Manson, P.N.; Elisseeff, J.H. Variable cytocompatibility of six cell lines with photoinitiators used for polymerizing hydrogels and cell encapsulation. Biomaterials 2005, 26, 1211–1218. [Google Scholar] [CrossRef] [PubMed]
- Leonhardt, S.; Klare, M.; Scheer, M.; Fischer, T.; Cordes, B.; Eblenkamp, M. Biocompatibility of photopolymers for additive manufacturing. Curr. Dir. Biomed. Eng. 2016, 2, 113–116. [Google Scholar] [CrossRef]
- González, G.; Baruffaldi, D.; Martinengo, C.; Angelini, A.; Chiappone, A.; Roppolo, I.; Pirri, C.; Frascella, F. Materials Testing for the Development of Biocompatible Devices through Vat-Polymerization 3D Printing. Nanomaterials 2020, 10, 1788. [Google Scholar] [CrossRef]
- Jang, W.; Kook, G.-S.; Kang, J.-H.; Kim, Y.; Yun, Y.; Lee, S.-K.; Park, S.-W.; Lim, H.-P.; Yun, K.-D.; Park, C. Effect of Washing Condition on the Fracture Strength, and the Degree of Conversion of 3D Printing Resin. Appl. Sci. 2021, 11, 11676. [Google Scholar] [CrossRef]
- Hwangbo, N.-K.; Nam, N.-E.; Choi, J.-H.; Kim, J.-E. Effects of the Washing Time and Washing Solution on the Biocompatibility and Mechanical Properties of 3D Printed Dental Resin Materials. Polymers 2021, 13, 4410. [Google Scholar] [CrossRef] [PubMed]
- Nowacki, B.; Kowol, P.; Kozioł, M.; Olesik, P.; Wieczorek, J.; Wacławiak, K. Effect of Post-Process Curing and Washing Time on Mechanical Properties of mSLA Printouts. Materials 2021, 14, 4856. [Google Scholar] [CrossRef] [PubMed]
- Rekowska, N.; Arbeiter, D.; Brietzke, A.; Konasch, J.; Riess, A.; Mau, R.; Eickner, T.; Seitz, H.; Grabow, N.; Teske, M. Biocompatibility and thermodynamic properties of PEGDA and two of its copolymers. In Proceedings of the 2019 41st Annual International Conference of the IEEE Engineering in Medicine and Biology Society (EMBC): Biomedical Engineering Ranging from Wellness to Intensive Care: 41st EMB Conference, Berlin, Germany, 23–27 July 2019; IEEE: Piscataway, NJ, USA, 2019. [Google Scholar]
- Bat, E.; Feijen, J.; Grijpma, D.W. Biodegradable elastomeric networks: Highly efficient cross-linking of poly(trimethylene carbonate) by gamma irradiation in the presence of pentaerythritol triacrylate. Biomacromolecules 2010, 11, 2692–2699. [Google Scholar] [CrossRef] [PubMed]
- Wong, R.S.H.; Ashton, M.; Dodou, K. Effect of Crosslinking Agent Concentration on the Properties of Unmedicated Hydrogels. Pharmaceutics 2015, 7, 305–319. [Google Scholar] [CrossRef] [PubMed] [Green Version]
- Zhao, T.; Zheng, Y.; Poly, J.; Wang, W. Controlled multi-vinyl monomer homopolymerization through vinyl oligomer combination as a universal approach to hyperbranched architectures. Nat. Commun. 2013, 4, 1873. [Google Scholar] [CrossRef] [PubMed]
- Cui, C.; Fan, C.; Wu, Y.; Xiao, M.; Wu, T.; Zhang, D.; Chen, X.; Liu, B.; Xu, Z.; Qu, B.; et al. Water-Triggered Hyperbranched Polymer Universal Adhesives: From Strong Underwater Adhesion to Rapid Sealing Hemostasis. Adv. Mater. 2019, 31, e1905761. [Google Scholar] [CrossRef] [PubMed]
- Buchroithner, B.; Hartmann, D.; Mayr, S.; Oh, Y.J.; Sivun, D.; Karner, A.; Buchegger, B.; Griesser, T.; Hinterdorfer, P.; Klar, T.A.; et al. 3D multiphoton lithography using biocompatible polymers with specific mechanical properties. Nanoscale Adv. 2020, 2, 2422–2428. [Google Scholar] [CrossRef]
- Meng, Y.; Jiang, J.; Anthamatten, M. Body temperature triggered shape-memory polymers with high elastic energy storage capacity. J. Polym. Sci. Part B Polym. Phys. 2016, 54, 1397–1404. [Google Scholar] [CrossRef]
- Vehse, M.; Petersen, S.; Sternberg, K.; Schmitz, K.-P.; Seitz, H. Drug Delivery From Poly(ethylene glycol) Diacrylate Scaffolds Produced by DLC Based Micro-Stereolithography. Macromol. Symp. 2014, 346, 43–47. [Google Scholar] [CrossRef]
- Konasch, J.; Riess, A.; Mau, R.; Teske, M.; Rekowska, N.; Eickner, T.; Grabow, N.; Seitz, H. A Novel Hybrid Additive Manufacturing Process for Drug Delivery Systems with Locally Incorporated Drug Depots. Pharmaceutics 2019, 11, 661. [Google Scholar] [CrossRef] [Green Version]
- Seitz, H.; Grabow, N.; Matzmohr, R.; Teske, M.; Eickner, T.; Mau, R.; Riess, A.; Schmitz, K.-P. Device for Producing 3D-Printed Active Substance-Releasing Systems with Active Substance Depots, and Method for Producing 3D-Printed Active Substance-Releasing Systems. U.S. Patent WO002019185725A1, 18 March 2021. [Google Scholar]
- International Organization for Standardization. ISO 527-2:2012 Plastics—Determination of Tensile Properties: Test Conditions for Moulding and Extrusion Plastics; International Organization for Standardization: Geneva, Switzerland, 2012. [Google Scholar]
- International Organization for Standardization. ISO 10993-5 Biological Evaluation of Medical Devices: Part 5: Tests for; International Organization for Standardization: Geneva, Switzerland, 2009. [Google Scholar]
- Wang, L.; Wang, C.; Wu, S.; Fan, Y.; Li, X. Influence of the mechanical properties of biomaterials on degradability, cell behaviors and signaling pathways: Current progress and challenges. Biomater. Sci. 2020, 8, 2714–2733. [Google Scholar] [CrossRef]
- European Medicines Agency. Q3C (R6)—Impurities: Guideline for Residual Solvents; European Medicines Agency: Amsterdam, The Netherlands, 2019. [Google Scholar]
- Claus, J.; Brietzke, A.; Lehnert, C.; Oschatz, S.; Grabow, N.; Kragl, U. Swelling characteristics and biocompatibility of ionic liquid based hydrogels for biomedical applications. PLoS ONE 2020, 15, e0231421. [Google Scholar] [CrossRef] [PubMed]
- Browning, M.B.; Cosgriff-Hernandez, E. Development of a biostable replacement for PEGDA hydrogels. Biomacromolecules 2012, 13, 779–786. [Google Scholar] [CrossRef] [PubMed]
- Li, W.; Zhou, J.; Xu, Y. Study of the in vitro cytotoxicity testing of medical devices. Biomed. Rep. 2015, 3, 617–620. [Google Scholar] [CrossRef] [Green Version]
- Hafner, S.T. Internal Plasticized Glycidyl Azide Copolymers for Energetic Solid Propellant Binders. Ph.D. Thesis, Ludwig-Maximilians-University, München, Germany, 2019. [Google Scholar]
- Lim, H.; Hoag, S.W. Plasticizer effects on physical-mechanical properties of solvent cast Soluplus® films. AAPS PharmSciTech 2013, 14, 903–910. [Google Scholar] [CrossRef] [PubMed] [Green Version]
- Jantrawut, P.; Chaiwarit, T.; Jantanasakulwong, K.; Brachais, C.H.; Chambin, O. Effect of Plasticizer Type on Tensile Property and In Vitro Indomethacin Release of Thin Films Based on Low-Methoxyl Pectin. Polymers 2017, 9, 289. [Google Scholar] [CrossRef]
- Pruitt, L.A.; Chakravartula, A.M. (Eds.) Mechanics of Biomaterials; Cambridge University Press: Cambridge, UK, 2011. [Google Scholar]
- Patel, N.R.; Gohil, P.P. A Review on Biomaterials: Scope, Applications & Human Anatomy Significance. Int. J. Emerg. Technol. Adv. Eng. 2012, 2, 91–101. [Google Scholar]
- Du, Y.; Zhang, L.-N.; Hou, Z.-T.; Ye, X.; Gu, H.-S.; Yan, G.-P.; Shang, P. Physical modification of polyetheretherketone for orthopedic implants. Front. Mater. Sci. 2014, 8, 313–324. [Google Scholar] [CrossRef]
- Najeeb, S.; Zafar, M.S.; Khurshid, Z.; Siddiqui, F. Applications of polyetheretherketone (PEEK) in oral implantology and prosthodontics. J. Prosthodont. Res. 2016, 60, 12–19. [Google Scholar] [CrossRef] [PubMed]
- Li, L.; Guan, S.; Yang, L.; Qin, X.; Feng, W. Mechanical and Adhesive Properties of Ploy(ethylene glycerol) Diacrylate Based Hydrogels Plasticized with PEG and Glycerol. Chem. Res. Chin. Univ. 2018, 34, 311–317. [Google Scholar] [CrossRef]
- Bayarsaikhan, E.; Lim, J.-H.; Shin, S.-H.; Park, K.-H.; Park, Y.-B.; Lee, J.-H.; Kim, J.-E. Effects of Postcuring Temperature on the Mechanical Properties and Biocompatibility of Three-Dimensional Printed Dental Resin Material. Polymers 2021, 13, 1180. [Google Scholar] [CrossRef]
- Liao, S.-K.; Chang, P.-S. Special Issue—Supercritical Fluids” Literatures on Dyeing Technique of Supercritical Fluid Carbon Dioxide. Am. J. Anal. Chem. 2012, 3, 923–930. [Google Scholar] [CrossRef] [Green Version]
- Popov, V.K.; Evseev, A.V.; Ivanov, A.; Roginski, V.V.; Volozhin, A.I.; Howdle, S.M. Laser stereolithography and supercritical fluid processing for custom-designed implant fabrication. J. Mater. Sci. Mater. Med. 2004, 15, 123–128. [Google Scholar] [CrossRef]
- Barry, J.J.; Evseev, A.V.; Markov, M.A.; Upton, C.E.; Scotchford, C.; Popov, V.; Howdle, S.M. In vitro study of hydroxyapatite-based photocurable polymer composites prepared by laser stereolithography and supercritical fluid extraction. Acta Biomater. 2008, 4, 1603–1610. [Google Scholar] [CrossRef]
- Konasch, J.; Riess, A.; Teske, M.; Rekowska, N.; Mau, R.; Eickner, T.; Grabow, N.; Seitz, H. Novel 3D printing concept for the fabrication of time-controlled drug delivery systems. Curr. Dir. Biomed. Eng. 2018, 4, 141–144. [Google Scholar] [CrossRef]
- Mau, R.; Nazir, J.; John, S.; Seitz, H. Preliminary Study on 3D printing of PEGDA Hydrogels for Frontal Sinus Implants using Digital Light Processing (DLP). Curr. Dir. Biomed. Eng. 2019, 5, 249–252. [Google Scholar] [CrossRef]
- Chau, T.T.; Bruckard, W.J.; Koh, P.T.L.; Nguyen, A. A review of factors that affect contact angle and implications for flotation practice. Adv. Colloid Interface Sci. 2009, 150, 106–115. [Google Scholar] [CrossRef]
- Zink, C.; Hall, H.; Brunette, D.M.; Spencer, N.D. Orthogonal nanometer-micrometer roughness gradients probe morphological influences on cell behavior. Biomaterials 2012, 33, 8055–8061. [Google Scholar] [CrossRef]
- Zellander, A.; Zhao, C.; Kotecha, M.; Gemeinhart, R.; Wardlow, M.; Abiade, J.; Cho, M. Characterization of pore structure in biologically functional poly(2-hydroxyethyl methacrylate)-poly(ethylene glycol) diacrylate (PHEMA-PEGDA). PLoS ONE 2014, 9, e96709. [Google Scholar] [CrossRef] [Green Version]
- Hamilton, D.; Ghrebi, S.; Kim, H.; Chehroudi, B.; Brunette, D.M. Surface Topography and Cell Behavior. In Encyclopedia of Biomaterials and Biomedical Engineering; Taylor and Francis: New York, NY, USA, 2008; pp. 1–15. [Google Scholar]
- Schuster, M.; Turecek, C.; Kaiser, B.; Stampfl, J.; Liska, R.; Varga, F. Evaluation of Biocompatible Photopolymers I: Photoreactivity and Mechanical Properties of Reactive Diluents. J. Macromol. Sci. Part A 2007, 44, 547–557. [Google Scholar] [CrossRef]
- Yang, W.; Yu, H.; Wang, Y.; Liu, L. Regulation of cell adhesion to poly(ethylene glycol) diacrylate film by modification with polystyrene nano-spheres. In Proceedings of the 2016 IEEE 16th International Conference on Nanotechnology (IEEE-NANO), Sendai, Japan, 22–25 August 2016; p. 508. [Google Scholar]
- Peter, M.; Tayalia, P. An alternative technique for patterning cells on poly(ethylene glycol) diacrylate hydrogels. RSC Adv. 2016, 6, 40878–40885. [Google Scholar] [CrossRef]
- Khandaker, M.; Orock, A.; Tarantini, S.; White, J.; Yasar, O. Biomechanical Performances of Networked Polyethylene Glycol Diacrylate: Effect of Photoinitiator Concentration, Temperature, and Incubation Time. Int. J. Biomater. 2016, 2016, 3208312. [Google Scholar] [CrossRef] [Green Version]
- Marchioli, G.; Zellner, L.; Oliveira, C.; Engelse, M.; de Koning, E.; Mano, J.; Karperien; van Apeldoorn, A.; Moroni, L. Layered PEGDA hydrogel for islet of Langerhans encapsulation and improvement of vascularization. J. Mater. Sci. Mater. Med. 2017, 28, 195. [Google Scholar] [CrossRef] [Green Version]
- Clark, E.A.; Alexander, M.R.; Irvine, D.J.; Roberts, C.; Wallace, M.J.; Yoo, J.; Wildman, R.D. Making tablets for delivery of poorly soluble drugs using photoinitiated 3D inkjet printing. Int. J. Pharm. 2020, 578, 118805. [Google Scholar] [CrossRef]
- Lin, J.-T.; Lalevee, J.; Cheng, D.-C. A Critical Review for Synergic Kinetics and Strategies for Enhanced Photopolymerizations for 3D-Printing and Additive Manufacturing. Polymers 2021, 13, 2325. [Google Scholar] [CrossRef]
- Gou, M.; Qu, X.; Zhu, W.; Xiang, M.; Yang, J.; Zhang, K.; Wei, Y.; Chen, S. Bio-inspired detoxification using 3D-printed hydrogel nanocomposites. Nat. Commun. 2014, 5, 3774. [Google Scholar] [CrossRef] [Green Version]
- Nachlas, A.L.Y.; Li, S.; Jha, R.; Singh, M.; Xu, C.; Davis, M.E. Human iPSC-derived mesenchymal stem cells encapsulated in PEGDA hydrogels mature into valve interstitial-like cells. Acta Biomater. 2018, 71, 235–246. [Google Scholar] [CrossRef]
- Lin, H.; Zhang, D.; Alexander, P.G.; Yang, G.; Tan, J.; Cheng, A.W.-M.; Tuan, R.S. Application of visible light-based projection stereolithography for live cell-scaffold fabrication with designed architecture. Biomaterials 2013, 34, 331–339. [Google Scholar] [CrossRef] [Green Version]
- Wang, Z.; Abdulla, R.; Parker, B.; Samanipour, R.; Ghosh, S.; Kim, K. A simple and high-resolution stereolithography-based 3D bioprinting system using visible light crosslinkable bioinks. Biofabrication 2015, 7, 45009. [Google Scholar] [CrossRef]
- Nieto, D.; Marchal Corrales, J.A.; de Mora, A.J.; Moroni, L. Fundamentals of light-cell-polymer interactions in photo-cross-linking based bioprinting. APL Bioeng. 2020, 4, 41502. [Google Scholar] [CrossRef]
- Green, J.J.; Elisseeff, J.H. Mimicking biological functionality with polymers for biomedical applications. Nature 2016, 540, 386–394. [Google Scholar] [CrossRef]
- Ulery, B.D.; Nair, L.S.; Laurencin, C.T. Biomedical Applications of Biodegradable Polymers. J. Polym. Sci. Part B Polym. Phys. 2011, 49, 832–864. [Google Scholar] [CrossRef] [Green Version]
- Shrivastva, A. Introduction to Plastics Engineering; William Andrew Publishing, Elsevier: Amsterdam, Netherlands, 2018. [Google Scholar]
- Stockmann, P.N.; Van Opdenbosch, D. Biobased chiral semi-crystalline or amorphous high-performance polyamides and their scalable stereoselective synthesis. Nat. Commun. 2020, 11, 509. [Google Scholar] [CrossRef]
- Omelczuk, J.M.M. The Influence of Polymer Glass Transition Temperature and Molecular Weight on Drug Release from Tablets Containing Poly(DL-lactic Acid). Pharm. Res. 1991, 9, 26–32. [Google Scholar] [CrossRef]
- Jadhav, N.; Gaikwad, V.L.; Nair, K.; Kadam, H. Glass transition temperature: Basics and application in pharmaceutical sector. Asian J. Pharm. 2009, 3, 82. [Google Scholar] [CrossRef]
- Alvarez-Lorenzo, C.; Concheiro, A. Smart drug delivery systems: From fundamentals to the clinic. Chem. Commun. 2014, 50, 7743–7765. [Google Scholar] [CrossRef] [Green Version]
- Park, K.; Otte, A.; Sharifi, F.; Garner, J.; Skidmore, S.; Park, H.; Jhon, Y.K.; Qin, B.; Wang, Y. Potential Roles of the Glass Transition Temperature of PLGA Microparticles in Drug Release Kinetics. Mol. Pharm. 2021, 18, 18–32. [Google Scholar] [CrossRef]
- Lappe, S.; Mulac, D.; Langer, K. Polymeric nanoparticles—Influence of the glass transition temperature on drug release. Int. J. Pharm. 2017, 517, 338–347. [Google Scholar] [CrossRef]
- O’Donnell, K.; Boyd, A.; Meenan, B.J. Controlling Fluid Diffusion and Release through Mixed-Molecular-Weight Poly(ethylene) Glycol Diacrylate (PEGDA) Hydrogels. Materials 2019, 12, 3381. [Google Scholar] [CrossRef] [Green Version]
- Lin, S.; Sangaj, N.; Razafiarison, T.; Zhang, C.; Varghese, S. Influence of physical properties of biomaterials on cellular behavior. Pharm. Res. 2011, 28, 1422–1430. [Google Scholar] [CrossRef] [PubMed] [Green Version]
- Mitragotri, S.; Lahann, J. Physical approaches to biomaterial design. Nat. Mater. 2009, 8, 15–23. [Google Scholar] [CrossRef] [PubMed] [Green Version]
- Yang, L.; Yang, Q.; Lu, D. Effect of chemical crosslinking degree on mechanical properties of bacterial cellulose/poly(vinyl alcohol) composite membranes. Mon. Für Chem.—Chem. Mon. 2014, 145, 91–95. [Google Scholar] [CrossRef]
- Sperling, L.H. Introduction to Physical Polymer Science; John Wiley & Sons, Inc.: Hoboken, NJ, USA, 2006. [Google Scholar]
- Ngo, B.K.D.; Grunlan, M.A. Protein Resistant Polymeric Biomaterials. ACS Macro Lett. 2017, 6, 992–1000. [Google Scholar] [CrossRef] [Green Version]
- Vladkova, T.G. Surface Engineered Polymeric Biomaterials with Improved Biocontact Properties. Int. J. Polym. Sci. 2010, 2010, 296094. [Google Scholar] [CrossRef] [Green Version]
- Paterlini, T.T.; Nogueira, L.F.B.; Tovani, C.B.; Cruz, M.; Derradi, R.; Ramos, A.P. The role played by modified bioinspired surfaces in interfacial properties of biomaterials. Biophys. Rev. 2017, 9, 683–698. [Google Scholar] [CrossRef] [PubMed] [Green Version]
- Thevenot, P.; Wenjing, H.; Hu, W. Surface chamistry influence implant biocompatibility. Curr. Top. Med. Chem. 2008, 8, 270–280. [Google Scholar] [PubMed]


Publisher’s Note: MDPI stays neutral with regard to jurisdictional claims in published maps and institutional affiliations. |
© 2022 by the authors. Licensee MDPI, Basel, Switzerland. This article is an open access article distributed under the terms and conditions of the Creative Commons Attribution (CC BY) license (https://creativecommons.org/licenses/by/4.0/).
Share and Cite
Rekowska, N.; Huling, J.; Brietzke, A.; Arbeiter, D.; Eickner, T.; Konasch, J.; Riess, A.; Mau, R.; Seitz, H.; Grabow, N.; et al. Thermal, Mechanical and Biocompatibility Analyses of Photochemically Polymerized PEGDA250 for Photopolymerization-Based Manufacturing Processes. Pharmaceutics 2022, 14, 628. https://doi.org/10.3390/pharmaceutics14030628
Rekowska N, Huling J, Brietzke A, Arbeiter D, Eickner T, Konasch J, Riess A, Mau R, Seitz H, Grabow N, et al. Thermal, Mechanical and Biocompatibility Analyses of Photochemically Polymerized PEGDA250 for Photopolymerization-Based Manufacturing Processes. Pharmaceutics. 2022; 14(3):628. https://doi.org/10.3390/pharmaceutics14030628
Chicago/Turabian StyleRekowska, Natalia, Jennifer Huling, Andreas Brietzke, Daniela Arbeiter, Thomas Eickner, Jan Konasch, Alexander Riess, Robert Mau, Hermann Seitz, Niels Grabow, and et al. 2022. "Thermal, Mechanical and Biocompatibility Analyses of Photochemically Polymerized PEGDA250 for Photopolymerization-Based Manufacturing Processes" Pharmaceutics 14, no. 3: 628. https://doi.org/10.3390/pharmaceutics14030628