
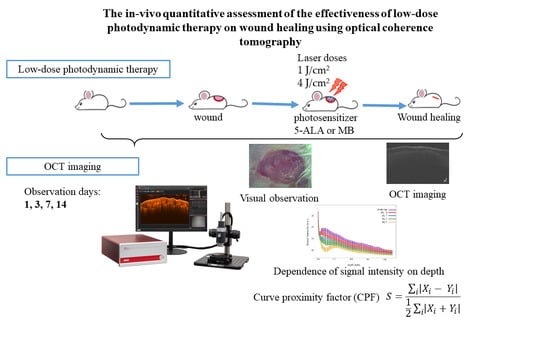
The In Vivo Quantitative Assessment of the Effectiveness of Low-Dose Photodynamic Therapy on Wound Healing Using Optical Coherence Tomography

 ,
,  ,
,
Abstract
:
1. Introduction
2. Materials and Methods
2.1. Wound Model Protocol
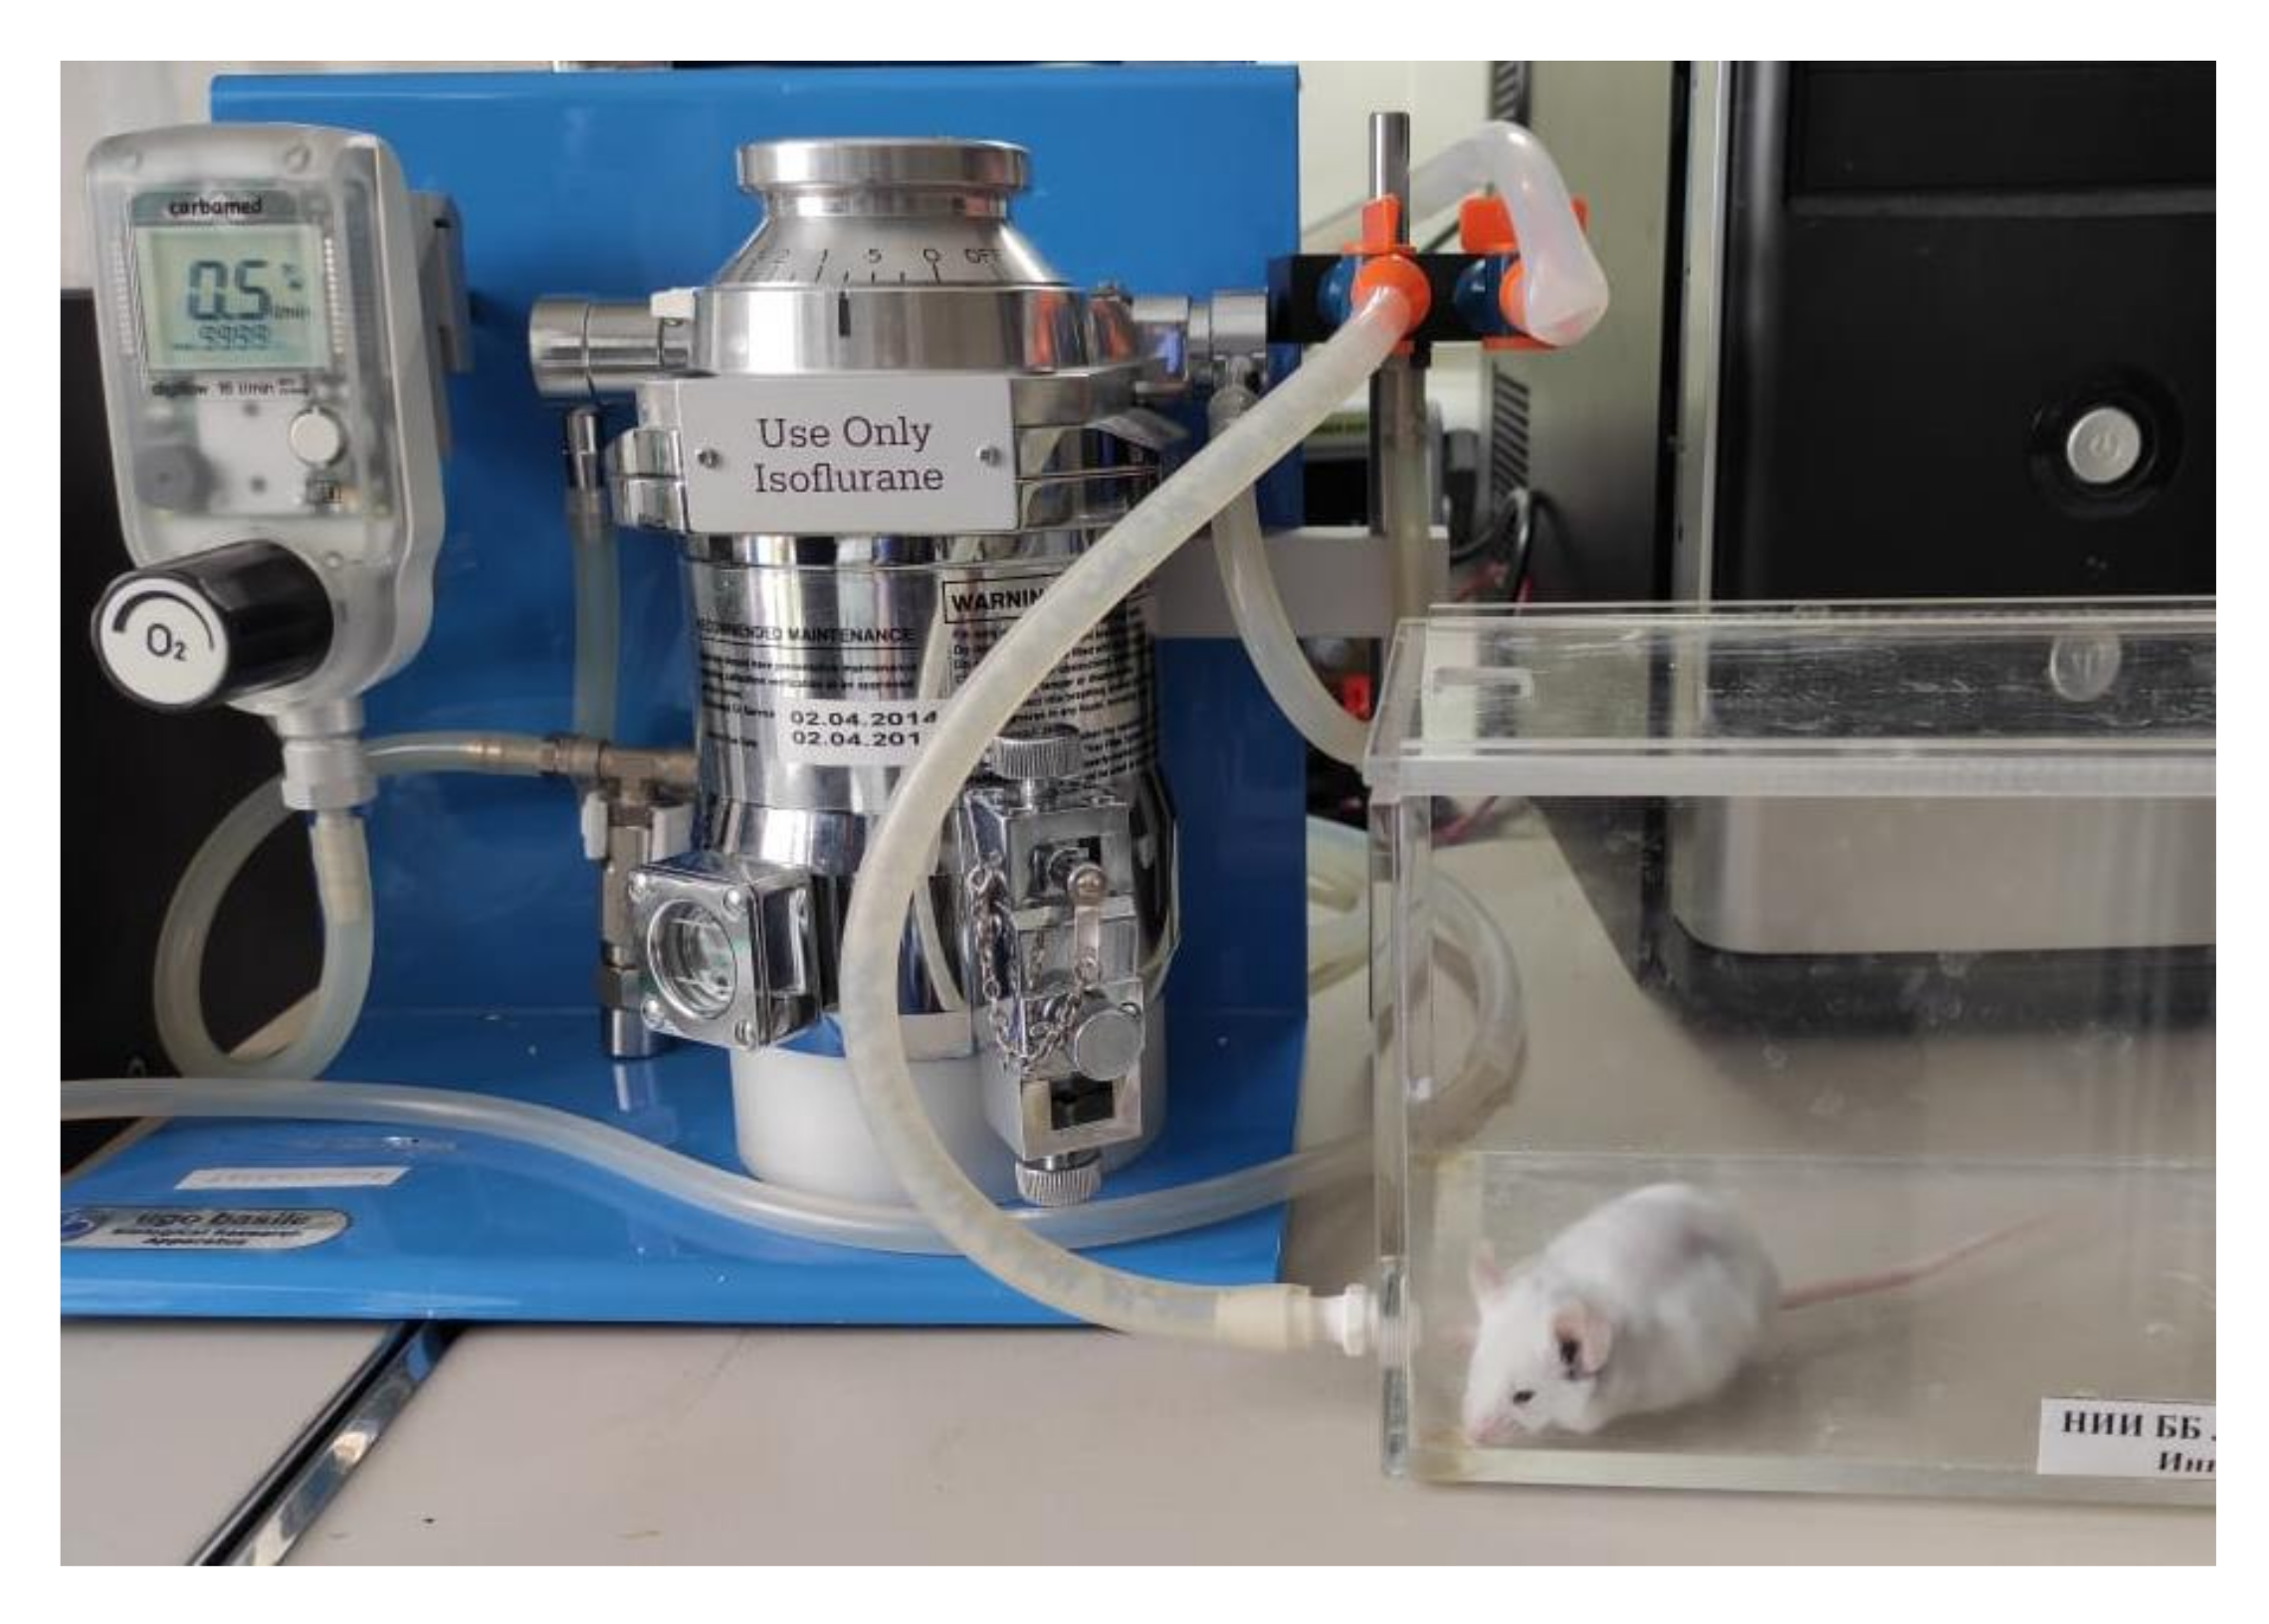
2.2. Low Dose Photodynamic Therapy Protocol
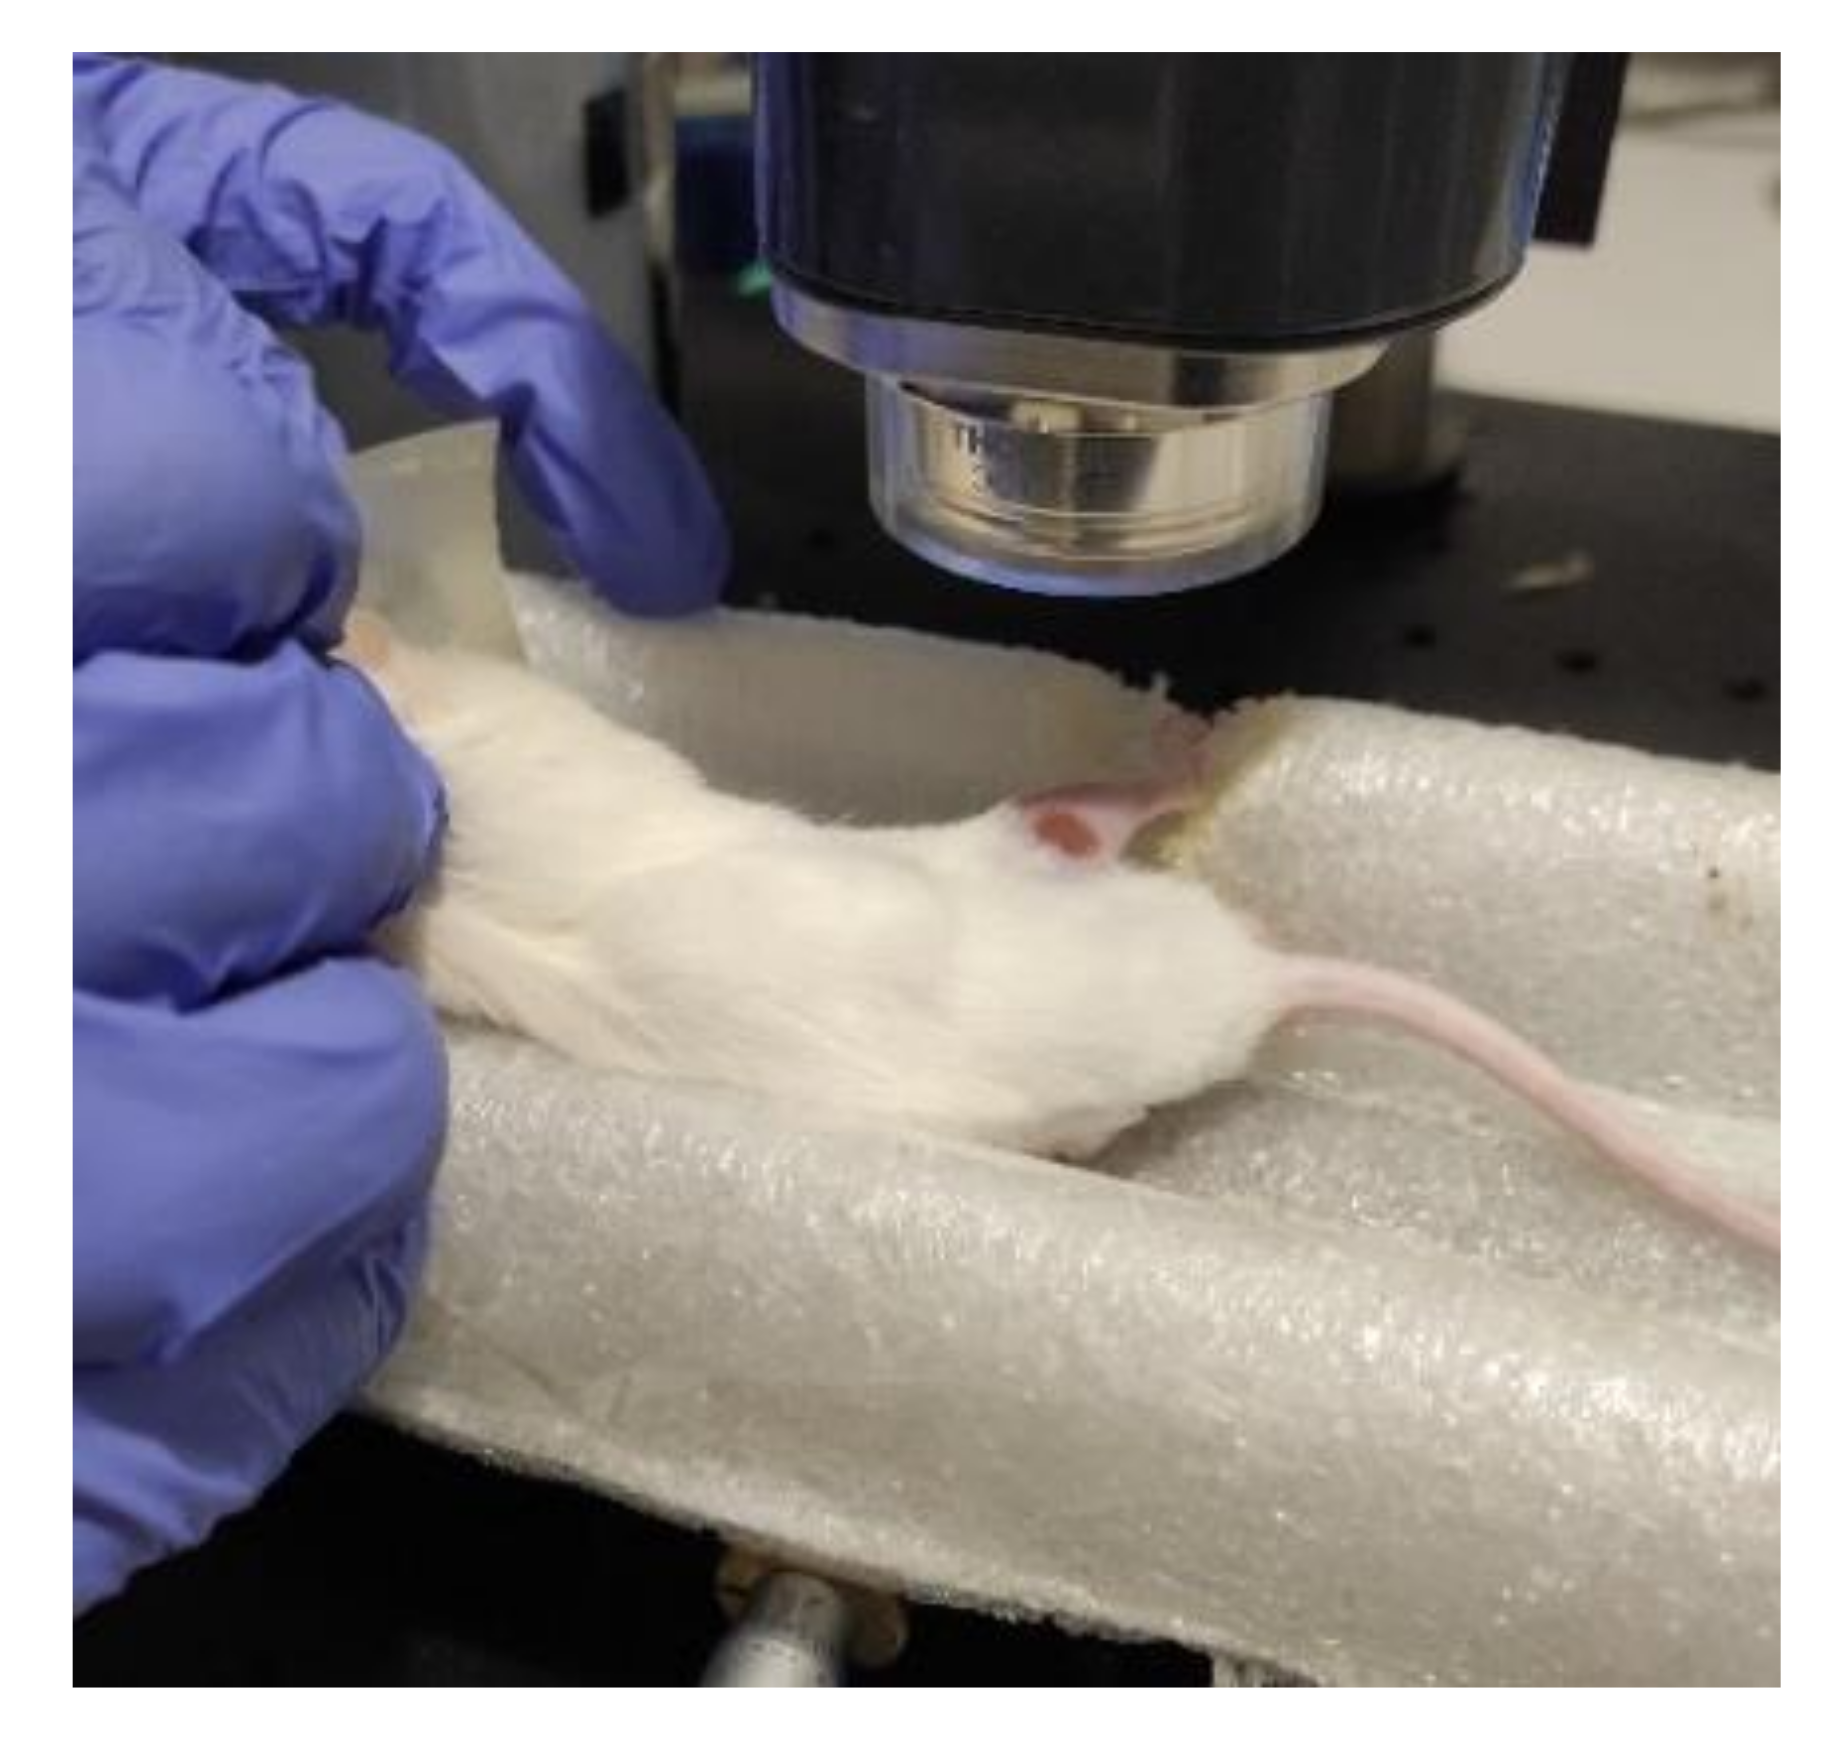
2.3. Optical Coherence Tomography Protocol
2.4. Statistical Analysis
3. Results
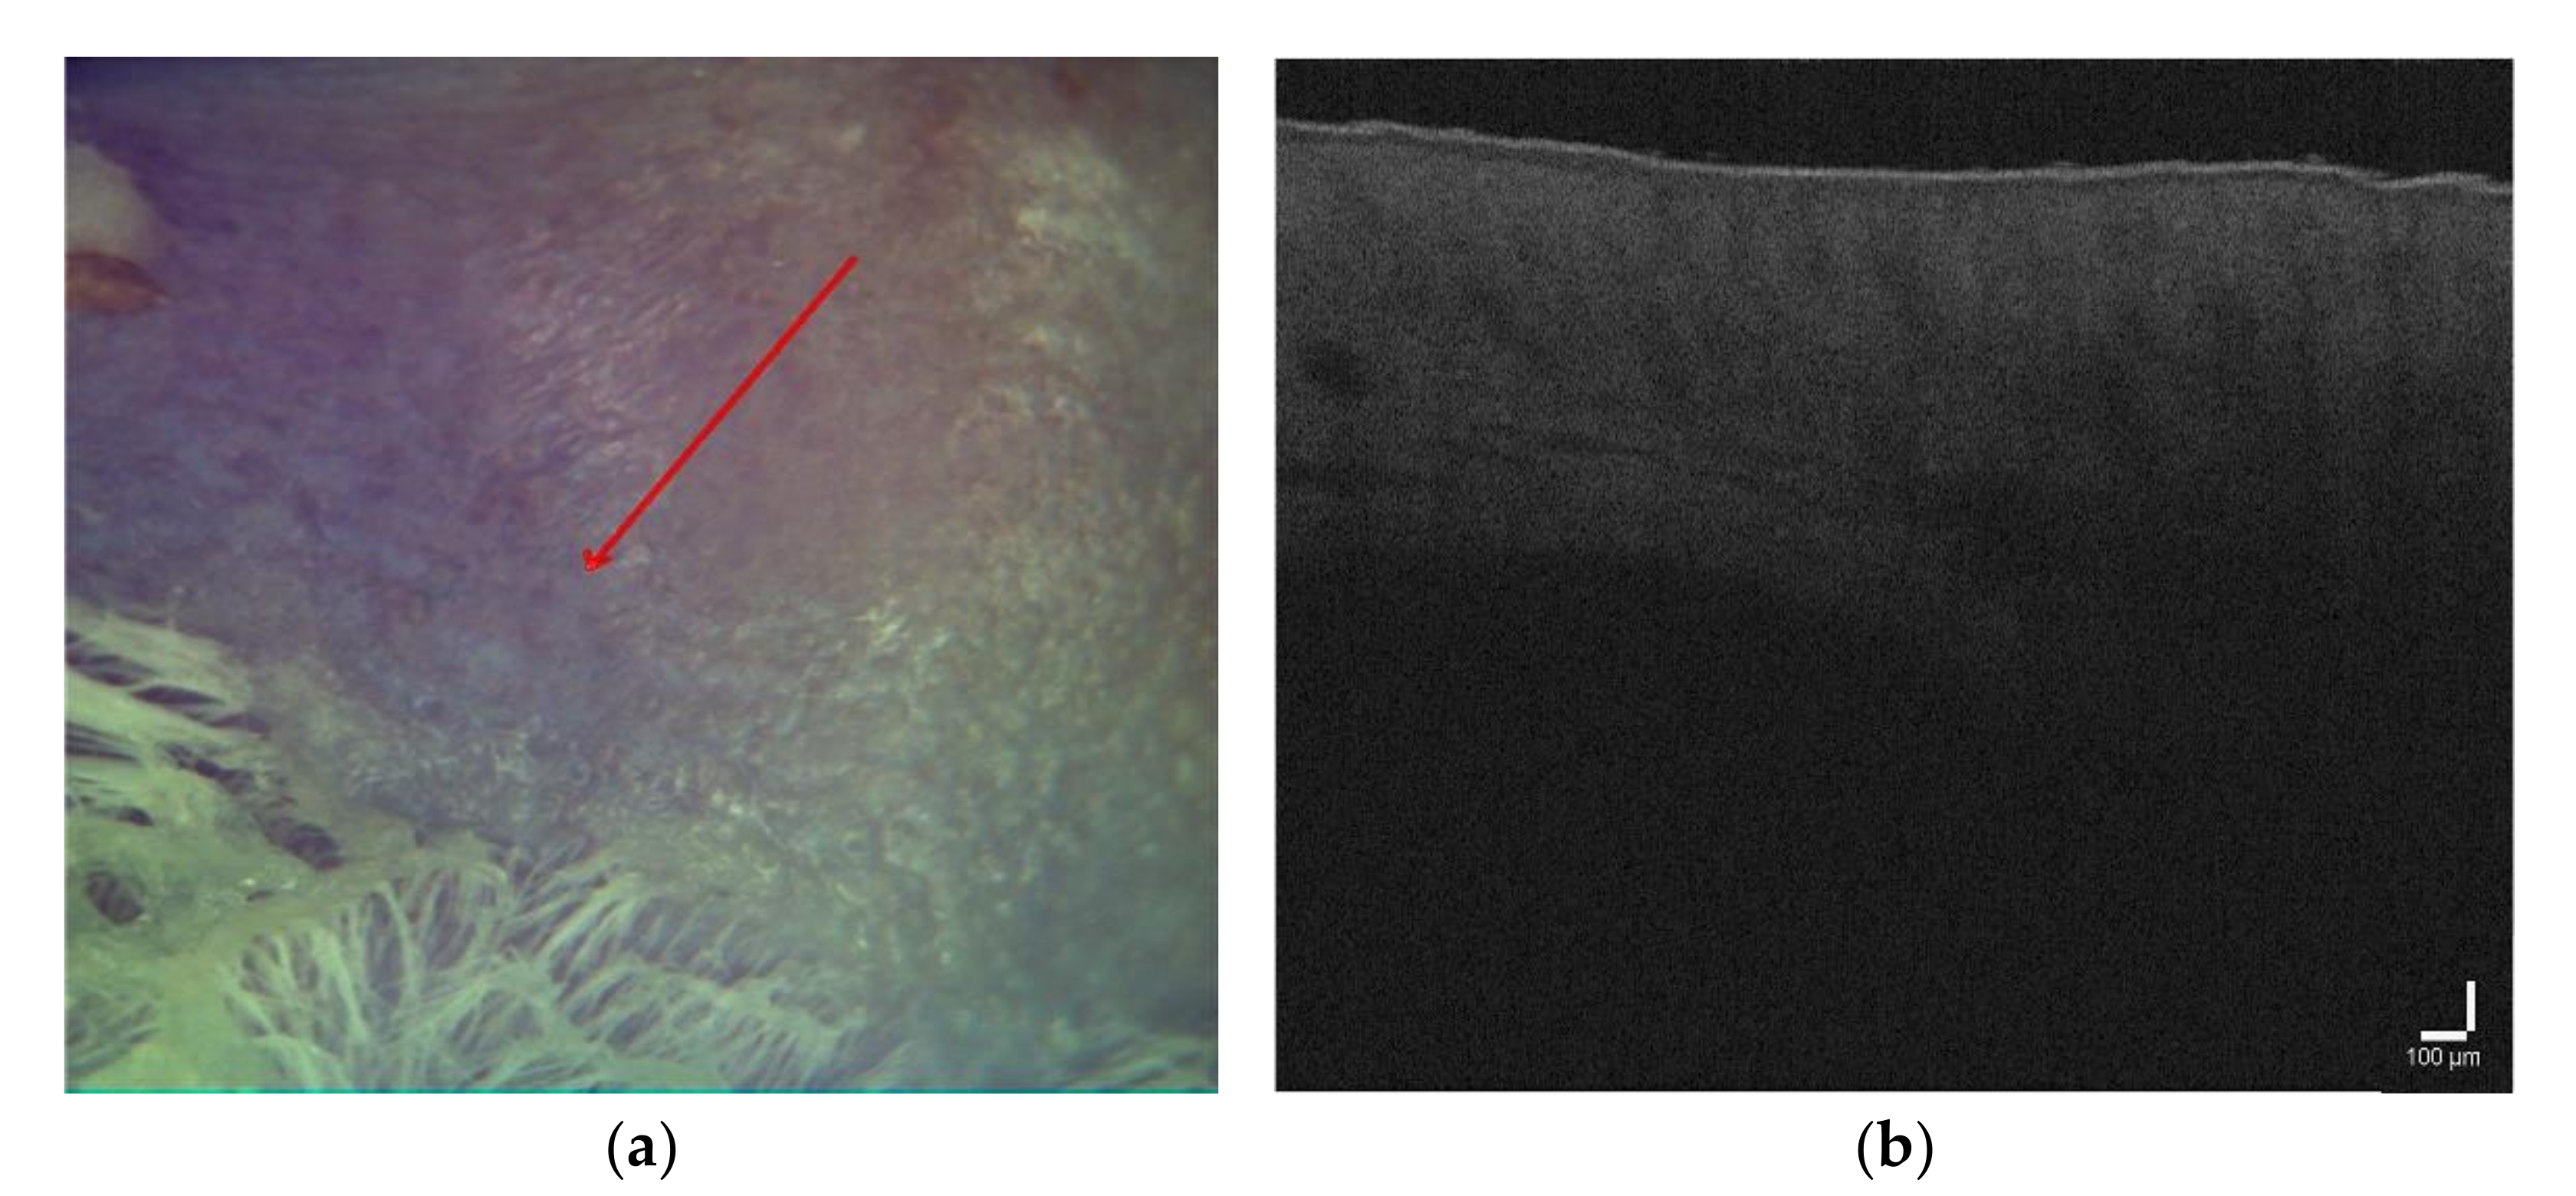
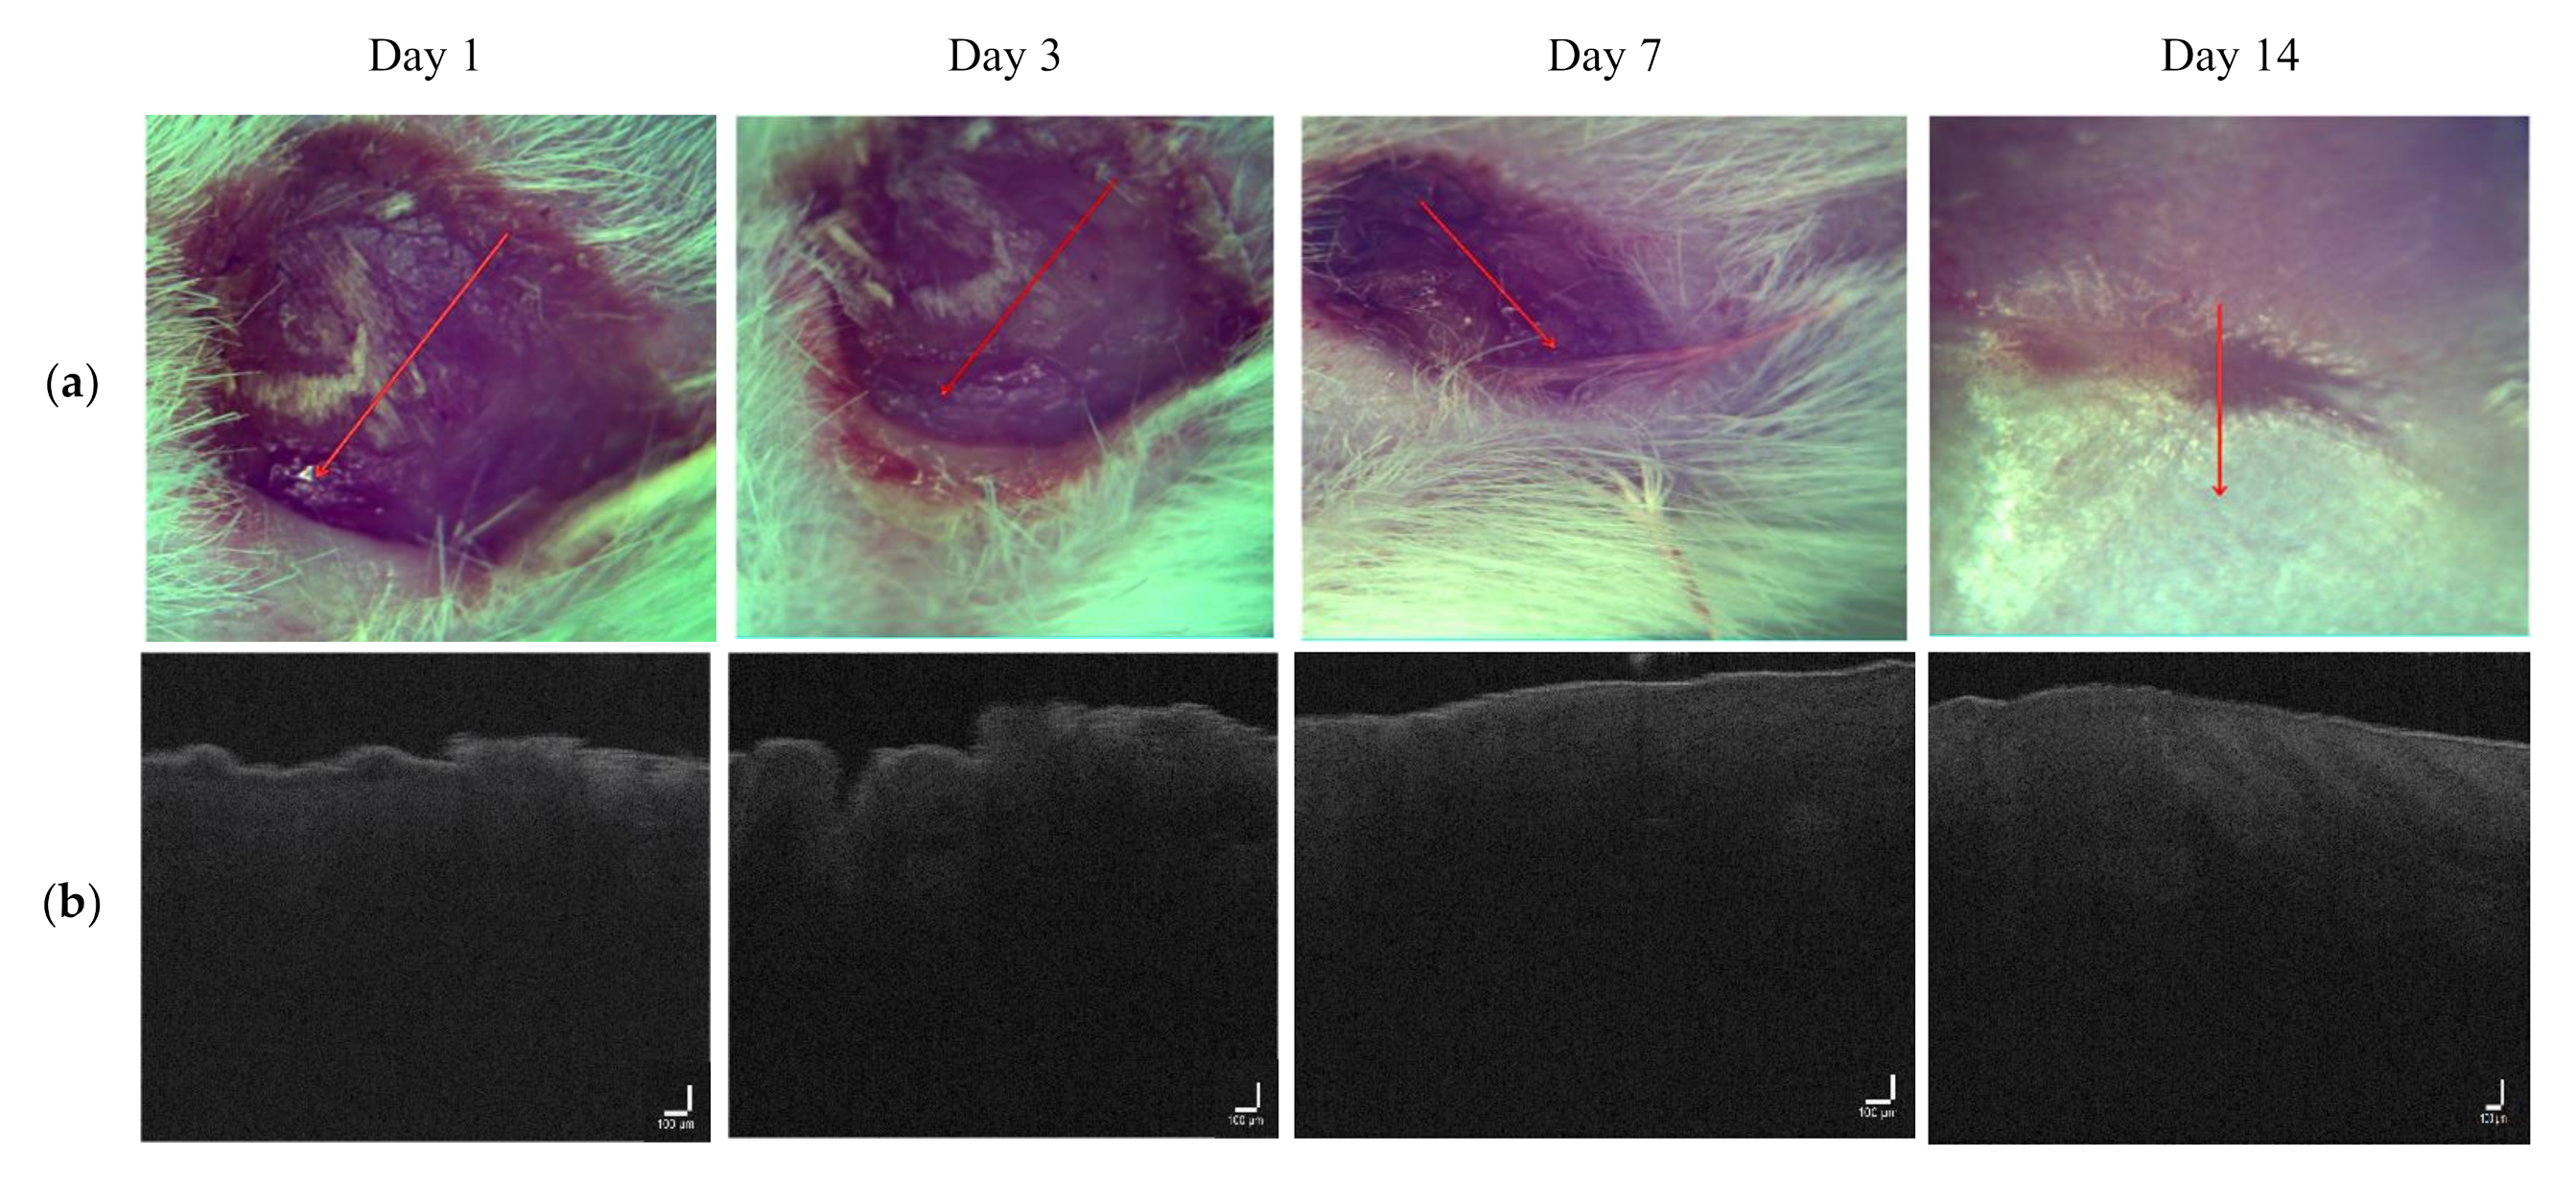
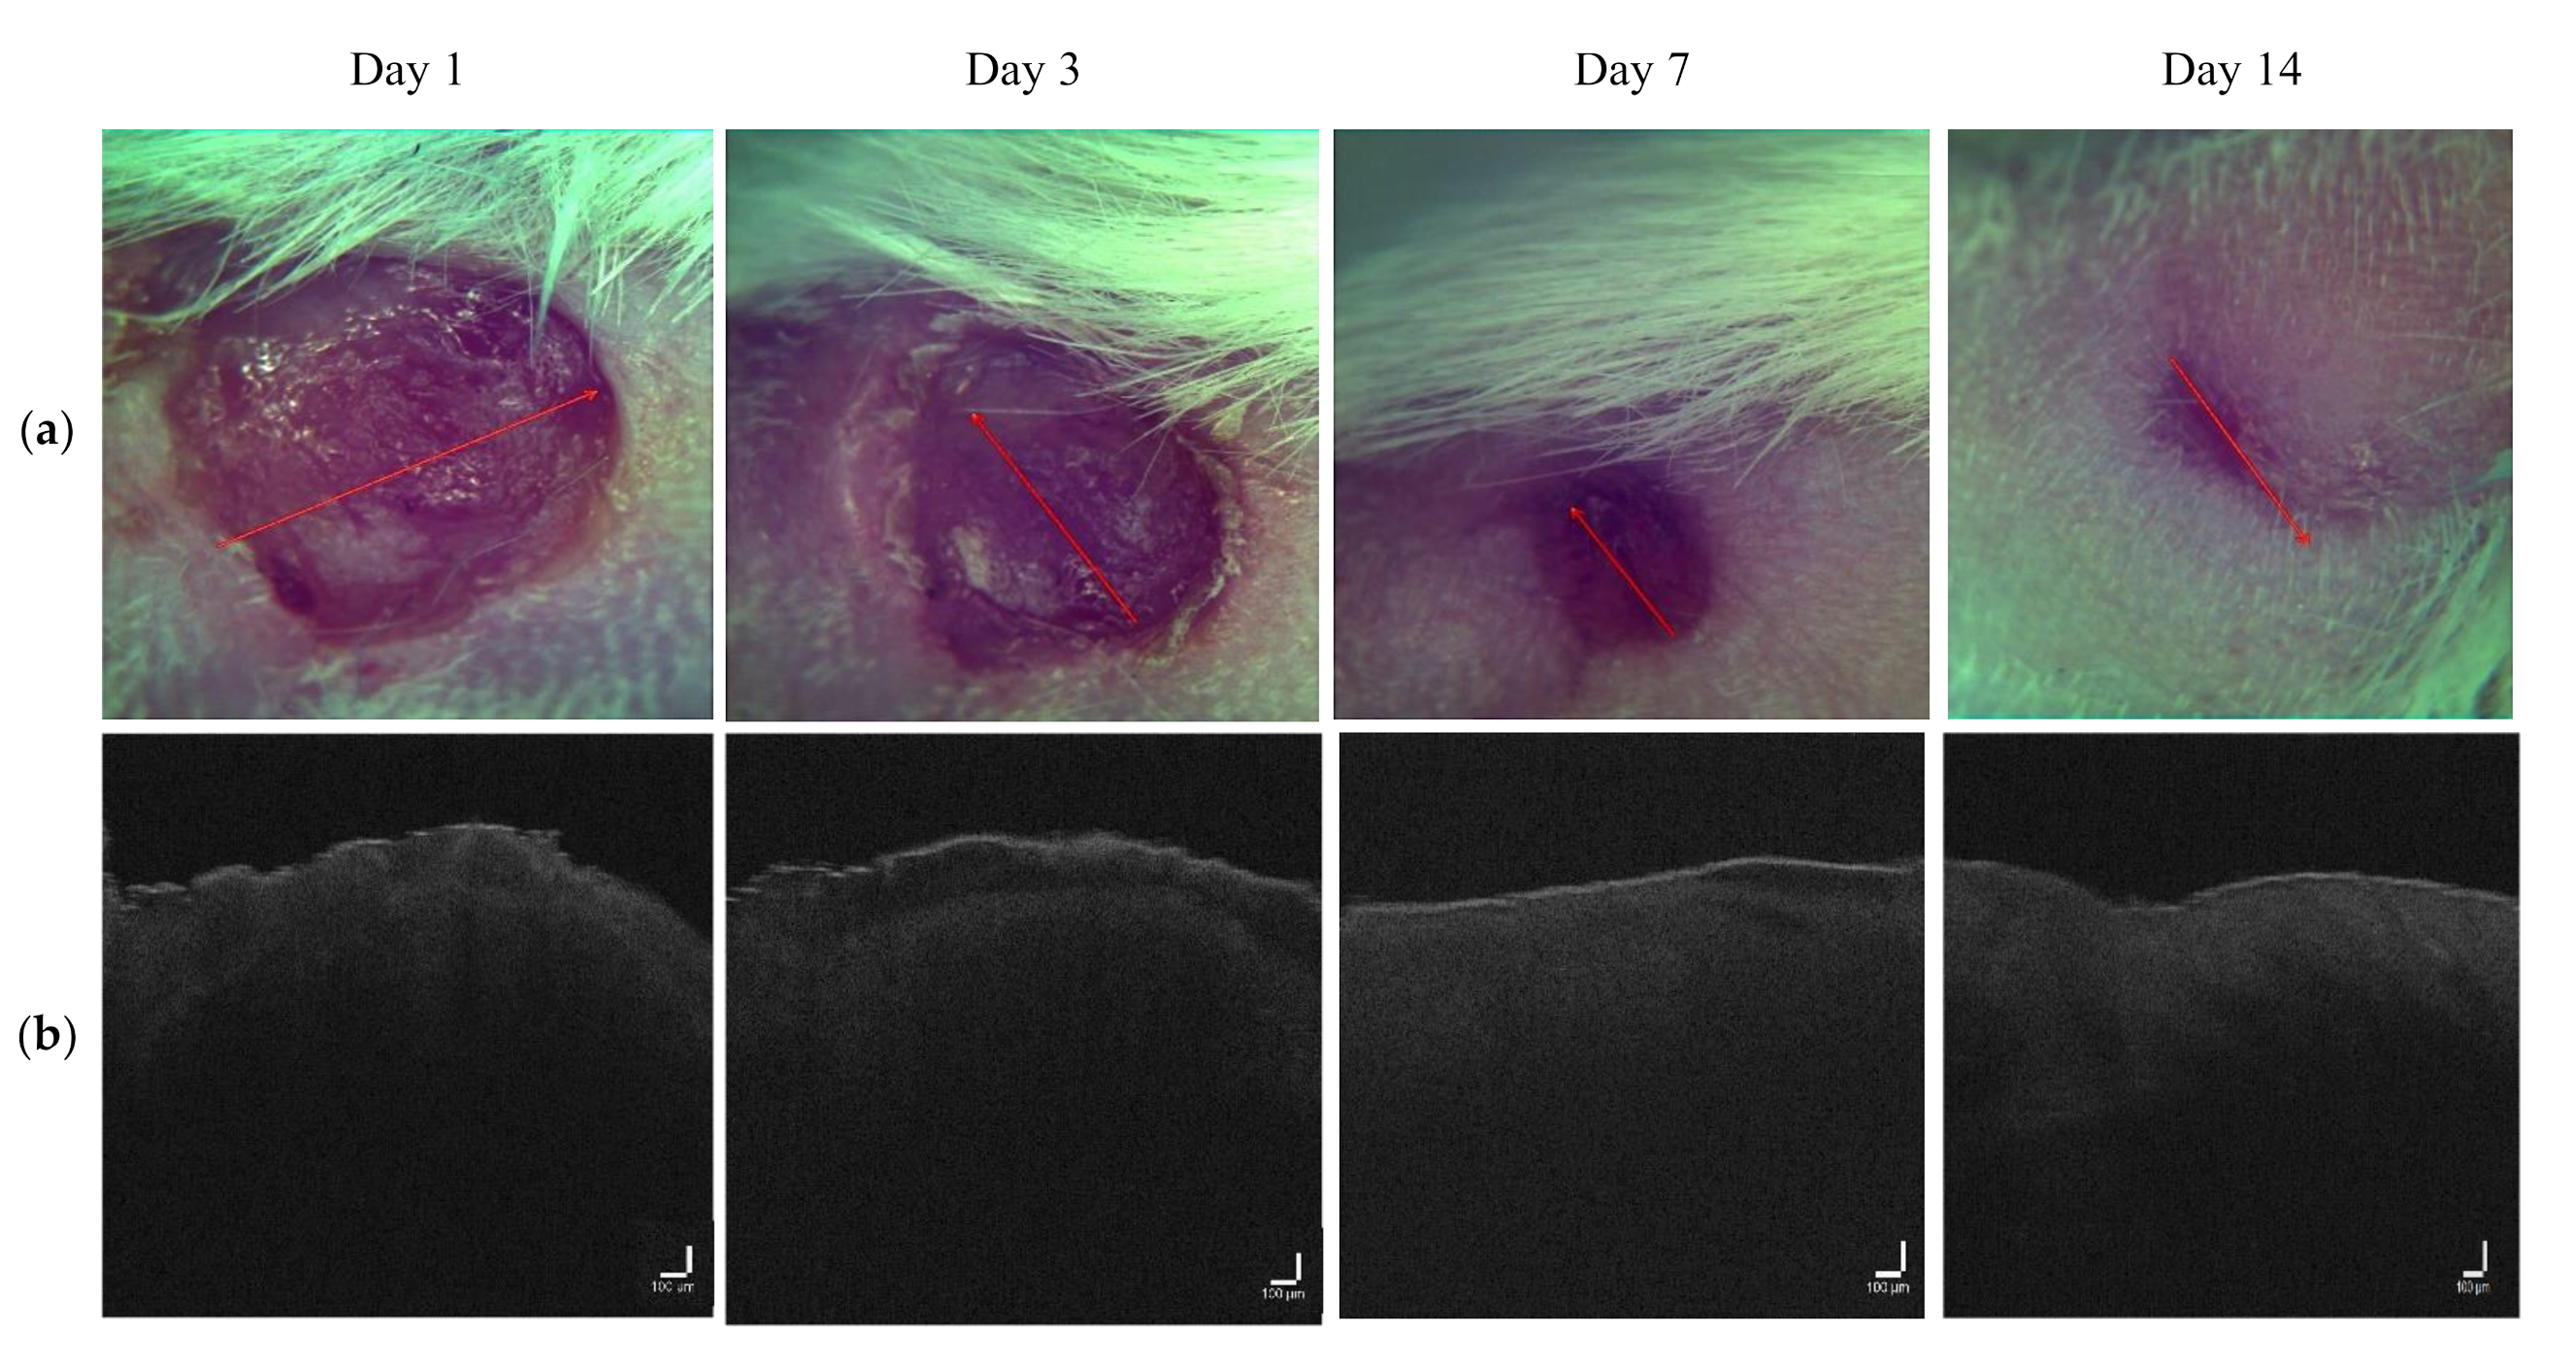
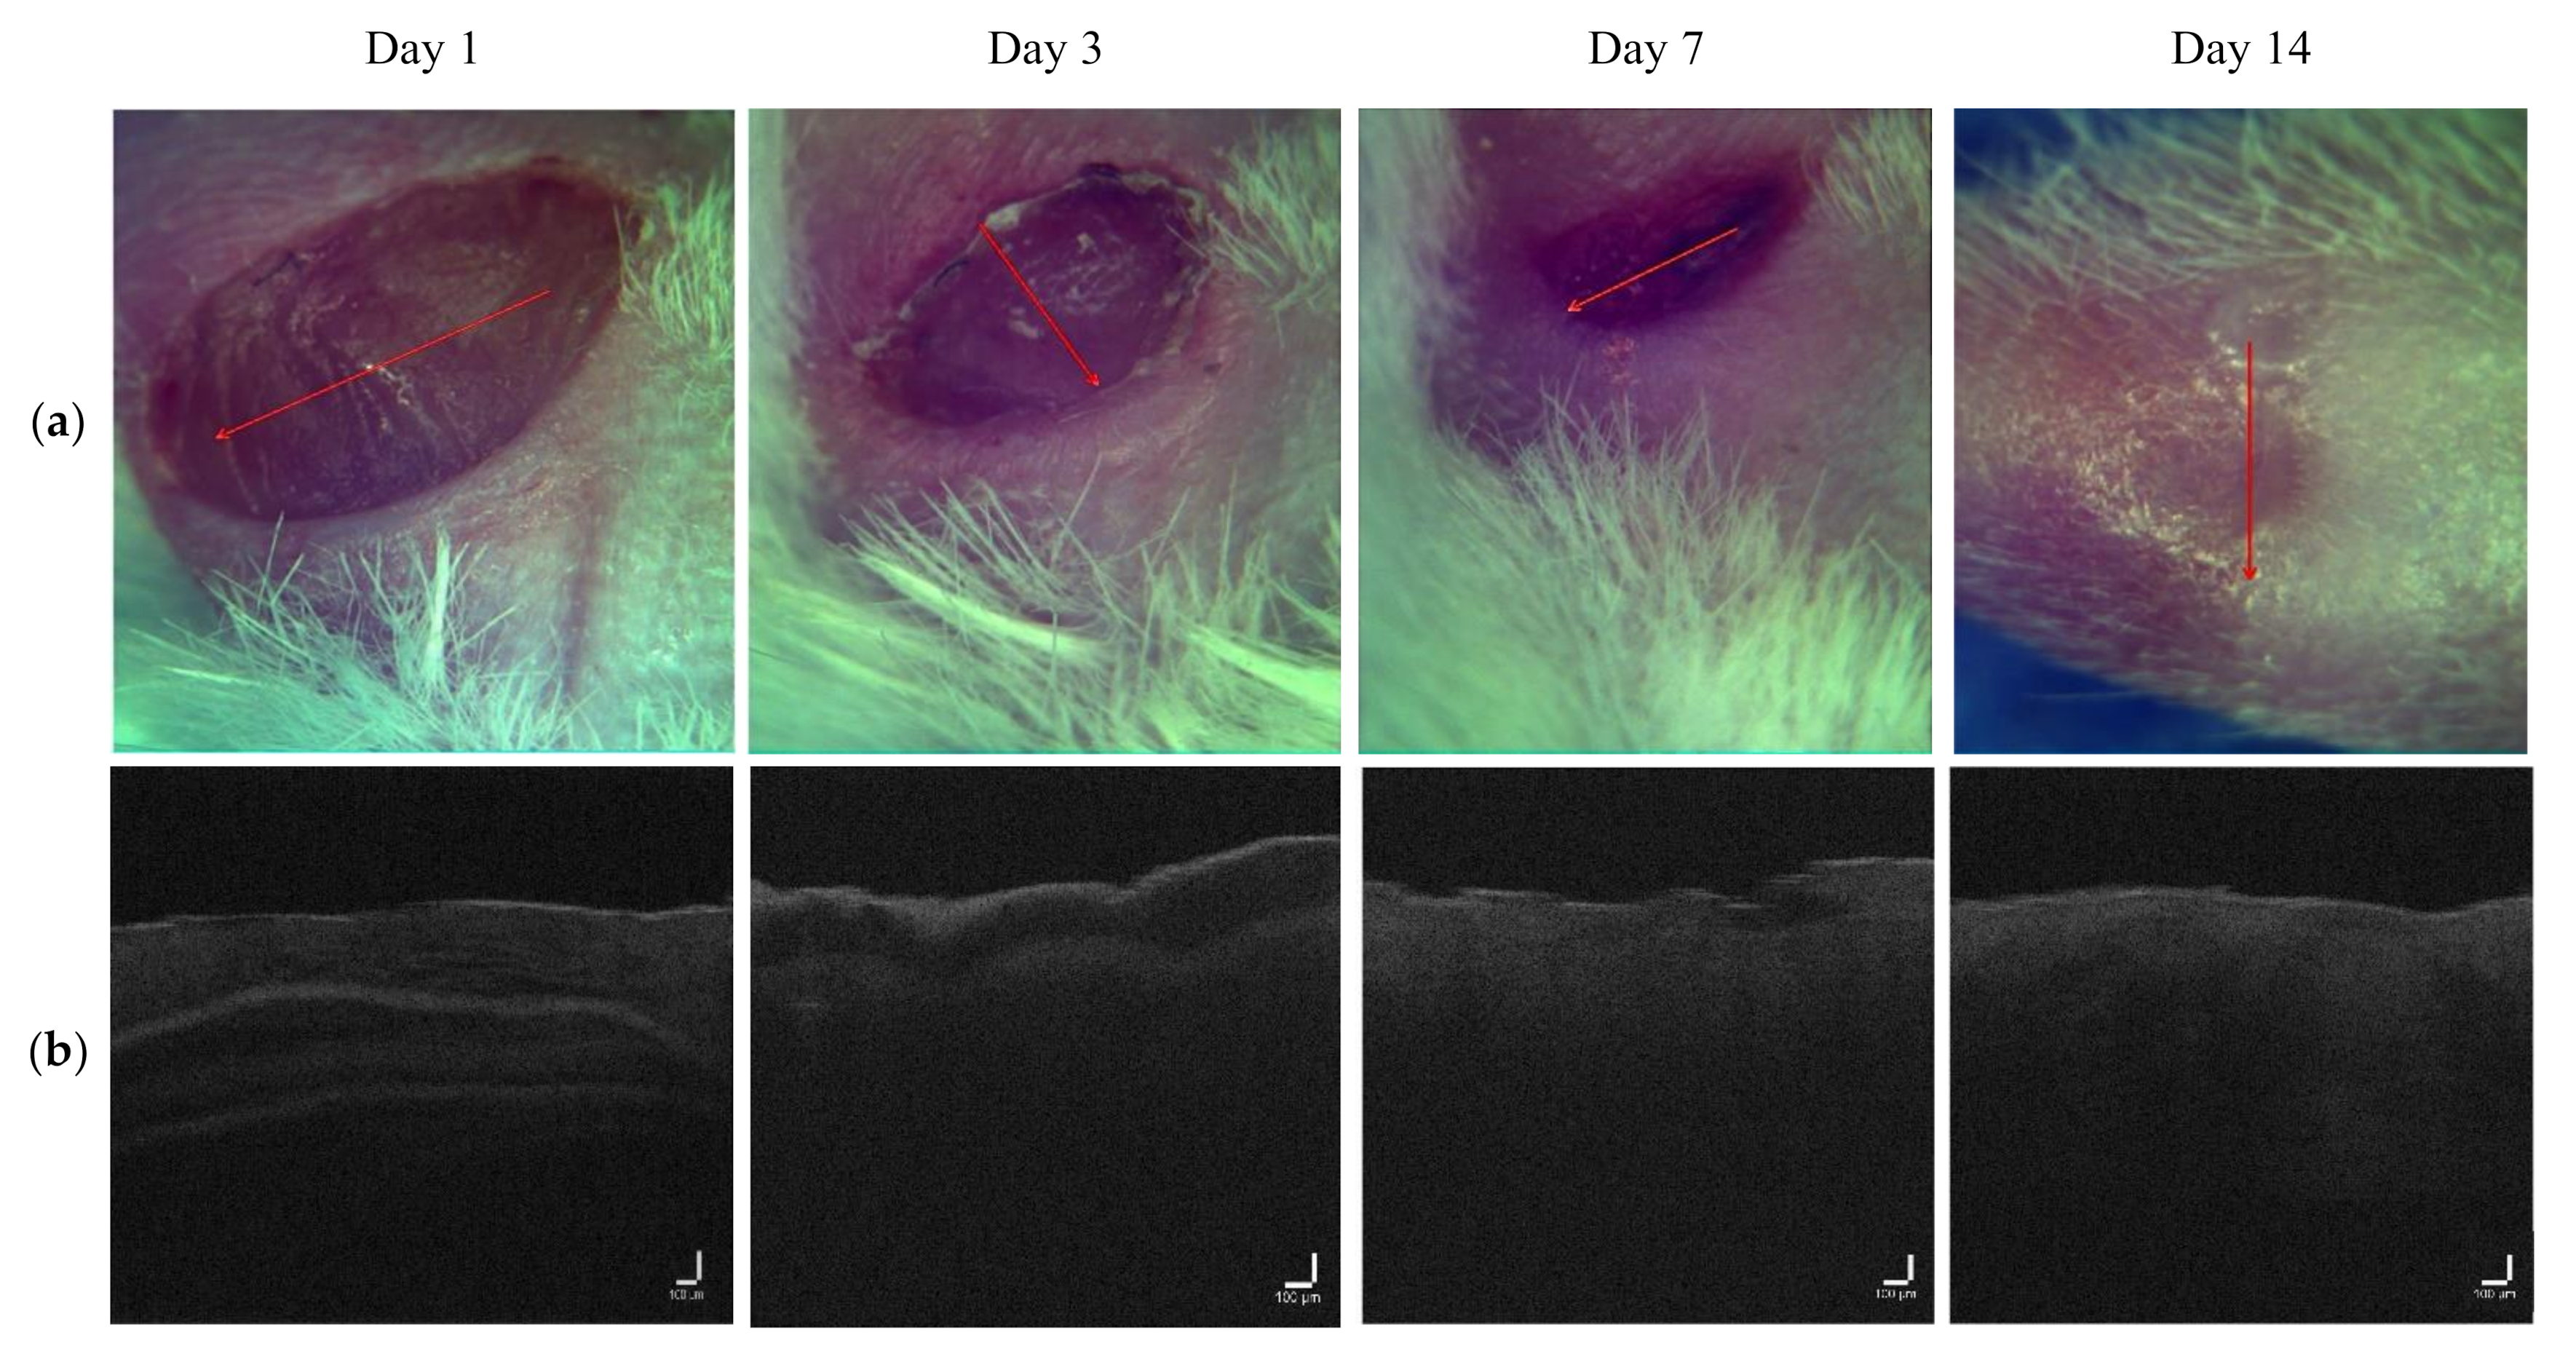
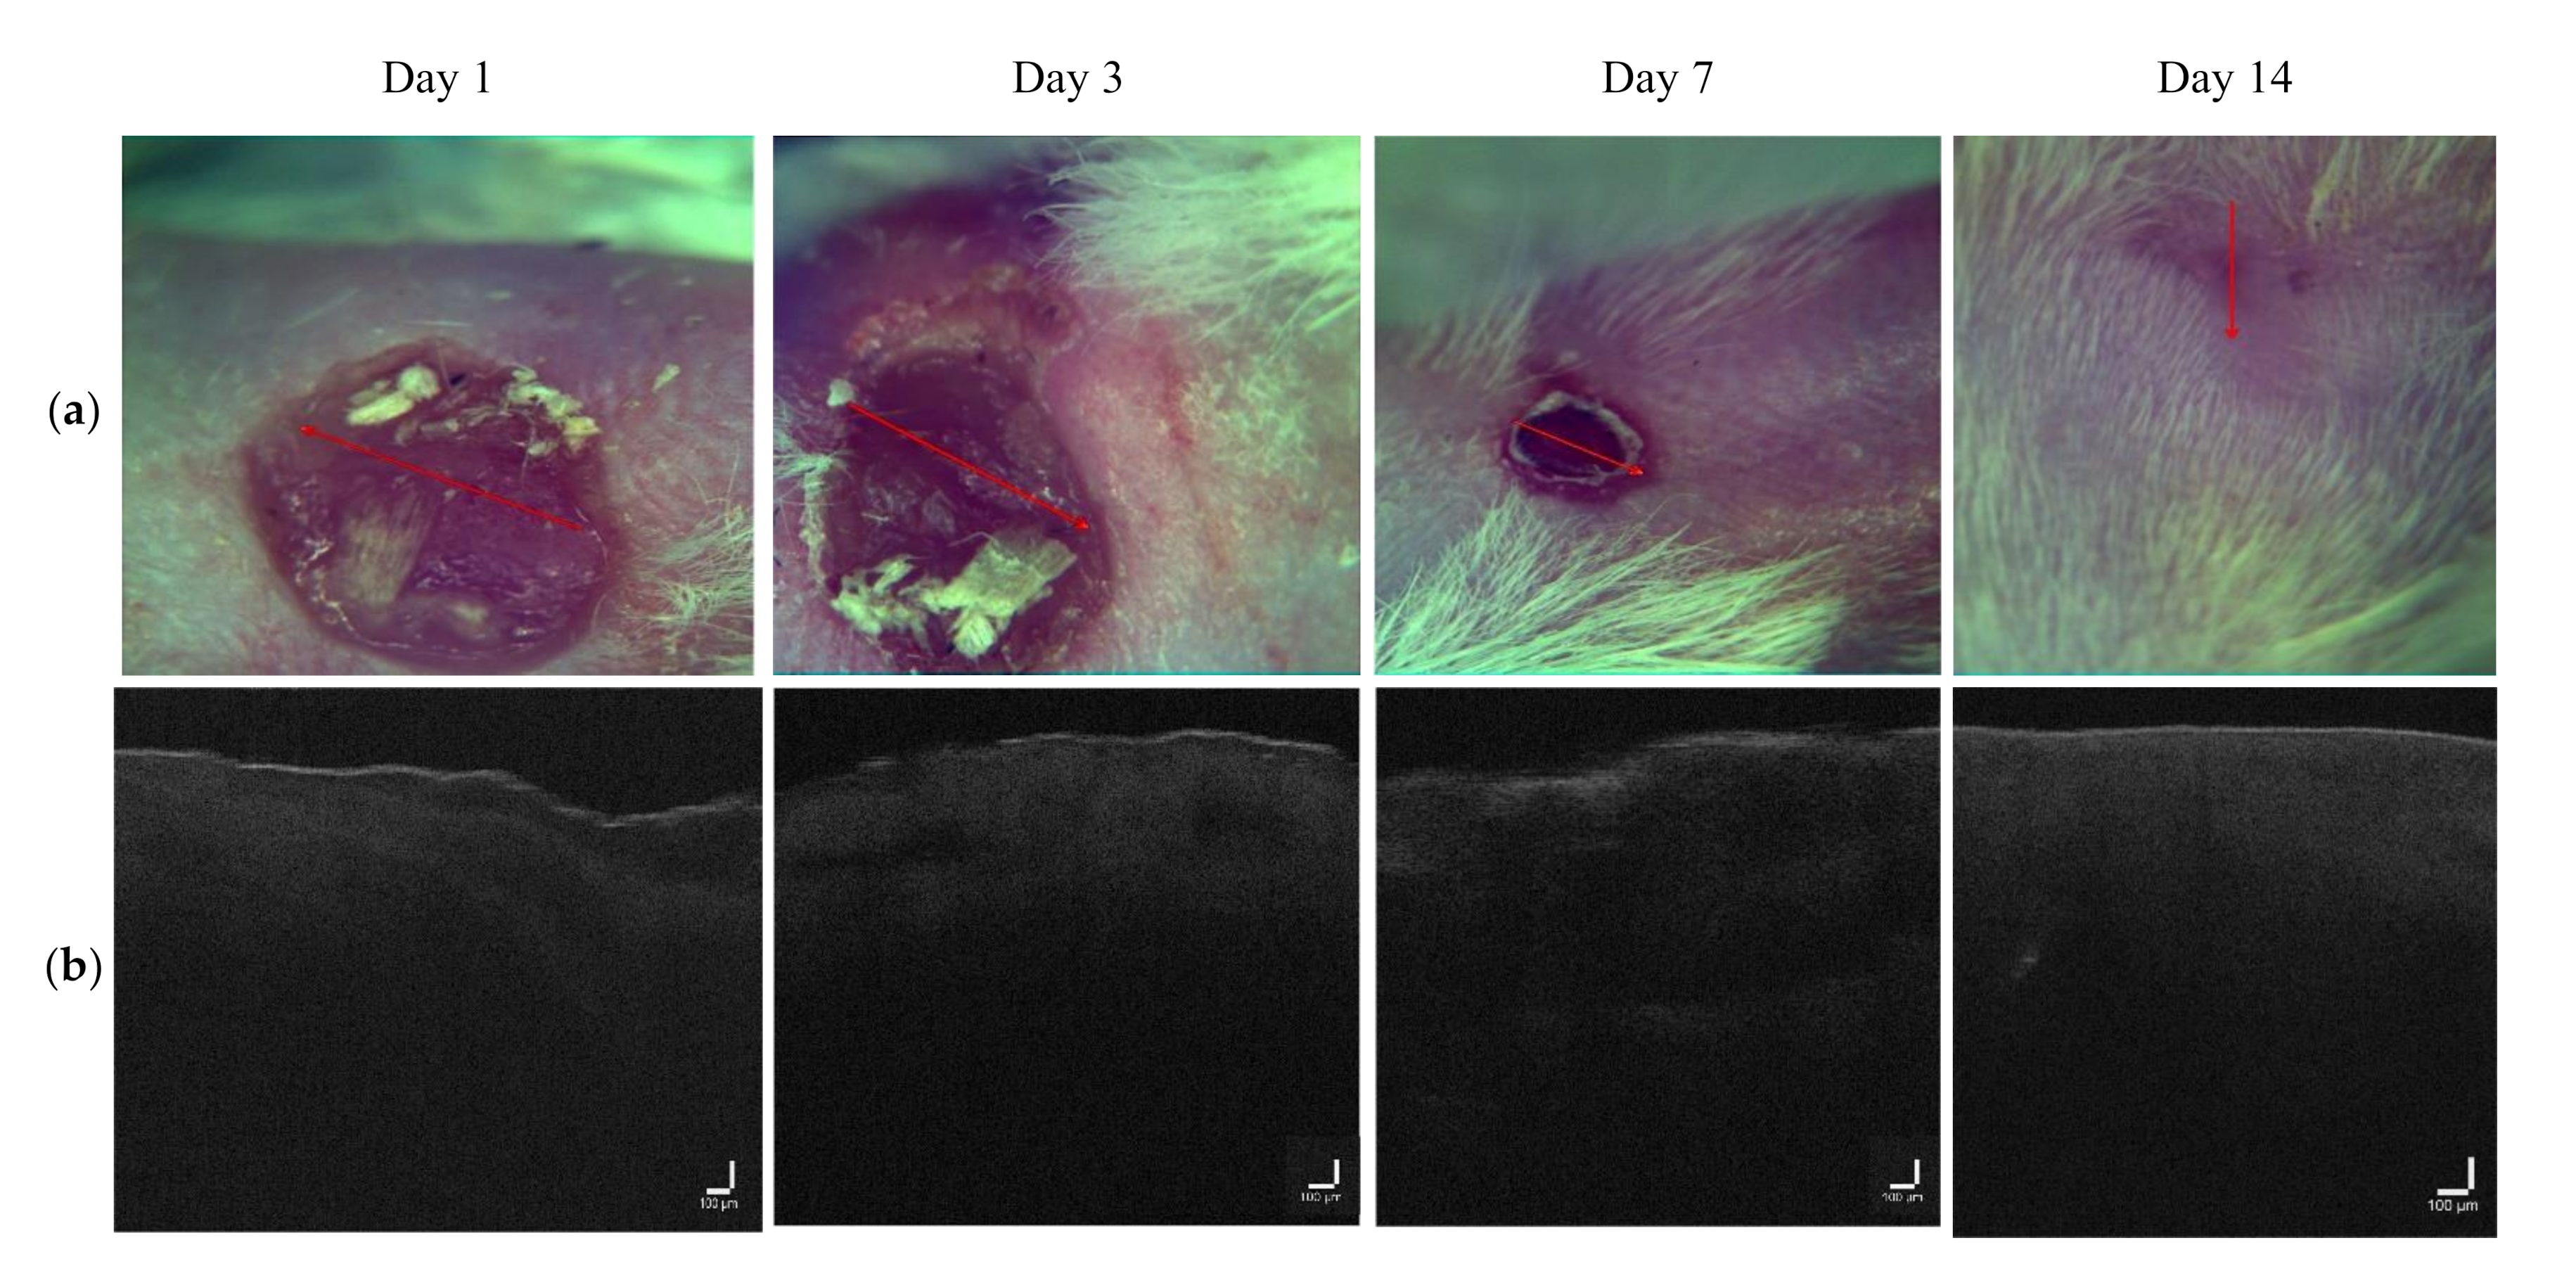
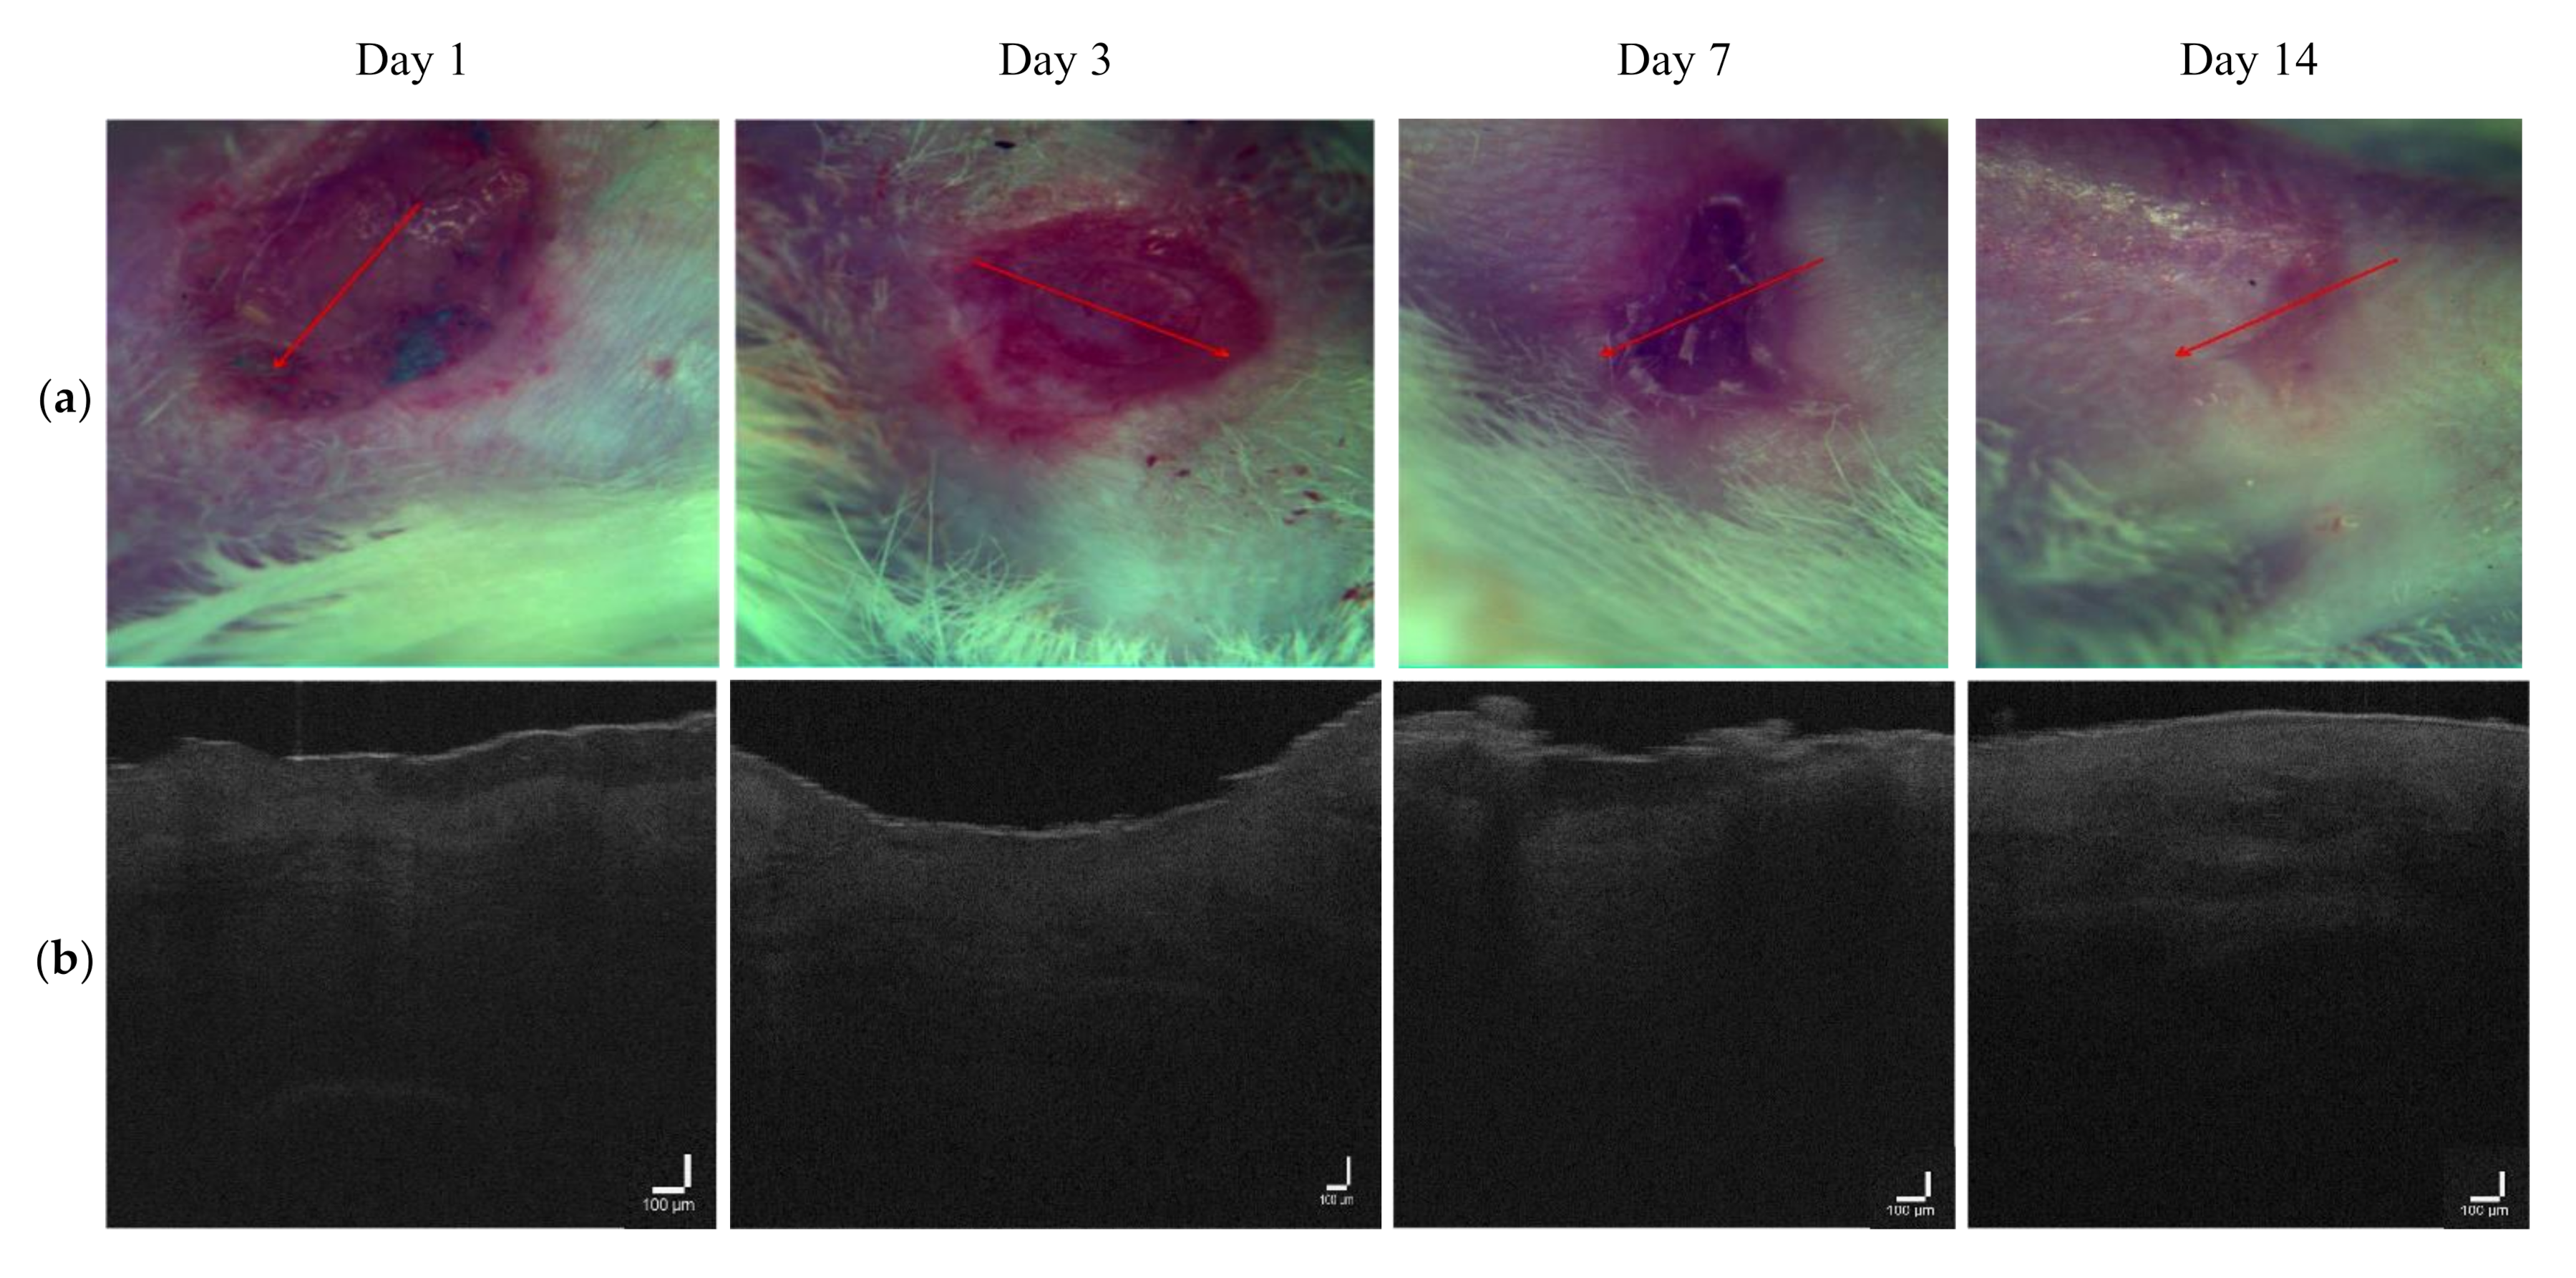
3.1. OCT Imaging
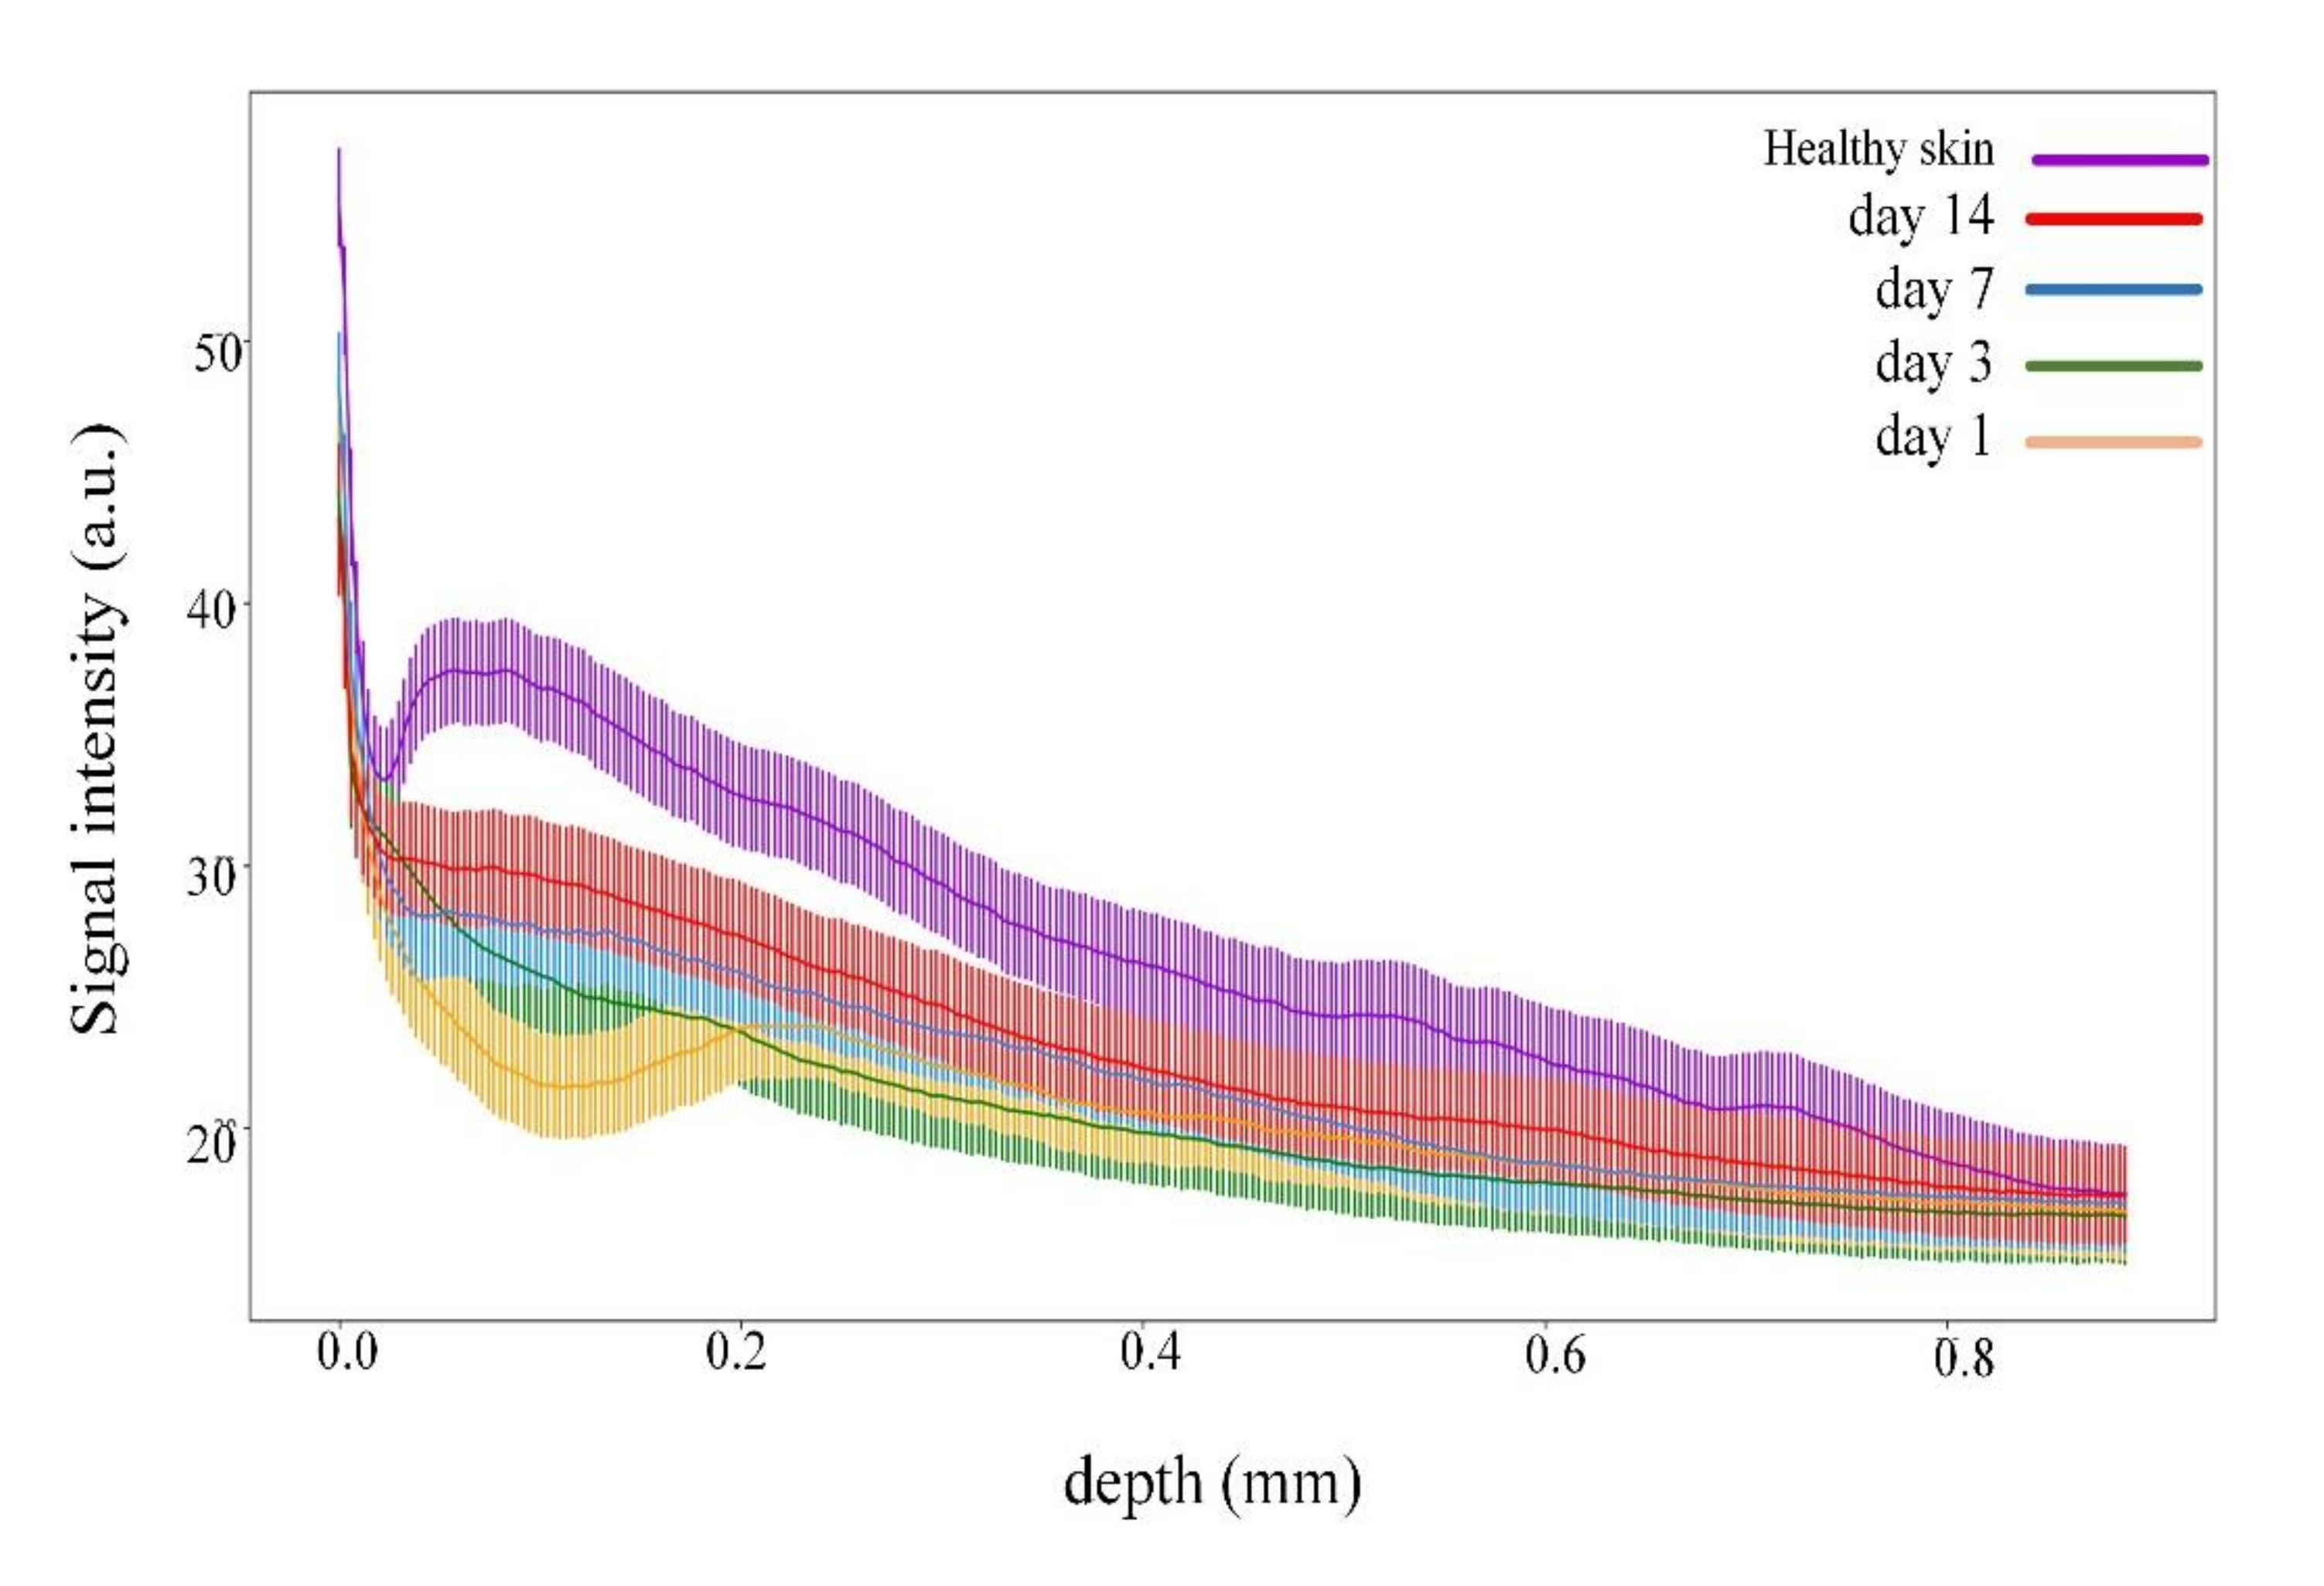
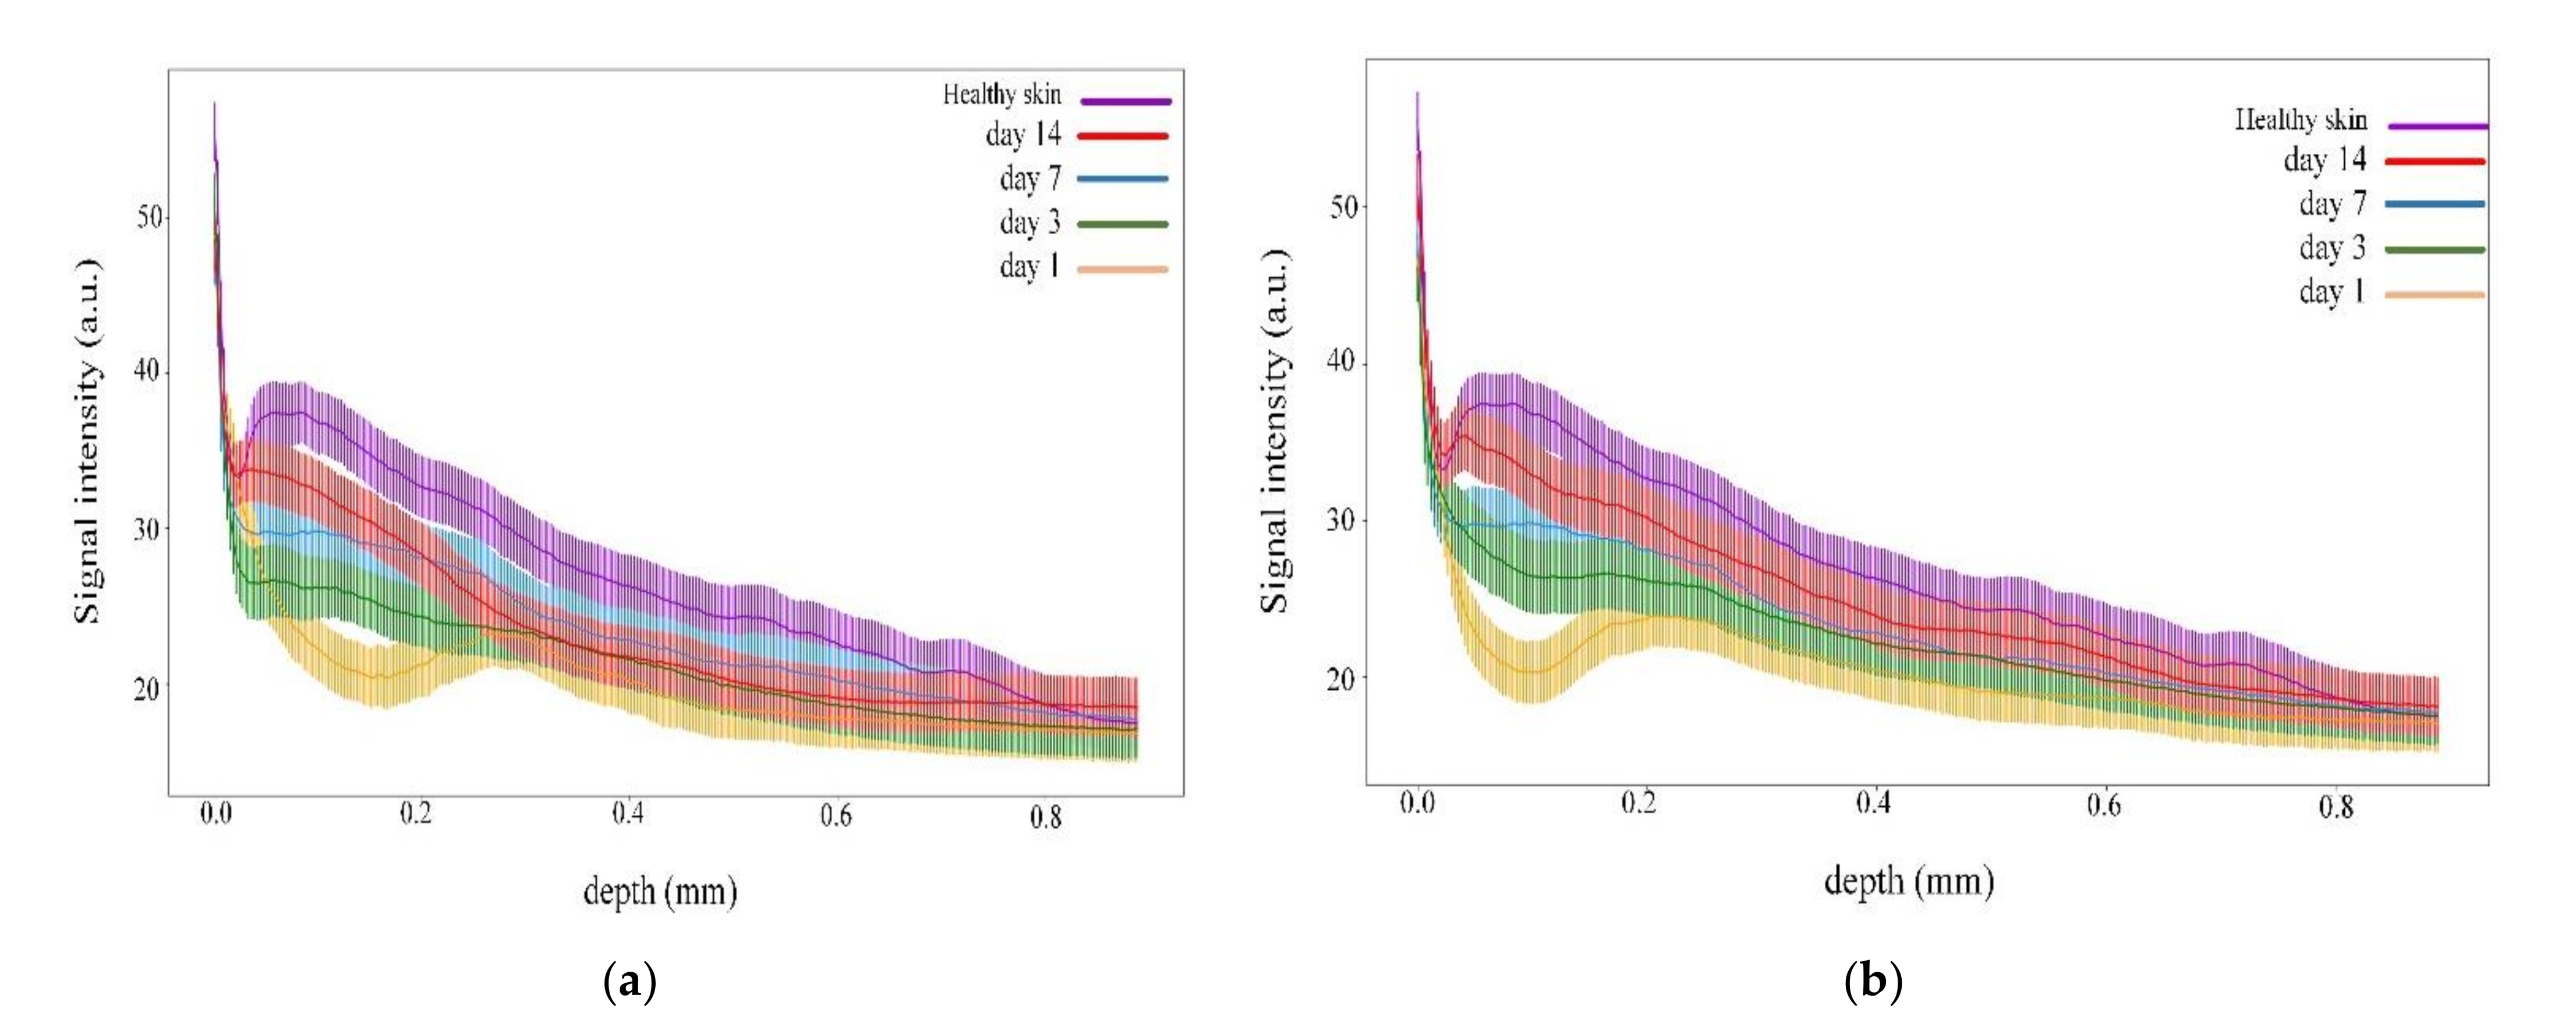
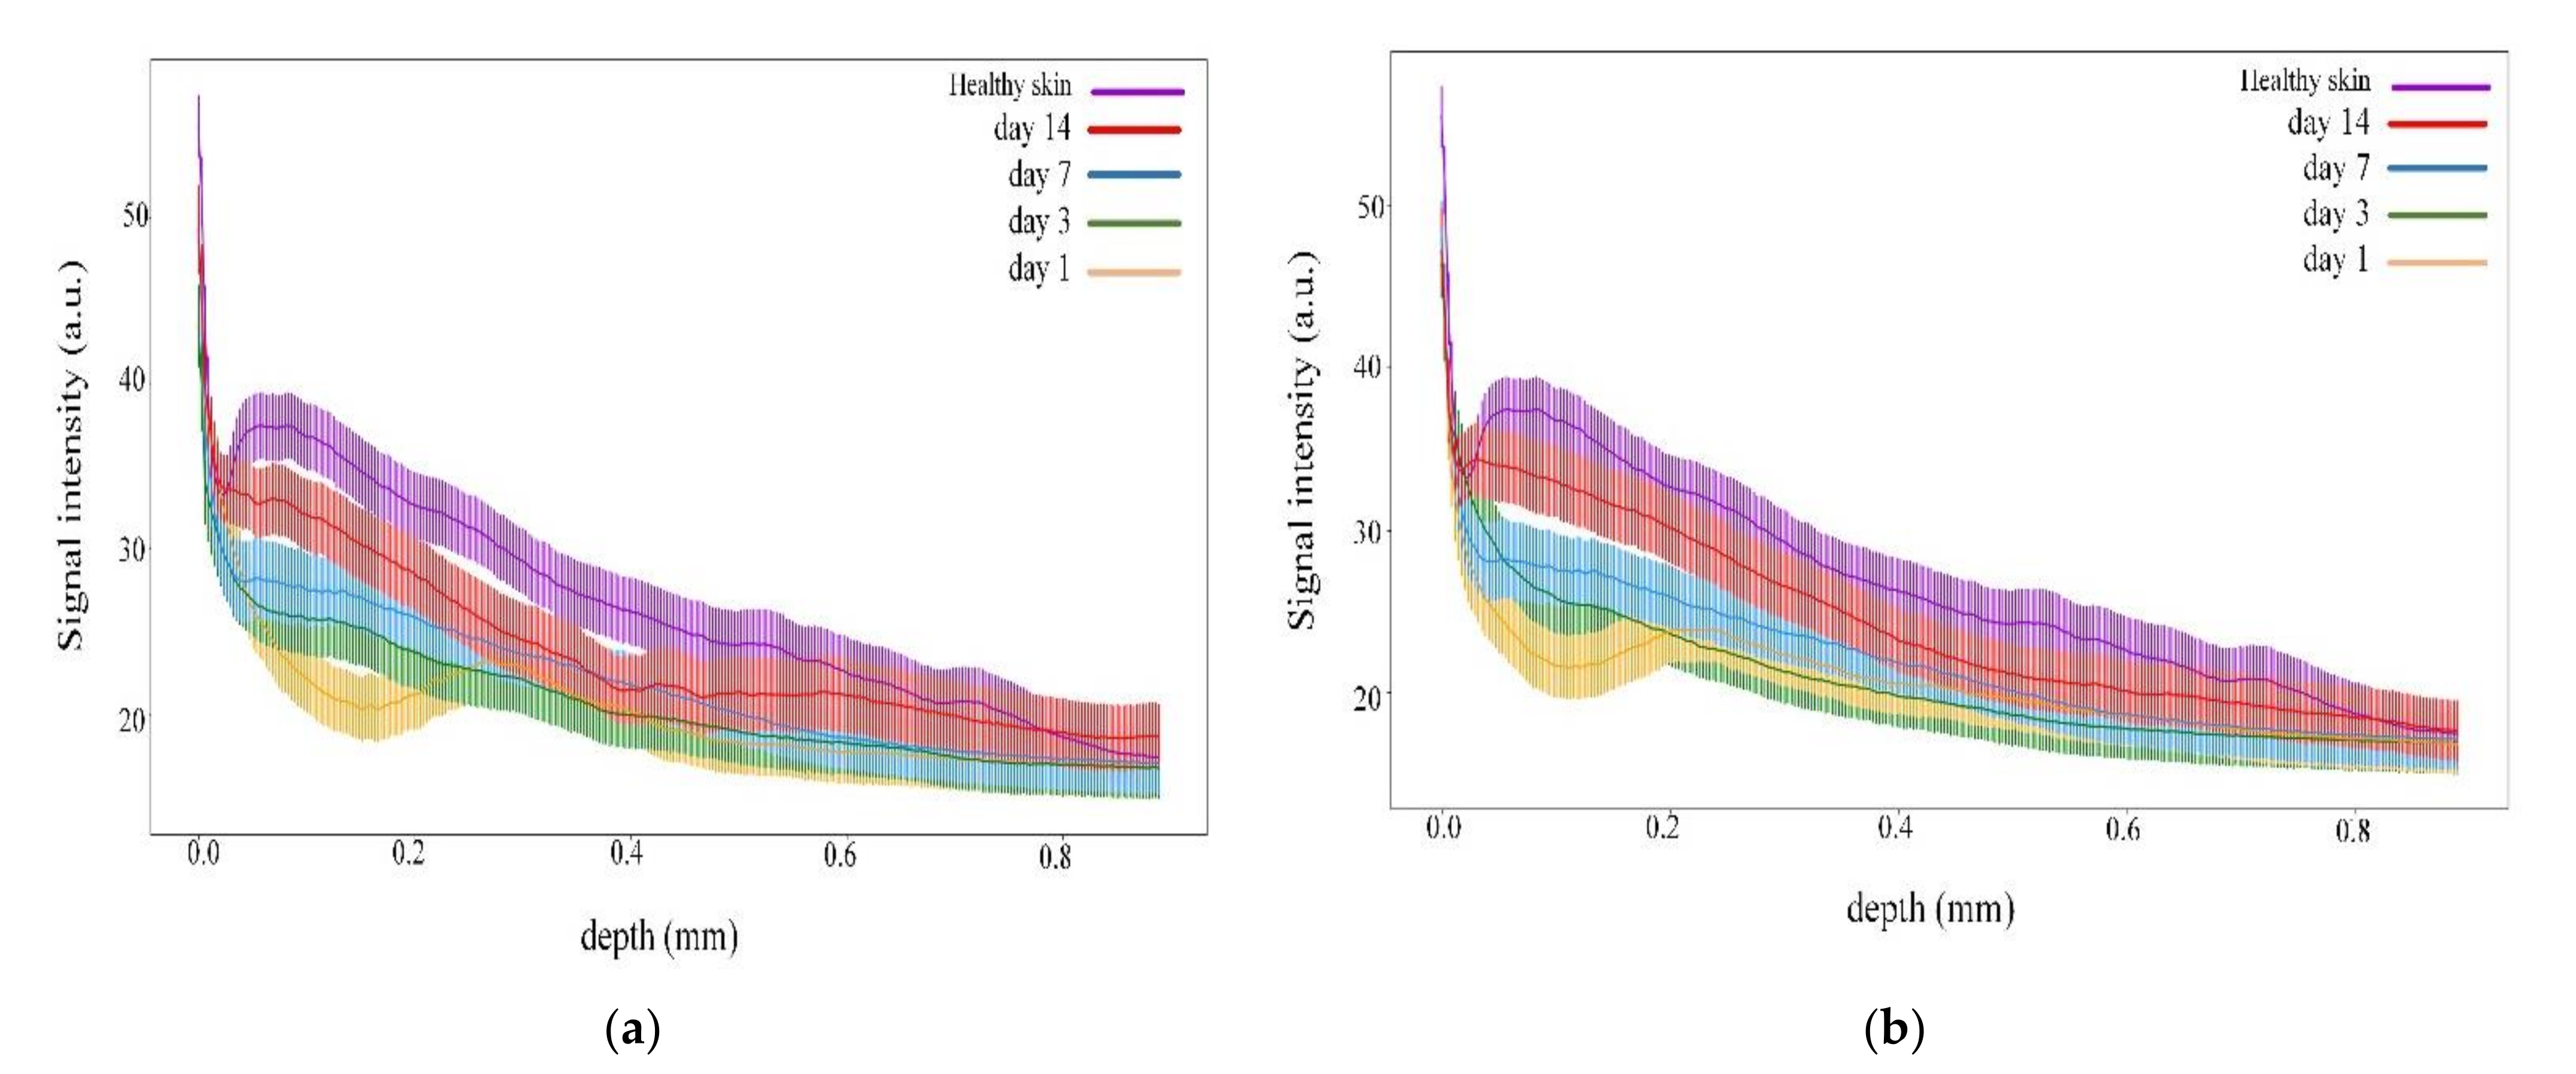
3.2. Quantitative Comparison of the Spatial Proximity of the OCT Signal Intensity
4. Discussion
5. Conclusions
Author Contributions
Funding
Institutional Review Board Statement
Data Availability Statement
Conflicts of Interest
References
- World Health Organization. Burns. Available online: https://www.who.int/news-room/fact-sheets/detail/burns (accessed on 15 December 2021).
- Nussbaum, S.R.; Carter, M.J.; Fife, C.E.; DaVanzo, J.; Haught, R.; Nusgart, M.; Cartwright, D. An Economic Evaluation of the Impact, Cost, and Medicare Policy Implications of Chronic Nonhealing Wounds. Value Health 2018, 21, 27–32. [Google Scholar] [CrossRef] [PubMed] [Green Version]
- De Gonzalez, A.C.O.; Costa, T.F.; de Andrade, Z.A.; Medrado, A.R.A.P. Wound Healing—A Literature Review. An. Bras. Dermatol. 2016, 91, 614–620. [Google Scholar] [CrossRef] [PubMed] [Green Version]
- Sorg, H.; Tilkorn, D.J.; Hager, S.; Hauser, J.; Mirastschijski, U. Skin Wound Healing: An Update on the Current Knowledge and Concepts. Eur. Surg. Res. 2017, 58, 81–94. [Google Scholar] [CrossRef] [PubMed]
- Liu, H.; Liu, H.; Deng, X.; Chen, M.; Han, X.; Yan, W.; Wang, N. Raman Spectroscopy Combined with SHG Gives a New Perspective for Rapid Assessment of the Collagen Status in the Healing of Cutaneous Wounds. Anal. Methods 2016, 8, 3503–3510. [Google Scholar] [CrossRef]
- Mickelson, M.A.; Mans, C.; Colopy, S.A. Principles of Wound Management and Wound Healing in Exotic Pets. Vet. Clin. N. Am. Exot. Anim. Pract. 2016, 19, 33–53. [Google Scholar] [CrossRef] [PubMed] [Green Version]
- Deka, G.; Wu, W.-W.; Kao, F.-J. In Vivo Wound Healing Diagnosis with Second Harmonic and Fluorescence Lifetime Imaging. J. Biomed. Opt. 2012, 18, 061222. [Google Scholar] [CrossRef] [Green Version]
- Zuhayri, H.; Knyazkova, A.I.; Nikolaev, V.V.; Borisov, A.V.; Kistenev, Y.V.; Zakharova, O.A.; Dyachenko, P.A.; Tuchin, V.V. Study of Wound Healing by Terahertz Spectroscopy. Proceedings of the Fourth International Conference on Terahertz and Microwave Radiation: Generation, Detection, and Applications; Romanovskii, Tomsk, Russia, 24–26 August 2020; Zakharova, O.A., Kistenev, Y.V., Eds.; SPIE: Tomsk, Russia, 2020; p. 63. [Google Scholar]
- Bolton, L. Peripheral Arterial Disease: Scoping Review of Patient-centred Outcomes. Int. Wound J. 2019, 16, 1521–1532. [Google Scholar] [CrossRef] [PubMed]
- Baltzis, D.; Eleftheriadou, I.; Veves, A. Pathogenesis and Treatment of Impaired Wound Healing in Diabetes Mellitus: New Insights. Adv. Ther. 2014, 31, 817–836. [Google Scholar] [CrossRef] [PubMed]
- Mazumder, N.; Ball, K.N.; Zhuo, K.-Q.; Kistenev, Y.V.; Kumar, R.; Kao, F.-J.; Brasselet, S.; Nikolaev, V.V.; Krivova, N.A. Label-Free Multimodal Nonlinear Optical Microscopy for Biomedical Applications. J. Appl. Phys. 2021, 129, 214901. [Google Scholar] [CrossRef]
- Phillips, C.J.; Humphreys, I.; Fletcher, J.; Harding, K.; Chamberlain, G.; Macey, S. Estimating the Costs Associated with the Management of Patients with Chronic Wounds Using Linked Routine Data: Costs of Wounds Using Routine Data. Int. Wound J. 2016, 13, 1193–1197. [Google Scholar] [CrossRef]
- Guest, J.F.; Ayoub, N.; McIlwraith, T.; Uchegbu, I.; Gerrish, A.; Weidlich, D.; Vowden, K.; Vowden, P. Health Economic Burden That Wounds Impose on the National Health Service in the UK. BMJ Open 2015, 5, e009283. [Google Scholar] [CrossRef] [Green Version]
- Heyer, K.; Herberger, K.; Protz, K.; Glaeske, G.; Augustin, M. Epidemiology of Chronic Wounds in Germany: Analysis of Statutory Health Insurance Data: Epidemiology of Chronic Wounds in Germany. Wound Rep. Reg. 2016, 24, 434–442. [Google Scholar] [CrossRef] [PubMed]
- Tedesco, A.; Jesus, P. Low Level Energy Photodynamic Therapy for Skin Processes and Regeneration. In Photomedicine—Advances in Clinical Practice; Tanaka, Y., Ed.; InTech: London, UK, 2017; ISBN 978-953-51-3155-7. [Google Scholar]
- Shaw, T.J.; Martin, P. Wound Repair at a Glance. J. Cell Sci. 2009, 122, 3209–3213. [Google Scholar] [CrossRef] [PubMed] [Green Version]
- Yang, T.; Tan, Y.; Zhang, W.; Yang, W.; Luo, J.; Chen, L.; Liu, H.; Yang, G.; Lei, X. Effects of ALA-PDT on the Healing of Mouse Skin Wounds Infected With Pseudomonas Aeruginosa and Its Related Mechanisms. Front. Cell Dev. Biol. 2020, 8, 585132. [Google Scholar] [CrossRef]
- Algorri, J.F.; Ochoa, M.; Roldán-Varona, P.; Rodríguez-Cobo, L.; López-Higuera, J.M. Photodynamic Therapy: A Compendium of Latest Reviews. Cancers 2021, 13, 4447. [Google Scholar] [CrossRef] [PubMed]
- Kwiatkowski, S.; Knap, B.; Przystupski, D.; Saczko, J.; Kędzierska, E.; Knap-Czop, K.; Kotlińska, J.; Michel, O.; Kotowski, K.; Kulbacka, J. Photodynamic Therapy—Mechanisms, Photosensitizers and Combinations. Biomed. PharmacoTher. 2018, 106, 1098–1107. [Google Scholar] [CrossRef] [PubMed]
- Peplow, P.V.; Chung, T.-Y.; Baxter, G.D. Photodynamic Modulation of Wound Healing: A Review of Human and Animal Studies. Photomed. Laser Surg. 2012, 30, 118–148. [Google Scholar] [CrossRef]
- Vallejo, M.C.S.; Moura, N.M.M.; Ferreira Faustino, M.A.; Almeida, A.; Gonçalves, I.; Serra, V.V.; Neves, M.G.P.M.S. An Insight into the Role of Non-Porphyrinoid Photosensitizers for Skin Wound Healing. IJMS 2020, 22, 234. [Google Scholar] [CrossRef]
- Morimoto, K.; Ozawa, T.; Awazu, K.; Ito, N.; Honda, N.; Matsumoto, S.; Tsuruta, D. Photodynamic Therapy Using Systemic Administration of 5-Aminolevulinic Acid and a 410-Nm Wavelength Light-Emitting Diode for Methicillin-Resistant Staphylococcus Aureus-Infected Ulcers in Mice. PLoS ONE 2014, 9, e105173. [Google Scholar] [CrossRef]
- Yin, R.; Lin, L.; Xiao, Y.; Hao, F.; Hamblin, M.R. Combination ALA-PDT and Ablative Fractional Er:YAG Laser (2,940 Nm) on the Treatment of Severe Acne: Combination ala-pdt and ablative fractional er:yag laser. Lasers Surg. Med. 2014, 46, 165–172. [Google Scholar] [CrossRef] [Green Version]
- Jiang, C.; Yang, W.; Wang, C.; Qin, W.; Ming, J.; Zhang, M.; Qian, H.; Jiao, T. Methylene Blue-Mediated Photodynamic Therapy Induces Macrophage Apoptosis via ROS and Reduces Bone Resorption in Periodontitis. Oxid. Med. Cell. Longev. 2019, 2019, 1–15. [Google Scholar] [CrossRef] [PubMed] [Green Version]
- Sperandio, F.F.; Simões, A.; Aranha, A.C.C.; Corrêa, L.; Orsini Machado de Sousa, S.C. Photodynamic Therapy Mediated by Methylene Blue Dye in Wound Healing. Photomed. Laser Surg. 2010, 28, 581–587. [Google Scholar] [CrossRef] [PubMed]
- Pérez, M.; Robres, P.; Moreno, B.; Bolea, R.; Verde, M.T.; Pérez-Laguna, V.; Aspiroz, C.; Gilaberte, Y.; Rezusta, A. Comparison of Antibacterial Activity and Wound Healing in a Superficial Abrasion Mouse Model of Staphylococcus Aureus Skin Infection Using Photodynamic Therapy Based on Methylene Blue or Mupirocin or Both. Front. Med. 2021, 8, 673408. [Google Scholar] [CrossRef] [PubMed]
- Carneiro, V.S.M.; de Catao, M.H.C.V.; Menezes, R.F.; Araújo, N.C.; Gerbi, M.E.M. Methylene Blue Photodynamic Therapy in Rats’ Wound Healing: 21 Days Follow-Up; Kurachi, C., Svanberg, K., Tromberg, B.J., Bagnato, V.S., Eds.; SPIE Proceedings: Rio de Janeiro, Brazil, 2015; p. 95311S. [Google Scholar]
- Xiong, Z.-M.; O’Donovan, M.; Sun, L.; Choi, J.Y.; Ren, M.; Cao, K. Anti-Aging Potentials of Methylene Blue for Human Skin Longevity. Sci. Rep. 2017, 7, 2475. [Google Scholar] [CrossRef]
- Yang, Z.; Hu, X.; Zhou, L.; He, Y.; Zhang, X.; Yang, J.; Ju, Z.; Liou, Y.-C.; Shen, H.-M.; Luo, G.; et al. Photodynamic Therapy Accelerates Skin Wound Healing through Promoting Re-Epithelialization. Burn. Trauma 2021, 9, tkab008. [Google Scholar] [CrossRef] [PubMed]
- Huang, Y.-Y.; Chen, A.C.-H.; Carroll, J.D.; Hamblin, M.R. Biphasic Dose Response in Low Level Light Therapy. Dose-Resp. 2009, 7, 358–383. [Google Scholar] [CrossRef] [PubMed]
- Huang, Y.-Y.; Sharma, S.K.; Carroll, J.; Hamblin, M.R. Biphasic Dose Response in Low Level Light Therapy—an Update. Dose-Resp. 2011, 9, 602–618. [Google Scholar] [CrossRef] [PubMed]
- Hawkins, D.H.; Abrahamse, H. The Role of Laser Fluence in Cell Viability, Proliferation, and Membrane Integrity of Wounded Human Skin Fibroblasts Following Helium-Neon Laser Irradiation. Lasers Surg. Med. 2006, 38, 74–83. [Google Scholar] [CrossRef] [PubMed]
- Byrnes, K.R.; Barna, L.; Chenault, V.M.; Waynant, R.W.; Ilev, I.K.; Longo, L.; Miracco, C.; Johnson, B.; Anders, J.J. Photobiomodulation Improves Cutaneous Wound Healing in an Animal Model of Type II Diabetes. Photomed. Laser Surg. 2004, 22, 281–290. [Google Scholar] [CrossRef] [PubMed]
- Prabhu, V.; Rao, S.B.S.; Chandra, S.; Kumar, P.; Rao, L.; Guddattu, V.; Satyamoorthy, K.; Mahato, K.K. Spectroscopic and Histological Evaluation of Wound Healing Progression Following Low Level Laser Therapy (LLLT). J. Biophoton. 2012, 5, 168–184. [Google Scholar] [CrossRef] [PubMed]
- Basso, F.G.; Pansani, T.N.; Turrioni, A.P.S.; Bagnato, V.S.; Hebling, J.; de Souza Costa, C.A. In Vitro Wound Healing Improvement by Low-Level Laser Therapy Application in Cultured Gingival Fibroblasts. Int. J. Dent. 2012, 2012, 1–6. [Google Scholar] [CrossRef] [PubMed] [Green Version]
- De Chaves, M.E.A.; de Araújo, A.R.; Piancastelli, A.C.C.; Pinotti, M. Effects of Low-Power Light Therapy on Wound Healing: LASER x LED. An. Bras. Dermatol. 2014, 89, 616–623. [Google Scholar] [CrossRef] [PubMed]
- Monstrey, S.; Hoeksema, H.; Verbelen, J.; Pirayesh, A.; Blondeel, P. Assessment of Burn Depth and Burn Wound Healing Potential. Burns 2008, 34, 761–769. [Google Scholar] [CrossRef] [PubMed] [Green Version]
- Huang, D.; Swanson, E.A.; Lin, C.P.; Schuman, J.S.; Stinson, W.G.; Chang, W.; Hee, M.R.; Flotte, T.; Gregory, K.; Puliafito, C.A.; et al. Optical Coherence Tomography. Science 1991, 254, 1178–1181. [Google Scholar] [CrossRef] [Green Version]
- Almasian, M.; Bosschaart, N.; van Leeuwen, T.G.; Faber, D.J. Validation of Quantitative Attenuation and Backscattering Coefficient Measurements by Optical Coherence Tomography in the Concentration-Dependent and Multiple Scattering Regime. J. Biomed. Opt. 2015, 20, 121314. [Google Scholar] [CrossRef] [PubMed] [Green Version]
- Evans, N.D.; Oreffo, R.O.C.; Healy, E.; Thurner, P.J.; Man, Y.H. Epithelial Mechanobiology, Skin Wound Healing, and the Stem Cell Niche. J. Mech. Behav. Biomed. Mater. 2013, 28, 397–409. [Google Scholar] [CrossRef] [PubMed] [Green Version]
- Tan, S.T.; Dosan, R. Lessons From Epithelialization: The Reason Behind Moist Wound Environment. TODJ 2019, 13, 34–40. [Google Scholar] [CrossRef]
- Yuan, Z.; Zakhaleva, J.; Ren, H.; Liu, J.; Chen, W.; Pan, Y. Noninvasive and High-Resolution Optical Monitoring of Healing of Diabetic Dermal Excisional Wounds Implanted with Biodegradable In Situ Gelable Hydrogels. Tissue Eng. Part C: Methods 2010, 16, 237–247. [Google Scholar] [CrossRef] [PubMed] [Green Version]
- Bulygin, A.D.; Vrazhnov, D.A.; Sim, E.S.; Meglinski, I.; Kistenev, Y.V. Imitation of Optical Coherence Tomography Images by Wave Monte Carlo-Based Approach Implemented with the Leontovich–Fock Equation. Opt. Eng. 2020, 59, 1. [Google Scholar] [CrossRef] [Green Version]
- Kistenev, Y.; Buligin, A.D.; Sandykova, E.; Sim, E.; Vrazhnov, D. Optical Coherence Tomography Modeling Method Based on Leontovich—Fock Equation. Proceedings of the 25th International Symposium on Atmospheric and Ocean Optics: Atmospheric Physics; Matvienko, G.G., Romanovskii, O.A., Eds.; SPIE: Novosibirsk, Russia, 2019; p. 130. [Google Scholar]
- Jaspers, M.E.H.; Feroldi, F.; Vlig, M.; de Boer, J.F.; van Zuijlen, P.P.M. In Vivo Polarization-Sensitive Optical Coherence Tomography of Human Burn Scars: Birefringence Quantification and Correspondence with Histologically Determined Collagen Density. J. Biomed. Opt. 2017, 22, 1. [Google Scholar] [CrossRef]
- Chen, C.-L.; Wang, R.K. Optical Coherence Tomography Based Angiography [Invited]. Biomed. Opt. Expr. 2017, 8, 1056. [Google Scholar] [CrossRef] [PubMed] [Green Version]
- Kistenev, Y.V.; Kuzmin, D.A.; Sandykova, E.A.; Shapovalov, A.V. Quantitative Comparison of the Absorption Spectra of the Gas Mixtures in Analogy to the Criterion of Pearson; Romanovskii, O.A., Ed.; SPIE Proceedings: Tomsk, Russia, 2015; p. 96803S. [Google Scholar]
- Zein, R.; Selting, W.; Hamblin, M.R. Review of Light Parameters and Photobiomodulation Efficacy: Dive into Complexity. J. Biomed. Opt. 2018, 23, 1. [Google Scholar] [CrossRef] [PubMed] [Green Version]
- Kilík, R.; Lakyová, L.; Sabo, J.; Kruzliak, P.; Lacjaková, K.; Vasilenko, T.; Vidová, M.; Longauer, F.; Radoňak, J. Effect of Equal Daily Doses Achieved by Different Power Densities of Low-Level Laser Therapy at 635 Nm on Open Skin Wound Healing in Normal and Diabetic Rats. BioMed. Res. Int. 2014, 2014, 1–9. [Google Scholar] [CrossRef] [PubMed]
- Zuhayri, H.; Nikolaev, V.V.; Knyazkova, A.I.; Lepekhina, T.B.; Krivova, N.A.; Tuchin, V.V.; Kistenev, Y.V. In Vivo Quantification of the Effectiveness of Topical Low-Dose Photodynamic Therapy in Wound Healing Using Two-Photon Microscopy. Pharmaceutics 2022, 14, 287. [Google Scholar] [CrossRef]


| n = 5 | Control | LDPDT–5-ALA 1 J/cm2 | LDPDT–5-ALA 4 J/cm2 | LDPDT–MB 1 J/cm2 | LDPDT–MB 4 J/cm2 |
|---|---|---|---|---|---|
| Day 1 | (0.0528 ± 0.0084) ** | (0.0516 ± 0.0072) ** | (0.0517 ± 0.0045) ** | (0.0494 ± 0.0083) ** | (0.0539 ± 0.0064) ** |
| Day 3 | (0.0404 ± 0.0141) ** | (0.0504 ± 0.0106) * | (0.0480 ± 0.0087) ** | (0.0456 ± 0.0169) * | (0.0423 ± 0.0134) * |
| Day 7 | (0.0316 ± 0.0089) * | (0.0379 ± 0.0124) * | (0.0315 ± 0.0111) * | (0.0361 ± 0.0084) * | (0.0305 ± 0.0073) * |
| Day 14 | (0.0214 ± 0.0076) * | (0.0213 ± 0.0075) | (0.0187 ± 0.0213) | (0.0201 ± 0.0054) | (0.0174 ± 0.0051) |
| n = 5 | LDPDT–5-ALA | LDPDT–MB |
|---|---|---|
| Day 14 | (0.0115 ± 0.0019) ** | (0.0142 ± 0.0011) * |
Publisher’s Note: MDPI stays neutral with regard to jurisdictional claims in published maps and institutional affiliations. |
© 2022 by the authors. Licensee MDPI, Basel, Switzerland. This article is an open access article distributed under the terms and conditions of the Creative Commons Attribution (CC BY) license (https://creativecommons.org/licenses/by/4.0/).
Share and Cite
Zuhayri, H.; Nikolaev, V.V.; Lepekhina, T.B.; Sandykova, E.A.; Krivova, N.A.; Kistenev, Y.V. The In Vivo Quantitative Assessment of the Effectiveness of Low-Dose Photodynamic Therapy on Wound Healing Using Optical Coherence Tomography. Pharmaceutics 2022, 14, 399. https://doi.org/10.3390/pharmaceutics14020399
Zuhayri H, Nikolaev VV, Lepekhina TB, Sandykova EA, Krivova NA, Kistenev YV. The In Vivo Quantitative Assessment of the Effectiveness of Low-Dose Photodynamic Therapy on Wound Healing Using Optical Coherence Tomography. Pharmaceutics. 2022; 14(2):399. https://doi.org/10.3390/pharmaceutics14020399
Chicago/Turabian StyleZuhayri, Hala, Viktor V. Nikolaev, Tatiana B. Lepekhina, Ekaterina A. Sandykova, Natalya A. Krivova, and Yury V. Kistenev. 2022. "The In Vivo Quantitative Assessment of the Effectiveness of Low-Dose Photodynamic Therapy on Wound Healing Using Optical Coherence Tomography" Pharmaceutics 14, no. 2: 399. https://doi.org/10.3390/pharmaceutics14020399