
Discovery and SAR Study of Quinoxaline–Arylfuran Derivatives as a New Class of Antitumor Agents
Abstract
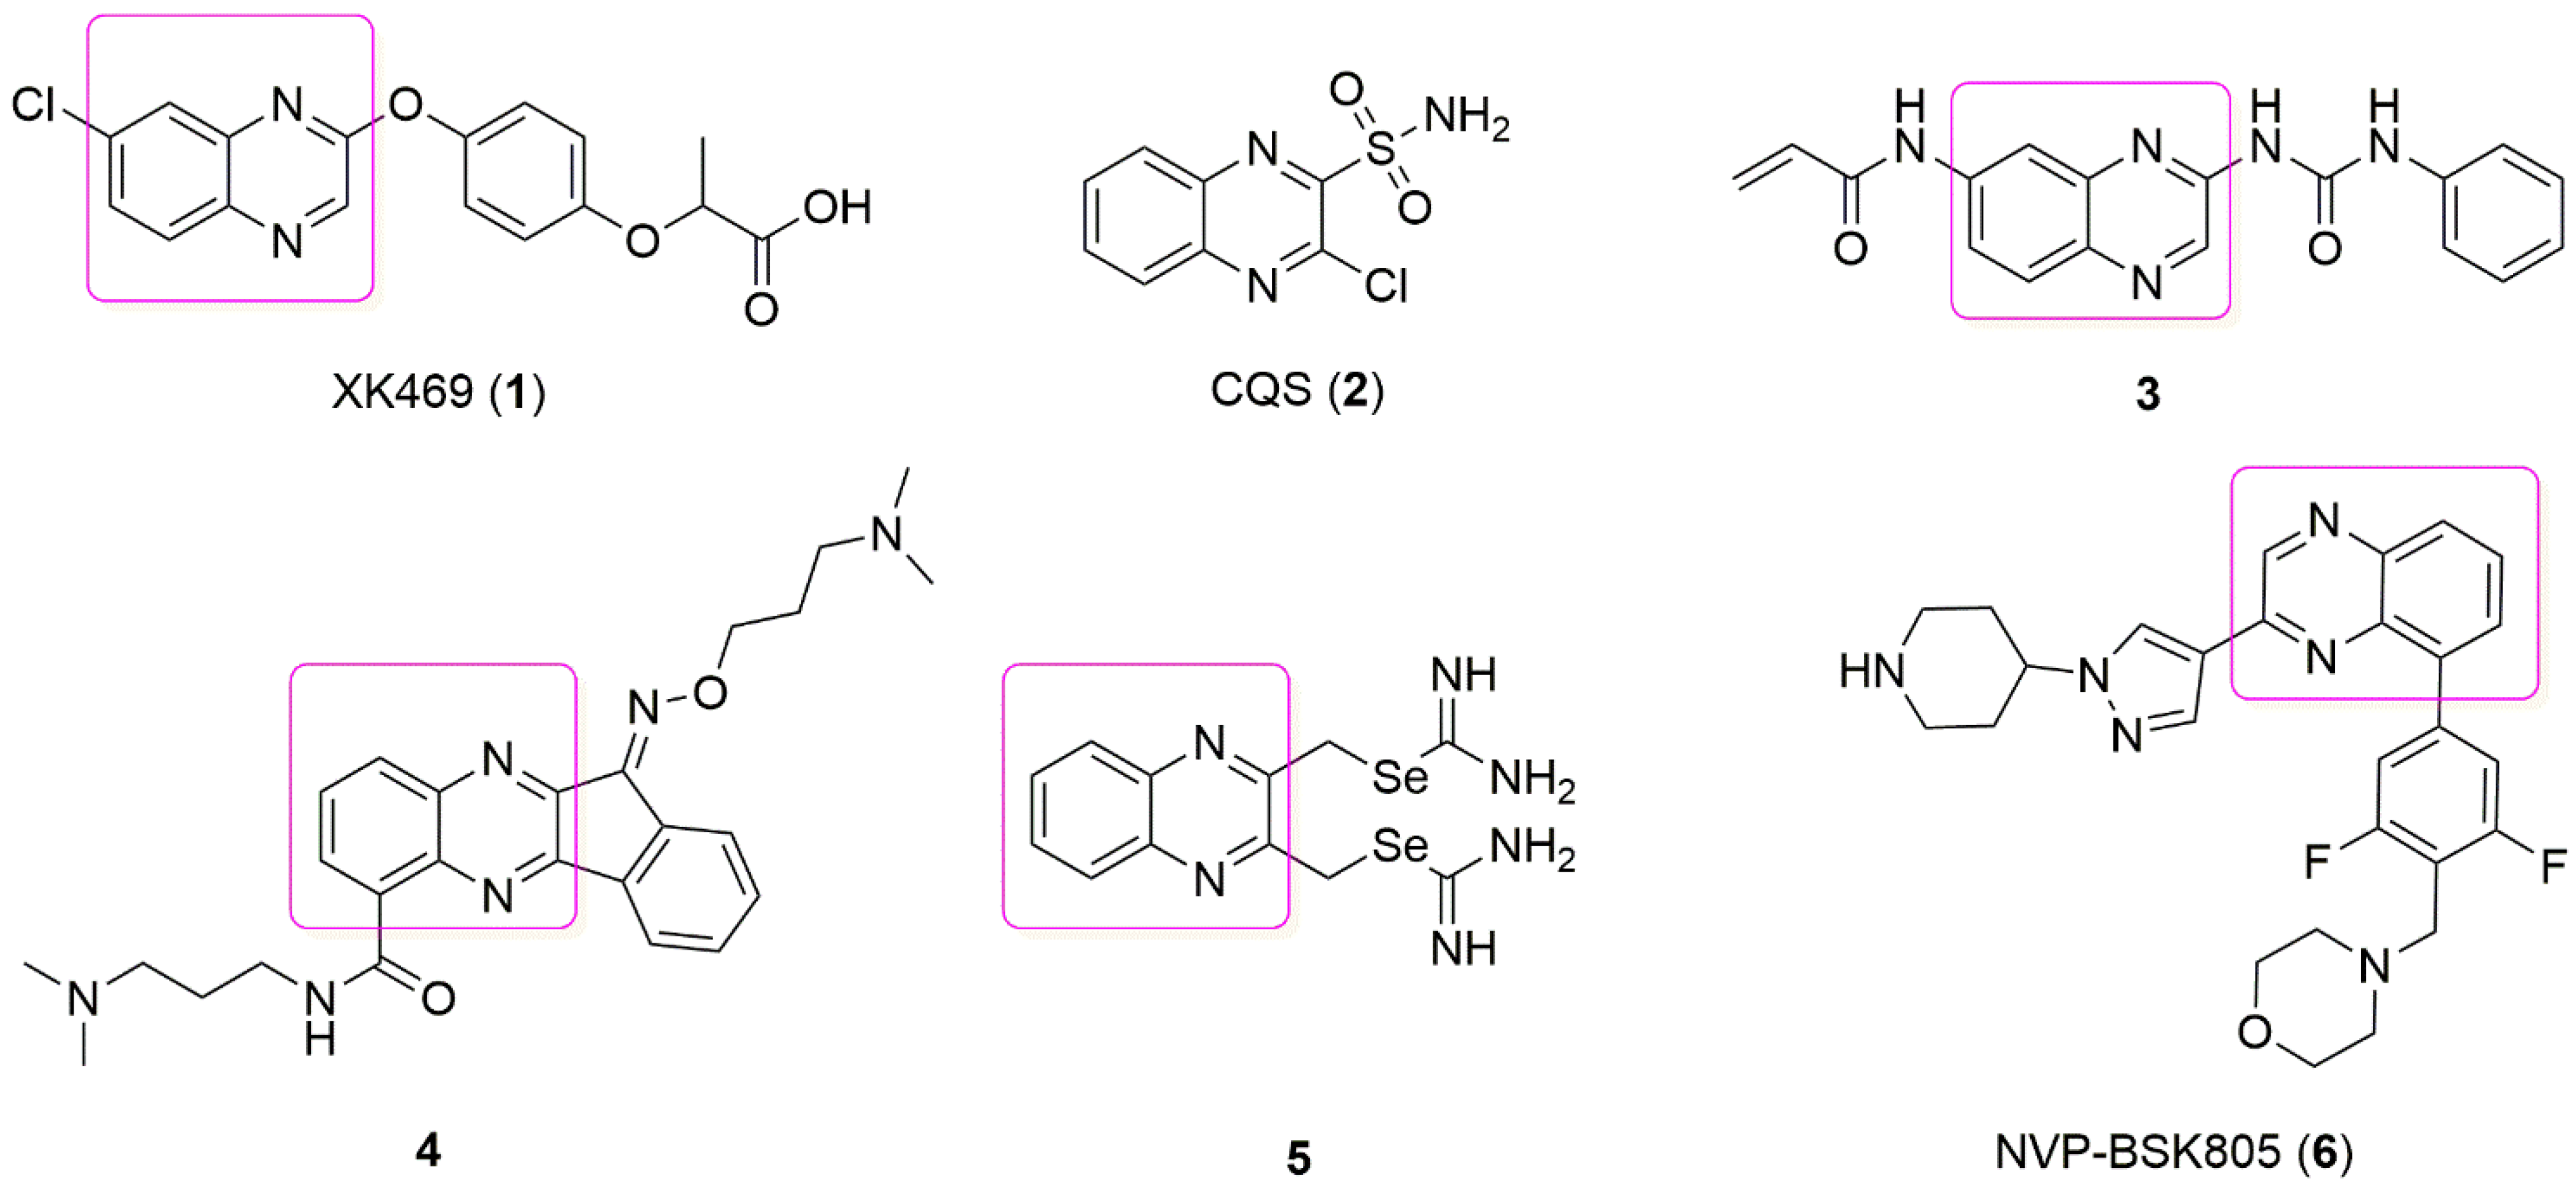
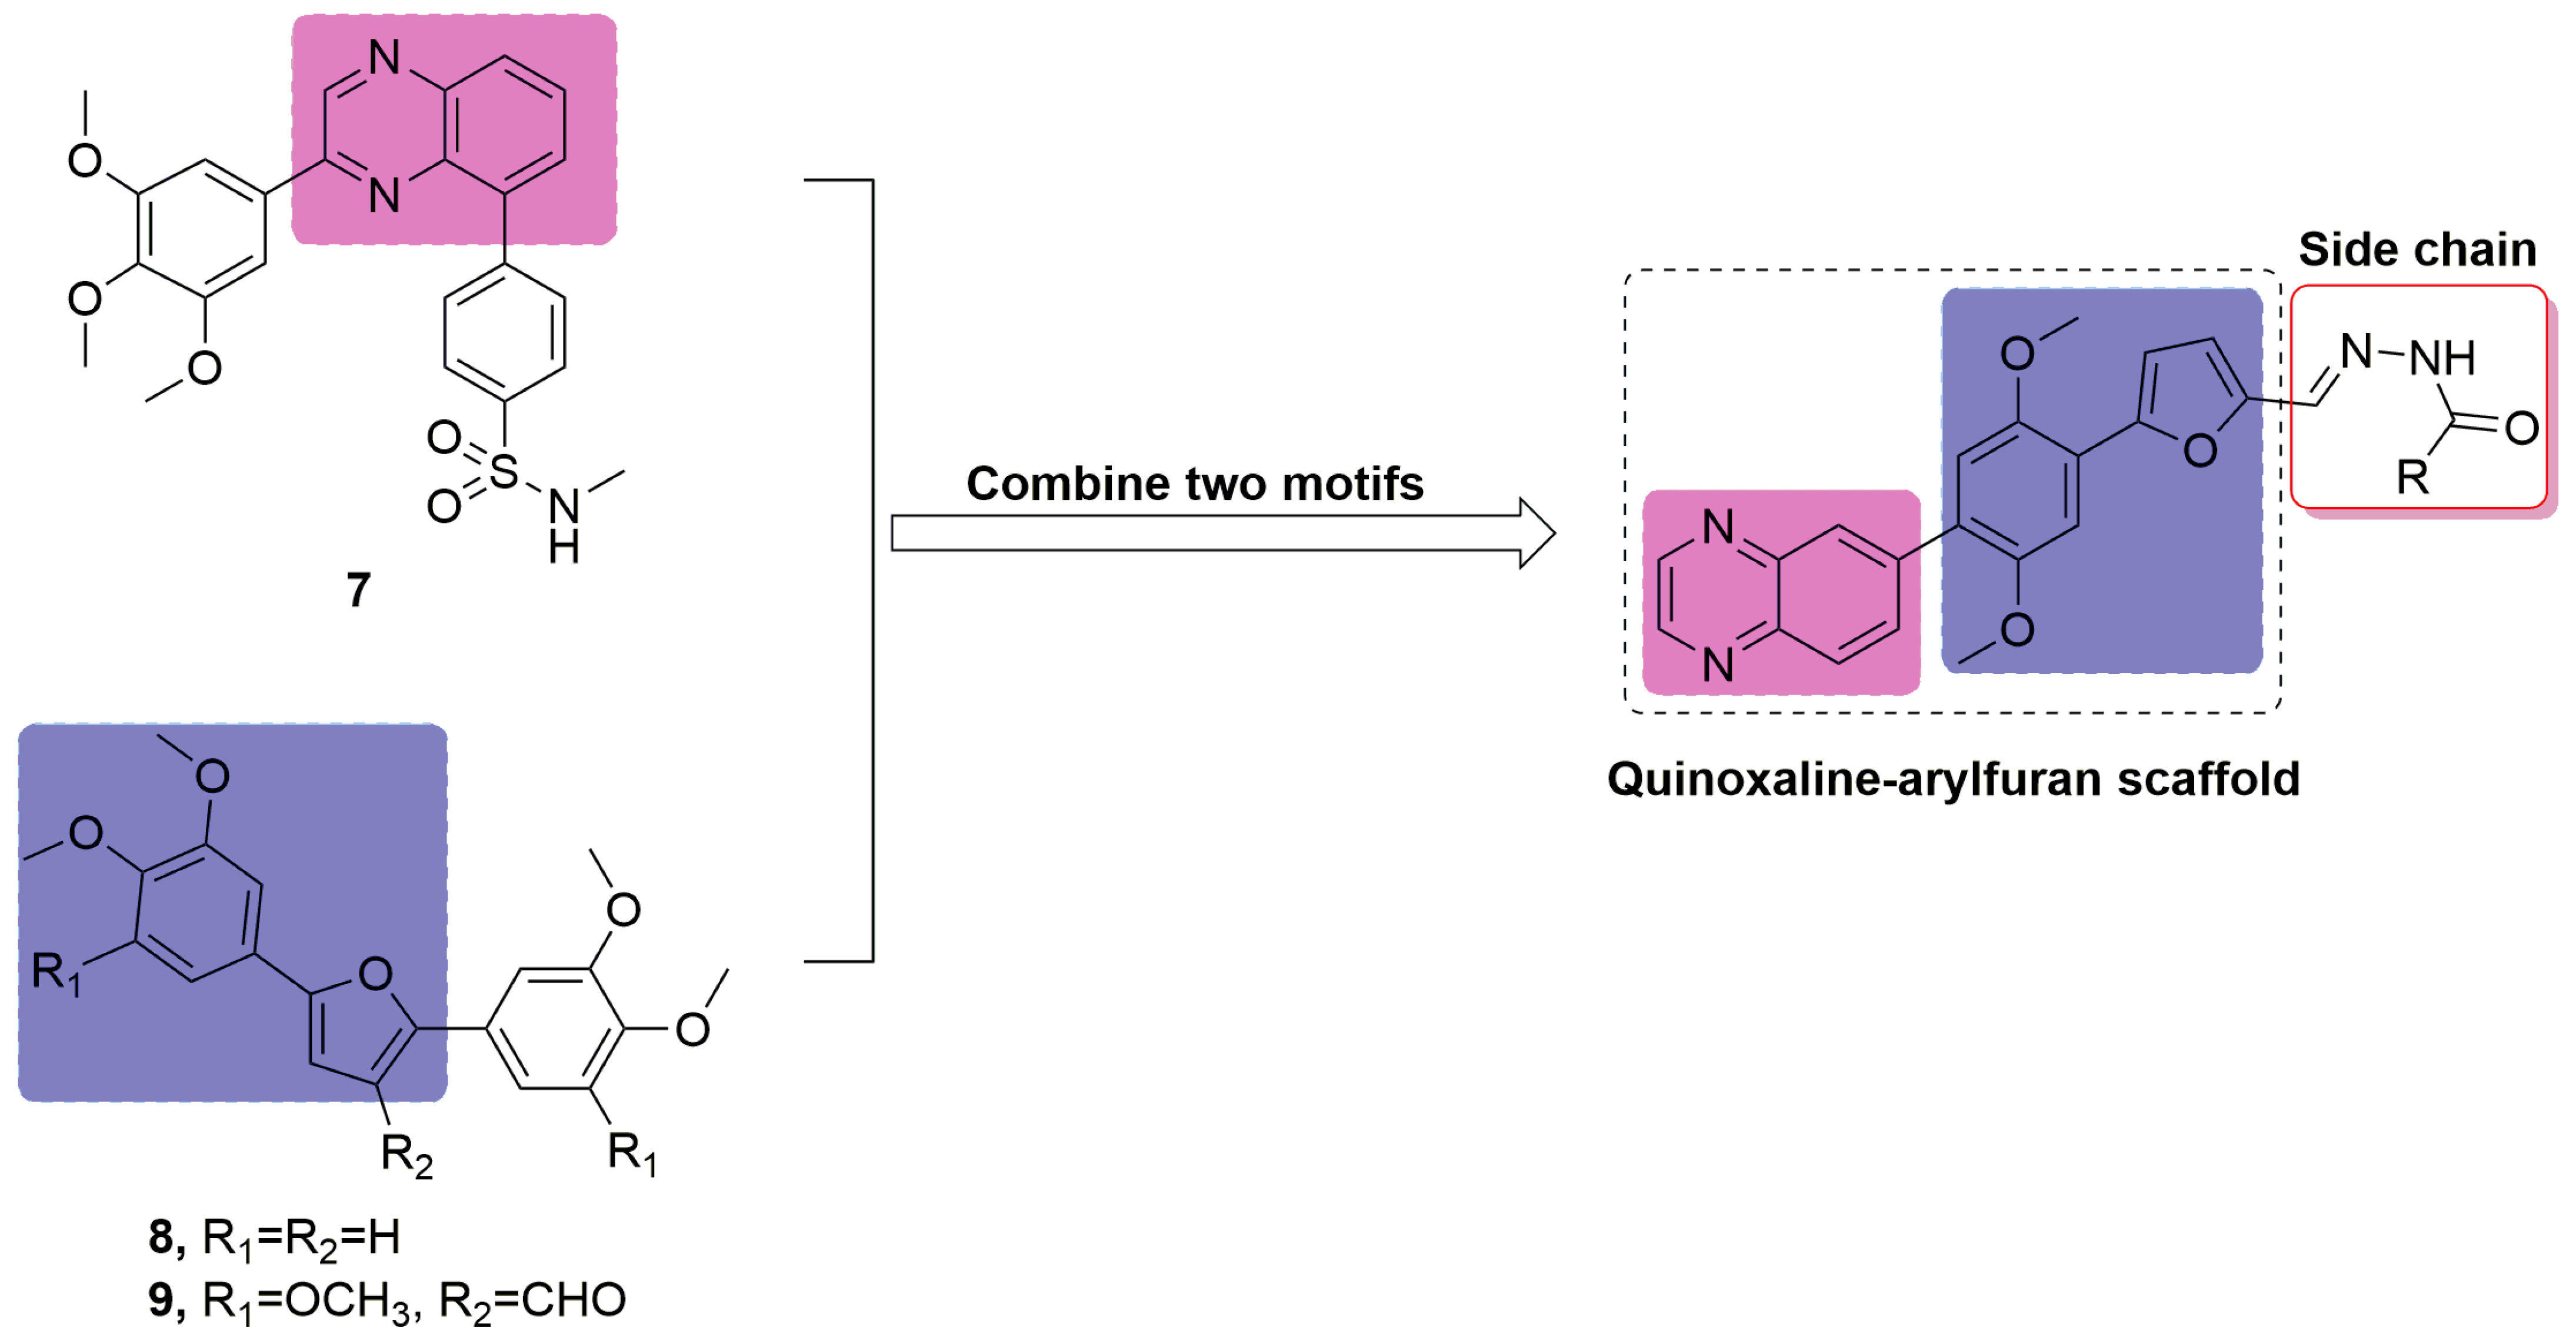
:1. Introduction
2. Materials and Methods
2.1. Synthetic Procedures and Analytical Data
2.2. Cell Culture
2.3. CCK-8 Assay
2.4. Hoechst-33342 Staining
2.5. Immunoblotting
2.6. Flow Cytometry Assay
2.7. Wound Healing Assay
2.8. Colony Formation Assay
2.9. Biolayer Interferometry (BLI) Assay
2.10. Molecular Docking
3. Results and Discussion
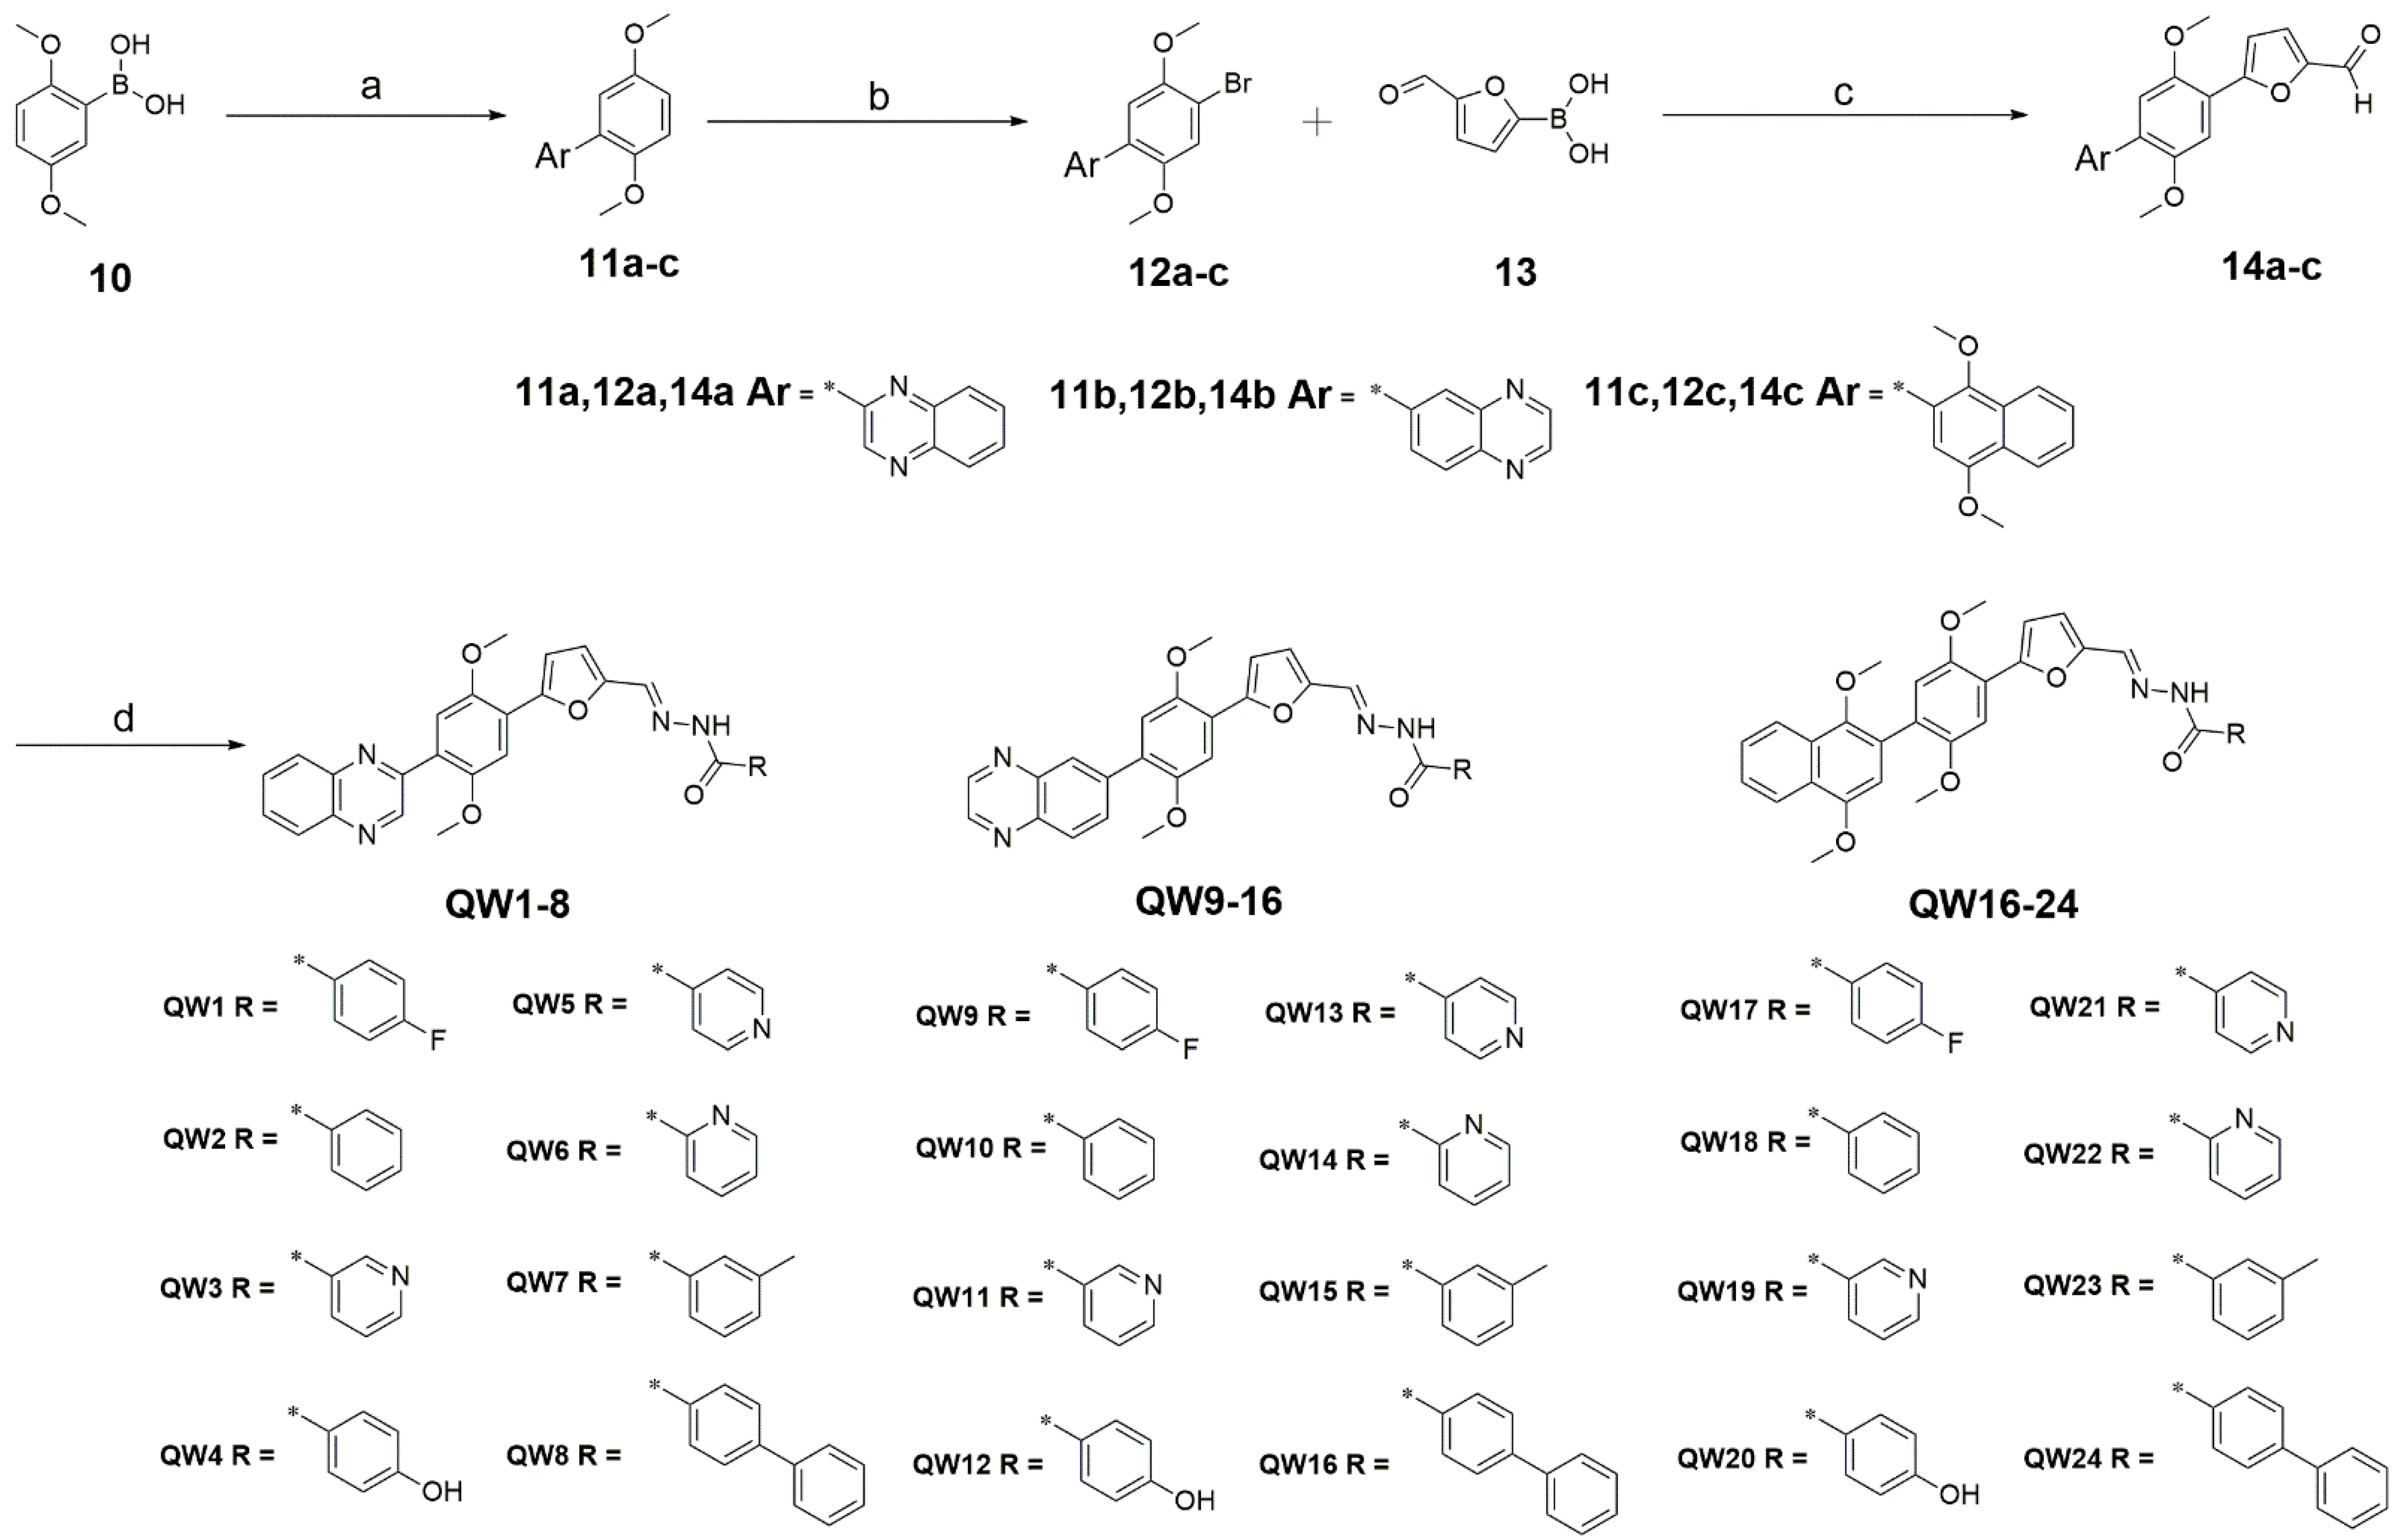
3.1. Synthesis
3.2. Biological Evaluation
3.2.1. Evaluation of In Vitro Antitumor Activity
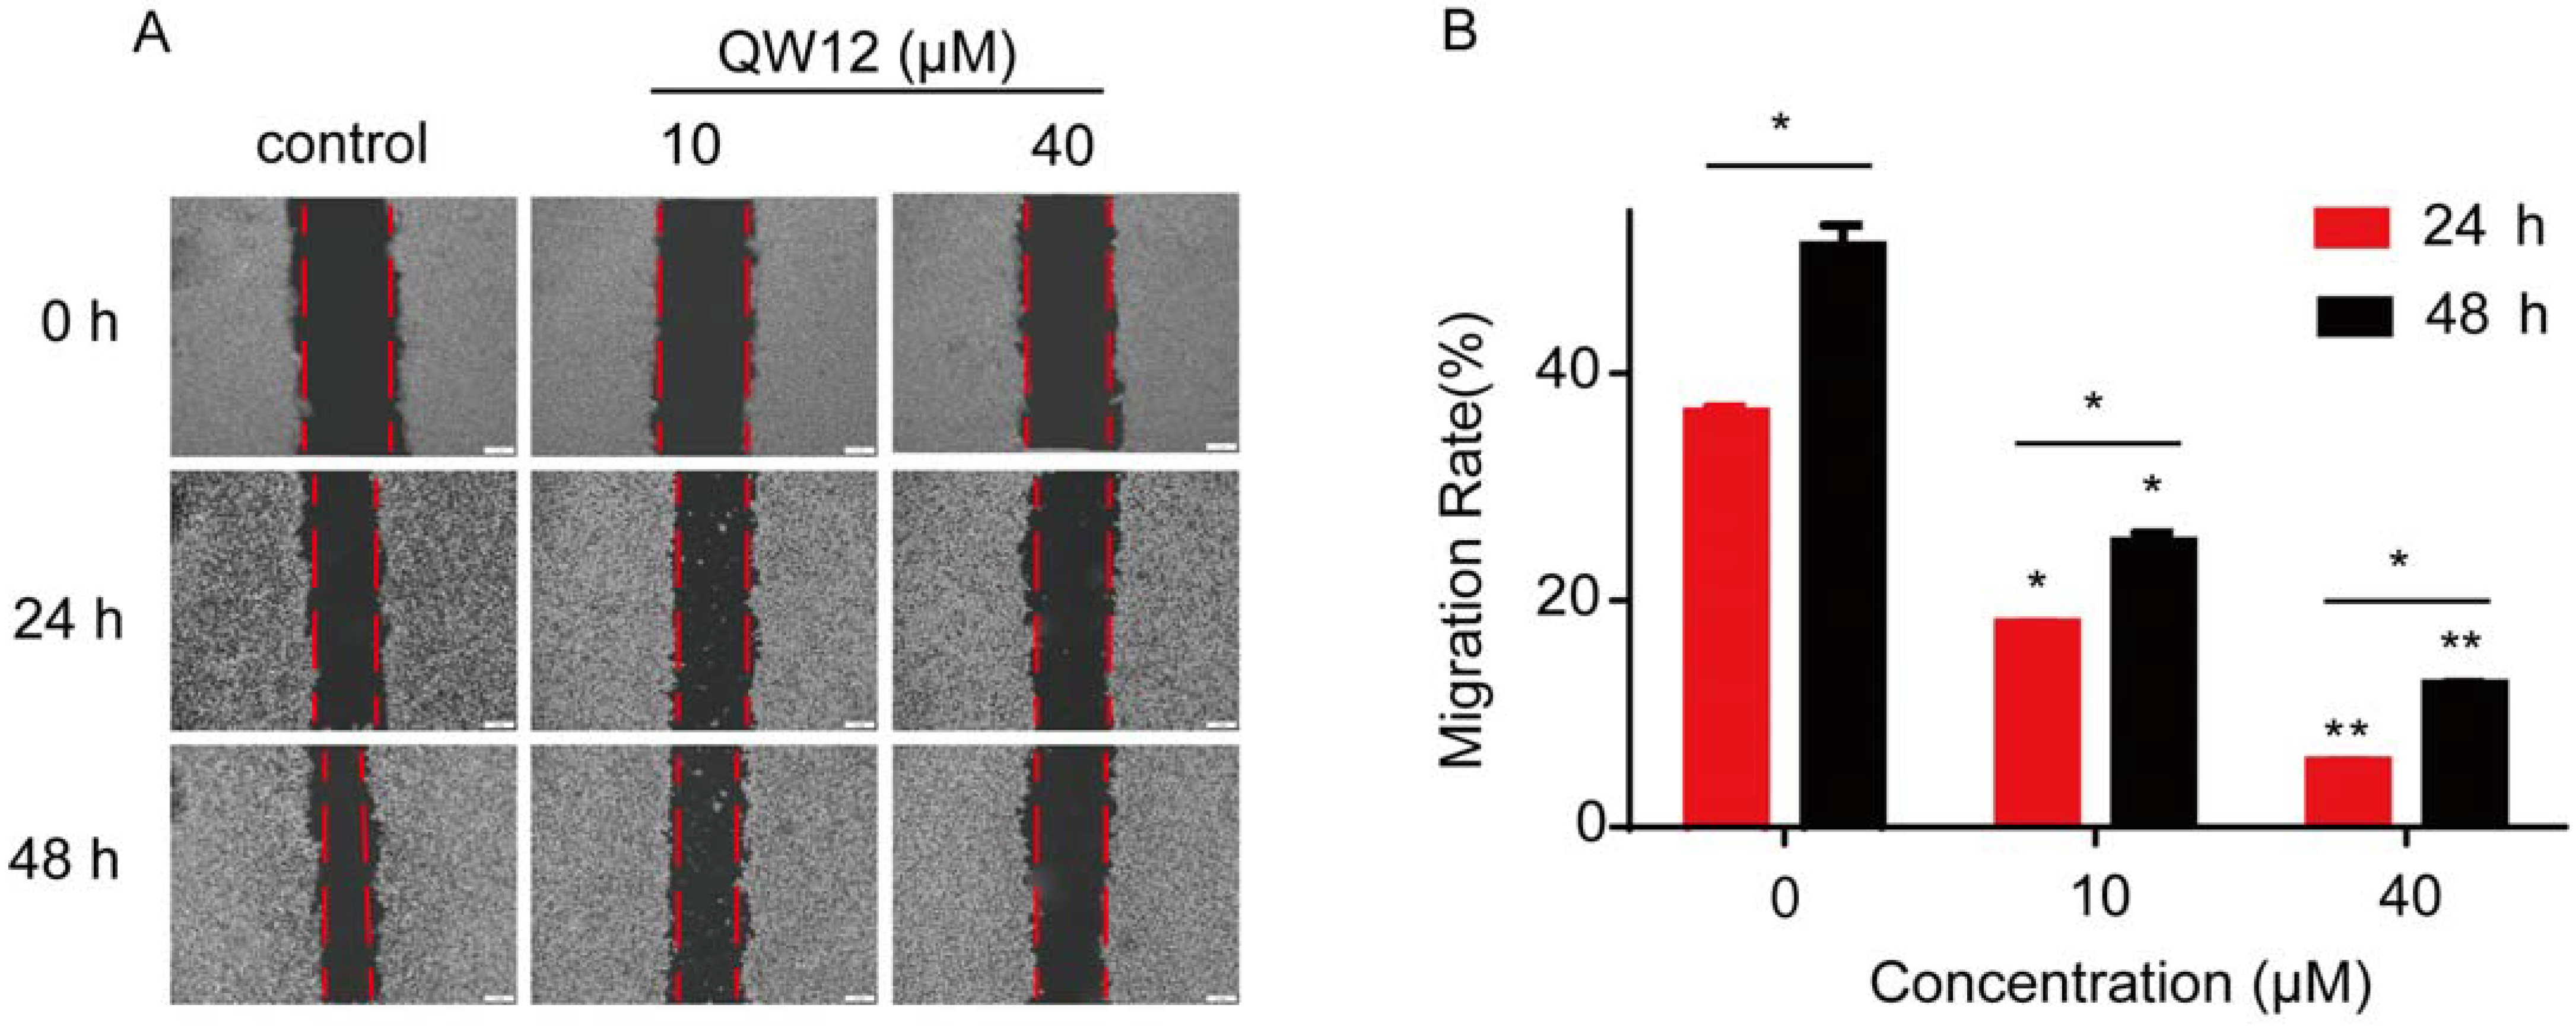
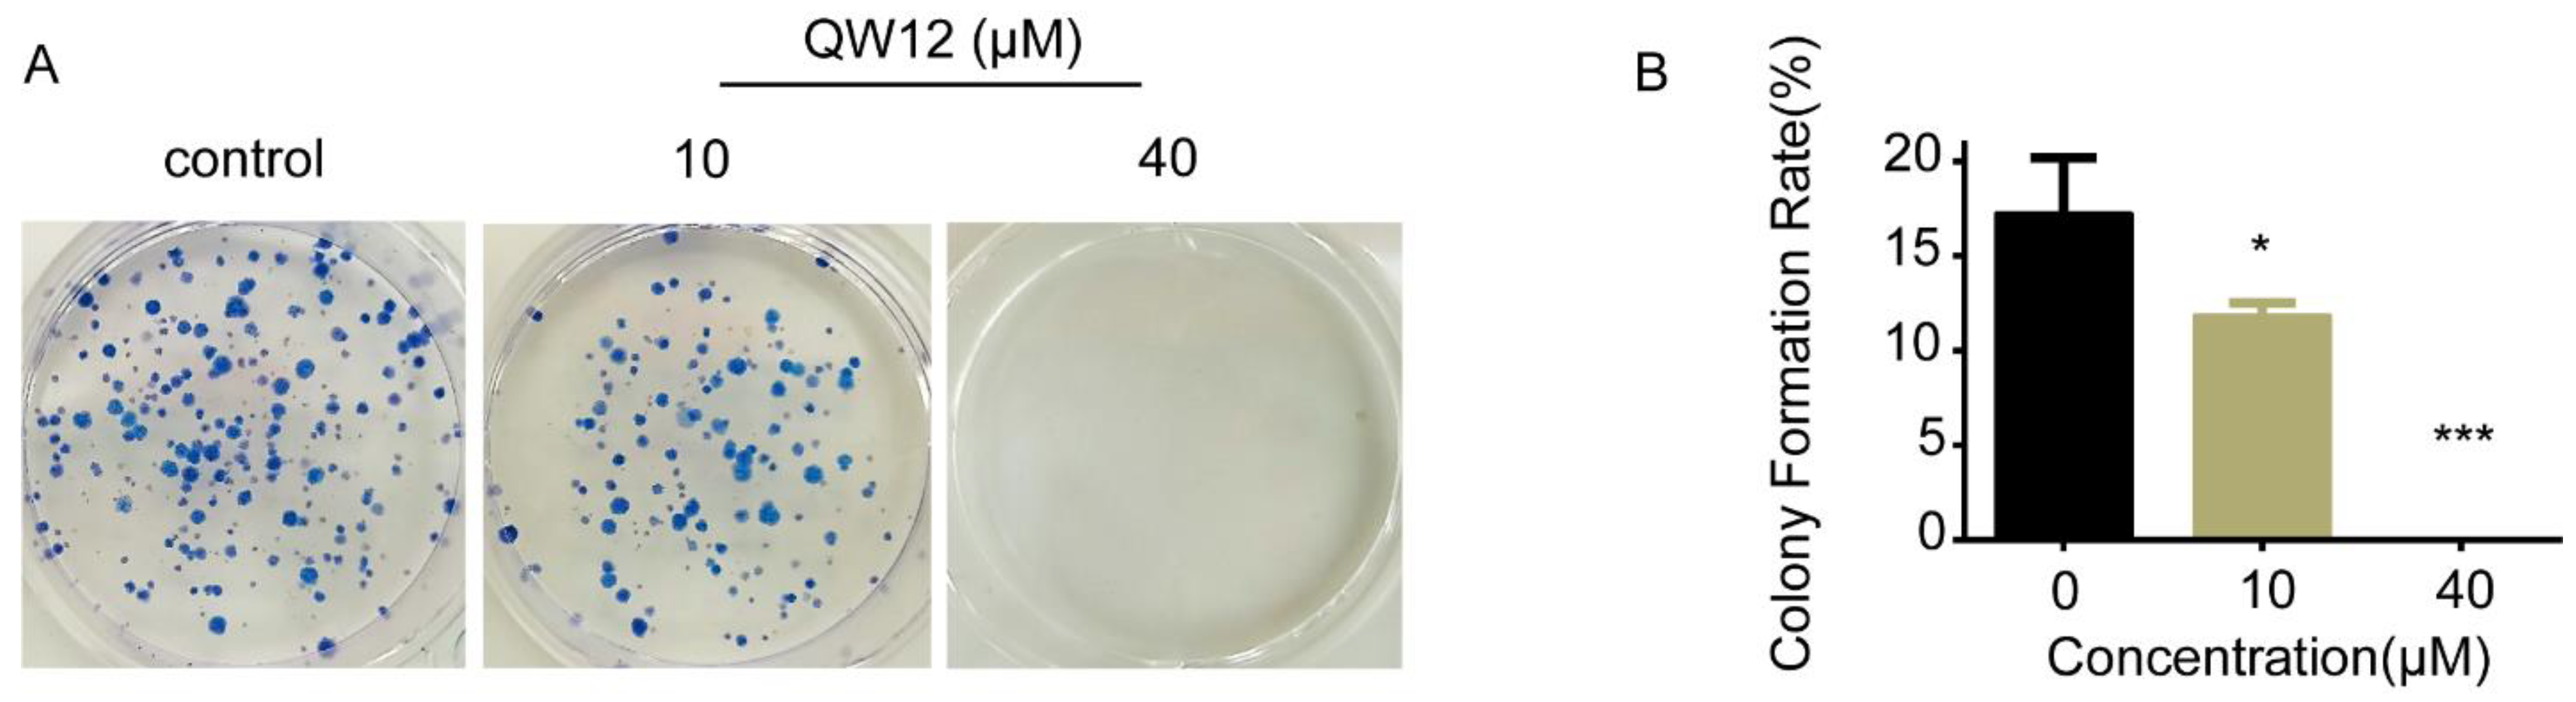
3.2.2. QW12 Inhibits the Proliferation and Migration of HeLa Cells
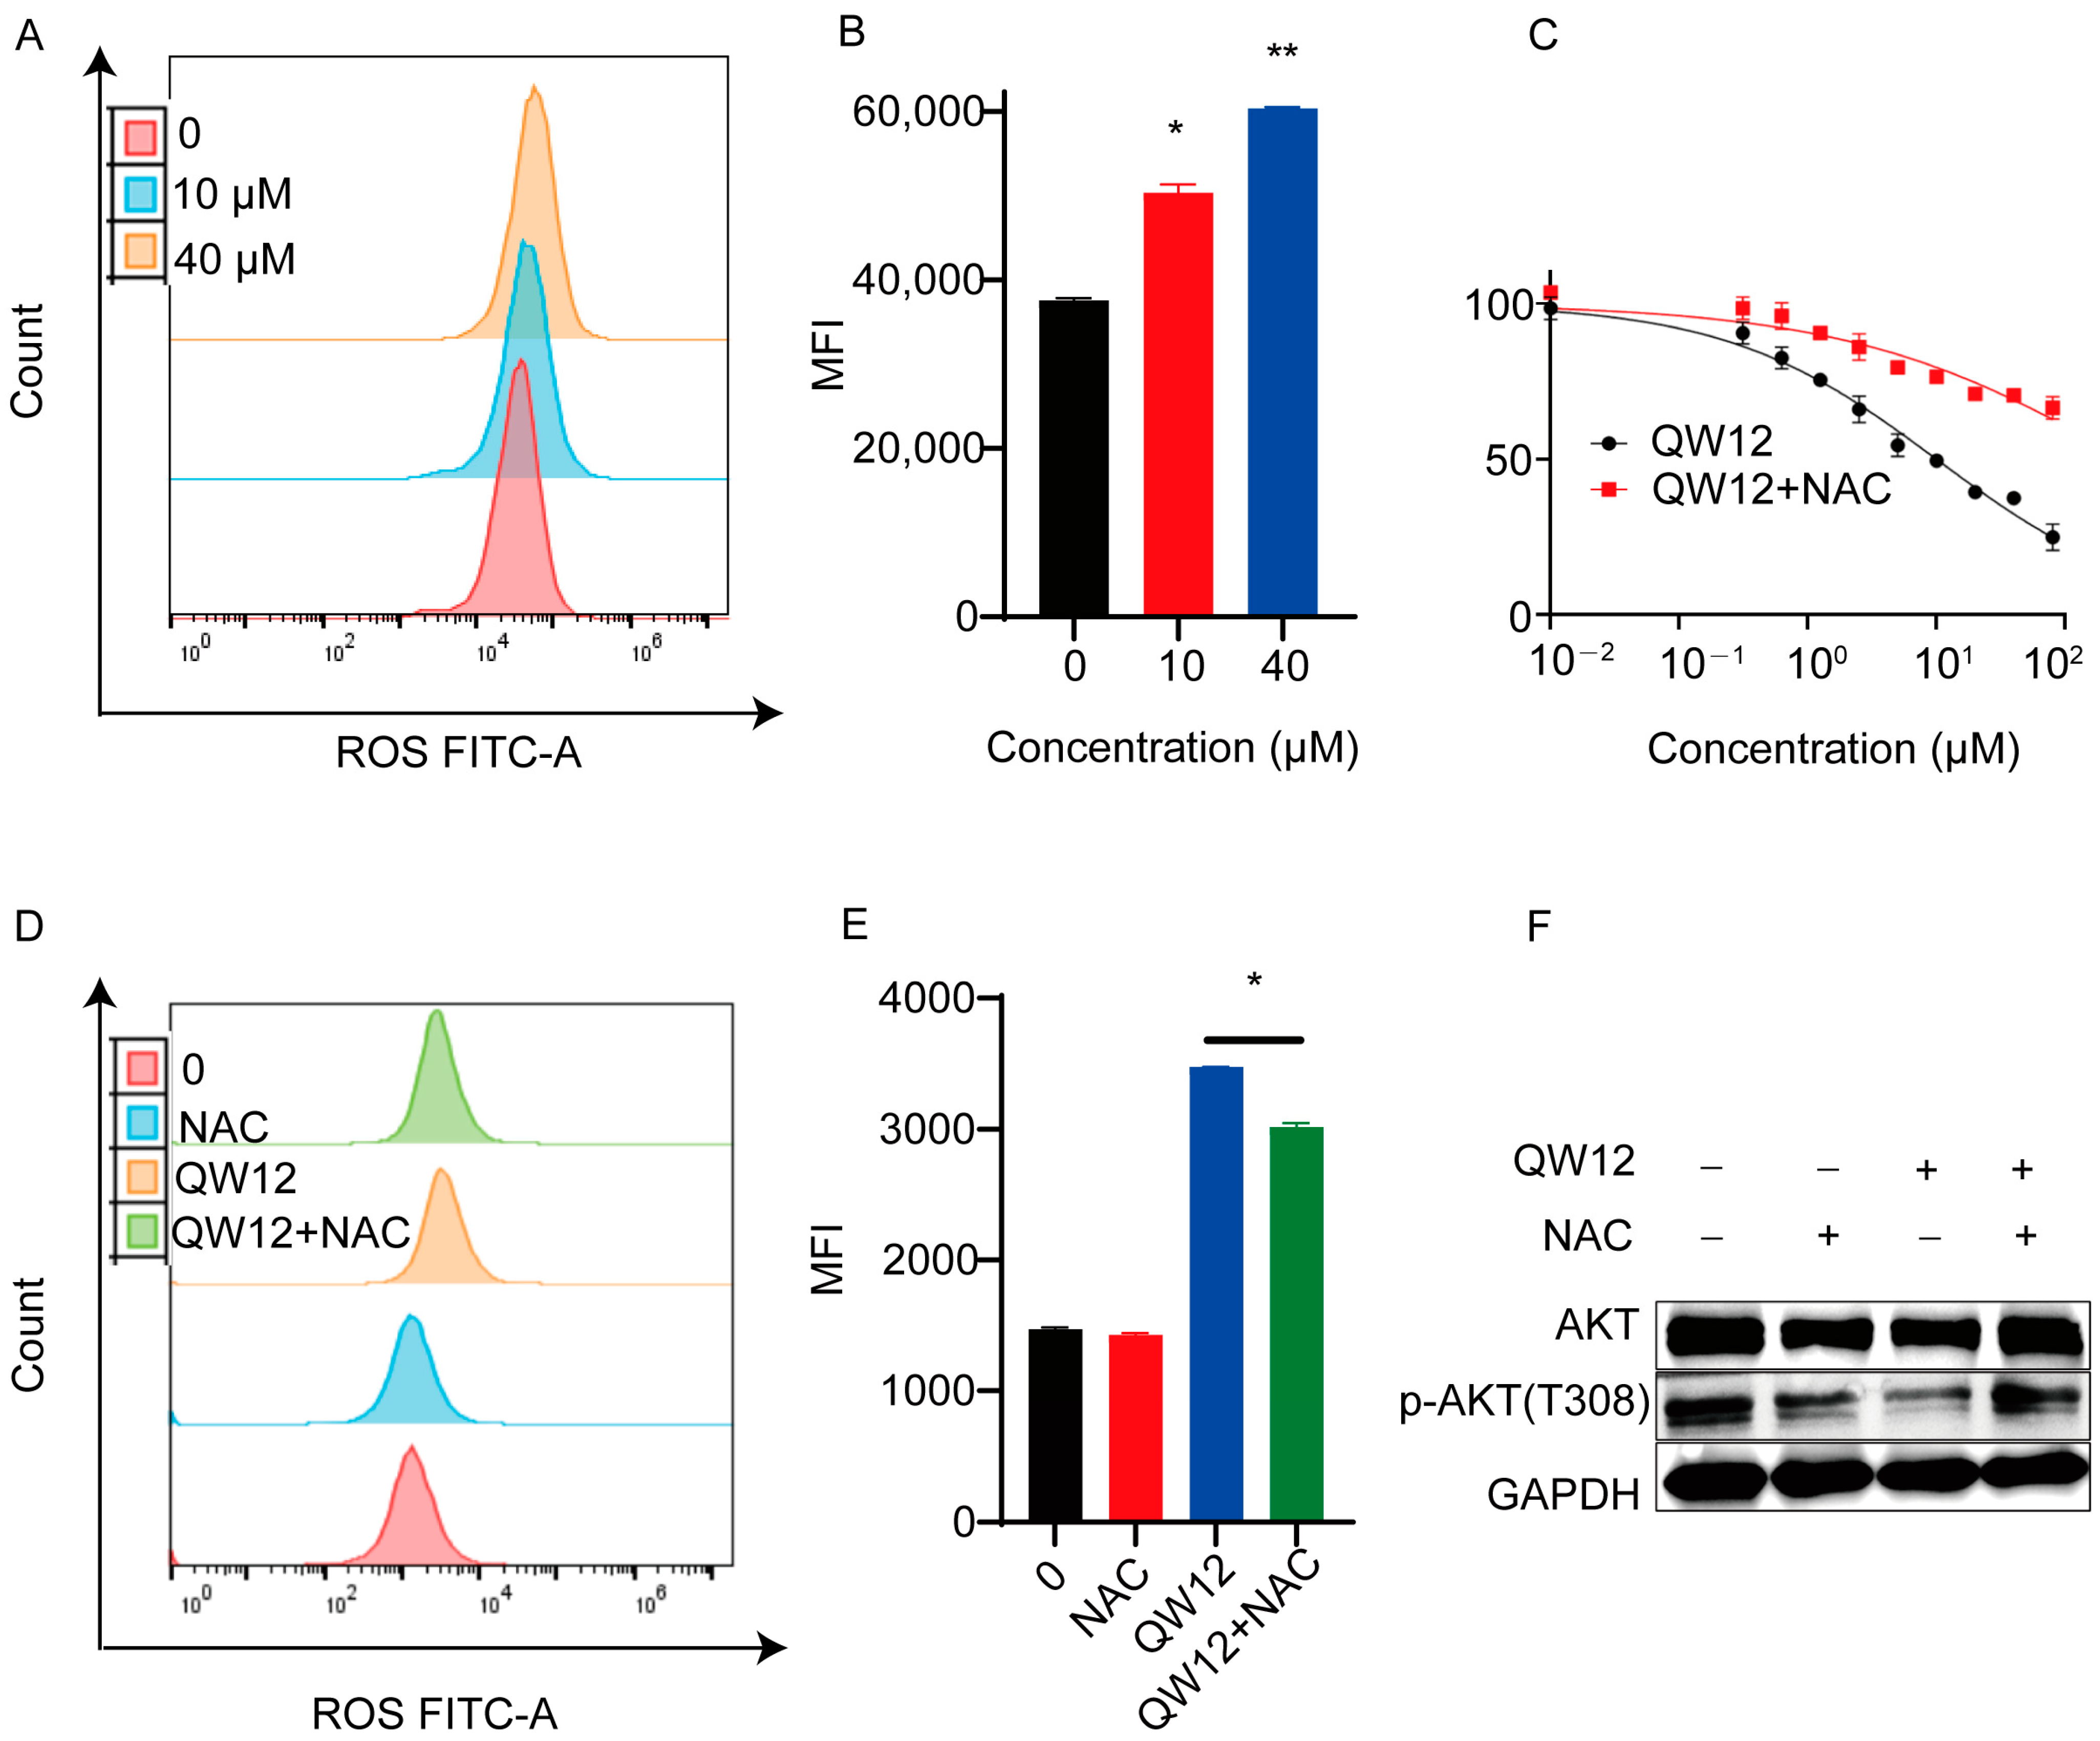
3.2.3. QW12 Induces Intracellular ROS Production
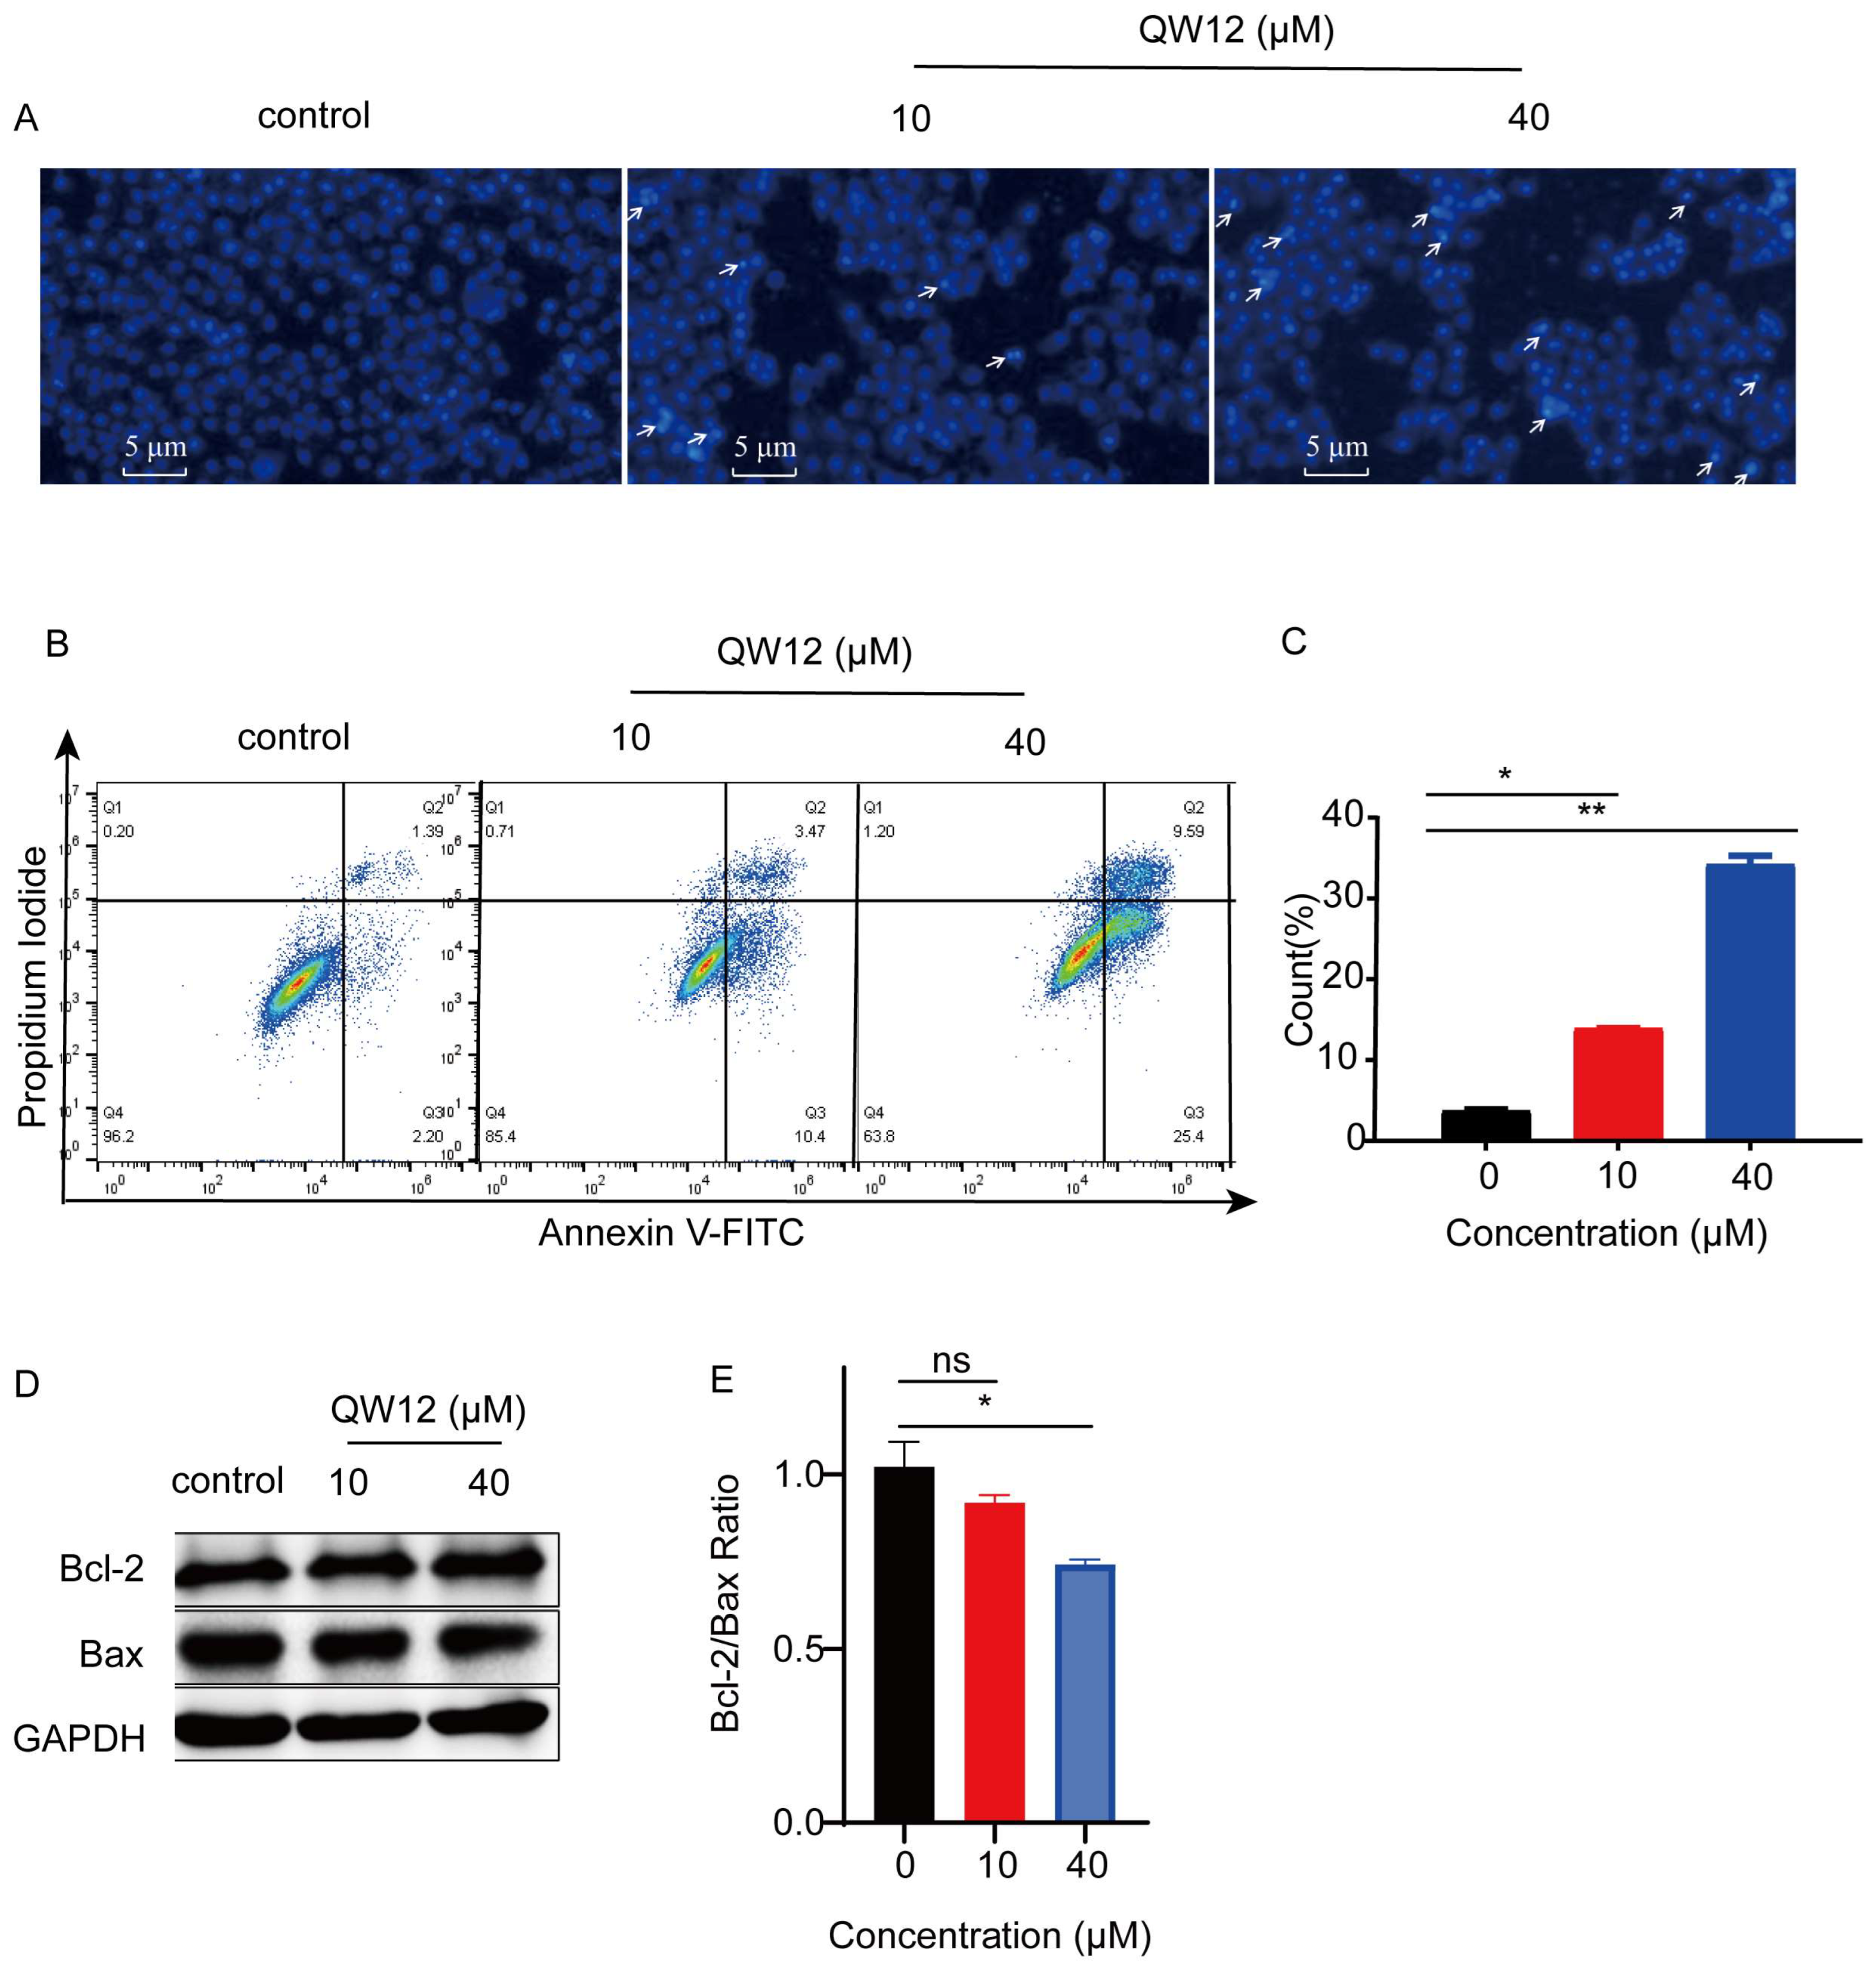
3.2.4. QW12 Induces the Apoptosis of HeLa Cells
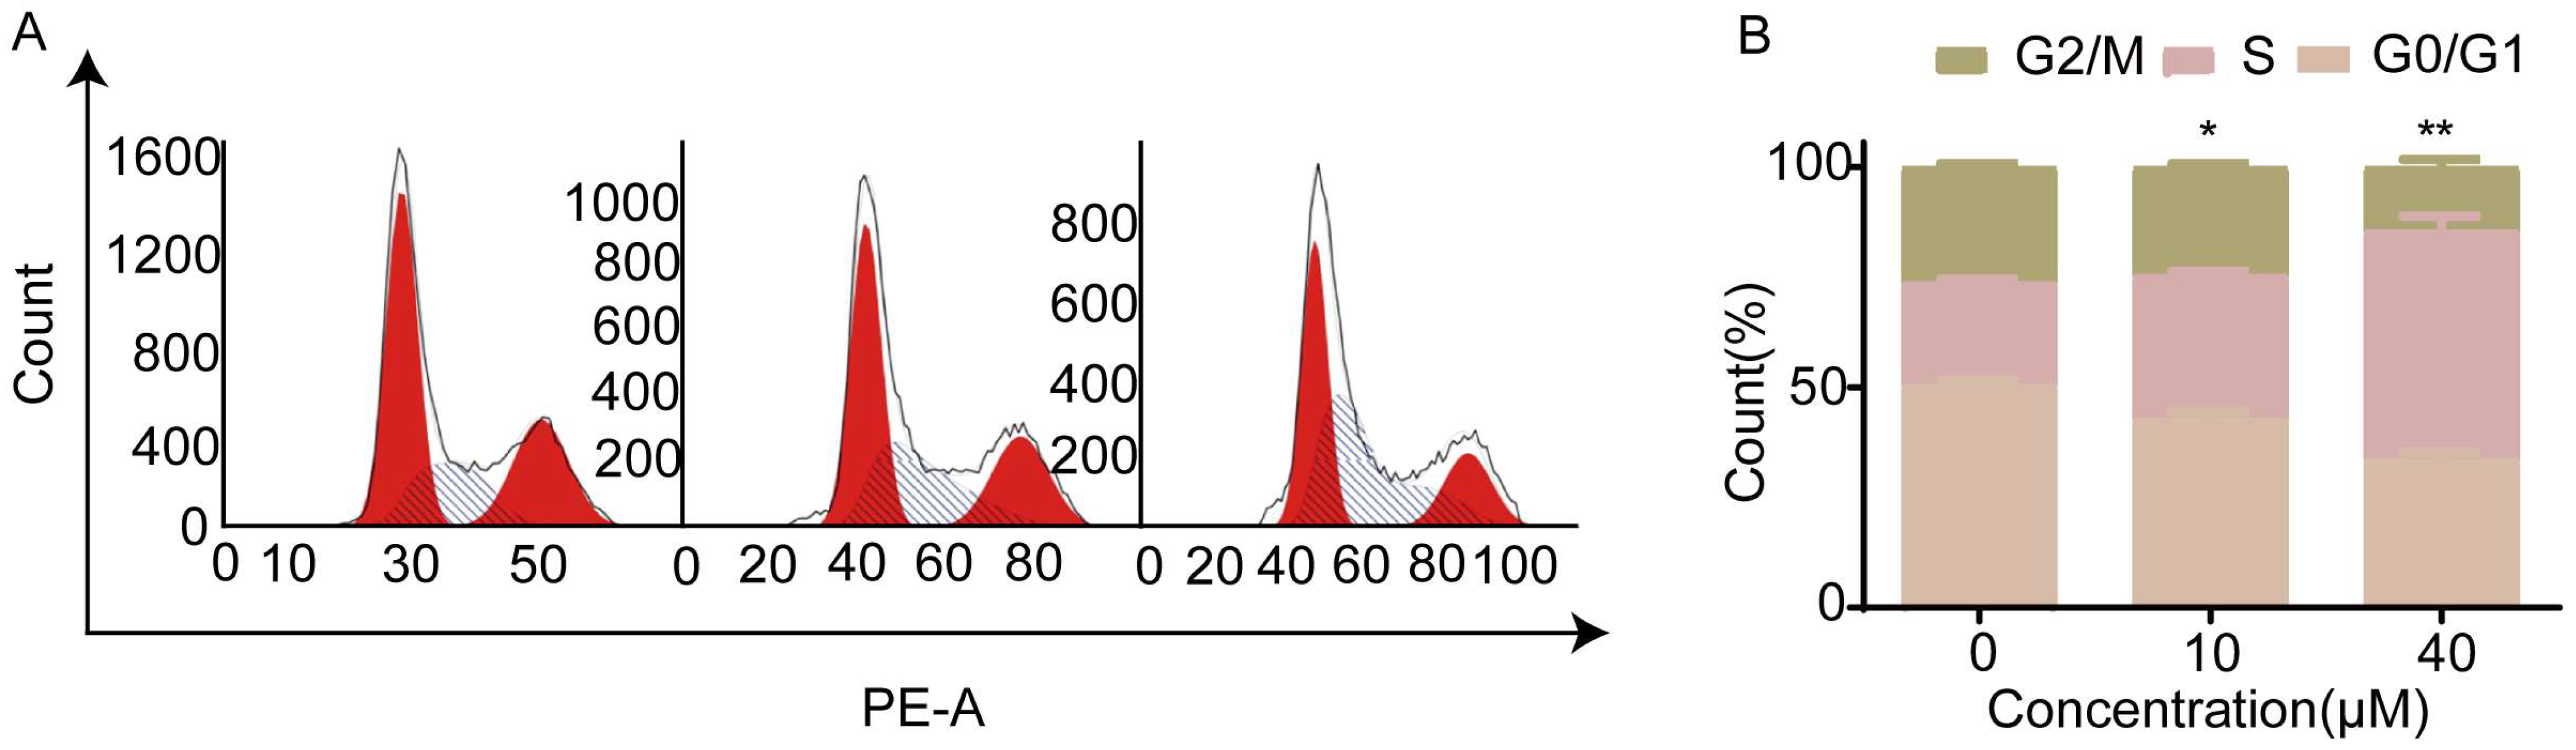
3.2.5. QW12 Blocks HeLa Cells in Phase S
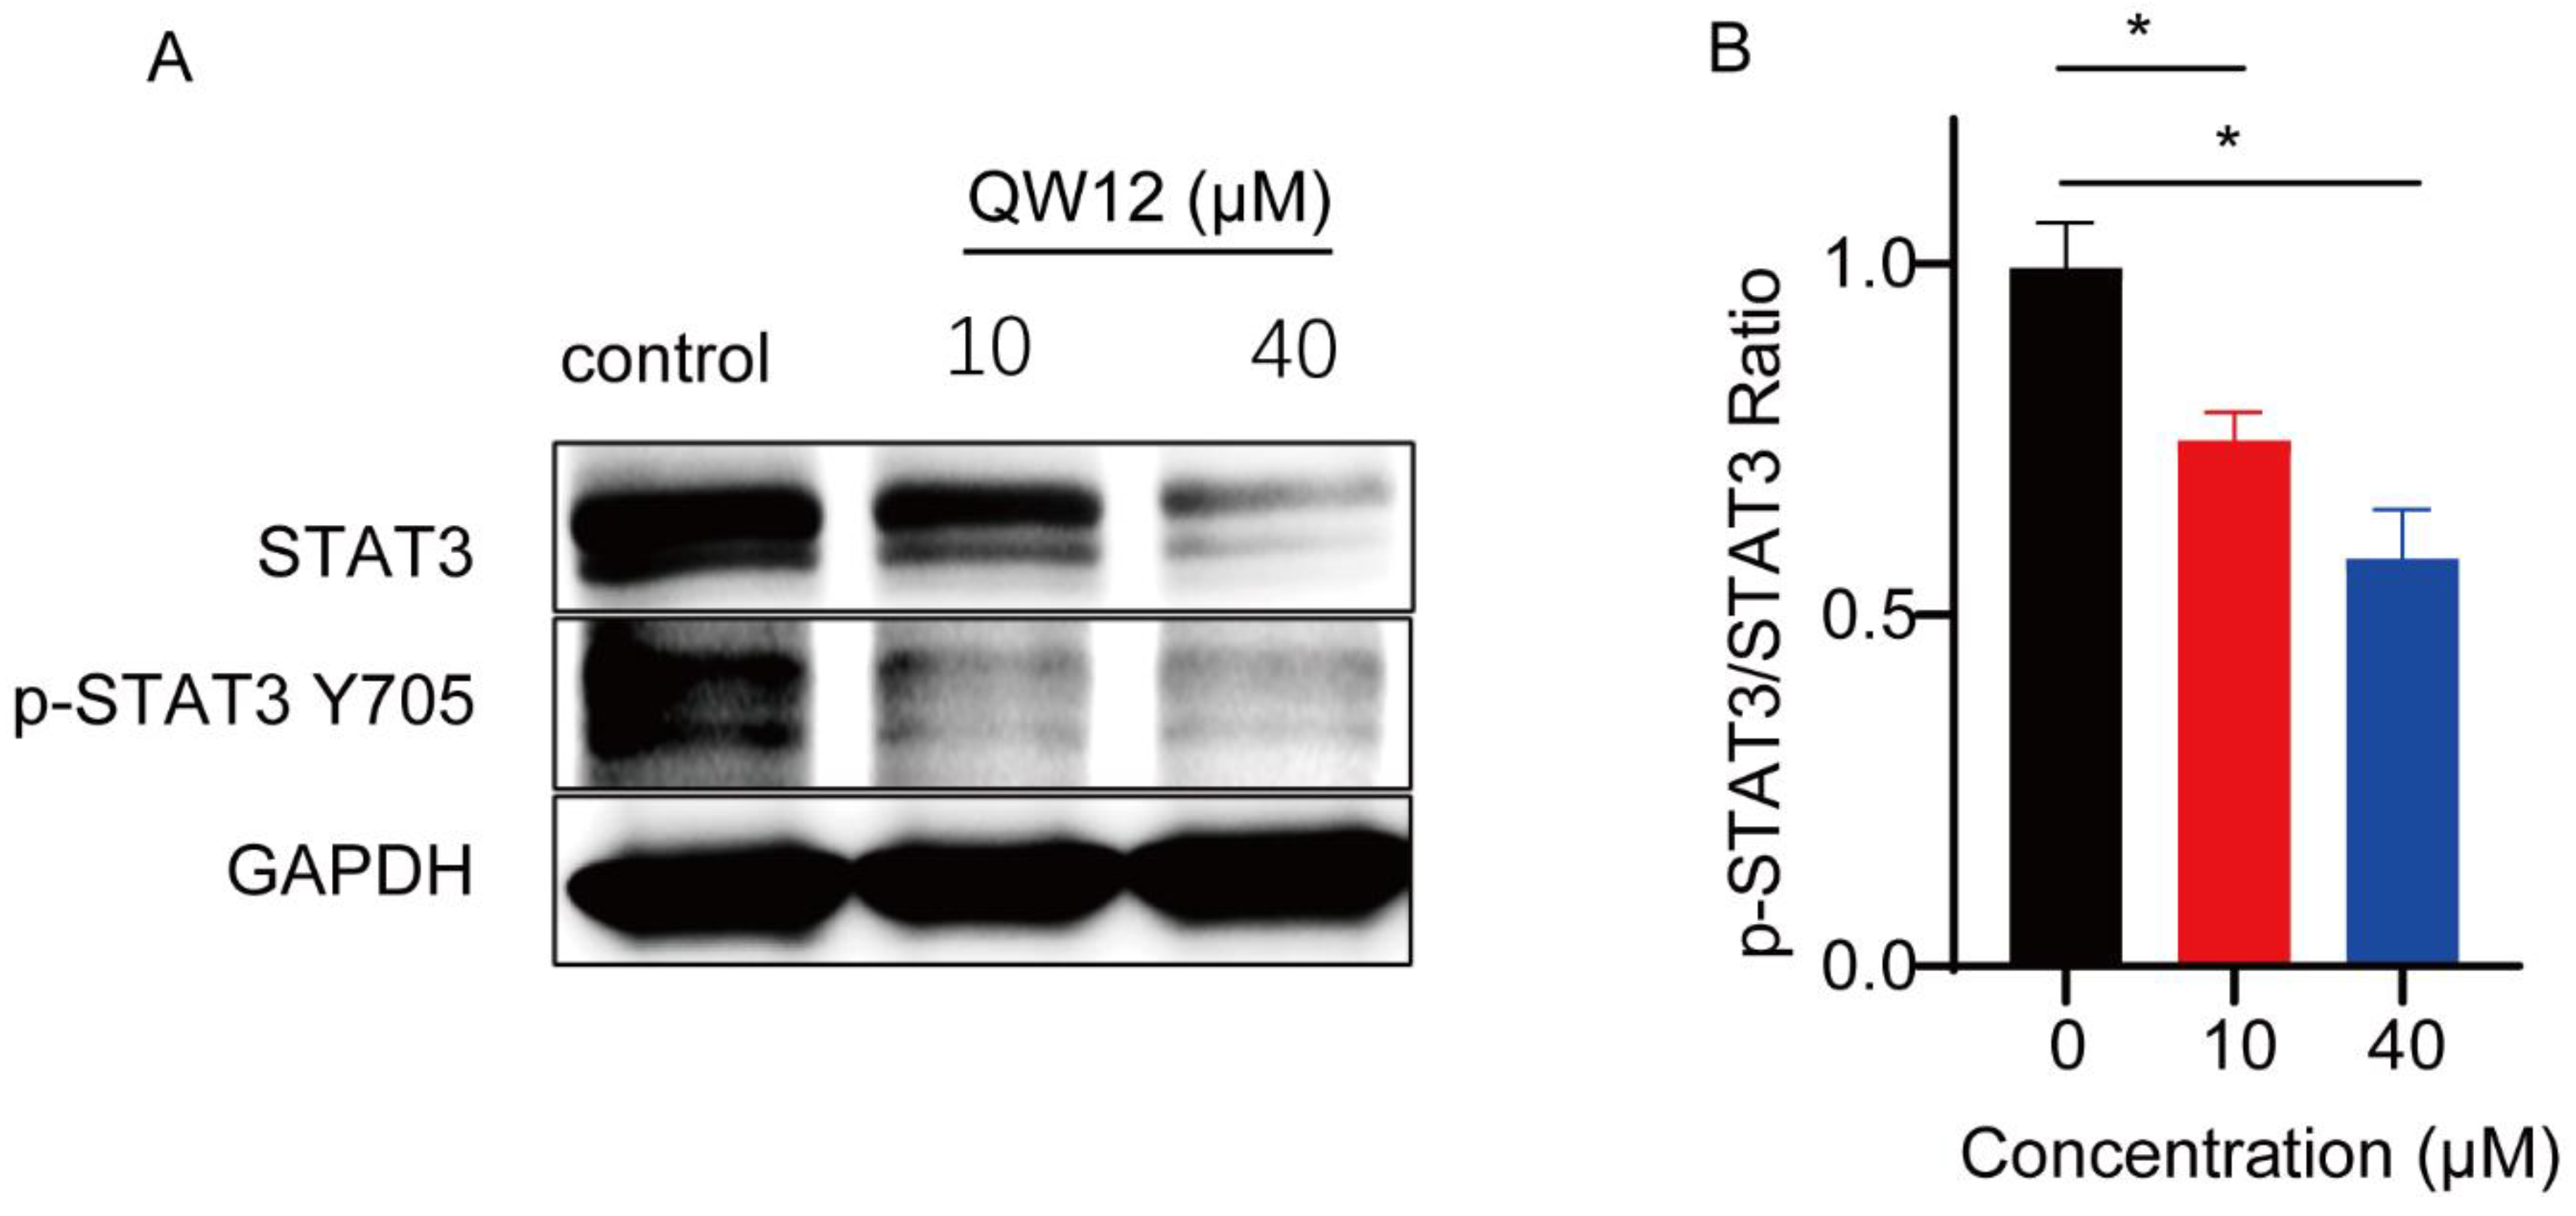
3.2.6. QW12 Inhibits STAT3 Y705 Phosphorylation in Cell-Based Assays
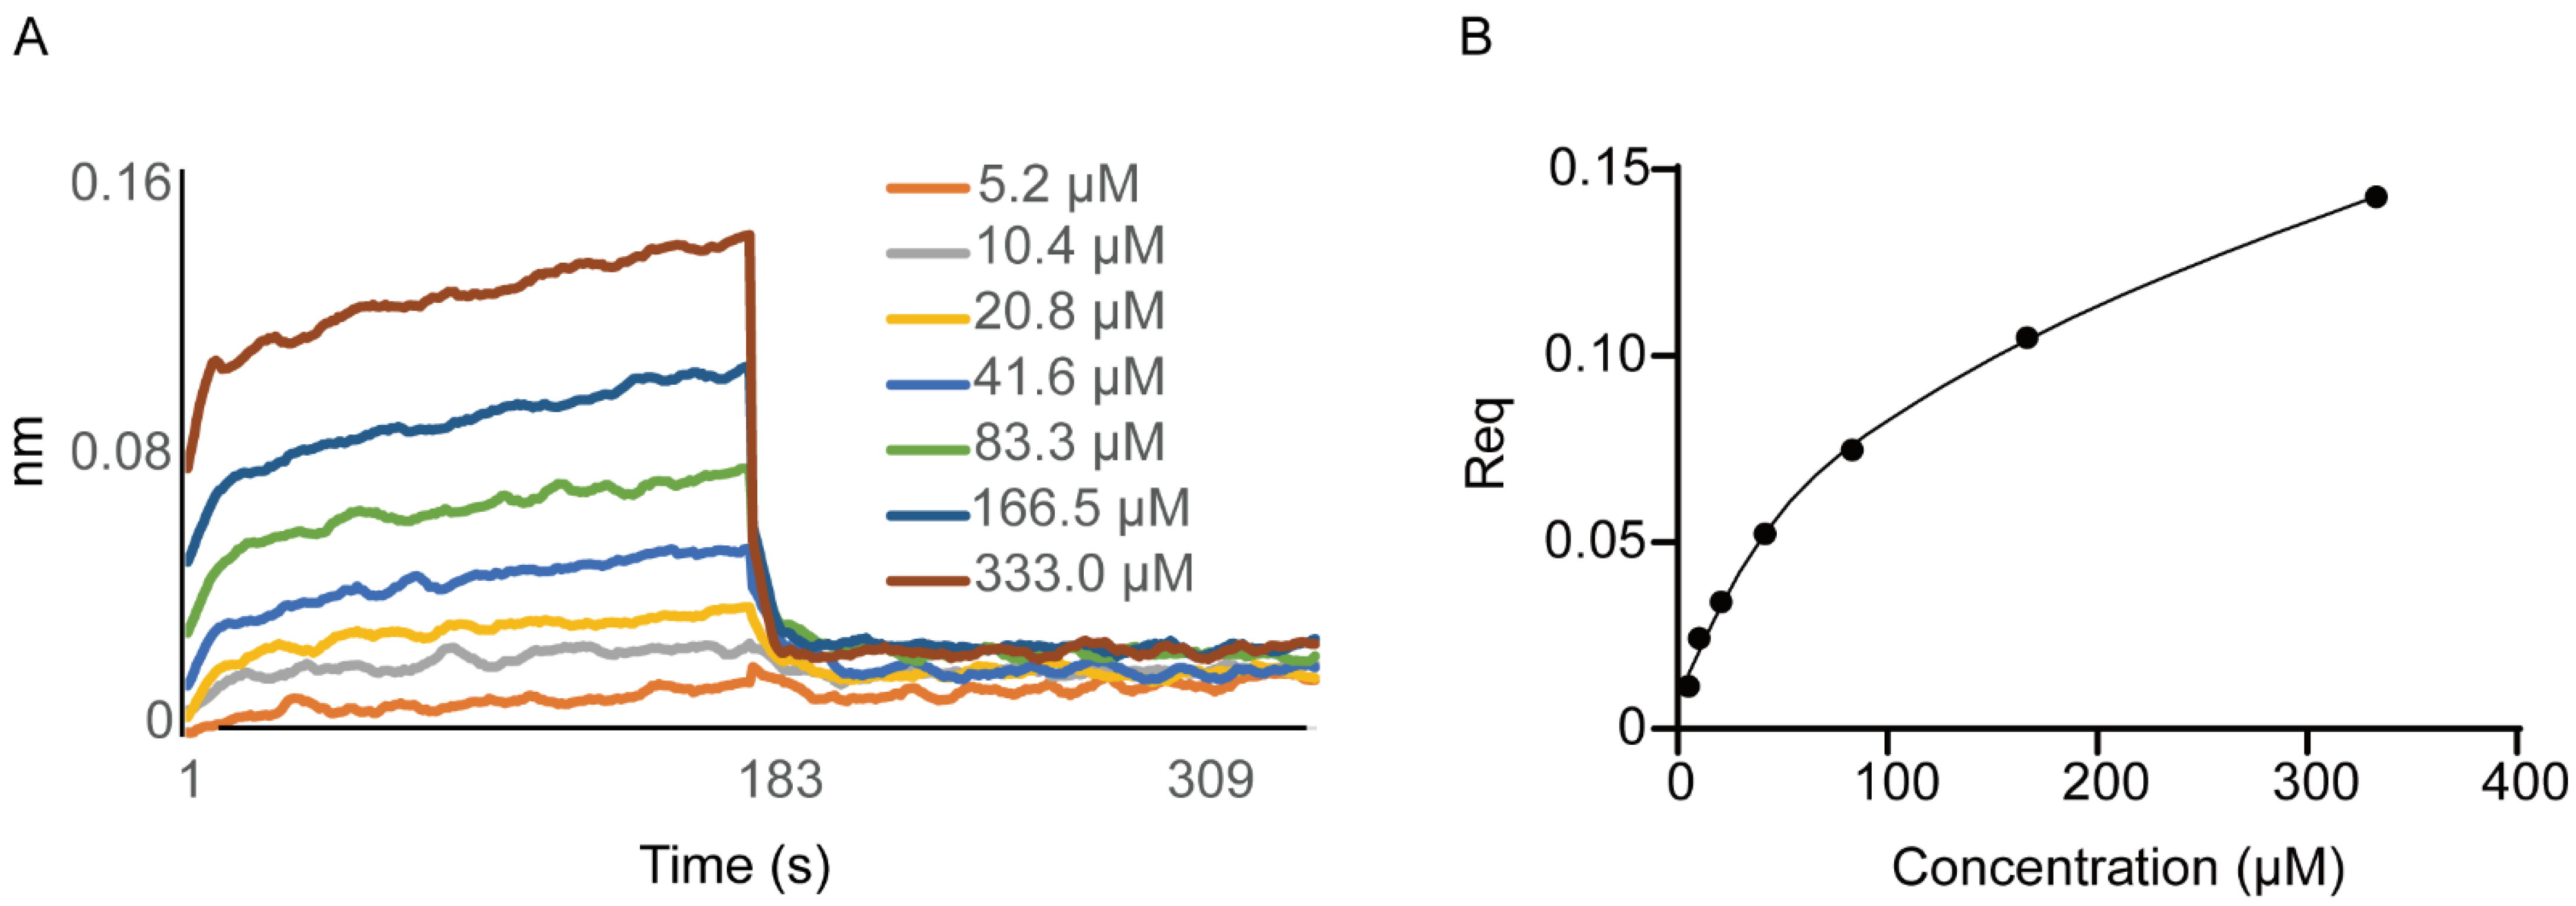
3.2.7. Kinetic Affinity of QW12 versus STAT3
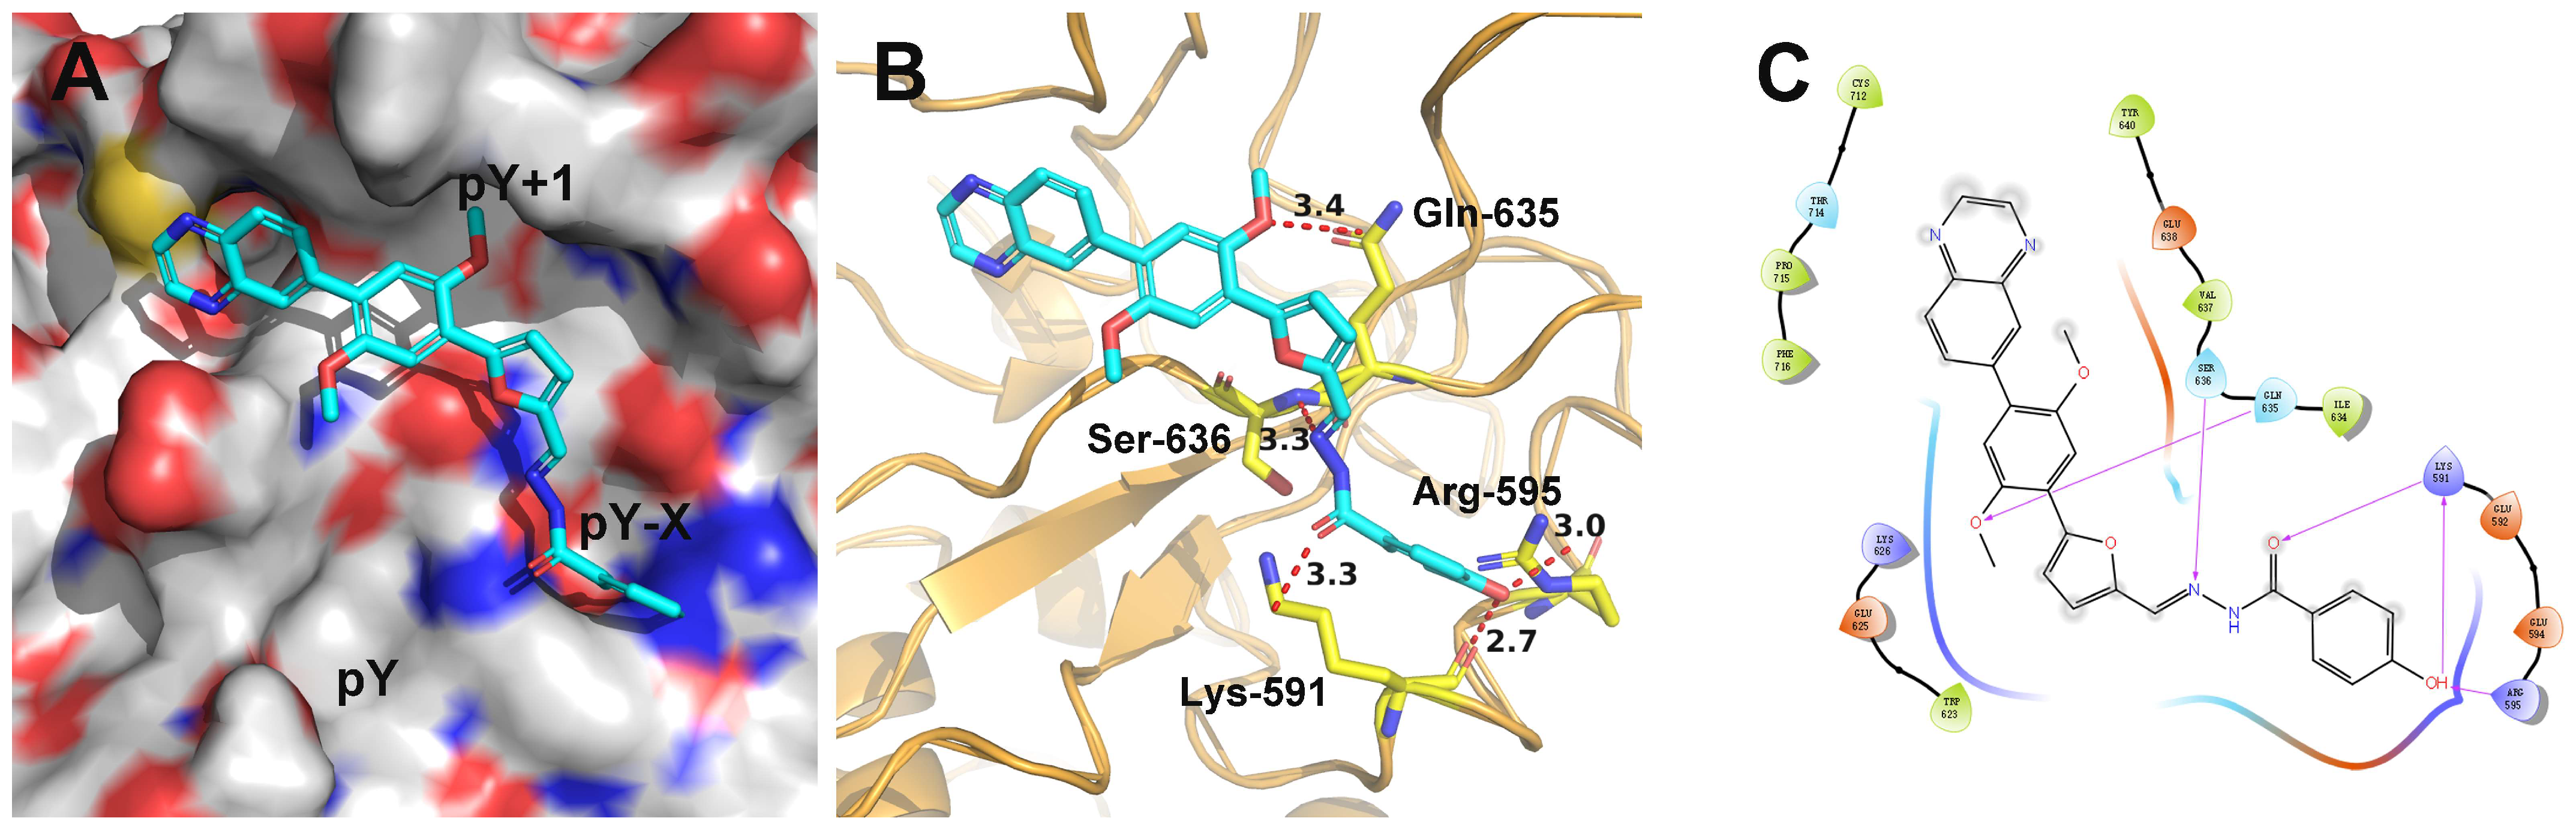
3.3. Compound QW12 Docking Study with the STAT3 SH2 Domain
4. Conclusions
Author Contributions
Funding
Institutional Review Board Statement
Informed Consent Statement
Data Availability Statement
Acknowledgments
Conflicts of Interest
Appendix A
Appendix A.1. General Procedure for the Preparation of Compounds 11a–c
Appendix A.2. General Procedure for the Preparation of Compounds 12a–c
Appendix A.3. General Procedure for the Preparation of Compounds 14a–c
Appendix A.4. General Procedure for the Preparation of Compounds QW1–24
References
- Wild, C.P.; Weiderpass, E.; Stewart, B.W. (Eds.) World Cancer Report: Cancer Research for Cancer Prevention; International Agency for Research on Cancer: Lyon, France, 2020. [Google Scholar]
- Nikanjam, M.; Kurzrock, R.; Fountzilas, E.; Tsimberidou, A.M. Review of precision cancer medicine: Evolution of the treatment paradigm. Cancer Treat. Rev. 2020, 86, 102019. [Google Scholar]
- Eldin, R.; Al-Karmalawy, A.A.; Alotaibi, M.H.; Saleh, M.A. Quinoxaline derivatives as a promising scaffold for breast cancer treatment. New J. Chem. 2022, 46, 9975–9984. [Google Scholar] [CrossRef]
- Dewangan, D.; Nakhate, K.T.; Verma, V.S.; Nagori, K.; Badwaik, H.; Nair, N.; Tripathi, D.K.; Mishra, A. Synthesis and Molecular Docking Study of Novel Hybrids of 1,3,4-Oxadiazoles and Quinoxaline as a Potential Analgesic and Anti-Inflammatory Agents. J. Heterocycl. Chem. 2018, 55, 2901–2910. [Google Scholar] [CrossRef]
- Zhu, J.L.; Chen, W.T.; Yu, W.; Han, L.; Wu, H.K.; Liu, X.H.; Min, L.J.; Ye, P. Synthesis, Spectroscopy Properties and Antifungal Activity of New Quinoxaline Derivatives. Indian J. Heterocycl. Chem. 2021, 31, 215–221. [Google Scholar]
- Perri, M.; Aiello, F.; Cione, E.; Carullo, G.; Amendola, L.; Mazzotta, S.; Caroleo, M.C. Investigation of TNBC in vitro Antiproliferative Effects of Versatile Pirrolo[1,2-a]quinoxaline Compounds. Front. Mol. Biosci. 2019, 6, 12. [Google Scholar] [CrossRef]
- Kumar, N.; Sharma, C.S.; Pandiya, H.; Mishra, S.S. Design, Synthesis, Molecular Docking, and ADME Studies of Some New 2-Substituted 1-(6H-indolo[2,3-b]quinoxalin-6-yl)ethan-1-ones as Antitubercular Agents. Indian J. Heterocycl. Chem. 2020, 30, 473–481. [Google Scholar]
- Montana, M.; Mathias, F.; Terme, T.; Vanelle, P. Antitumoral activity of quinoxaline derivatives: A systematic review. Eur. J. Med. Chem. 2019, 163, 136–147. [Google Scholar] [CrossRef]
- do Amaral, D.N.; Lategahn, J.; Fokoue, H.H.; da Silva, E.M.B.; Sant’Anna, C.M.R.; Rauh, D.; Barreiro, E.J.; Laufer, S.; Lima, L.M. A novel scaffold for EGFR inhibition: Introducing N-(3-(3-phenylureido)quinoxalin-6-yl) acrylamide derivatives. Sci. Rep. 2019, 9, 14. [Google Scholar] [CrossRef] [Green Version]
- Tseng, C.H.; Chen, Y.R.; Tzeng, C.C.; Liu, W.; Chou, C.K.; Chiu, C.C.; Chen, Y.L. Discovery of indeno[1,2-b]quinoxaline derivatives as potential anticancer agents. Eur. J. Med. Chem. 2016, 108, 258–273. [Google Scholar] [CrossRef]
- Alcolea, V.; Karelia, D.N.; Pandey, M.K.; Plano, D.; Singh, P.; Palop, J.A.; Amin, S.; Sanmartin, C.; Sharma, A.K. Identification of a Novel Quinoxaline-Isoselenourea Targeting the STAT3 Pathway as a Potential Melanoma Therapeutic. Int. J. Mol. Sci. 2019, 20, 521. [Google Scholar] [CrossRef] [Green Version]
- Burger, R.; Rademacher, F.; Staudinger, M.; Peipp, M.; Güunther, A.; Gramatzki, M. The Novel JAK2 Inhibitor NVP-BSK805 Has Cytotoxic Activity on Malignant Plasma Cells. Blood 2010, 116, 2993. [Google Scholar] [CrossRef]
- Pissot-Soldermann, C.; Gerspacher, M.; Furet, P.; Gaul, C.; Holzer, P.; McCarthy, C.; Radimerski, T.; Regnier, C.H.; Baffert, F.; Drueckes, P.; et al. Discovery and SAR of potent, orally available 2,8-diaryl-quinoxalines as a new class of JAK2 inhibitors. Bioorg. Med. Chem. Lett. 2010, 20, 2609–2613. [Google Scholar] [CrossRef] [PubMed]
- Nelson, E.A.; Hideshima, T.; Gashin, L.; Walker, S.R.; Lynch, R.A.; Chauhan, D.; Anderson, K.C.; Frank, D.A. Nifuroxazide Inhibits STAT3 Function and Shows Potent Anti-Tumor Activity Against Multiple Myeloma. Blood 2006, 108, 3450. [Google Scholar] [CrossRef]
- Zhu, Y.; Ye, T.; Yu, X.; Lei, Q.; Yang, F.; Xia, Y.; Song, X.; Liu, L.; Deng, H.; Gao, T.; et al. Nifuroxazide exerts potent anti-tumor and anti-metastasis activity in melanoma. Sci. Rep. 2016, 6, 20253. [Google Scholar] [CrossRef] [Green Version]
- Nelson, E.; Walker, S.; Kepich, A.; Gashin, L.; Hideshima, T.; Ikeda, H.; Chauhan, D.; Anderson, K.; Frank, D. Nifuroxazide inhibits survival of multiple myeloma cells by directly inhibiting STAT3. Blood 2008, 112, 5095–5102. [Google Scholar] [CrossRef] [PubMed] [Green Version]
- de Oliveira, R.B.; de Souza-Fagundes, E.M.; Siqueira, H.A.; Leite, R.S.; Donnici, C.L.; Zani, C.L. Synthesis and evaluation of cytotoxic activity of arylfurans. Eur. J. Med. Chem. 2006, 41, 756–760. [Google Scholar] [CrossRef]
- Niu, T.; Wang, P.; Li, C.; Dou, T.; Piao, H.; Li, J.; Sun, L. 5-Aryl-furan derivatives bearing a phenylalanine- or isoleucine-derived rhodanine moiety as potential PTP1B inhibitors. Bioorg. Chem. 2021, 106, 104483. [Google Scholar] [CrossRef]
- Li, Y.S.; Yang, X.; Zhao, D.S.; Cai, Y.; Huang, Z.; Wu, R.; Wang, S.J.; Liu, G.J.; Wang, J.; Bao, X.Z.; et al. Design, synthesis and bioactivity study on 5-phenylfuran derivatives as potent reversal agents against P-glycoprotein-mediated multidrug resistance in MCF-7/ADR cell. Eur. J. Med. Chem. 2021, 216, 113336. [Google Scholar] [CrossRef]
- Kodisundaram, P.; Amirthaganesan, S.; Balasankar, T. Antimicrobial evaluation of a set of heterobicyclic methylthiadiazole hydrazones: Synthesis, characterization, and SAR studies. J. Agric. Food Chem. 2013, 61, 11952–11956. [Google Scholar] [CrossRef]
- Patil, S.; Kuman, M.M.; Palvai, S.; Sengupta, P.; Basu, S. Impairing Powerhouse in Colon Cancer Cells by Hydrazide-Hydrazone-Based Small Molecule. ACS Omega. 2018, 3, 1470–1481. [Google Scholar] [CrossRef]
- Moldovan, C.M.; Oniga, O.; Parvu, A.; Tiperciuc, B.; Verite, P.; Pîrnău, A.; Crişan, O.; Bojiţă, M.; Pop, R. Synthesis and anti-inflammatory evaluation of some new acyl-hydrazones bearing 2-aryl-thiazole. Eur. J. Med. Chem. 2011, 46, 526–534. [Google Scholar] [CrossRef] [PubMed]
- Jeong, J.Y.; Sperry, J.; Taylor, J.A.; Brimble, M.A. Synthesis and evaluation of 9-deoxy analogues of (-)-thysanone, an inhibitor of HRV 3C protease. Eur. J. Med. Chem. Chim. Ther. 2014, 87, 220–227. [Google Scholar] [CrossRef]
- Krake, S.H.; Martinez, P.D.G.; Laren, M.; Ryan, E.; Chen, G.; White, K.; Charman, S.A.; Campbell, S.; Paul Willis, L.C.D. Novel inhibitors of Plasmodium falciparum based on 2,5-disubstituted furans. Eur. J. Med. Chem. 2016, 126, 929. [Google Scholar] [CrossRef]
- Nohl, H.; Kozlov, A.V.; Gille, L.; Staniek, K. Cell respiration and formation of reactive oxygen species: Facts and artefacts. Biochem. Soc. Trans. 2003, 31, 1308–1311. [Google Scholar] [CrossRef]
- Raha, S.; Robinson, B.H. Mitochondria, oxygen free radicals, and apoptosis. Am. J. Med. Genet. 2001, 106, 62–70. [Google Scholar] [CrossRef]
- Martindale, J.; Holbrook, N. Cellular response to oxidative stress: Signaling for suicide and survival. J. Cell. Physiol. 2002, 192, 1–15. [Google Scholar] [CrossRef]
- Gao, J.; Liu, X.; Rigas, B. Nitric oxide-donating aspirin induces apoptosis in human colon cancer cells through induction of oxidative stress. Proc. Natl. Acad. Sci. USA 2005, 102, 17207–17212. [Google Scholar] [CrossRef] [Green Version]
- Ramanathan, B.; Jan, K.; Chen, C.; Hour, T.; Yu, H.; Pu, Y. Resistance to paclitaxel is proportional to cellular total antioxidant capacity. Cancer Res. 2005, 65, 8455–8460. [Google Scholar] [CrossRef] [PubMed] [Green Version]
- Singh, S.; Srivastava, S.; Choi, S.; Lew, K.; Antosiewicz, J.; Xiao, D.; Zeng, Y.; Watkins, S.; Johnson, C.; Trump, D.; et al. Sulforaphane-induced cell death in human prostate cancer cells is initiated by reactive oxygen species. J. Biol. Chem. 2005, 280, 19911–19924. [Google Scholar] [CrossRef] [PubMed] [Green Version]
- Gallardo-Garrido, C.; Cho, Y.; Cortes-Rios, J.; Vasquez, D.; Pessoa-Mahana, C.D.; Araya-Maturana, R.; Pessoa-Mahana, H.; Faundez, M. Nitrofuran drugs beyond redox cycling: Evidence of Nitroreduction-independent cytotoxicity mechanism. Toxicol. Appl. Pharmacol. 2020, 401, 115104. [Google Scholar] [CrossRef]
- Kwang-Youn, K.; Kwang-Il, P.; Sang-Hun, K.; Yu, S.N.; Sul-Gi, P.; Young, K.; Young-Kyo, S.; Ma, J.Y.; Soon-Cheol, A. Inhibition of Autophagy Promotes Salinomycin-Induced Apoptosis via Reactive Oxygen Species-Mediated PI3K/AKT/mTOR and ERK/p38 MAPK-Dependent Signaling in Human Prostate Cancer Cells. Int. J. Mol. Sci. 2017, 18, 1088. [Google Scholar]
- Zhu, S.; Zhou, J.; Zhou, Z.; Zhu, Q. Abamectin induces apoptosis and autophagy by inhibiting reactive oxygen species-mediated PI3K/AKT signaling in MGC803 cells. J. Biochem. Mol. Toxicol. 2019, 33, e22336. [Google Scholar] [CrossRef] [PubMed]
- Yu, H.; Lee, H.; Herrmann, A.; Buettner, R.; Jove, R. Revisiting STAT3 signalling in cancer: New and unexpected biological functions. Nat. Rev. Cancer 2014, 14, 736–746. [Google Scholar] [CrossRef] [PubMed]
- Johnston, P.A.; Grandis, J.R. STAT3 signaling: Anticancer strategies and challenges. Mol. Interv. 2011, 11, 18. [Google Scholar] [CrossRef]
- Siveen, K.S.; Sikka, S.; Surana, R.; Dai, X.; Zhang, J.; Kumar, A.P.; Tan, B.K.; Sethi, G.; Bishayee, A. Targeting the STAT3 signaling pathway in cancer: Role of synthetic and natural inhibitors. Biochim. Biophys. Acta 2014, 1845, 136–154. [Google Scholar] [CrossRef] [PubMed]


   | |||||
|---|---|---|---|---|---|
| Comp. | Ar | Inhibition Rate a (%) at 20 μM | |||
| HeLa b | PC3 c | A549 d | HCT116 e | ||
| QW1 |  | 5.14 ± 0.13 | 5.13 ± 0.59 | 7.47 ± 0.52 | 15.33 ± 0.14 |
| QW2 |  | 8.64 ± 0.26 | 1.76 ± 0.23 | 6.46 ± 0.43 | 17.76 ± 0.67 |
| QW3 |  | 38.81 ± 0.3 | 32.57 ± 0.65 | 11.63 ± 0.03 | 33.8 ± 0.41 |
| QW4 |  | 44.29 ± 0.05 | 38.74 ± 0.2 | 25.54 ± 0.62 | 30.7 ± 0.04 |
| QW5 |  | 31.13 ± 0.23 | 25.97 ± 0.37 | 18.52 ± 0.18 | 30.56 ± 0.51 |
| QW6 |  | 0.53 ± 0.12 | 0.1 ± 0.13 | 1.66 ± 0.61 | 16.52 ± 0.25 |
| QW7 |  | 8.46 ± 0.42 | 4.73 ± 0.01 | 4.31 ± 0.08 | 2.18 ± 0.38 |
| QW8 |  | 3.46 ± 0.17 | 11.82 ± 0.56 | 5.8 ± 0.02 | 20.92 ± 0.05 |
| QW9 |  | 17.05 ± 0.41 | 3.98 ± 0.49 | 1.16 ± 0.63 | 29.94 ± 0.57 |
| QW10 |  | 4.3 ± 0.45 | 8.09 ± 0.13 | 8.82 ± 0.08 | 10.88 ± 0.46 |
| QW11 |  | 45.55 ± 0.61 | 29.35 ± 0.18 | 17.27 ± 0.03 | 39.89 ± 0.68 |
| QW12 |  | 76.35 ± 0.11 | 52.55 ± 0.47 | 50.78 ± 0.62 | 65.43 ± 0.27 |
| QW13 |  | 37.71 ± 0.12 | 18.51 ± 0.3 | 3.96 ± 0.59 | 23.19 ± 0.27 |
| QW14 |  | 8.67 ± 0.24 | 12.87 ± 0.31 | 5.46 ± 0.7 | 30.48 ± 0.55 |
| QW15 |  | 14.26 ± 0.12 | 13.77 ± 0.12 | 9.44 ± 0.39 | 18.81 ± 0.54 |
| QW16 |  | 10.93 ± 0.04 | 9.37 ± 0.09 | 4.12 ± 0.33 | 41.48 ± 0.05 |
| QW17 |  | 6.49 ± 0.17 | 11.69 ± 0.66 | 0.44 ± 0.16 | 4.69 ± 0.5 |
| QW18 |  | 4.3 ± 0.45 | 8.09 ± 0.13 | 8.82 ± 0.08 | 10.88 ± 0.46 |
| QW19 |  | 9.56 ± 0.65 | 8.37 ± 0.21 | 0.15 ± 0.35 | 4.61 ± 0.66 |
| QW20 |  | 22.48 ± 0.25 | 15.57 ± 0.19 | 18.73 ± 0.1 | 48.5 ± 0.01 |
| QW21 |  | 0.36 ± 0.6 | 0.12 ± 0.2 | 0.68 ± 0.36 | 4.46 ± 0.24 |
| QW22 |  | 5.47 ± 0.37 | 0.33 ± 0.06 | 37.46 ± 0.48 | 6.58 ± 0.23 |
| QW23 |  | 0.84 ± 0.64 | 2.99 ± 0.25 | 1.87 ± 0.33 | 2.26 ± 0.03 |
| QW24 |  | 4.96 ± 0.61 | 2.4 ± 0.07 | 6 ± 0.1 | 4.39 ± 0.52 |
| f Nifuroxazide | 80.38 ± 0.17 | 75.29 ± 0.33 | 91.23 ± 0.04 | 85.31 ± 0.24 | |
| Comp. | IC50 ± SD (µM) f | |
|---|---|---|
| QW12 | Nifuroxazide g | |
| HeLa a | 10.58 ± 0.10 | 16.65 ± 0.08 |
| PC3 b | 12.67 ± 0.57 | 9.83 ± 0.05 |
| HCT116 c | 12.20 ± 0.25 | 10.46 ± 0.04 |
| A549 d | 20.57 ± 1.22 | 8.06 ± 0.03 |
| L02 e | >50 | 25.30 ± 0.31 |
Publisher’s Note: MDPI stays neutral with regard to jurisdictional claims in published maps and institutional affiliations. |
© 2022 by the authors. Licensee MDPI, Basel, Switzerland. This article is an open access article distributed under the terms and conditions of the Creative Commons Attribution (CC BY) license (https://creativecommons.org/licenses/by/4.0/).
Share and Cite
Fan, D.; Liu, P.; Jiang, Y.; He, X.; Zhang, L.; Wang, L.; Yang, T. Discovery and SAR Study of Quinoxaline–Arylfuran Derivatives as a New Class of Antitumor Agents. Pharmaceutics 2022, 14, 2420. https://doi.org/10.3390/pharmaceutics14112420
Fan D, Liu P, Jiang Y, He X, Zhang L, Wang L, Yang T. Discovery and SAR Study of Quinoxaline–Arylfuran Derivatives as a New Class of Antitumor Agents. Pharmaceutics. 2022; 14(11):2420. https://doi.org/10.3390/pharmaceutics14112420
Chicago/Turabian StyleFan, Dongmei, Pingxian Liu, Yunhan Jiang, Xinlian He, Lidan Zhang, Lijiao Wang, and Tao Yang. 2022. "Discovery and SAR Study of Quinoxaline–Arylfuran Derivatives as a New Class of Antitumor Agents" Pharmaceutics 14, no. 11: 2420. https://doi.org/10.3390/pharmaceutics14112420