
Development and Validation of a HPLC–MS/MS Method to Measure Nifuroxazide and Its Application in Healthy and Glioblastoma-Bearing Mice
 , , , , , , and
Abstract
:1. Introduction
2. Materials and Methods
2.1. Reagents and Chemicals
2.2. Tumor Cell Line and Animals
2.3. Preparation of Standard and Quality Control Solutions
2.4. Preparation of Standard and QC Brain Samples
2.5. Preparation of Standard and QC Plasma Samples
2.6. Processing Plasma and Brain Samples
2.7. Liquid Chromatography
2.8. Mass Spectrometry
2.9. Validation of the Method
2.10. Tumor Model and Pharmacokinetic Study
3. Results
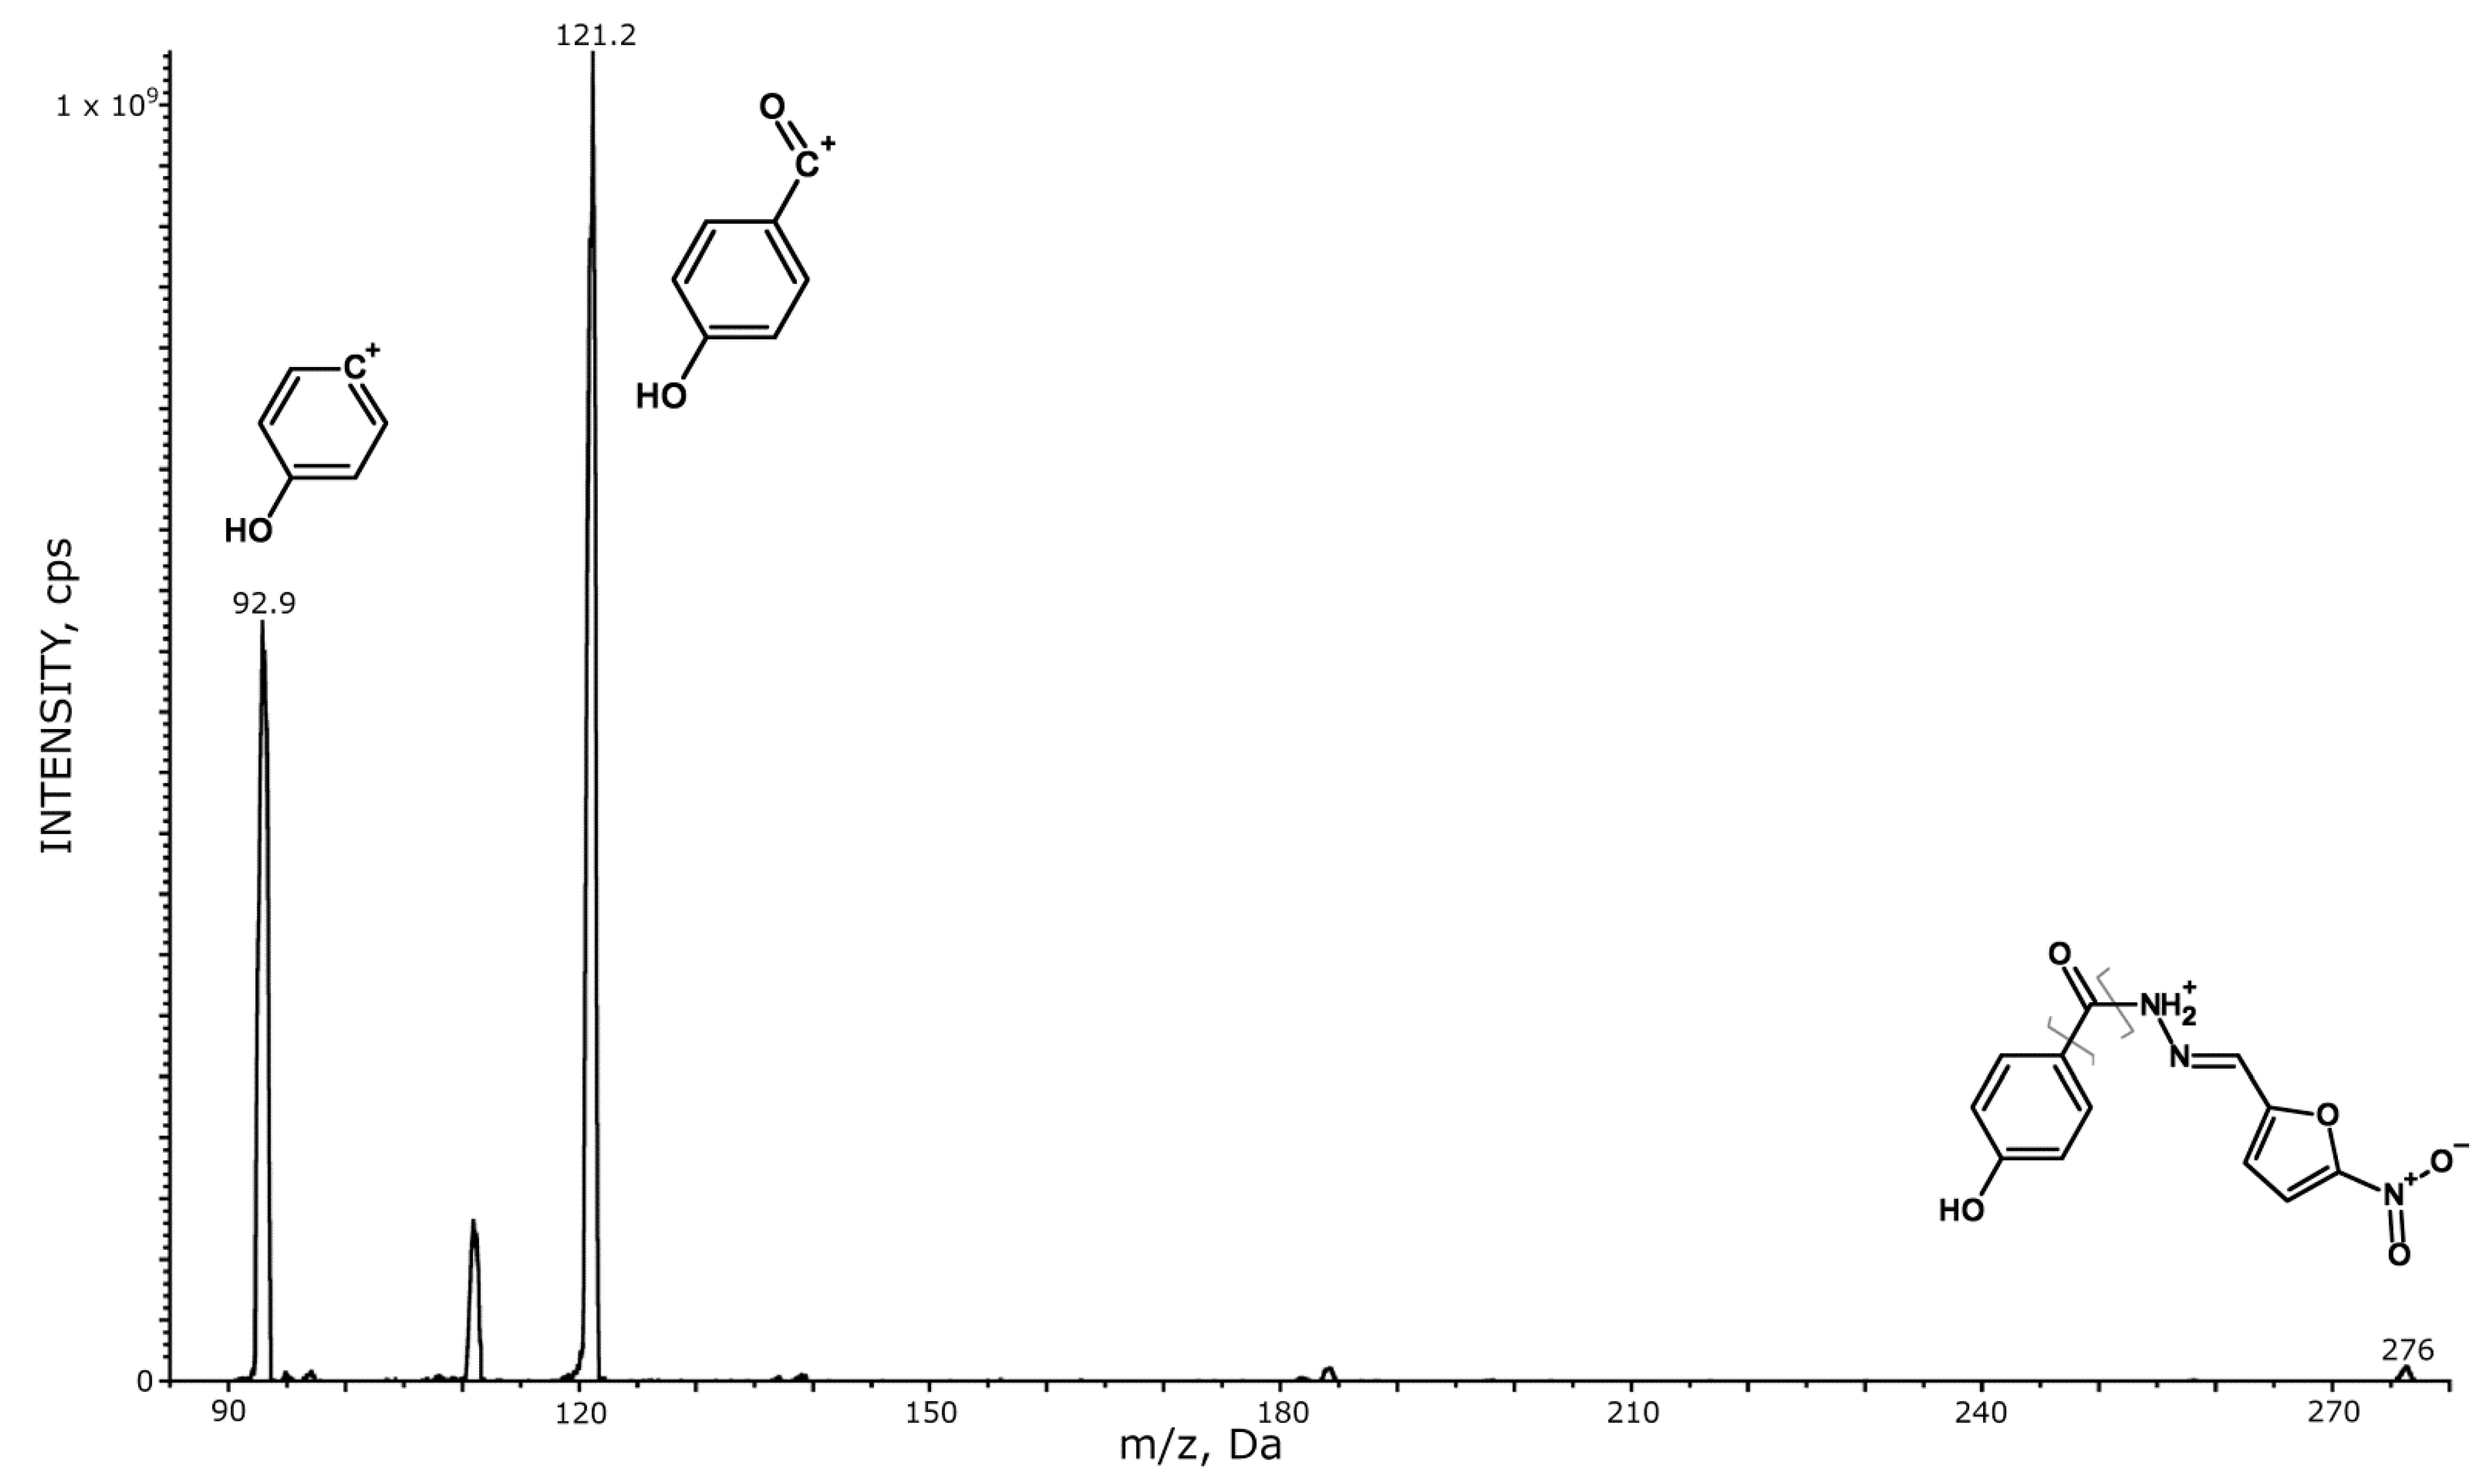
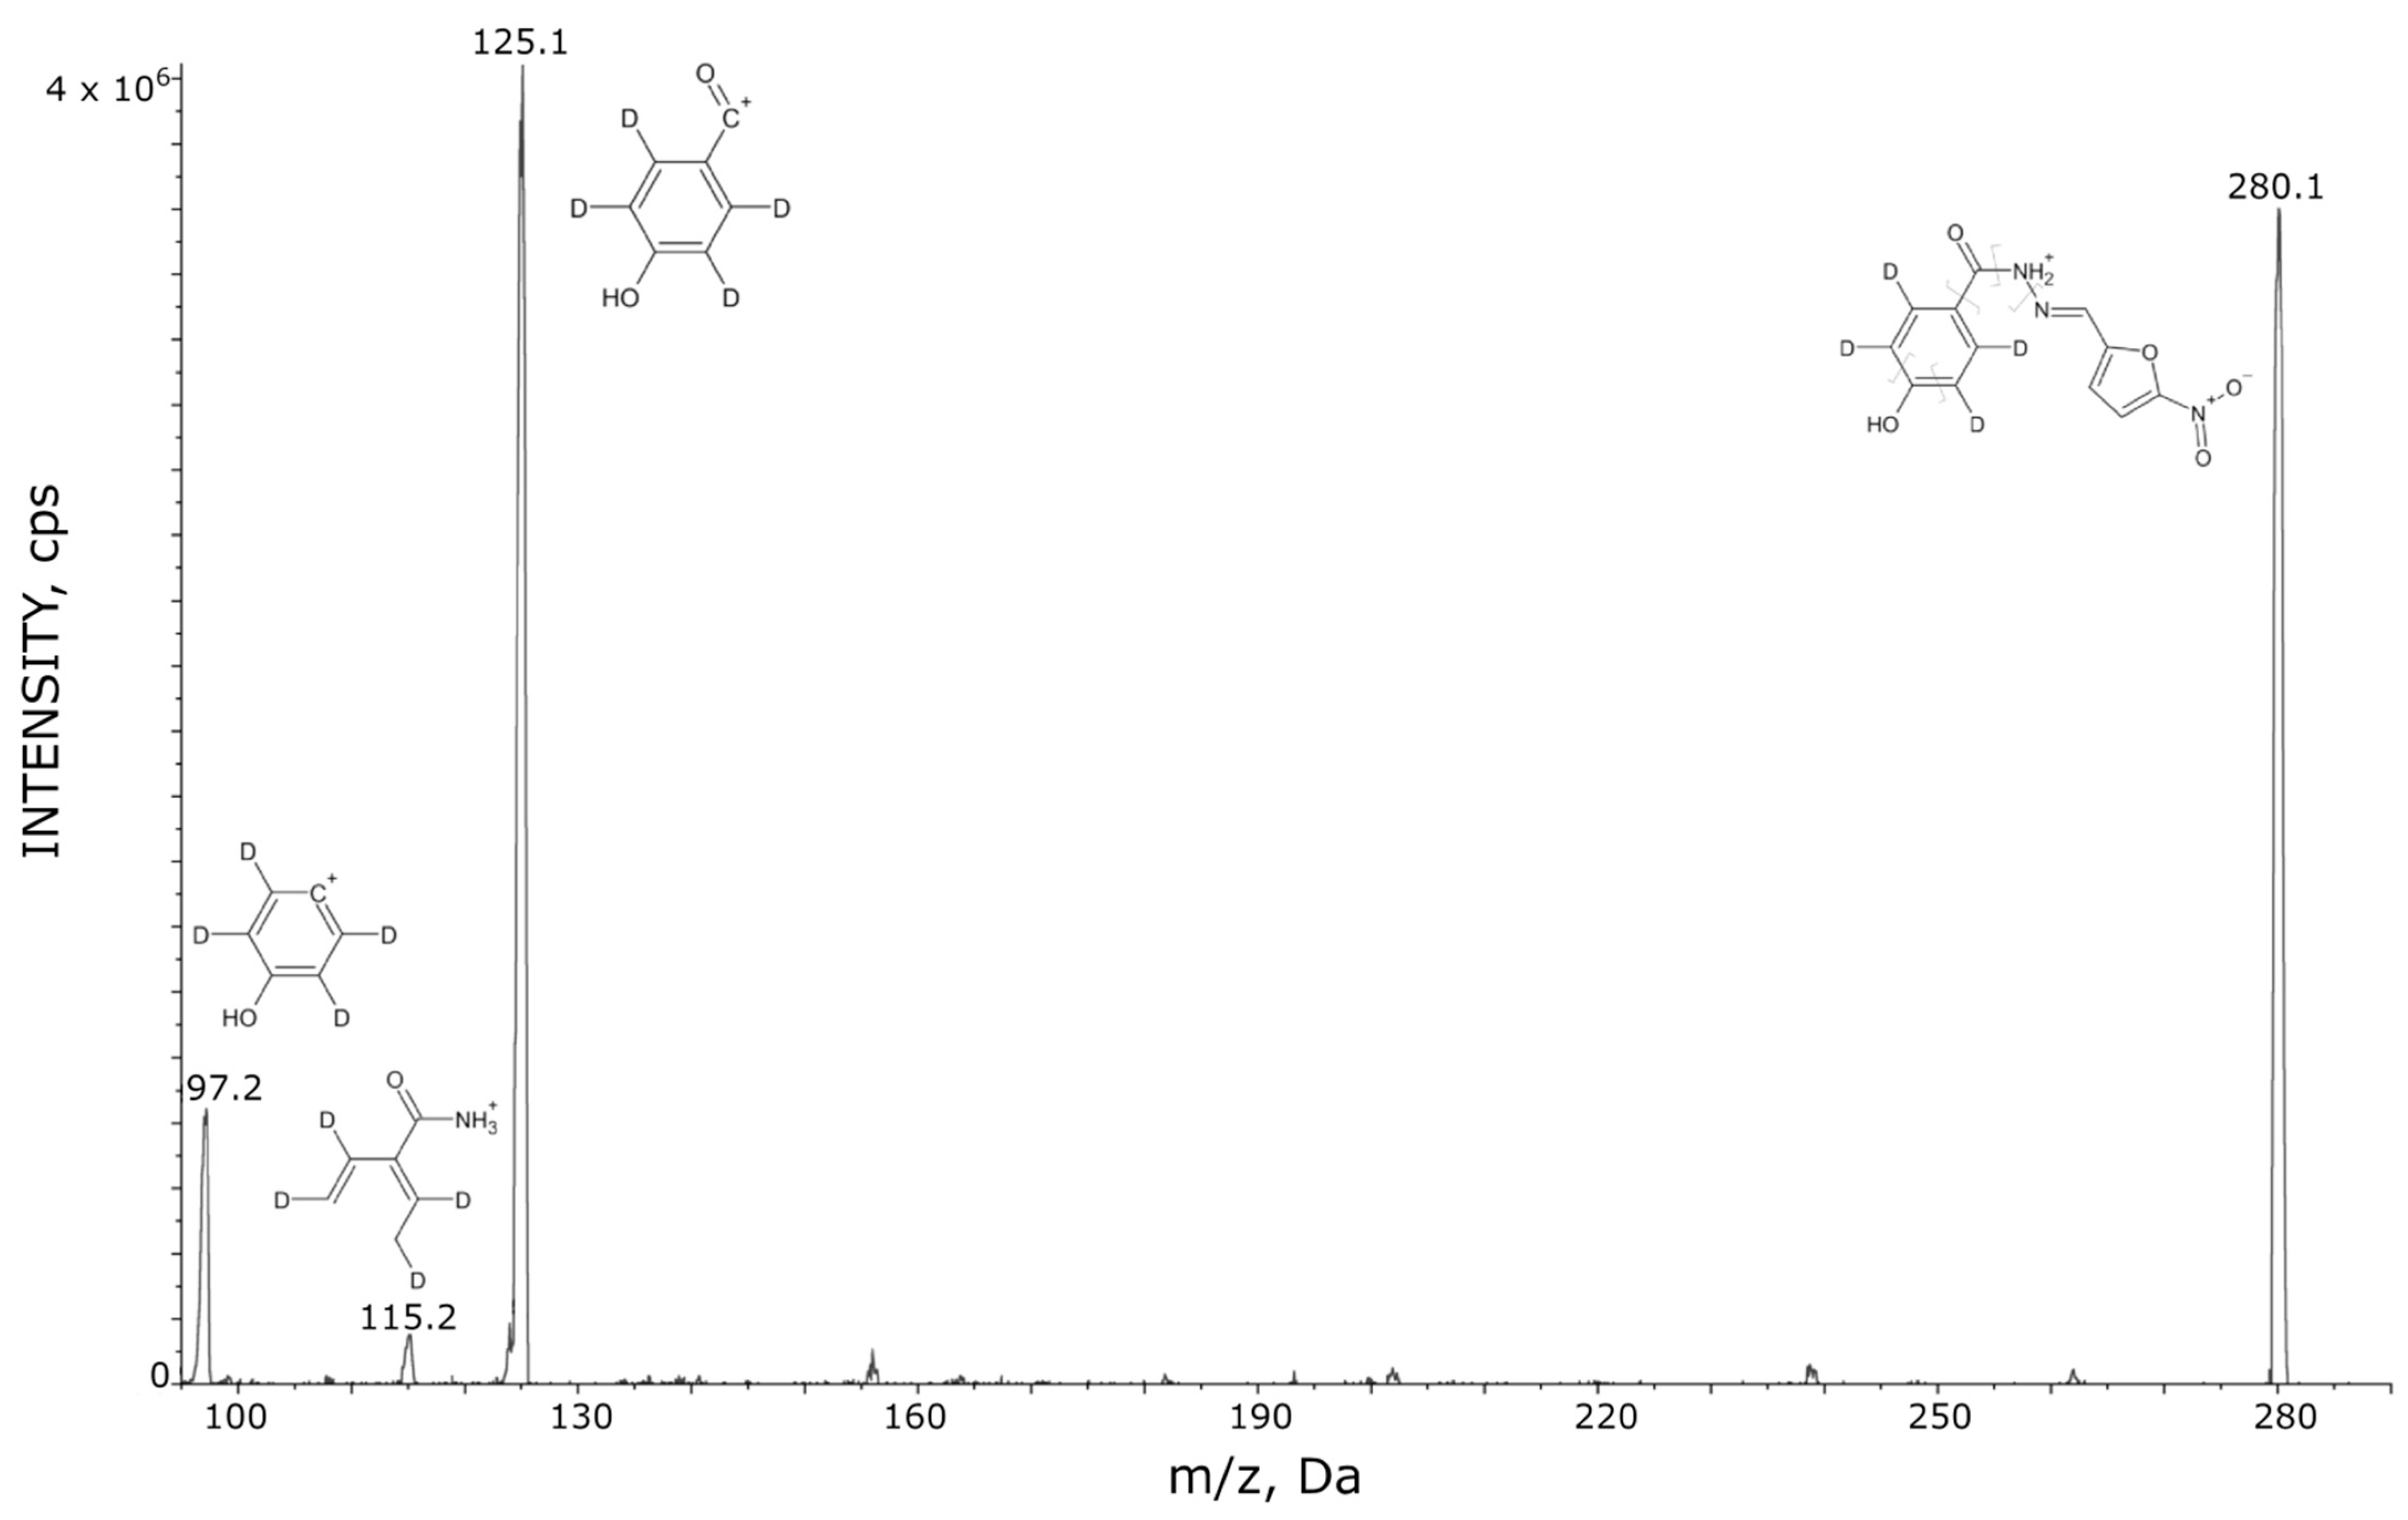
3.1. HPLC–MS/MS
3.2. Recovery
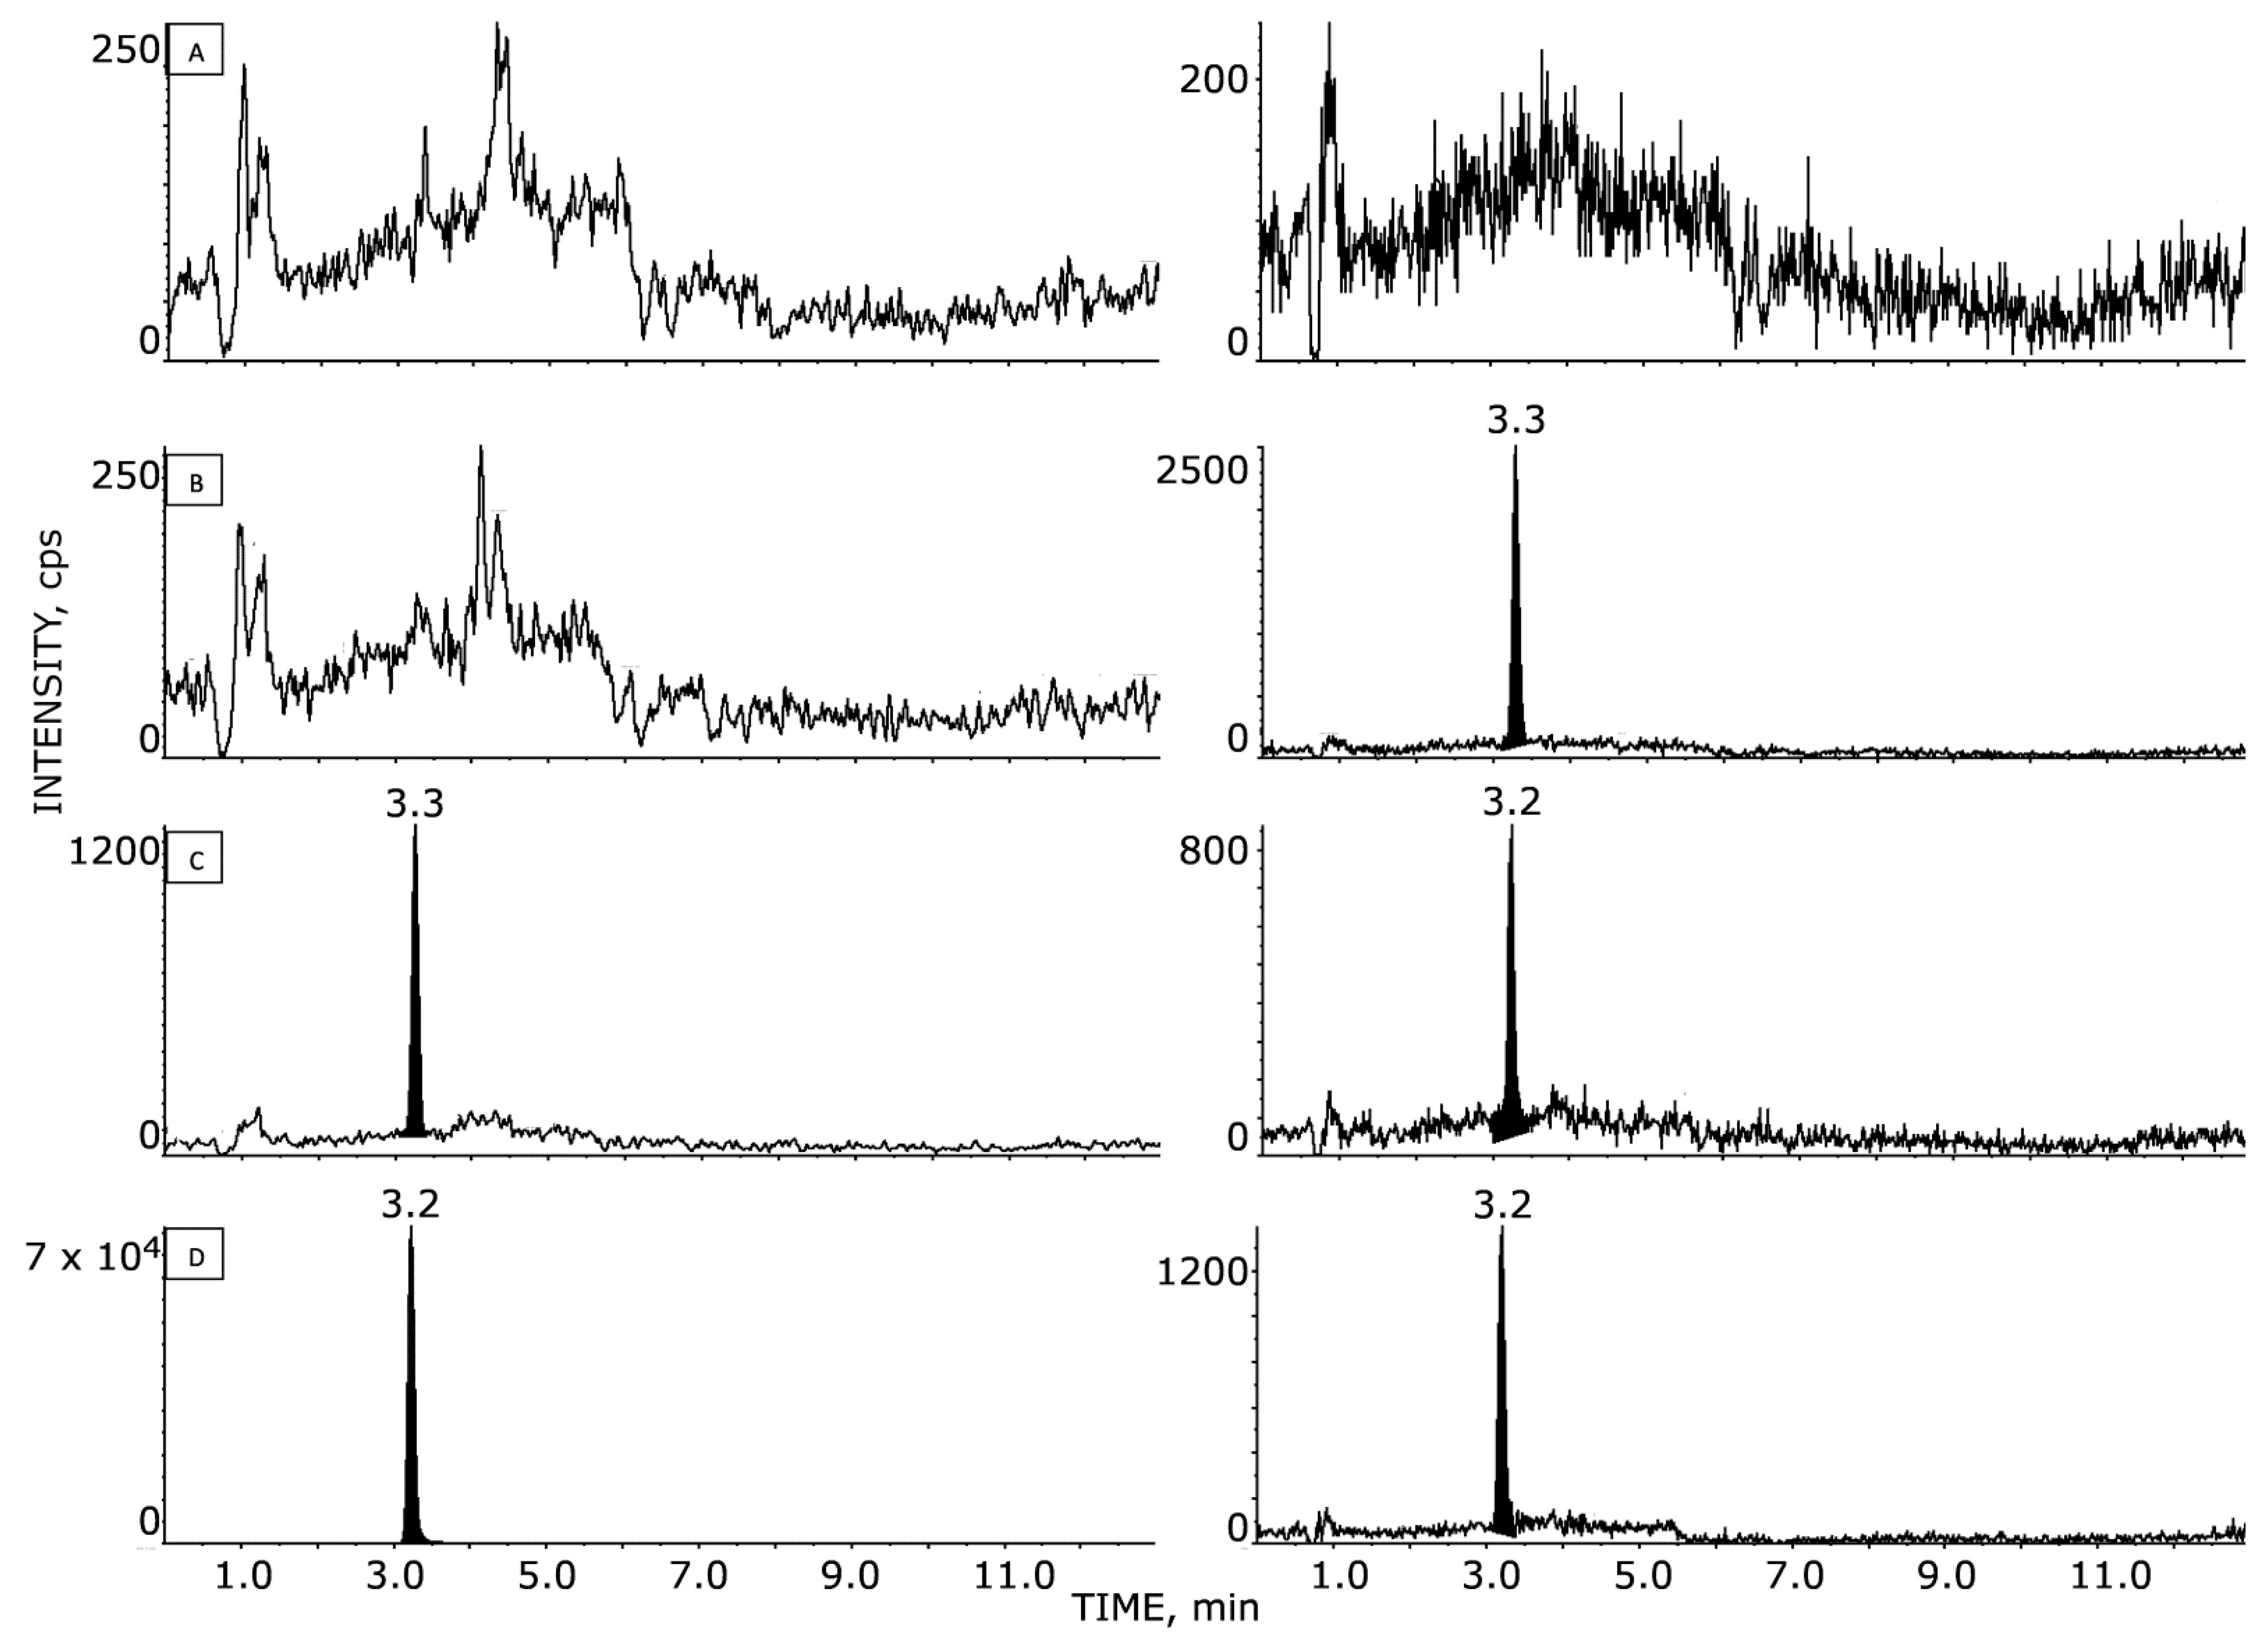
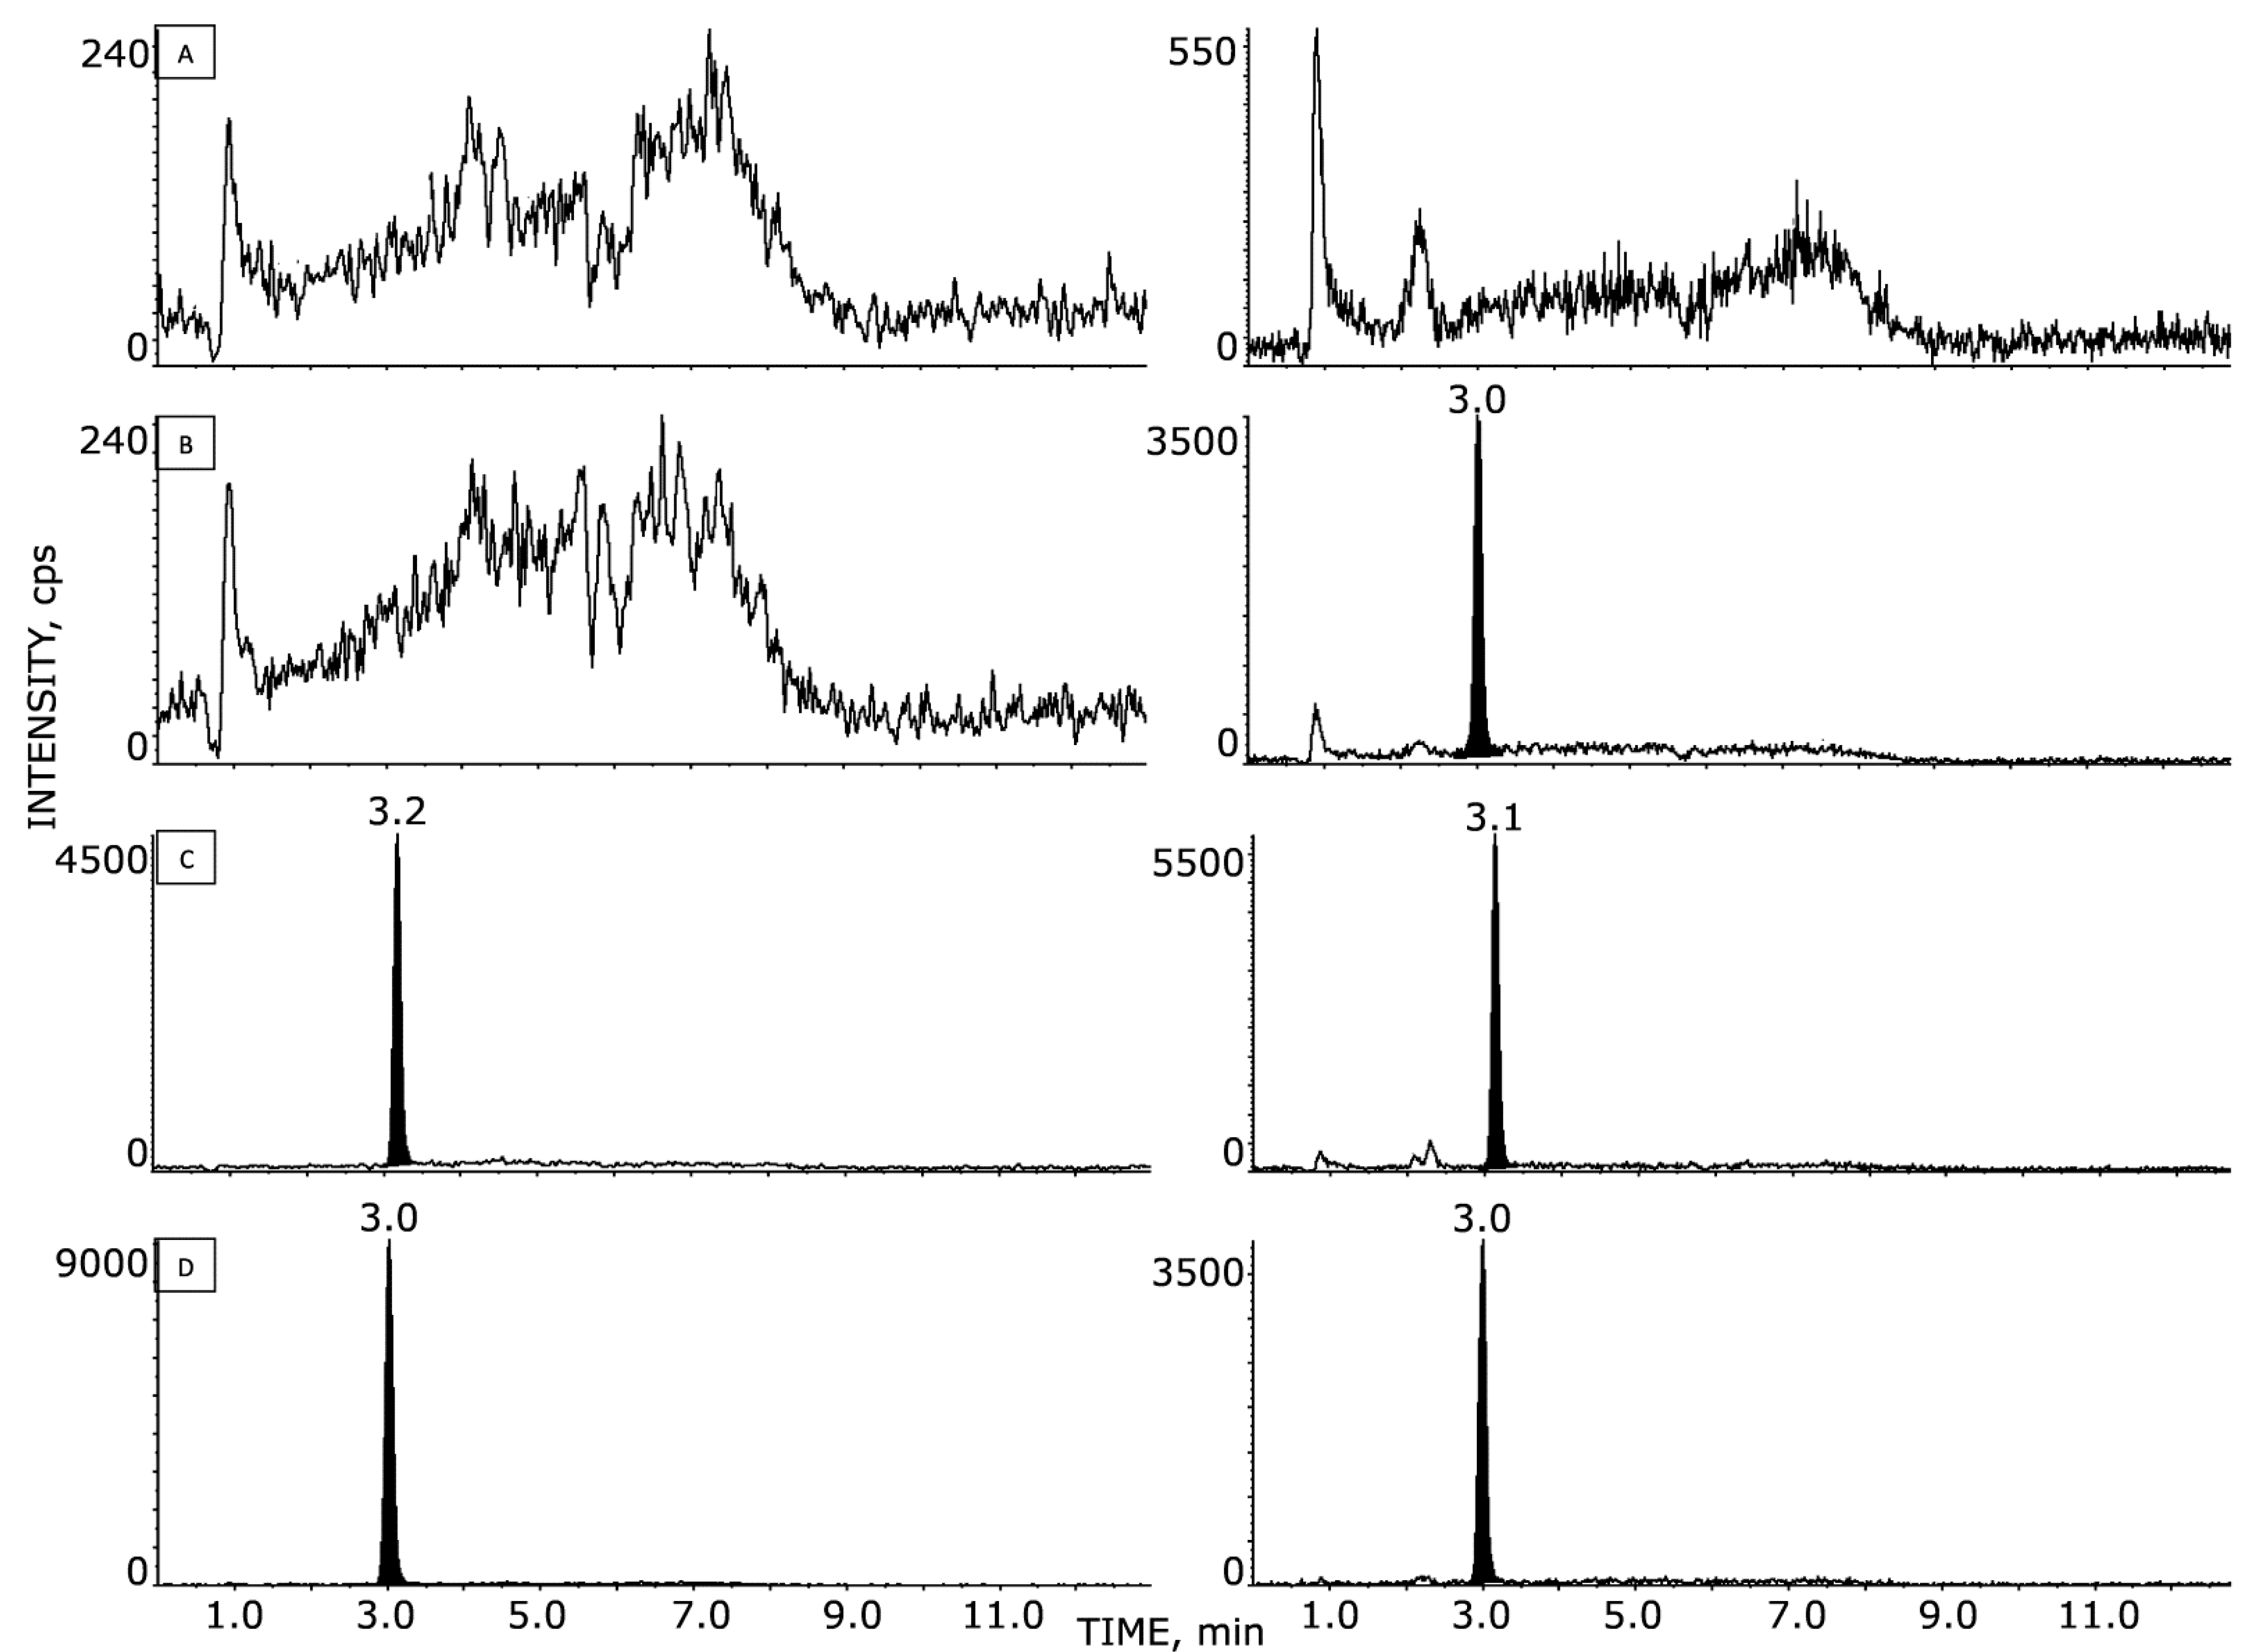
3.3. LLOQ Selectivity and Matrix Effect
3.4. Linearity
3.5. Accuracy and Precision
3.6. Stability
3.7. Application of the Method
4. Discussion
Author Contributions
Funding
Institutional Review Board Statement
Informed Consent Statement
Data Availability Statement
Conflicts of Interest
References
- Begovic, B.; Ahmedtagic, S.; Calkic, L.; Vehabović, M.; Kovacevic, S.B.; Catic, T.; Mehic, M. Open Clinical Trial on Using Nifuroxazide Compared to Probiotics in Treating Acute Diarrhoeas in Adults. Mater. Sociomed. 2016, 28, 454–458. [Google Scholar] [CrossRef]
- Uhlen, S.; Toursel, F.; Gottrand, F.; Association Française de Pédiatrie Ambulatoire. Treatment of acute diarrhea: Prescription patterns by private practice pediatricians. Arch. Pediatr. 2004, 11, 903–907. [Google Scholar] [CrossRef] [PubMed]
- Nelson, E.A.; Walker, S.R.; Kepich, A.; Gashin, L.B.; Hideshima, T.; Ikeda, H.; Chauhan, D.; Anderson, K.C.; Frank, D.A. Nifuroxazide Inhibits Survival of Multiple Myeloma Cells by Directly Inhibiting STAT3. Blood 2008, 112, 5095–5102. [Google Scholar] [CrossRef] [PubMed]
- Won, C.; Kim, B.-H.; Yi, E.H.; Choi, K.-J.; Kim, E.-K.; Jeong, J.-M.; Lee, J.-H.; Jang, J.-J.; Yoon, J.-H.; Jeong, W.-I.; et al. Signal Transducer and Activator of Transcription 3-Mediated CD133 up-Regulation Contributes to Promotion of Hepatocellular Carcinoma. Hepatology 2015, 62, 1160–1173. [Google Scholar] [CrossRef]
- Yang, F.; Hu, M.; Lei, Q.; Xia, Y.; Zhu, Y.; Song, X.; Li, Y.; Jie, H.; Liu, C.; Xiong, Y.; et al. Nifuroxazide Induces Apoptosis and Impairs Pulmonary Metastasis in Breast Cancer Model. Cell Death Dis. 2015, 6, e1701. [Google Scholar] [CrossRef] [PubMed]
- Guinebault, P.R.; Broquaire, M.; Braithwaite, R.A. Determination of Nifuroxazide in Biological Fluids by Automated High-Performance Liquid Chromatography with Large-Volume Injection. J. Chromatogr. A 1981, 204, 329–333. [Google Scholar] [CrossRef]
- Ricci-Vitiani, L.; Pallini, R.; Larocca, L.M.; Lombardi, D.G.; Signore, M.; Pierconti, F.; Petrucci, G.; Montano, N.; Maira, G.; De Maria, R. Mesenchymal Differentiation of Glioblastoma Stem Cells. Cell Death Differ. 2008, 15, 1491–1498. [Google Scholar] [CrossRef] [PubMed]
- Pallini, R.; Ricci-Vitiani, L.; Banna, G.L.; Signore, M.; Lombardi, D.; Todaro, M.; Stassi, G.; Martini, M.; Maira, G.; Larocca, L.M.; et al. Cancer Stem Cell Analysis and Clinical Outcome in Patients with Glioblastoma Multiforme. Clin. Cancer Res. 2008, 14, 8205–8212. [Google Scholar] [CrossRef] [PubMed]
- Visconti, P.; Parodi, F.; Parodi, B.; Casarino, L.; Romano, P.; Buccarelli, M.; Pallini, R.; D’Alessandris, Q.G.; Montori, A.; Pilozzi, E.; et al. Short Tandem Repeat Profiling for the Authentication of Cancer Stem-like Cells. Int. J. Cancer 2021, 148, 1489–1498. [Google Scholar] [CrossRef]
- D’Alessandris, Q.G.; Biffoni, M.; Martini, M.; Runci, D.; Buccarelli, M.; Cenci, T.; Signore, M.; Stancato, L.; Olivi, A.; De Maria, R.; et al. The Clinical Value of Patient-Derived Glioblastoma Tumorspheres in Predicting Treatment Response. Neuro-Oncology 2017, 19, 1097–1108. [Google Scholar] [CrossRef] [Green Version]
- Bioanalytical Method Validation Guidance for Industry; U.S. Department of Health and Human Services: Washington, DC, USA; Food and Drug Administration: White Oak, MD, USA; Center for Drug Evaluation and Research (CDER): Silver Spring, MD, USA; Center for Veterinary Medicine (CVM): Montgomery, MD, USA, 2018; Volume 44.
- EMA Bioanalytical Method Validation. Available online: https://www.ema.europa.eu/en/bioanalytical-method-validation (accessed on 14 June 2022).
- Haas, T.L.; Sciuto, M.R.; Brunetto, L.; Valvo, C.; Signore, M.; Fiori, M.E.; di Martino, S.; Giannetti, S.; Morgante, L.; Boe, A.; et al. Integrin A7 Is a Functional Marker and Potential Therapeutic Target in Glioblastoma. Cell Stem. Cell 2017, 21, 35–50.e9. [Google Scholar] [CrossRef] [PubMed]
- da Costa, M.O.L.; Pavani, T.F.A.; Lima, A.N.; Scott, A.L.; Ramos, D.F.V.; Lazarini, M.; Rando, D.G.G. Nifuroxazide as JAK2 Inhibitor: A Binding Mode Proposal and Hel Cell Proliferation Assay. Eur. J. Pharm. Sci. 2021, 162, 105822. [Google Scholar] [CrossRef] [PubMed]
- Stumpo, V.; Marappian, A.; D’Alessandris, Q.G.; Pacioni, S.; Di Bonaventura, R.; Ebbert, L.; Giordano, M.; Caccavella, V.; Olivi, A.; Falchetti, M.L.; et al. Characterization of primary cilium in recurrent glioblastoma: Implications for new therapeutic targets. Neuro-Oncol. 2019, 21 (Suppl. S6), vi38, (Abstract CBMT-24). [Google Scholar] [CrossRef]
- Bailly, C. Toward a Repositioning of the Antibacterial Drug Nifuroxazide for Cancer Treatment. Drug Discov. Today 2019, 24, 1930–1936. [Google Scholar] [CrossRef] [PubMed]
- Sarvi, S.; Crispin, R.; Lu, Y.; Zeng, L.; Hurley, T.D.; Houston, D.R.; von Kriegsheim, A.; Chen, C.-H.; Mochly-Rosen, D.; Ranzani, M.; et al. ALDH1 Bio-Activates Nifuroxazide to Eradicate ALDHHigh Melanoma-Initiating Cells. Cell Chem. Biol. 2018, 25, 1456–1469.e6. [Google Scholar] [CrossRef] [PubMed]
- Peterson, R.T. 5-Nitrofurans and Cancer: Teaching an Old Drug New Tricks. Cell Chem. Biol. 2018, 25, 1439–1440. [Google Scholar] [CrossRef] [PubMed]
- Labaune, J.P.; Moreau, J.P.; Byrne, R. Comparative Physiological Disposition of Two Nitrofuran Anti-Microbial Agents. Biopharm. Drug Dispos. 1986, 7, 431–441. [Google Scholar] [CrossRef] [PubMed]
- Said, E.; Zaitone, S.A.; Eldosoky, M.; Elsherbiny, N.M. Nifuroxazide, a STAT3 Inhibitor, Mitigates Inflammatory Burden and Protects against Diabetes-Induced Nephropathy in Rats. Chem. Biol. Interact. 2018, 281, 111–120. [Google Scholar] [CrossRef]
- Elsherbiny, N.M.; Zaitone, S.A.; Mohammad, H.M.F.; El-Sherbiny, M. Renoprotective Effect of Nifuroxazide in Diabetes-Induced Nephropathy: Impact on NFκB, Oxidative Stress, and Apoptosis. Toxicol. Mech. Methods 2018, 28, 467–473. [Google Scholar] [CrossRef] [PubMed]


| Nominal Concentration (ng/mL) | |||||||
|---|---|---|---|---|---|---|---|
| 1.0 | 2.5 | 5.0 | 10.0 | 20.0 | 100.0 | ||
| NAZ | Measured concentration | R2 Calibration | |||||
| Day 1 | 1.1 | - | 5.1 | 10.1 | 19.6 | 94.5 | 0.996 |
| Day 2 | 1.0 | 2.3 | 5.2 | 10.2 | 19.2 | 105 | 0.996 |
| Day 3 | 1.0 | 2.4 | 5.2 | 10.1 | 19.2 | 103 | 0.998 |
| Day 4 | 1.1 | 2.5 | 4.8 | 10.2 | 19.4 | 104 | 0.997 |
| Day 5 | 1.0 | 2.5 | 4.7 | 10.2 | 21.1 | 97.2 | 0.996 |
| Mean (N = 5) | 1.0 | 2.4 | 5.0 | 10.2 | 19.7 | 100.7 | 0.997 |
| Accuracy (%) | 103.8 | 97.1 | 99.6 | 101.6 | 98.5 | 100.7 | |
| SD | 0.04 | 0.1 | 0.2 | 0.05 | 0.8 | 4.6 | |
| Precision (%) | 3.8 | 4.6 | 4.5 | 0.5 | 4.1 | 4.6 | |
| Nominal Concentration (ng/g) | |||||||
|---|---|---|---|---|---|---|---|
| 2.0 | 4.0 | 10.0 | 20.0 | 40.0 | 80.0 | ||
| NAZ | Measured concentration | R2 Calibration | |||||
| Day 1 | 2.3 | 3.7 | 11.0 | 19.7 | 38.6 | 80.4 | 0.995 |
| Day 2 | 2.0 | 3.8 | 10.0 | 20.6 | 40.5 | 78.9 | 0.993 |
| Day 3 | 2.3 | 3.5 | 10.4 | 19.1 | 39.5 | 82.6 | 0.999 |
| Mean (N = 3) | 2.2 | 3.7 | 10.5 | 19.8 | 39.5 | 80.6 | 0.996 |
| Accuracy (%) | 110.0 | 91.8 | 104.5 | 99.0 | 98.8 | 100.8 | |
| SD | 0.1 | 0.2 | 0.5 | 0.8 | 0.9 | 1.9 | |
| Precision (%) | 6.4 | 4.6 | 5.0 | 3.8 | 2.4 | 2.3 | |
| Nominal Concentration (ng/mL) | |||
|---|---|---|---|
| 3.0 | 15.0 | 75.0 | |
| NAZ | Measured concentration | ||
| Day 1 | 2.6 | 13.3 | 63.9 |
| 2.8 | 13.6 | 66.6 | |
| 2.8 | 14.0 | 67.3 | |
| 3.0 | 14.4 | 69.6 | |
| 3.1 | 15.2 | 70.8 | |
| Mean (5) | 2.8 | 14.1 | 67.6 |
| SD | 0.2 | 0.7 | 2.7 |
| Precision (%) | 6.4 | 5.3 | 4.0 |
| Accuracy (%) | 94.8 | 94.0 | 90.2 |
| Nominal Concentration (ng/mL) | |||
|---|---|---|---|
| 3.0 | 15.0 | 75.0 | |
| NAZ | Measured concentration | ||
| Day 1 | 2.6 | 13.3 | 63.9 |
| 2.8 | 13.6 | 66.6 | |
| 2.8 | 14.0 | 67.3 | |
| 3.0 | 14.4 | 69.6 | |
| 3.1 | 15.2 | 70.8 | |
| Day 2 | 2.7 | 13.2 | 65.5 |
| 2.7 | 13.5 | 67.3 | |
| 2.6 | 12.7 | 73.0 | |
| Day 3 | 2.7 | 14.9 | 65.2 |
| 2.7 | 13.5 | 68.5 | |
| 2.7 | 12.9 | 68.0 | |
| Day 4 | 3.4 | 16.6 | 85.7 |
| 3.3 | 16.7 | 69.5 | |
| 3.3 | 17.2 | 90.2 | |
| Day 5 | 3.3 | 15.4 | 81.6 |
| 3.3 | 15.6 | 83.3 | |
| 3.4 | 15.8 | 83.9 | |
| Mean (17) | 3.0 | 14.6 | 72.9 |
| SD | 0.3 | 1.4 | 8.4 |
| Precision (%) | 10.5 | 9.8 | 11.6 |
| Accuracy (%) | 98.6 | 97.5 | 97.2 |
| Nominal Concentration (ng/g) | |||
|---|---|---|---|
| 6.0 | 30.0 | 60.0 | |
| NAZ | Measured concentration | ||
| Day 1 | 6.1 | 32.7 | 64.9 |
| 6.4 | 34.3 | 67.6 | |
| 6.5 | 33.3 | 67.5 | |
| 6.5 | 33.4 | 68.3 | |
| 6.2 | 33.6 | 67.0 | |
| Mean (5) | 6.3 | 33.5 | 67.1 |
| SD | 0.2 | 0.6 | 1.3 |
| Precision (%) | 3.3 | 1.7 | 1.9 |
| Accuracy (%) | 105.4 | 111.5 | 111.8 |
| Nominal Concentration (ng/g) | |||
|---|---|---|---|
| 6.0 | 30.0 | 60.0 | |
| NAZ | Measured concentration | ||
| Day 1 | 6.1 | 32.7 | 64.9 |
| 6.4 | 34.3 | 67.6 | |
| 6.5 | 33.3 | 67.5 | |
| 6.5 | 33.4 | 68.3 | |
| 6.2 | 33.6 | 67.0 | |
| Day 2 | 6.7 | 34.1 | 64.1 |
| 6.1 | 33.4 | 68.5 | |
| 6.5 | 32.7 | 64.1 | |
| Day 3 | 7.2 | 28.6 | 60.3 |
| 6.6 | 32.7 | 69.1 | |
| 6.4 | 32.2 | 68.0 | |
| Mean (17) | 6.4 | 32.8 | 66.3 |
| SD | 0.2 | 1.5 | 2.7 |
| Precision (%) | 3.5 | 4.7 | 4.0 |
| Accuracy (%) | 106.4 | 109.4 | 110.5 |
| Plasma | Brain | ||||||
|---|---|---|---|---|---|---|---|
| #Mice | Time (h) | NAZ (ng/mL) | Mean (ng/mL) | SD (CV%) | NAZ (ng/g) | MEAN (ng/g) | SD (CV%) |
| 185 | Pre-dose | <LOQ | <LOQ | NA | <LOQ | <LOQ | NA |
| 194 | Pre-dose | <LOQ | <LOQ | ||||
| 199 | 1 | 347 | 205.1 | 133.8 (65.3) | <LOQ | <LOQ | NA |
| 183 | 1 | 81.2 | <LOQ | ||||
| 191 | 1 | 187 | <LOQ | ||||
| 197 | 3 | 5.1 | 6.7 | 2.4 (36.3) | <LOQ | <LOQ | NA |
| 198 | 3 | 9.4 | <LOQ | ||||
| 192 | 3 | 5.5 | <LOQ | ||||
| 182 | 6 | 1.2 | 1.0 | 0.2 (19.0) | <LOQ | <LOQ | NA |
| 196 | 6 | 6.0 # | <LOQ | ||||
| 184 | 6 | 0.9 | <LOQ | ||||
| Matrix | Sham-Operated Mice | Mice with GSC Tumors | |||
|---|---|---|---|---|---|
| #1 | #2 | #3 | #1 | #2 | |
| Plasma (ng/mL) | 663 | 336 | 1250 | 2020 | 2640 |
| Mean ± SD (ng/mL) | 750 ± 463 | 2330 ± 438 | |||
| Brain (ng/g) | <LOQ | <LOQ | <LOQ | 2.6 | 9.2 |
| Mean ± SD (ng/g) | <LOQ | 5.81 ± 4.7 | |||
Publisher’s Note: MDPI stays neutral with regard to jurisdictional claims in published maps and institutional affiliations. |
© 2022 by the authors. Licensee MDPI, Basel, Switzerland. This article is an open access article distributed under the terms and conditions of the Creative Commons Attribution (CC BY) license (https://creativecommons.org/licenses/by/4.0/).
Share and Cite
Ceruti, T.; D’Alessandris, Q.G.; Frapolli, R.; Gopalakrishnan, J.; Buccarelli, M.; Meroni, M.; Lauretti, L.; Ricci-Vitiani, L.; Pallini, R.; Zucchetti, M. Development and Validation of a HPLC–MS/MS Method to Measure Nifuroxazide and Its Application in Healthy and Glioblastoma-Bearing Mice. Pharmaceutics 2022, 14, 2071. https://doi.org/10.3390/pharmaceutics14102071
Ceruti T, D’Alessandris QG, Frapolli R, Gopalakrishnan J, Buccarelli M, Meroni M, Lauretti L, Ricci-Vitiani L, Pallini R, Zucchetti M. Development and Validation of a HPLC–MS/MS Method to Measure Nifuroxazide and Its Application in Healthy and Glioblastoma-Bearing Mice. Pharmaceutics. 2022; 14(10):2071. https://doi.org/10.3390/pharmaceutics14102071
Chicago/Turabian StyleCeruti, Tommaso, Quintino Giorgio D’Alessandris, Roberta Frapolli, Jay Gopalakrishnan, Mariachiara Buccarelli, Marina Meroni, Liverana Lauretti, Lucia Ricci-Vitiani, Roberto Pallini, and Massimo Zucchetti. 2022. "Development and Validation of a HPLC–MS/MS Method to Measure Nifuroxazide and Its Application in Healthy and Glioblastoma-Bearing Mice" Pharmaceutics 14, no. 10: 2071. https://doi.org/10.3390/pharmaceutics14102071