
Large-Volume Focused-Ultrasound Mild Hyperthermia for Improving Blood-Brain Tumor Barrier Permeability Application

Abstract
:1. Introduction
2. Materials and Methods
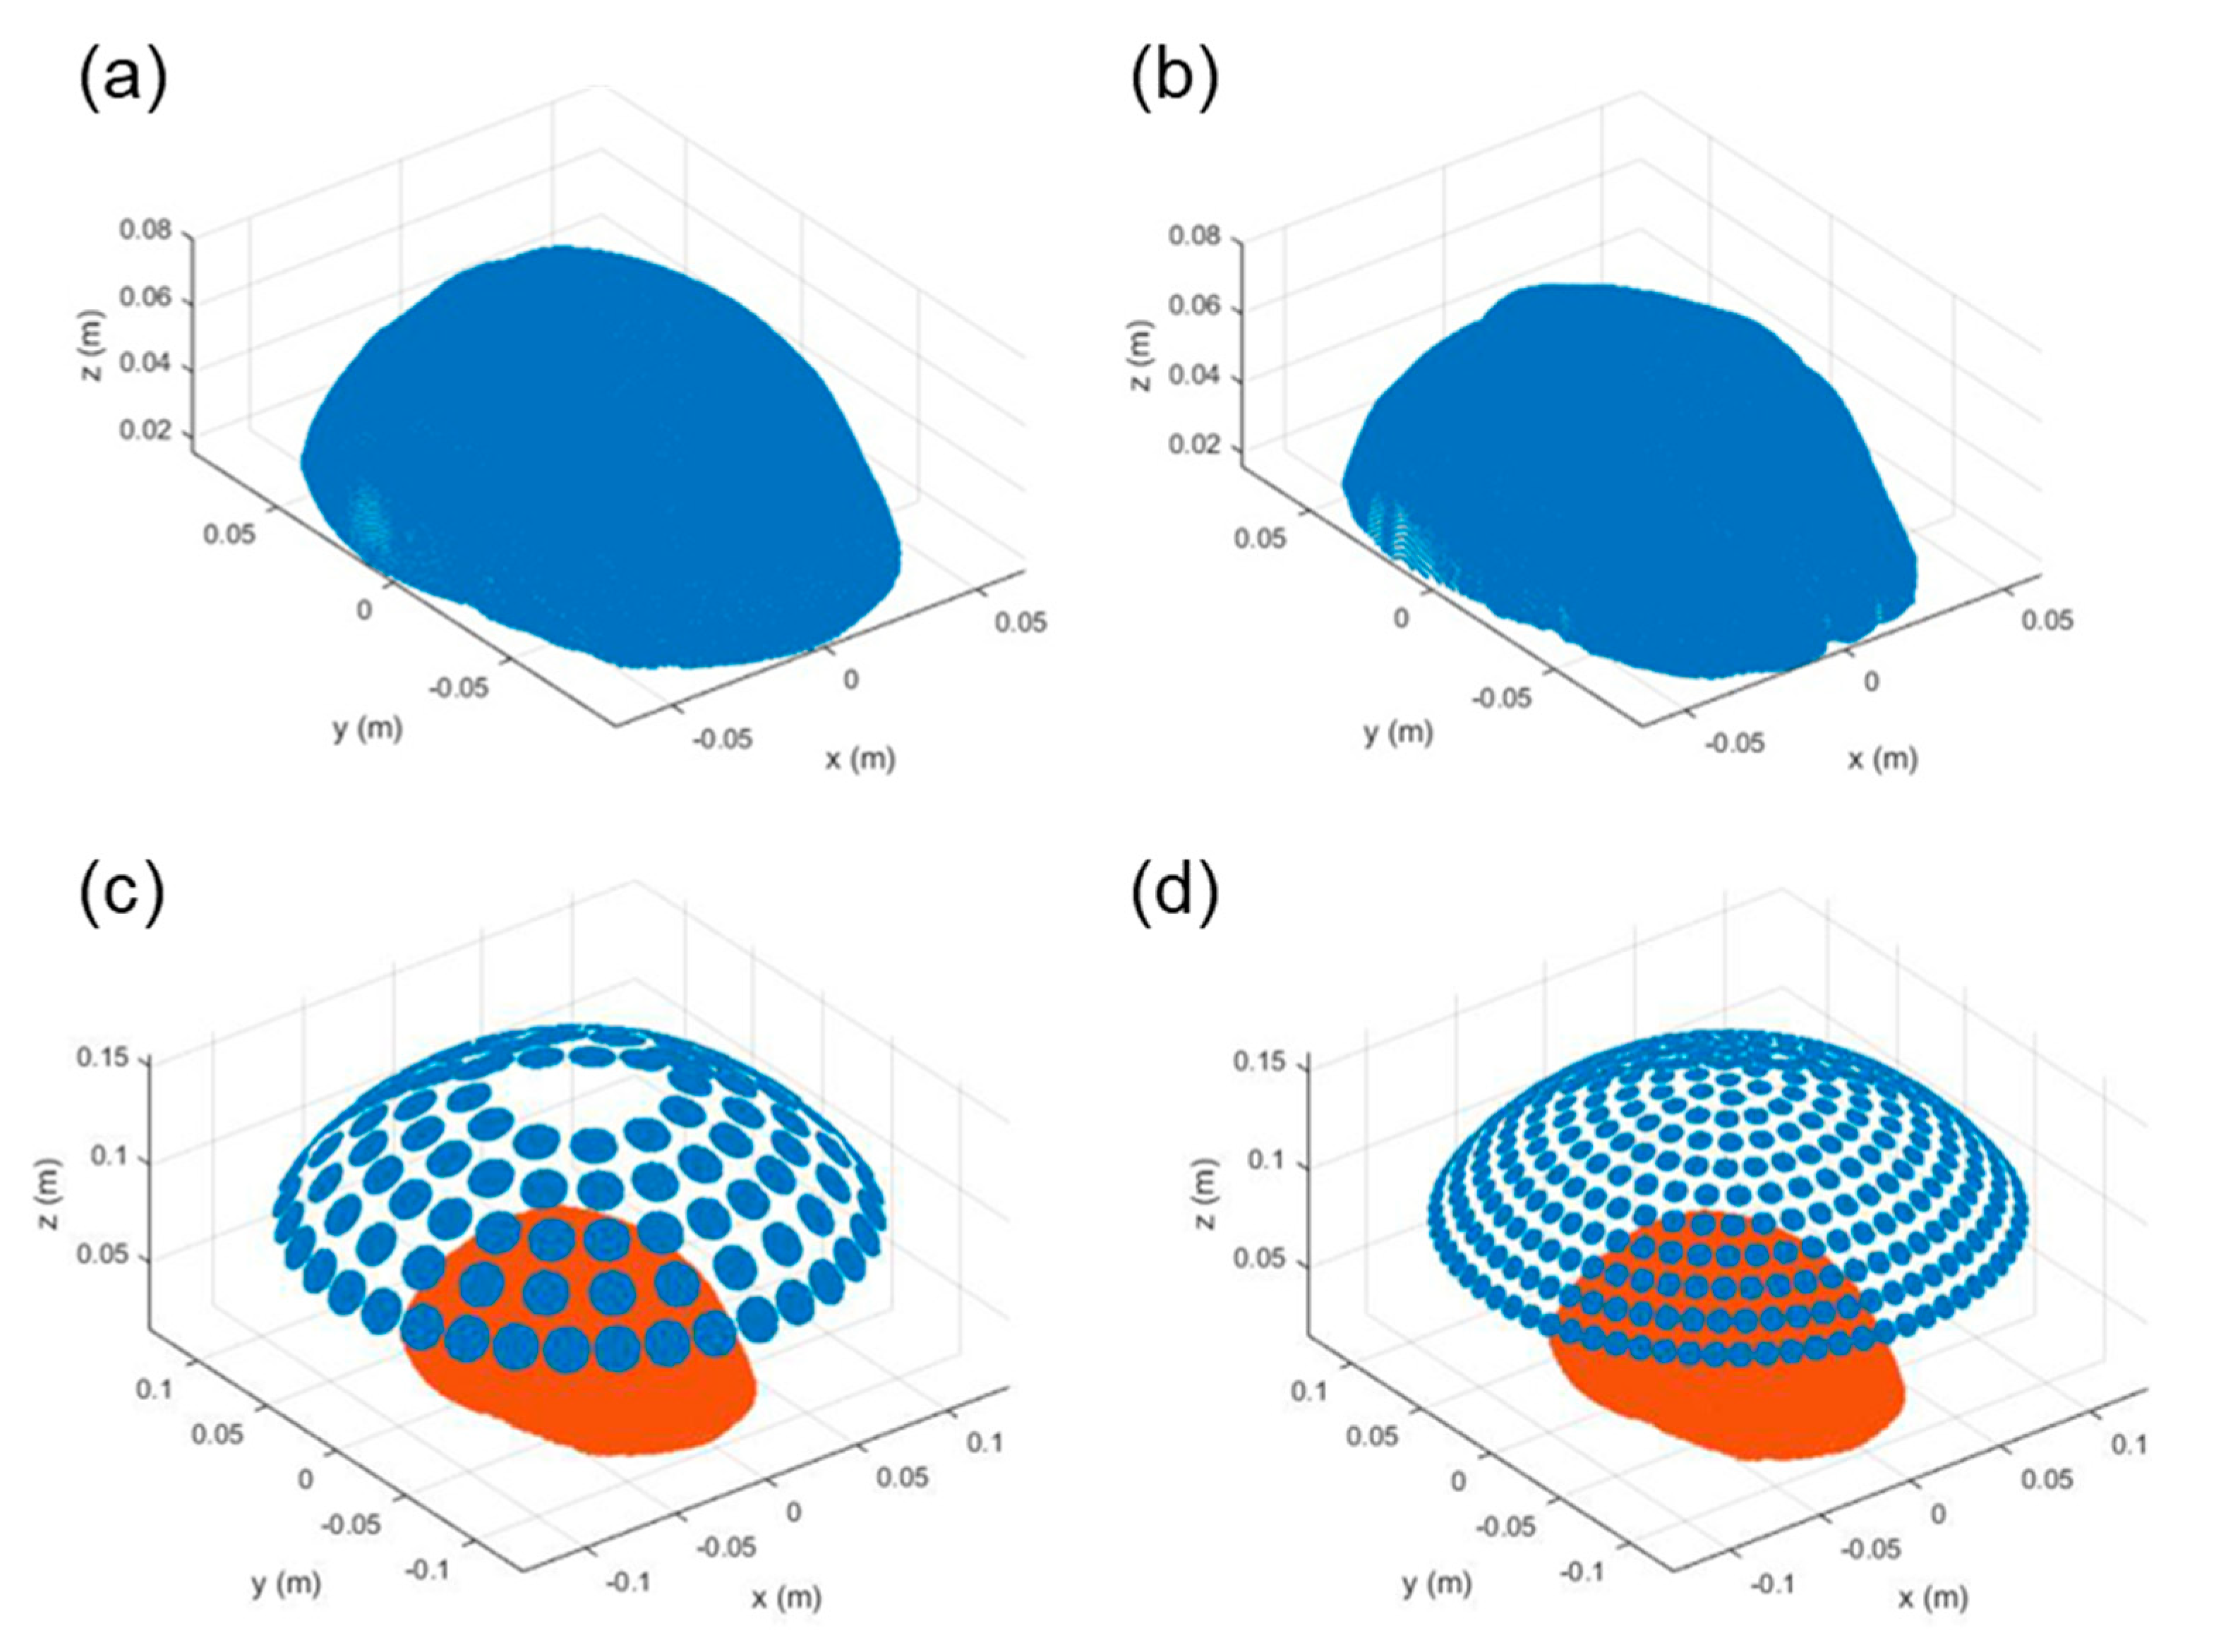
2.1. Numerical Simulations
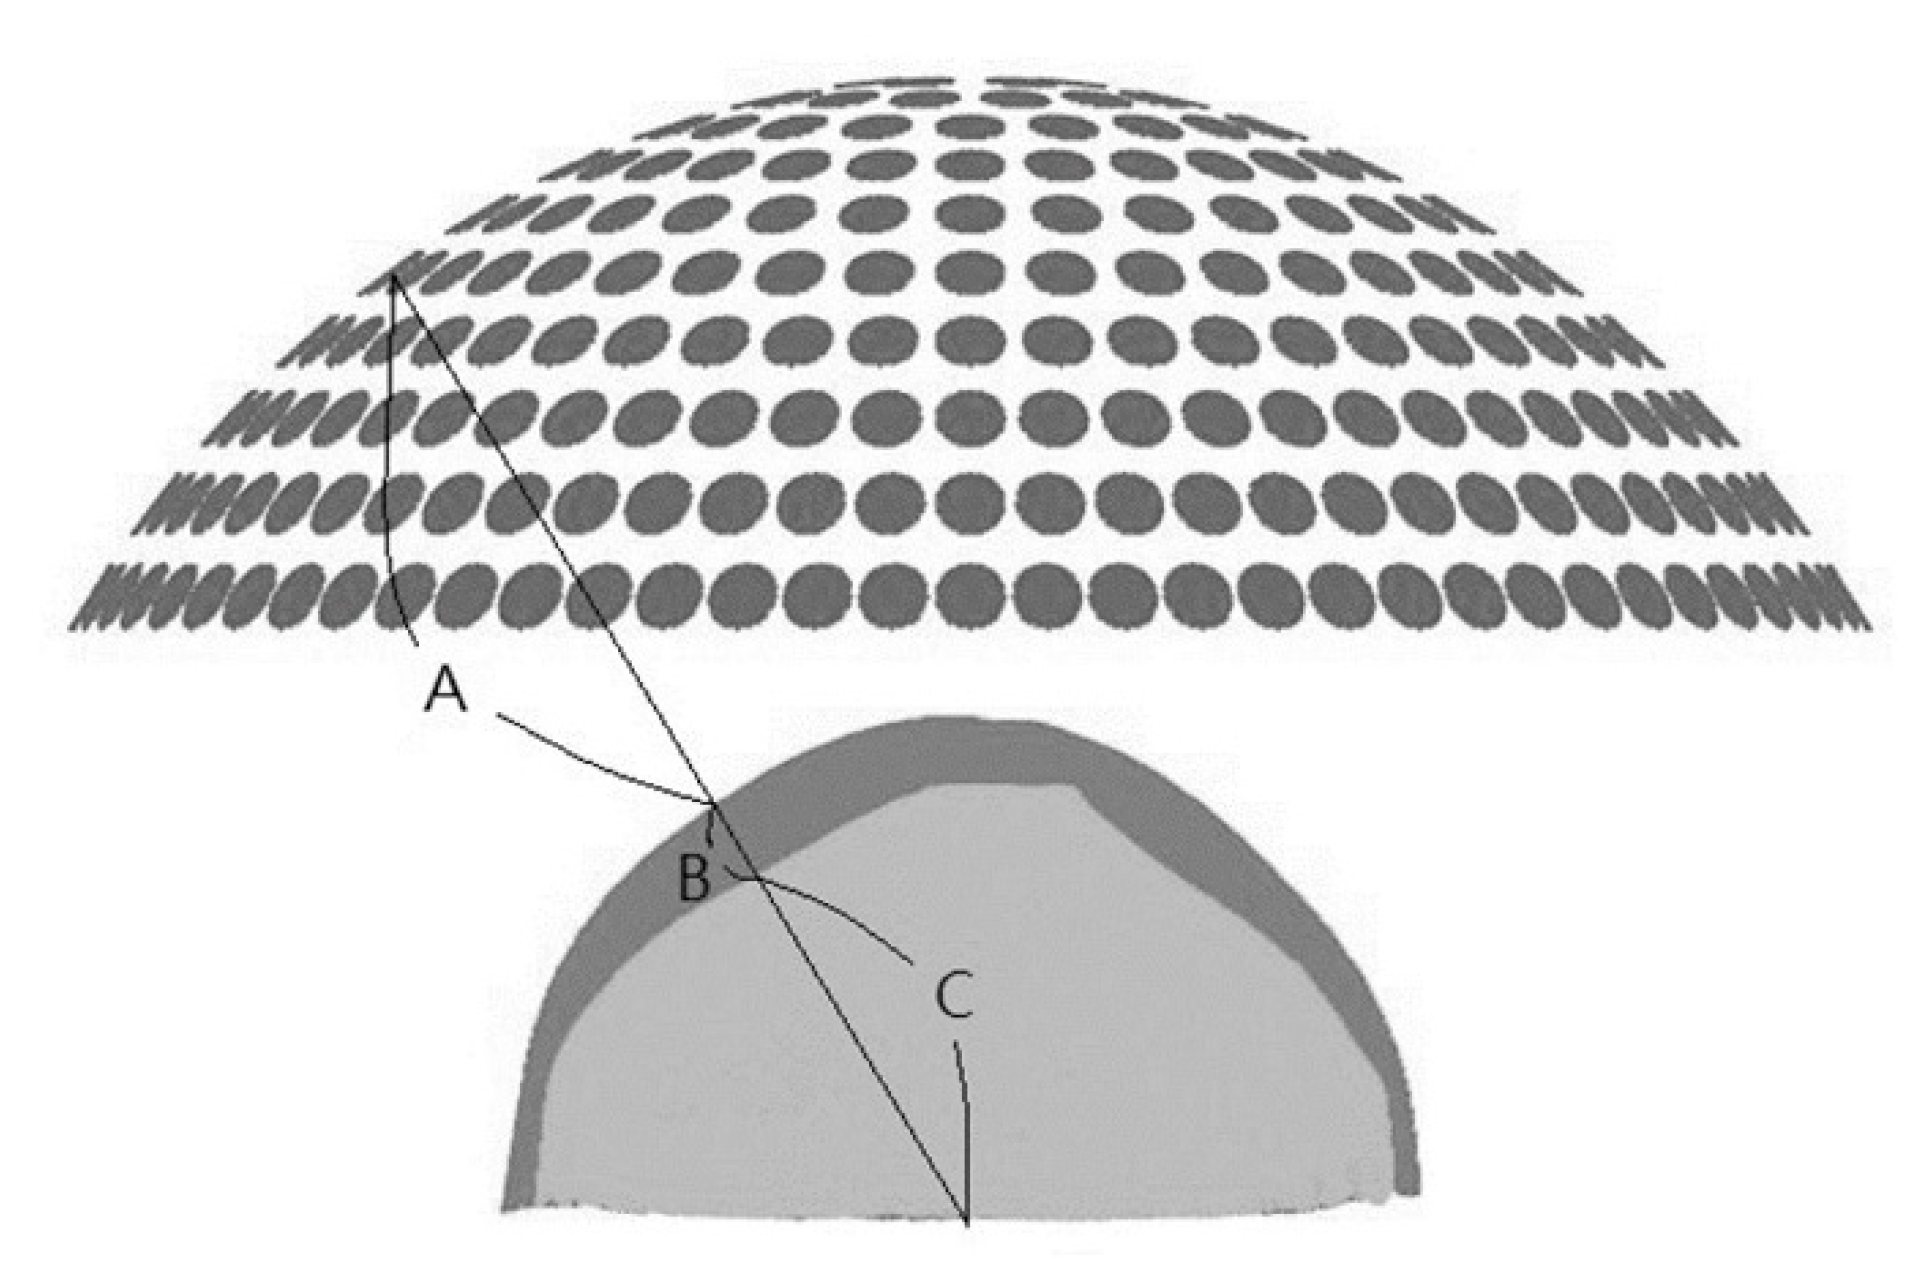
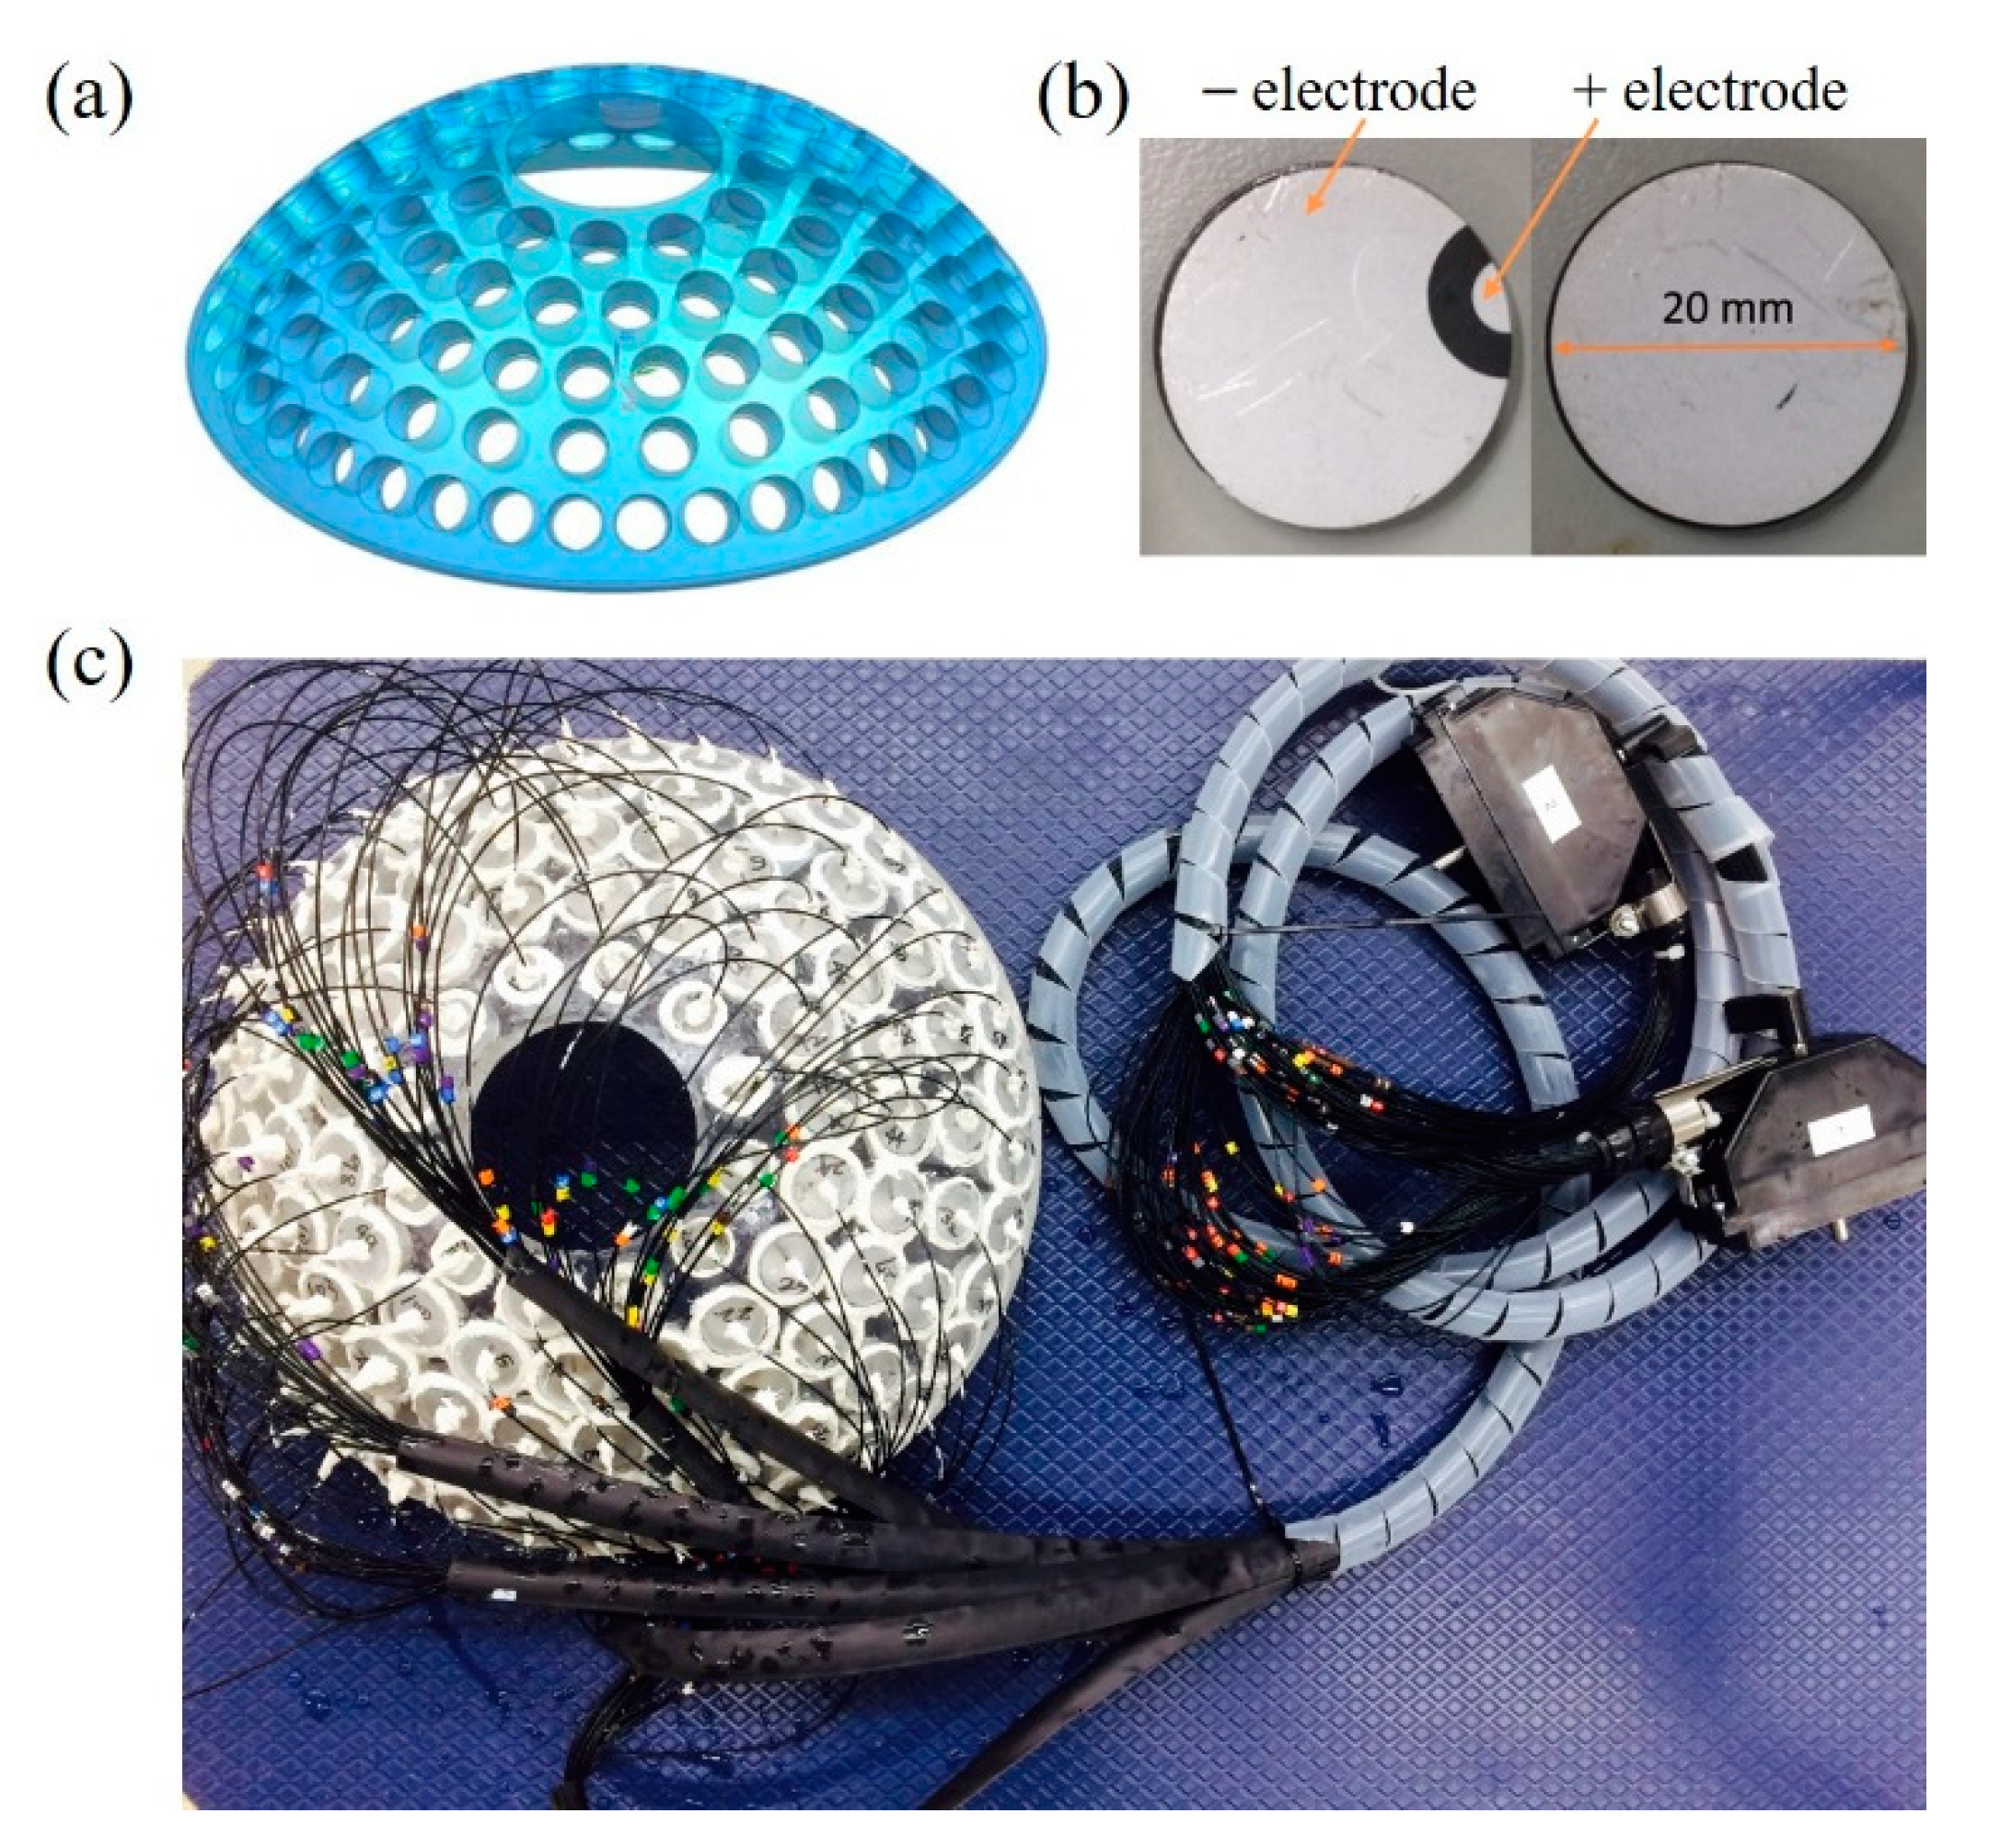
2.2. Fabrication of Phased-Array Transducer
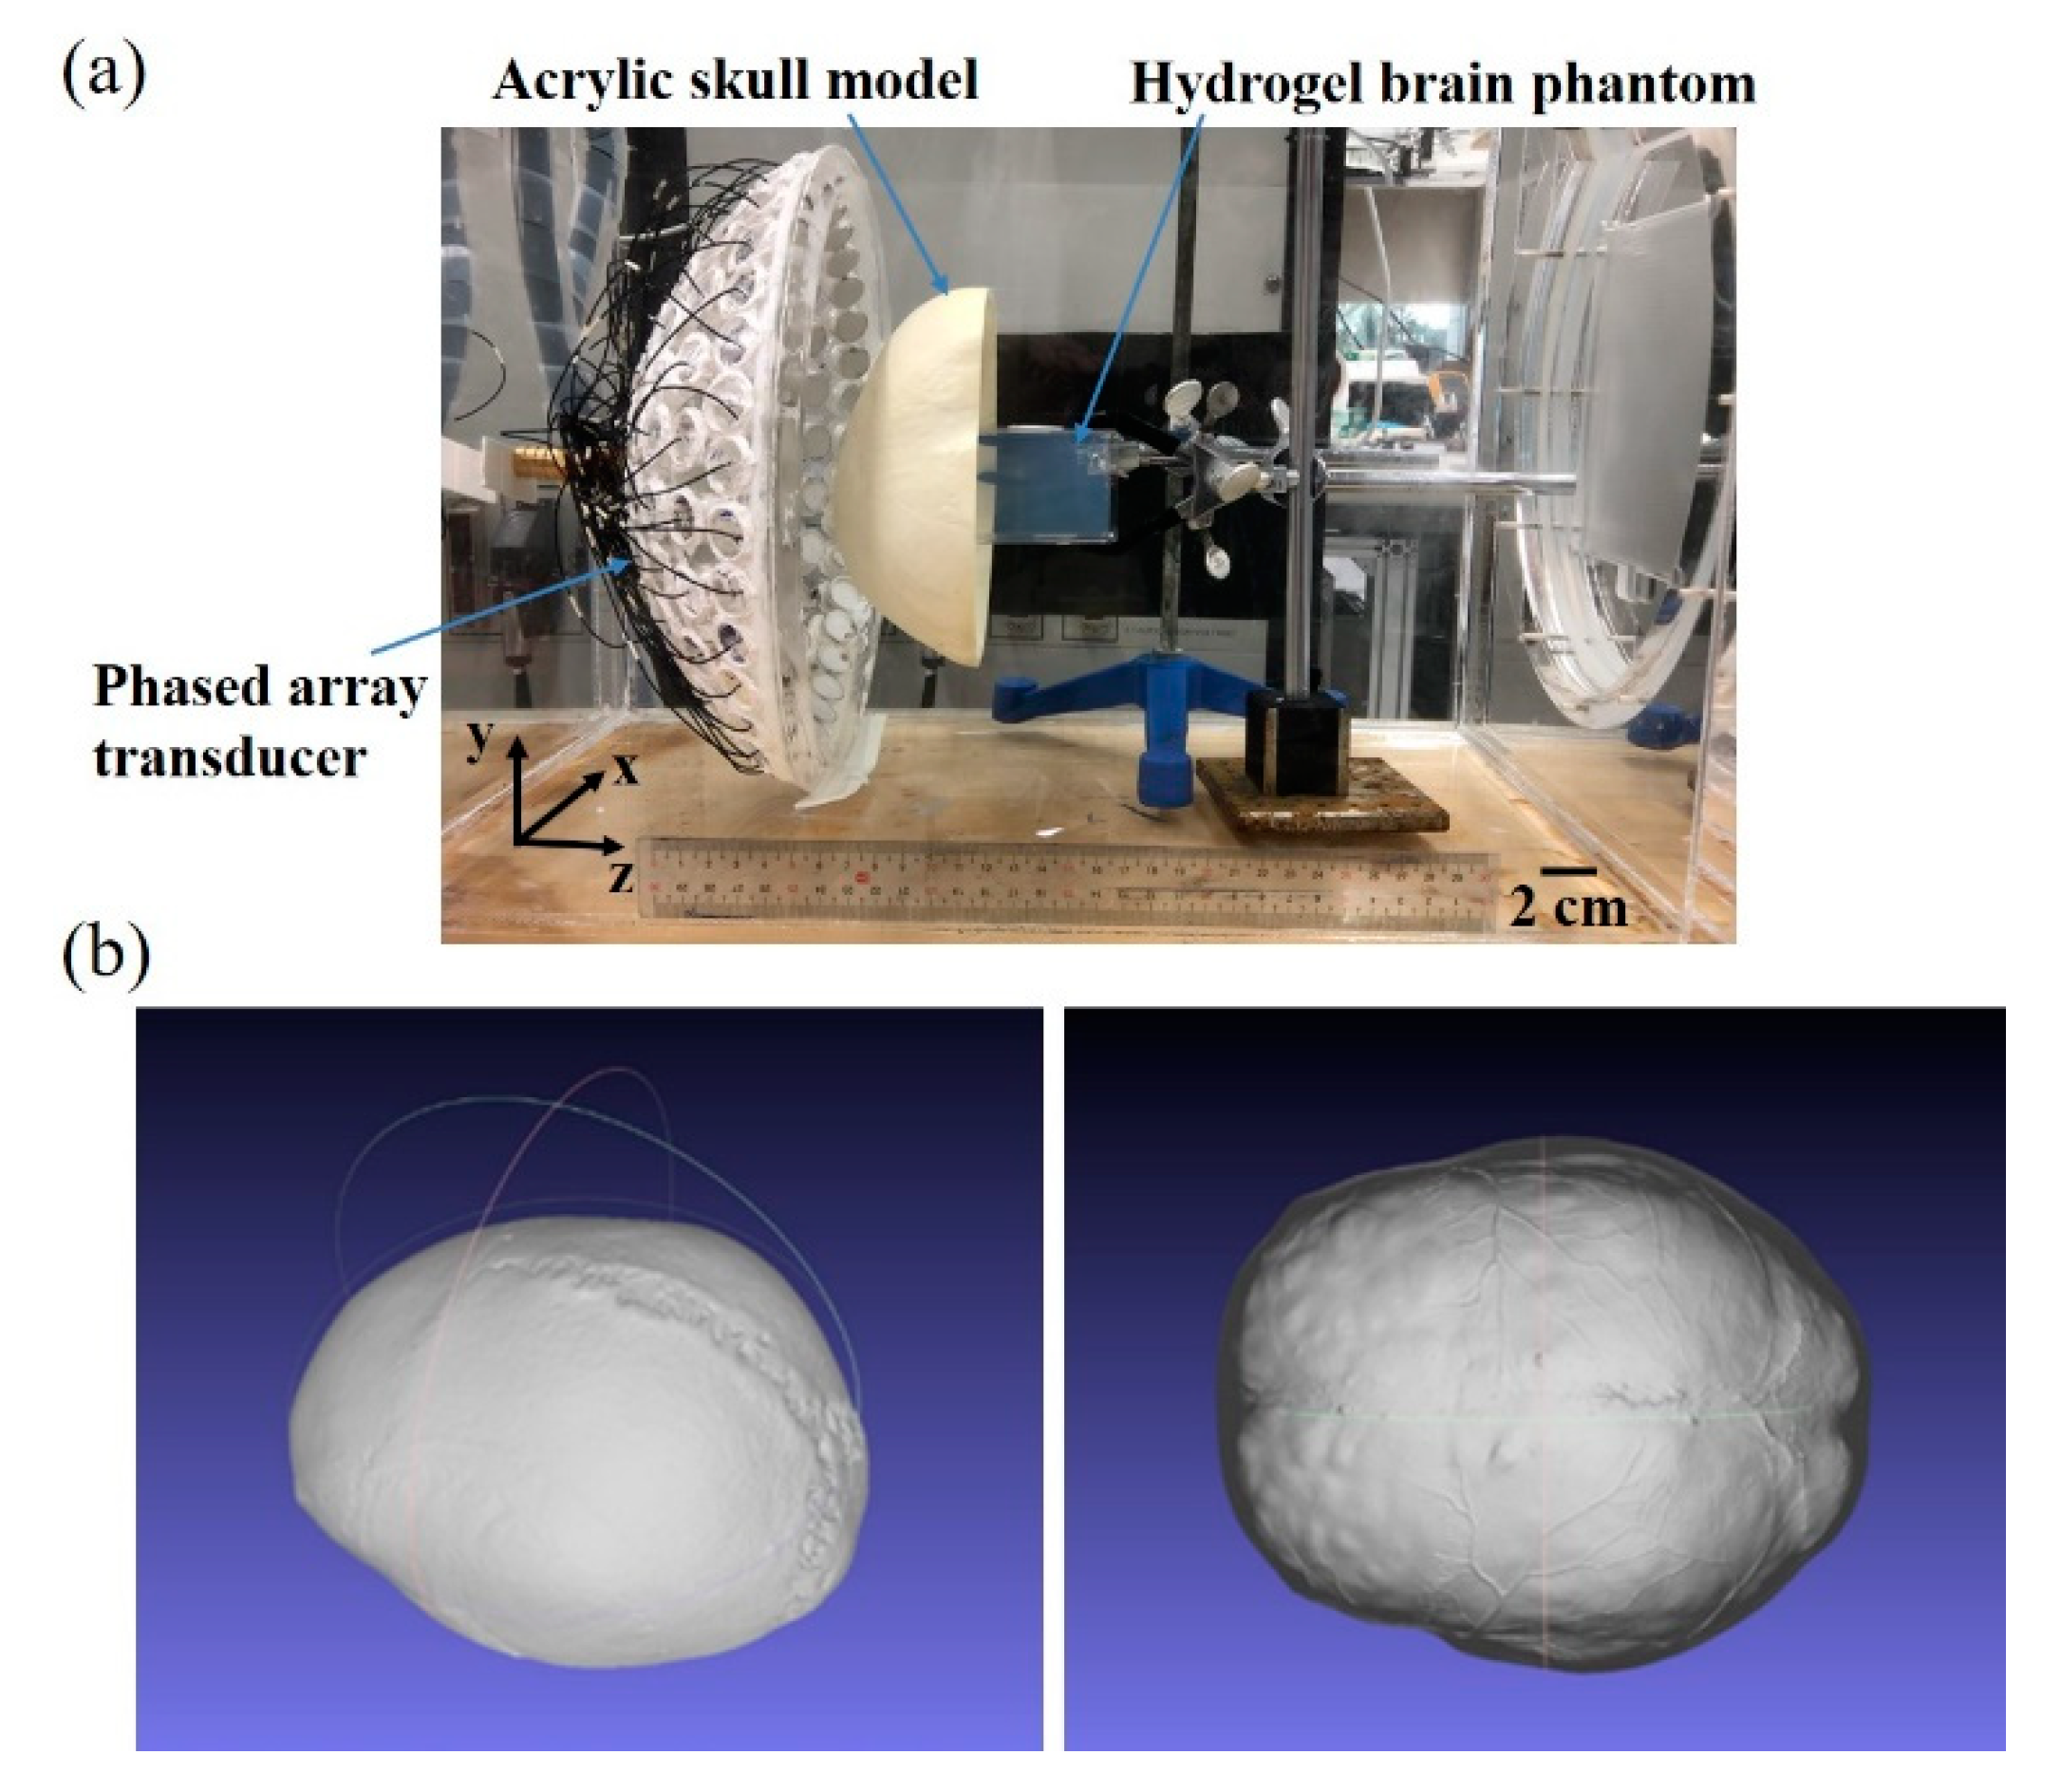
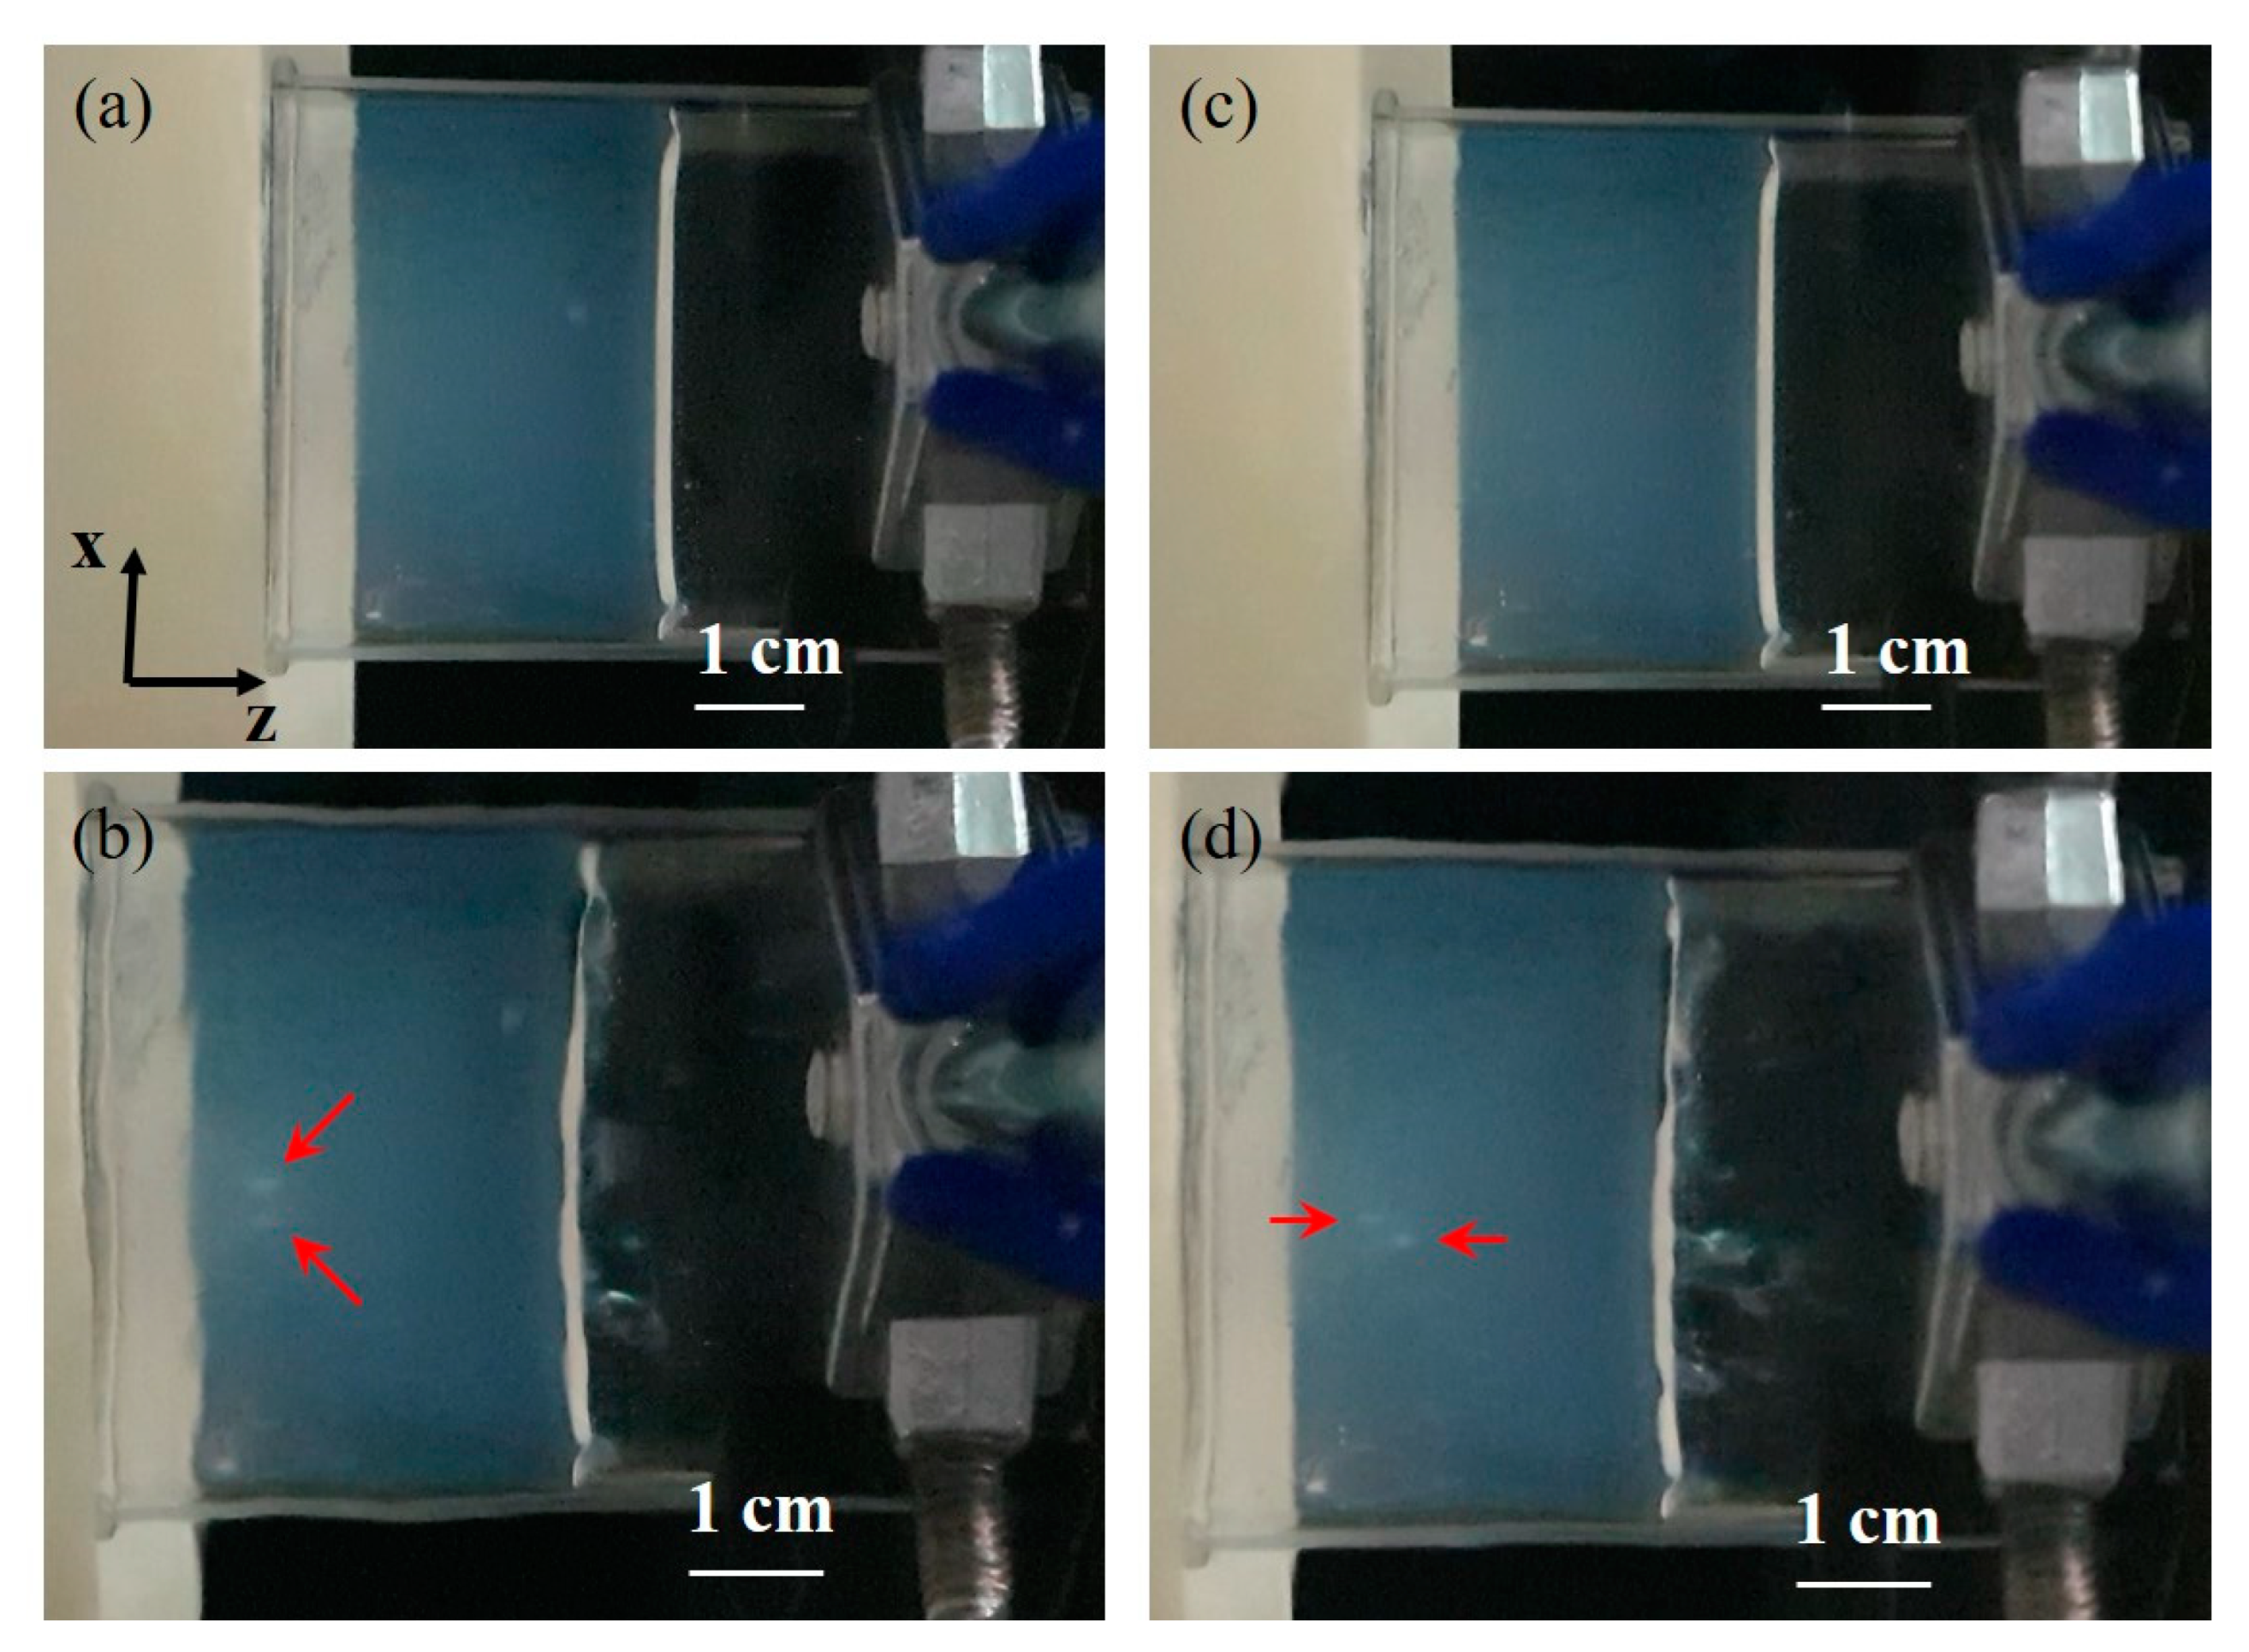
2.3. Phantom Study
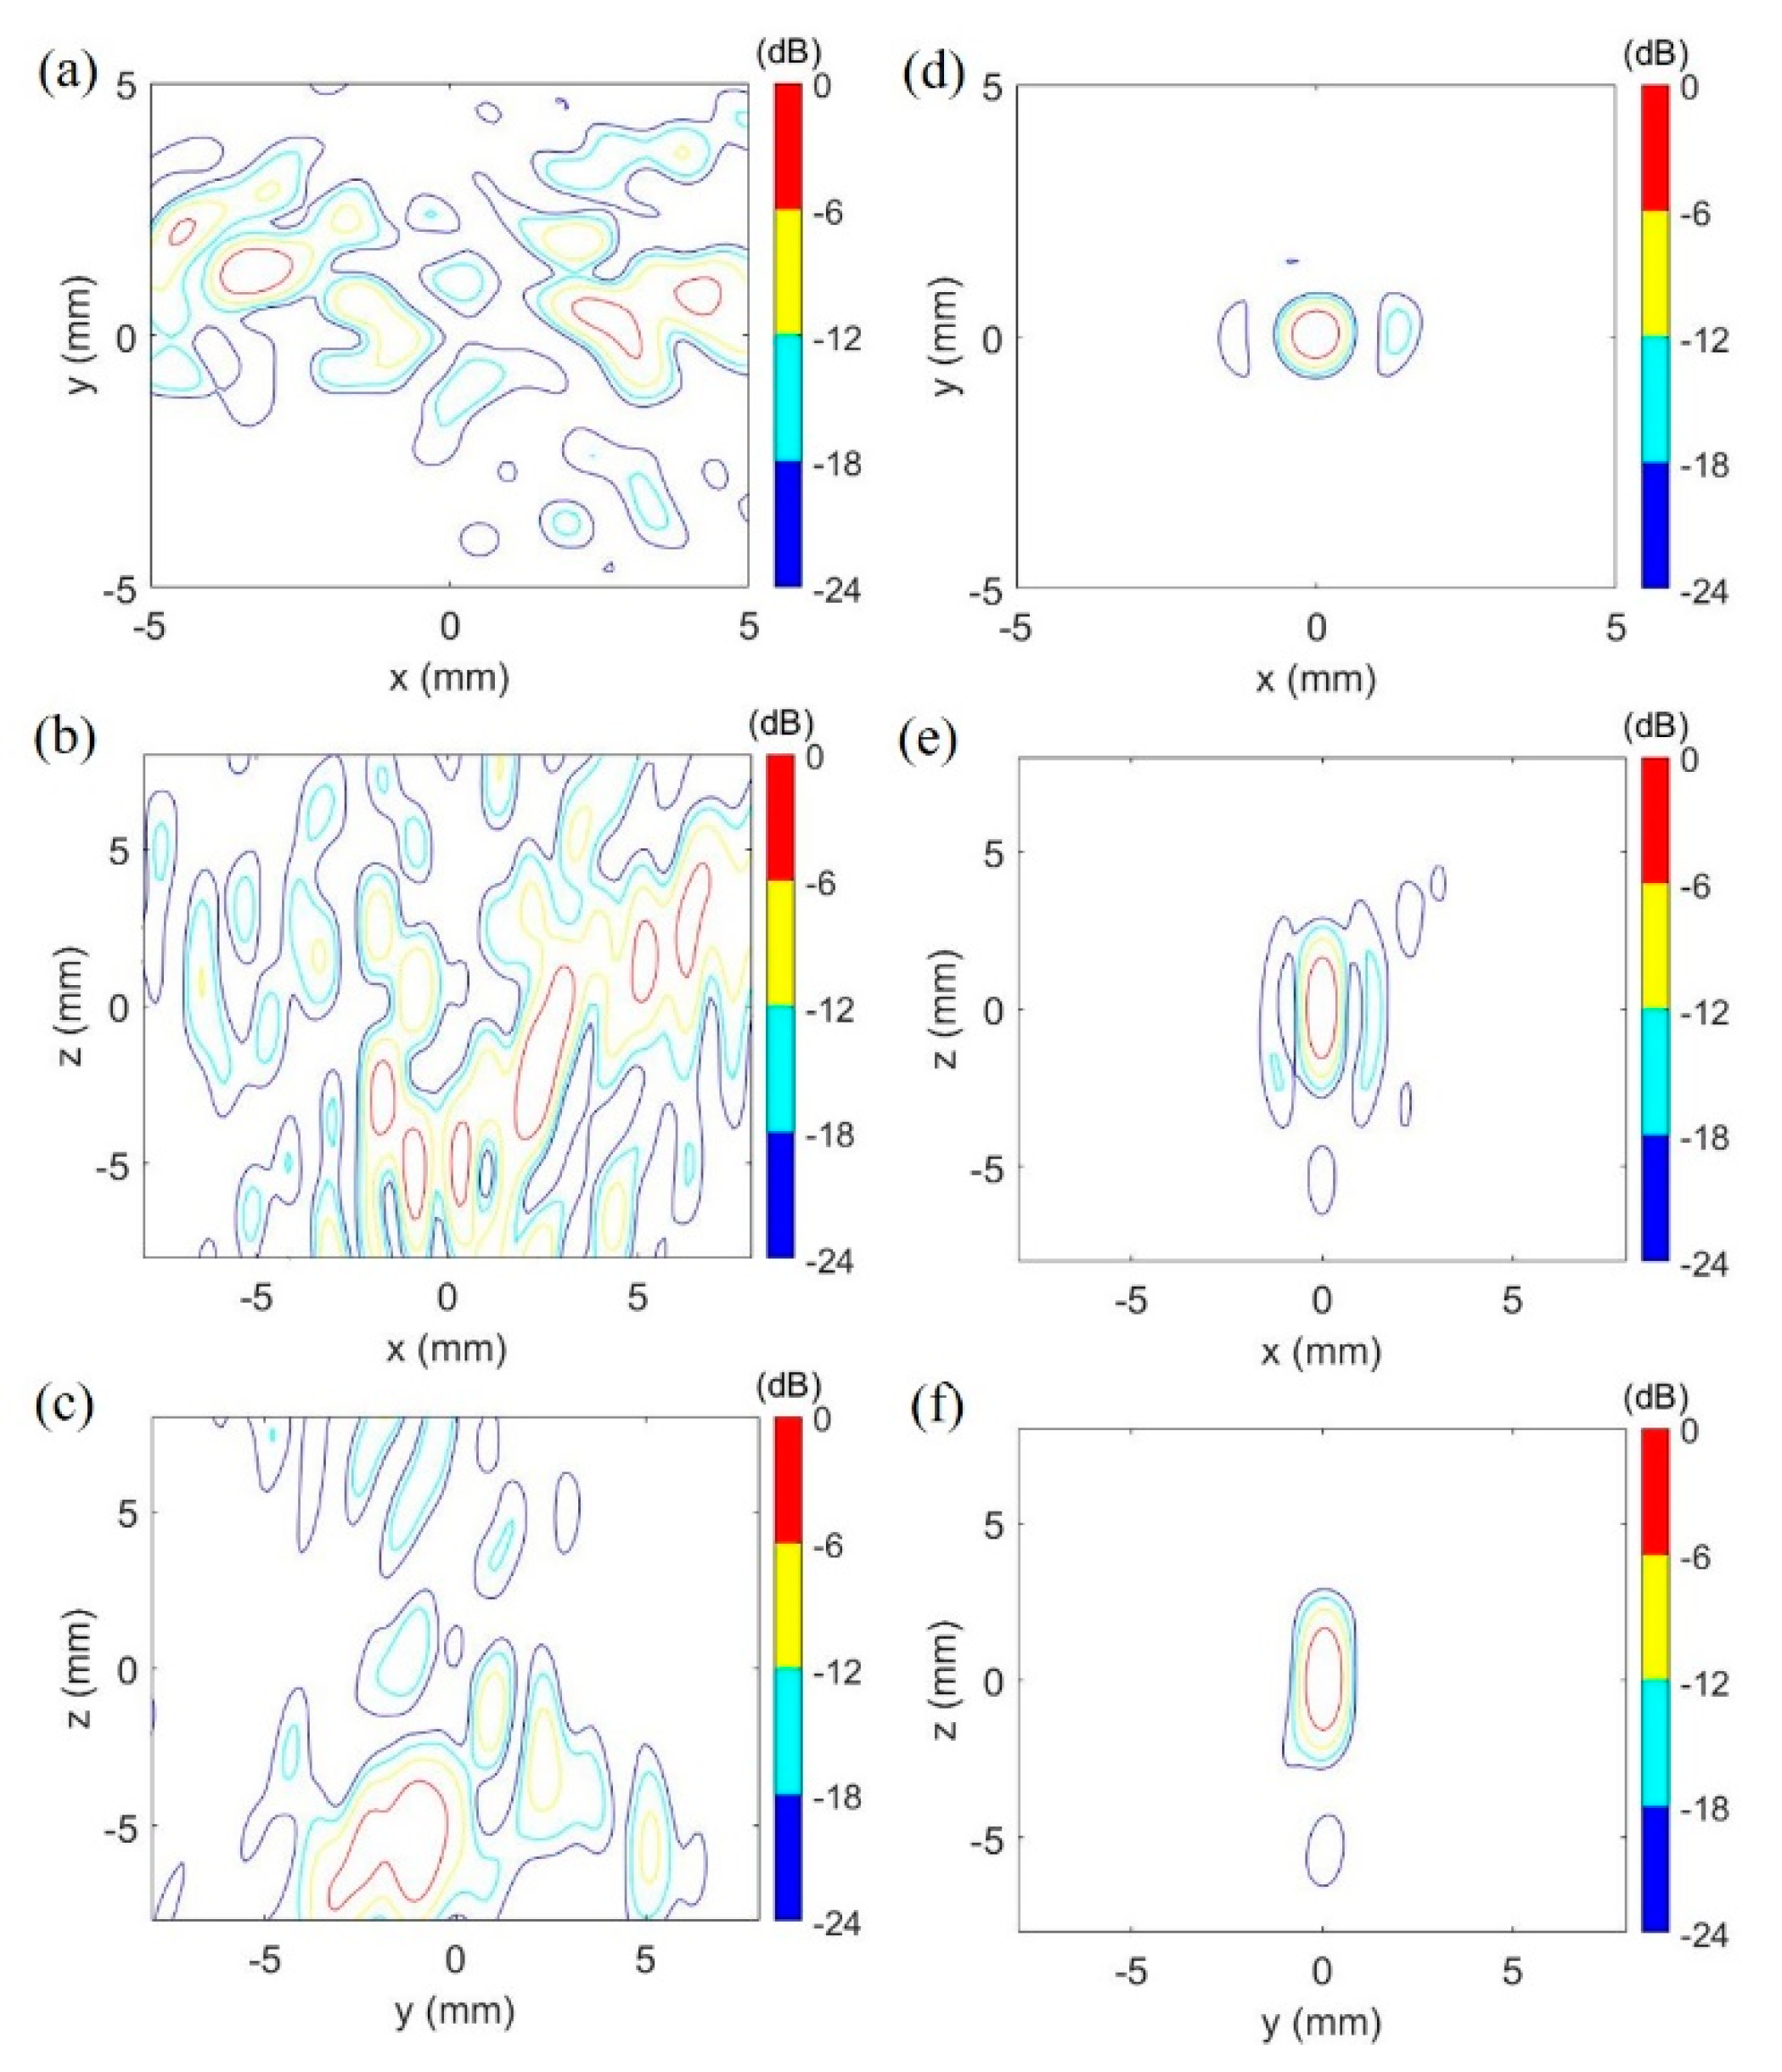
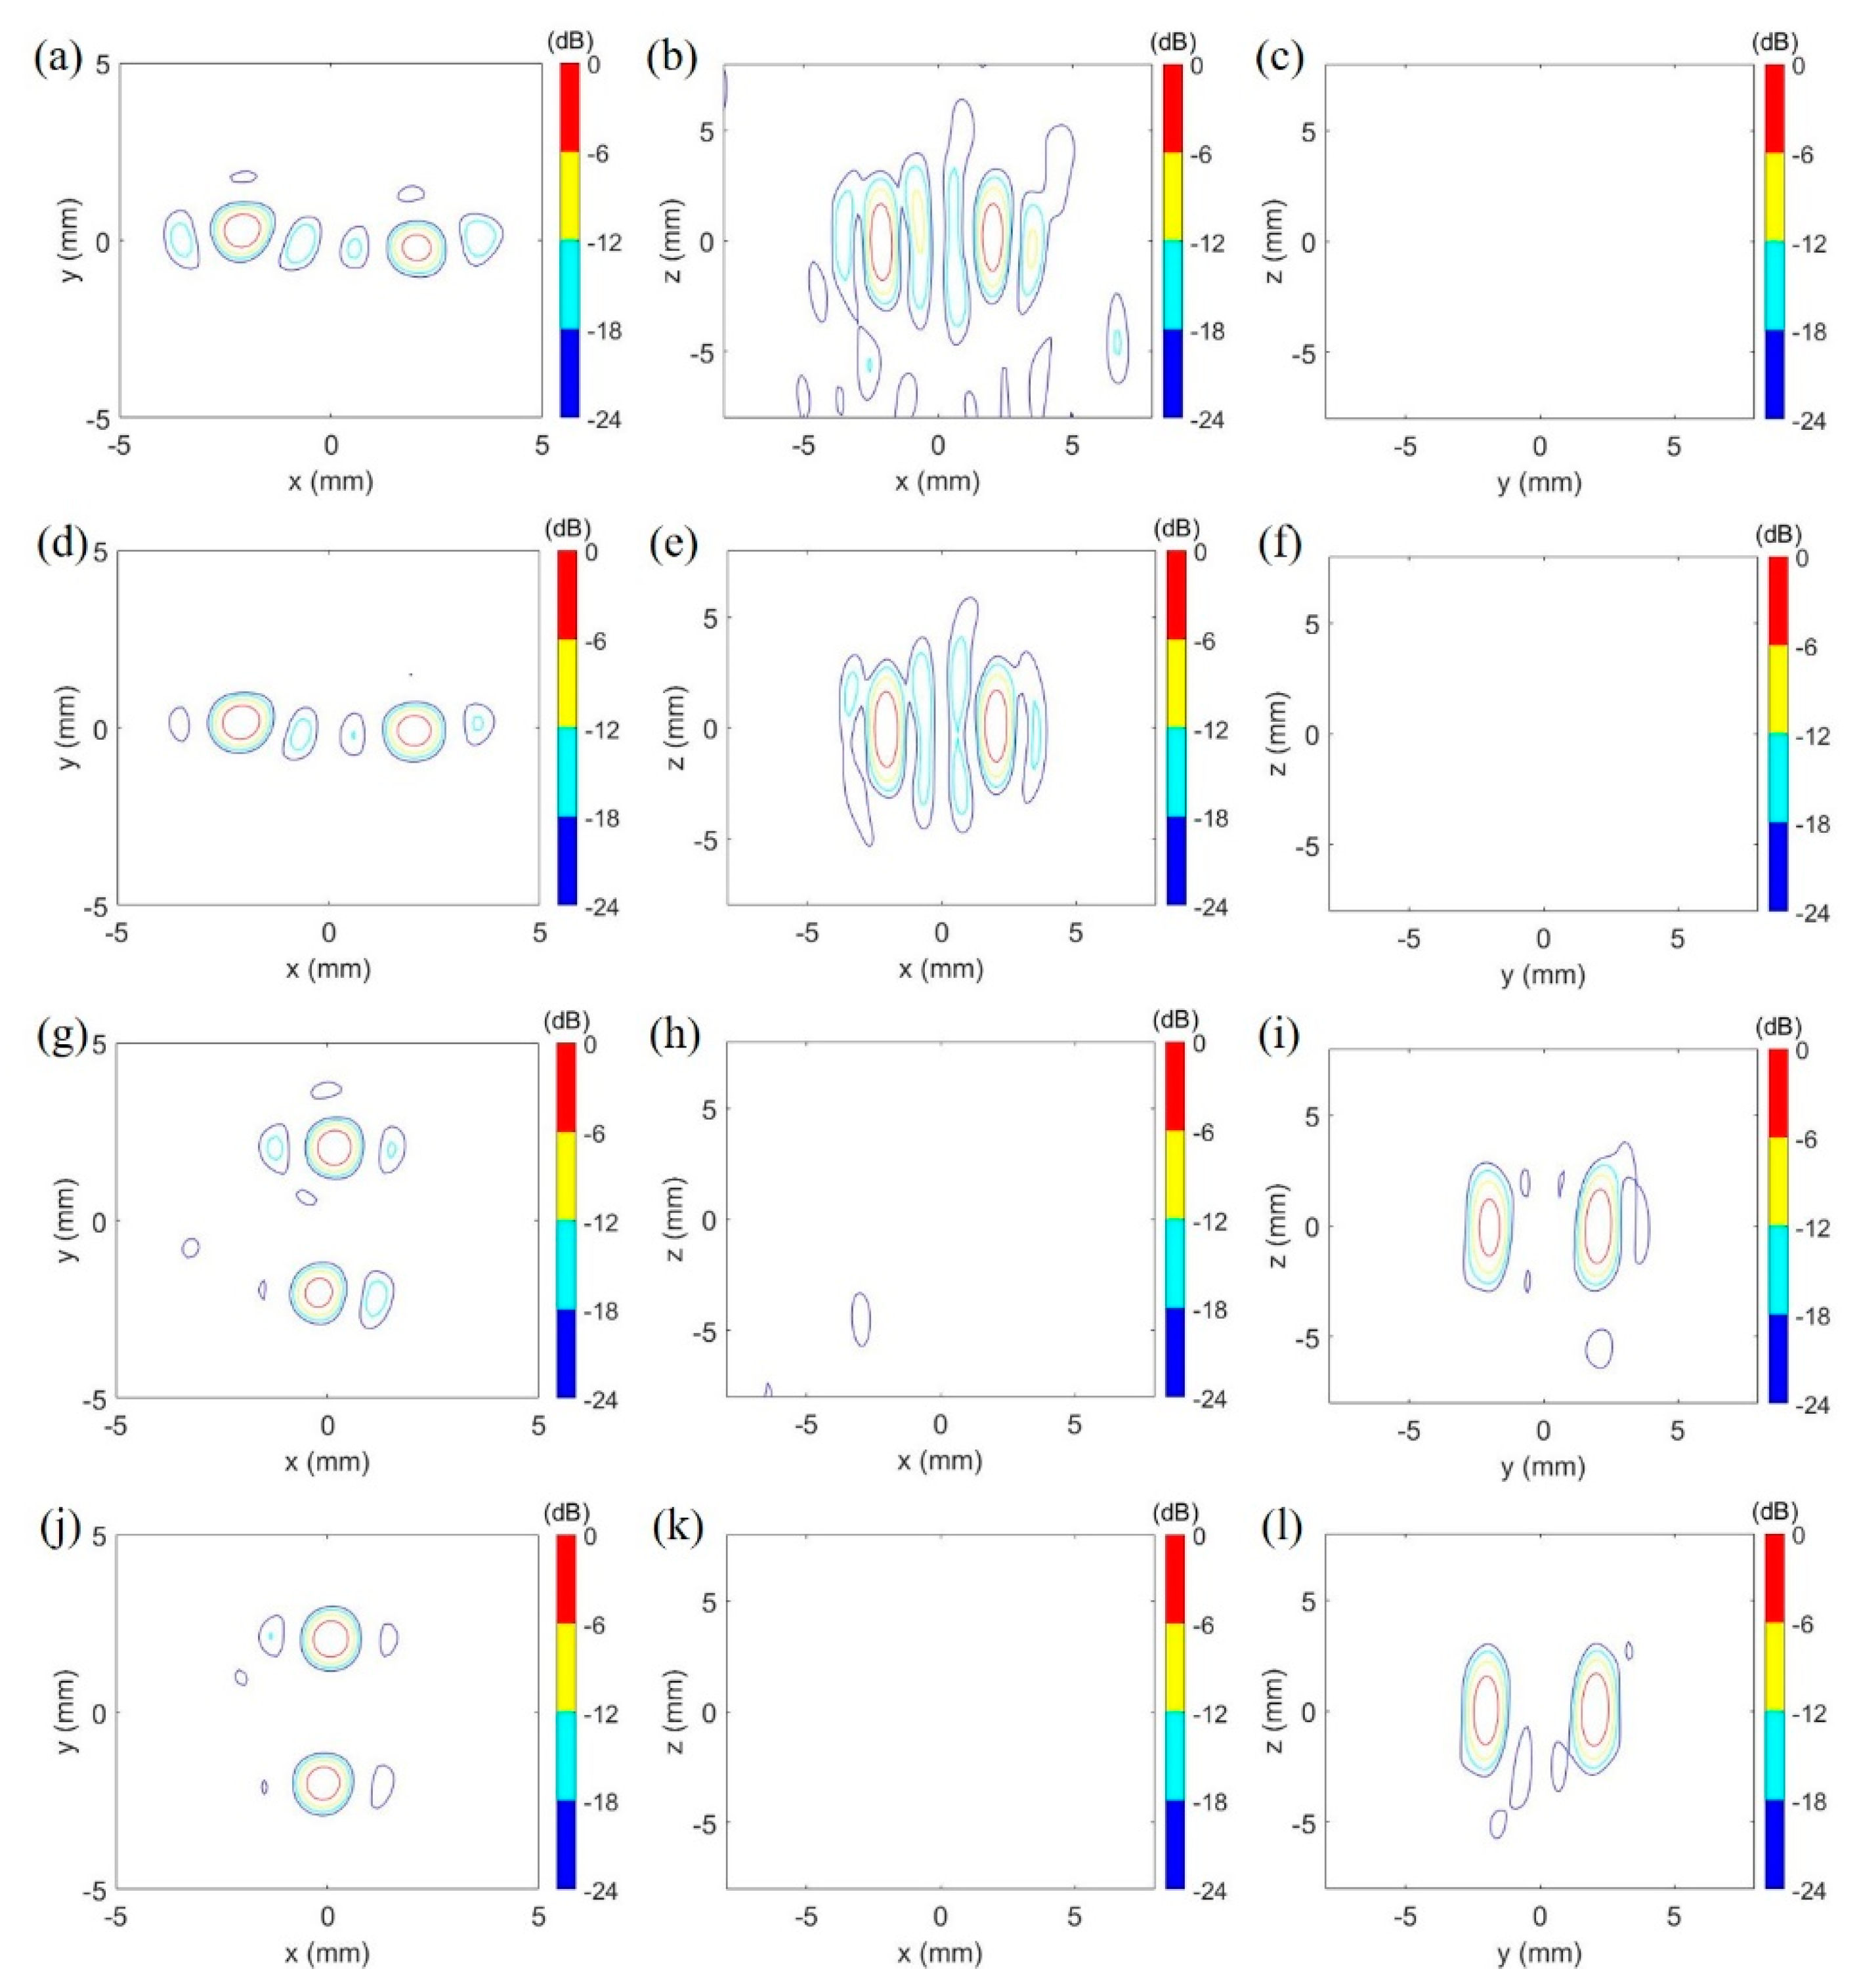
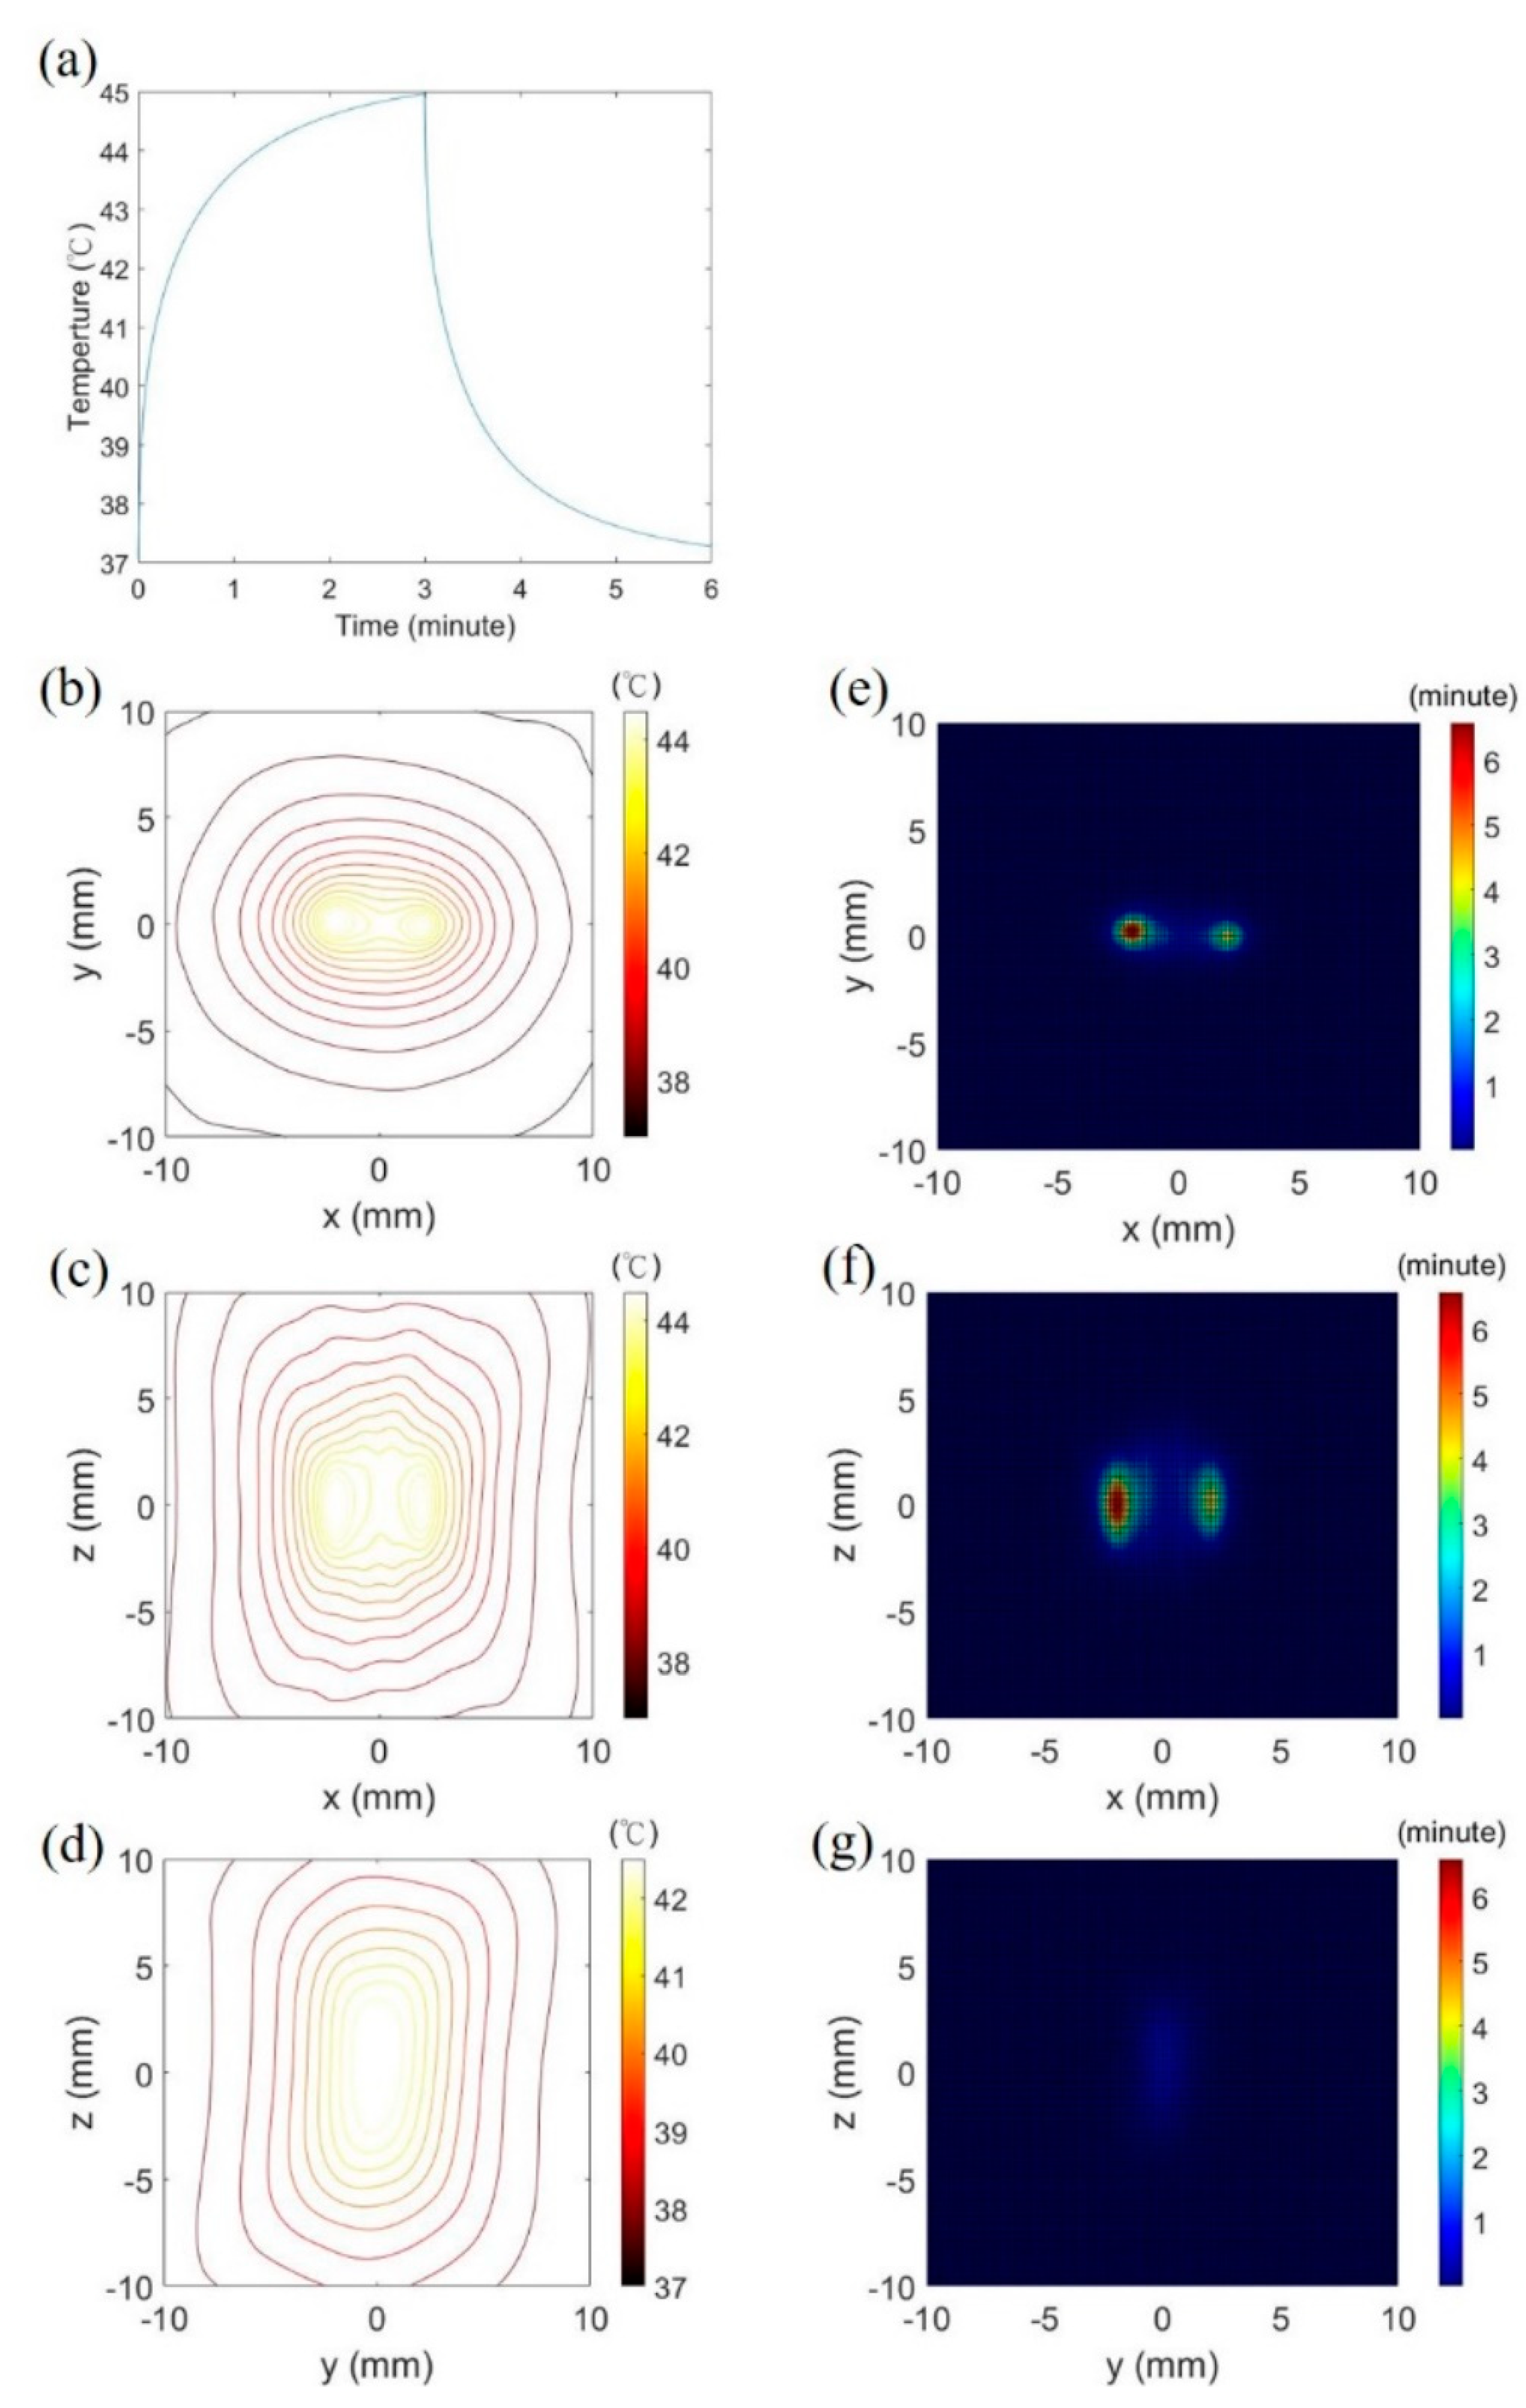
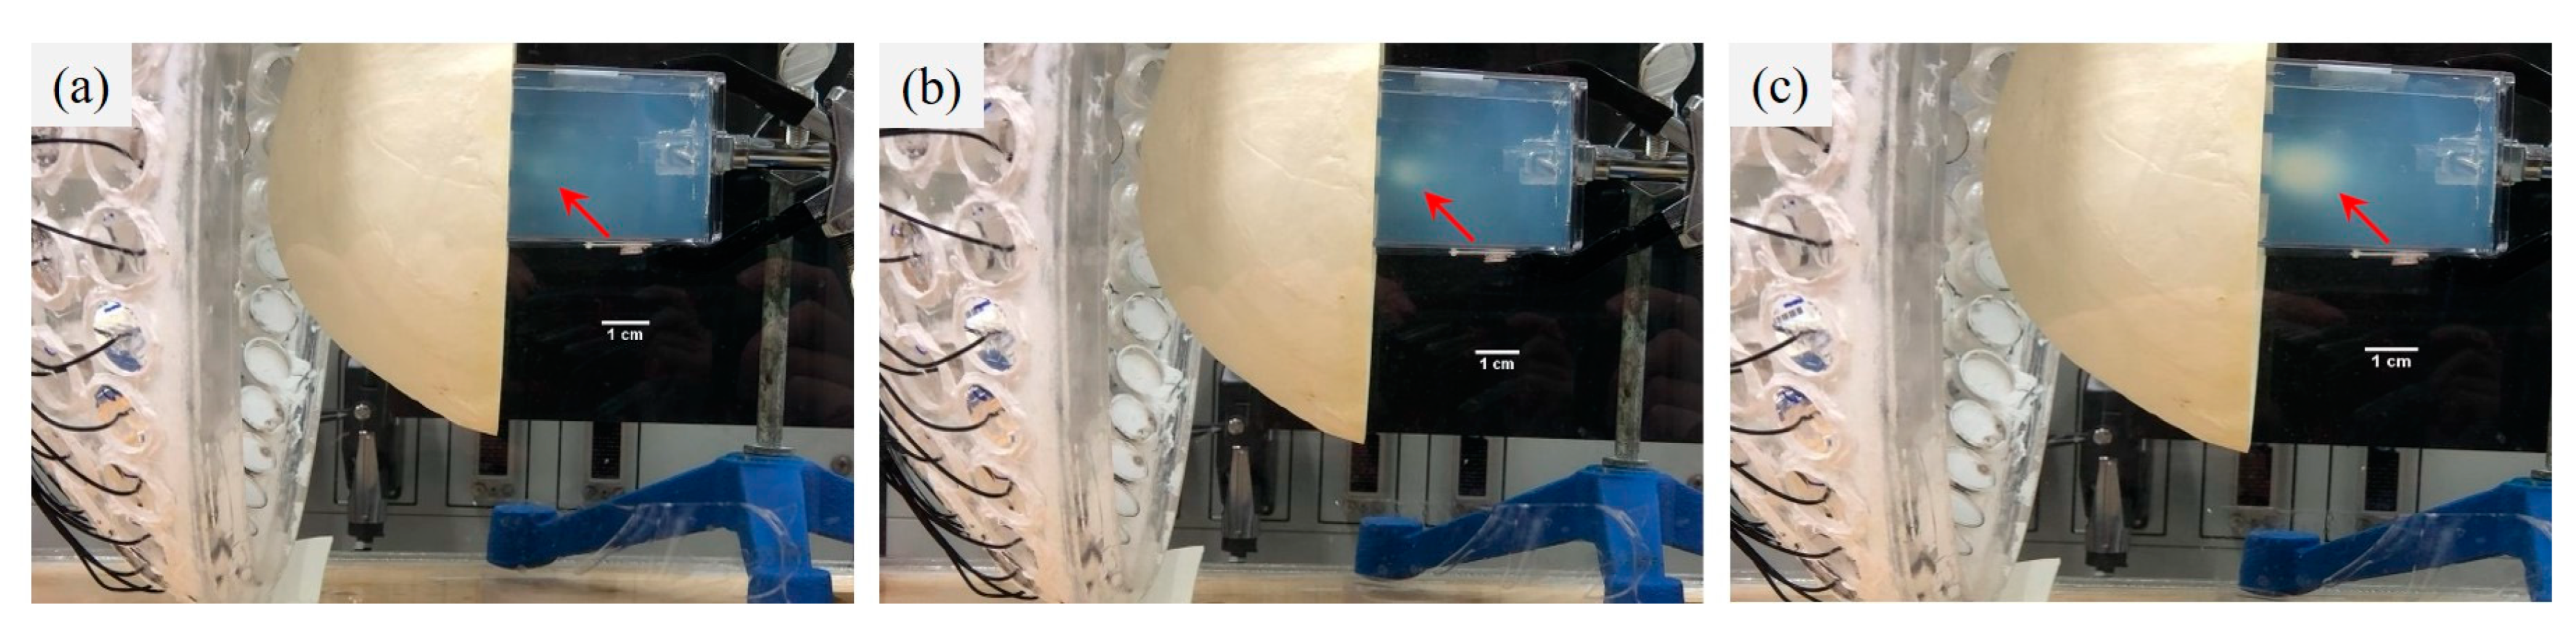
3. Results
4. Discussion
5. Conclusions
Author Contributions
Funding
Institutional Review Board Statement
Informed Consent Statement
Data Availability Statement
Conflicts of Interest
References
- McNeill, K.A. Epidemiology of Brain Tumors. Neurol. Clin. 2016, 34, 981–998. [Google Scholar] [CrossRef]
- Achrol, A.S.; Rennert, R.C.; Anders, C.; Soffietti, R.; Ahluwalia, M.S.; Nayak, L.; Peters, S.; Arvold, N.D.; Harsh, G.R.; Steeg, P.S.; et al. Brain metastases. Nat. Rev. Dis. Primers 2019, 5, 5. [Google Scholar] [CrossRef]
- Perkins, A.; Liu, G. Primary Brain Tumors in Adults: Diagnosis and Treatment. Am. Fam. Physician 2016, 93, 211–217. [Google Scholar]
- Ostrom, Q.T.; Cioffi, G.; Gittleman, H.; Patil, N.; Waite, K.; Kruchko, C.; Barnholtz-Sloan, J.S. CBTRUS Statistical Report: Primary Brain and Other Central Nervous System Tumors Diagnosed in the United States in 2012–2016. Neuro-Oncology 2019, 21, v1–v100. [Google Scholar] [CrossRef]
- De la Garza-Ramos, R.; Kerezoudis, P.; Tamargo, R.J.; Brem, H.; Huang, J.; Bydon, M. Surgical complications following malignant brain tumor surgery: An analysis of 2002-2011 data. Clin. Neurol. Neurosurg. 2016, 140, 6–10. [Google Scholar] [CrossRef]
- Nakasu, Y.; Mitsuya, K.; Deguchi, S.; Hayashi, N.; Harada, H. Surgical Resection of Metastatic Brain Tumors:Risk of Local Recurrence and Leptomeningeal Dissemination, and Implications for Individualized Treatment. No Shinkei Geka 2018, 46, 185–195. [Google Scholar] [CrossRef]
- DeVita, V.T.; Lawrence, T.S.; Rosenberg, S.A. DeVita, Hellman, and Rosenberg’s Cancer: Principles & Practice of Oncology, 11th ed.; Wolters Kluwer: Philadelphia, PA, USA, 2019; Part V, Section 10, Neoplasms of the Central Nervous System. [Google Scholar]
- Lockman, P.R.; Mittapalli, R.K.; Taskar, K.S.; Rudraraju, V.; Gril, B.; Bohn, K.A.; Adkins, C.E.; Roberts, A.; Thorsheim, H.R.; Gaasch, J.A.; et al. Heterogeneous blood-tumor barrier permeability determines drug efficacy in experimental brain metastases of breast cancer. Clin. Cancer Res. 2010, 16, 5664–5678. [Google Scholar] [CrossRef]
- Nduom, E.K.; Yang, C.; Merrill, M.J.; Zhuang, Z.; Lonser, R.R. Characterization of the blood-brain barrier of metastatic and primary malignant neoplasms. J. Neurosurg. 2013, 119, 427–433. [Google Scholar] [CrossRef]
- Murrell, D.H.; Hamilton, A.M.; Mallett, C.L.; van Gorkum, R.; Chambers, A.F.; Foster, P.J. Understanding Heterogeneity and Permeability of Brain Metastases in Murine Models of HER2-Positive Breast Cancer Through Magnetic Resonance Imaging: Implications for Detection and Therapy. Transl. Oncol. 2015, 8, 176–184. [Google Scholar] [CrossRef]
- Morikawa, A.; Peereboom, D.M.; Thorsheim, H.R.; Samala, R.; Balyan, R.; Murphy, C.G.; Lockman, P.R.; Simmons, A.; Weil, R.J.; Tabar, V.; et al. Capecitabine and lapatinib uptake in surgically resected brain metastases from metastatic breast cancer patients: A prospective study. Neuro-Oncology 2015, 17, 289–295. [Google Scholar] [CrossRef]
- Heldin, C.H.; Rubin, K.; Pietras, K.; Ostman, A. High interstitial fluid pressure—An obstacle in cancer therapy. Nat. Rev. Cancer 2004, 4, 806–813. [Google Scholar] [CrossRef]
- Cepeda, V.; Fuertes, M.A.; Castilla, J.; Alonso, C.; Quevedo, C.; Perez, J.M. Biochemical mechanisms of cisplatin cytotoxicity. Anticancer Agents Med. Chem. 2007, 7, 3–18. [Google Scholar] [CrossRef]
- Silvani, A.; Gaviani, P.; Lamperti, E.A.; Eoli, M.; Falcone, C.; Dimeco, F.; Milanesi, I.M.; Erbetta, A.; Boiardi, A.; Fariselli, L.; et al. Cisplatinum and BCNU chemotherapy in primary glioblastoma patients. J. Neurooncol. 2009, 94, 57–62. [Google Scholar] [CrossRef]
- Abrahao, A.; Meng, Y.; Llinas, M.; Huang, Y.; Hamani, C.; Mainprize, T.; Aubert, I.; Heyn, C.; Black, S.E.; Hynynen, K.; et al. First-in-human trial of blood-brain barrier opening in amyotrophic lateral sclerosis using MR-guided focused ultrasound. Nat. Commun. 2019, 10, 4373. [Google Scholar] [CrossRef]
- Kamimura, H.A.; Flament, J.; Valette, J.; Cafarelli, A.; Aron Badin, R.; Hantraye, P.; Larrat, B. Feedback control of microbubble cavitation for ultrasound-mediated blood-brain barrier disruption in non-human primates under magnetic resonance guidance. J. Cereb. Blood Flow Metab. 2019, 39, 1191–1203. [Google Scholar] [CrossRef]
- McDannold, N.; Vykhodtseva, N.; Hynynen, K. Blood-brain barrier disruption induced by focused ultrasound and circulating preformed microbubbles appears to be characterized by the mechanical index. Ultrasound Med. Biol. 2008, 34, 834–840. [Google Scholar] [CrossRef]
- Ohmoto, Y.; Fujisawa, H.; Ishikawa, T.; Koizumi, H.; Matsuda, T.; Ito, H. Sequential changes in cerebral blood flow, early neuropathological consequences and blood-brain barrier disruption following radiofrequency-induced localized hyperthermia in the rat. Int. J. Hyperth. 1996, 12, 321–334. [Google Scholar] [CrossRef]
- McDannold, N.; Vykhodtseva, N.; Jolesz, F.A.; Hynynen, K. MRI investigation of the threshold for thermally induced blood-brain barrier disruption and brain tissue damage in the rabbit brain. Magn. Reason. Med. 2004, 51, 913–923. [Google Scholar] [CrossRef]
- Kiyatkin, E.A.; Sharma, H.S. Permeability of the blood-brain barrier depends on brain temperature. Neuroscience 2009, 161, 926–939. [Google Scholar] [CrossRef]
- Zagar, T.M.; Vujaskovic, Z.; Formenti, S.; Rugo, H.; Muggia, F.; O’Connor, B.; Myerson, R.; Stauffer, P.; Hsu, I.C.; Diederich, C.; et al. Two phase I dose-escalation/pharmacokinetics studies of low temperature liposomal doxorubicin (LTLD) and mild local hyperthermia in heavily pretreated patients with local regionally recurrent breast cancer. Int. J. Hyperth. 2014, 30, 285–294. [Google Scholar] [CrossRef]
- Lyon, P.C.; Gray, M.D.; Mannaris, C.; Folkes, L.K.; Stratford, M.; Campo, L.; Chung, D.Y.F.; Scott, S.; Anderson, M.; Goldin, R.; et al. Safety and feasibility of ultrasound-triggered targeted drug delivery of doxorubicin from thermosensitive liposomes in liver tumours (TARDOX): A single-centre, open-label, phase 1 trial. Lancet Oncol. 2018, 19, 1027–1039. [Google Scholar] [CrossRef] [Green Version]
- Moriyama, E.; Salcman, M.; Broadwell, R.D. Blood-brain barrier alteration after microwave-induced hyperthermia is purely a thermal effect: I. Temperature and power measurements. Surg. Neurol. 1991, 35, 177–182. [Google Scholar] [CrossRef]
- Friedl, J.; Turner, E.; Alexander, H.R., Jr. Augmentation of endothelial cell monolayer permeability by hyperthermia but not tumor necrosis factor: Evidence for disruption of vascular integrity via VE-cadherin down-regulation. Int. J. Oncol. 2003, 23, 611–616. [Google Scholar] [CrossRef] [PubMed]
- Song, C.W. Effect of local hyperthermia on blood flow and microenvironment: A review. Cancer Res. 1984, 44, 4721s–4730s. [Google Scholar] [PubMed]
- Watson, K.D.; Lai, C.Y.; Qin, S.; Kruse, D.E.; Lin, Y.C.; Seo, J.W.; Cardiff, R.D.; Mahakian, L.M.; Beegle, J.; Ingham, E.S.; et al. Ultrasound increases nanoparticle delivery by reducing intratumoral pressure and increasing transport in epithelial and epithelial-mesenchymal transition tumors. Cancer Res. 2012, 72, 1485–1493. [Google Scholar] [CrossRef]
- Stapleton, S.; Dunne, M.; Milosevic, M.; Tran, C.W.; Gold, M.J.; Vedadi, A.; McKee, T.D.; Ohashi, P.S.; Allen, C.; Jaffray, D.A. Radiation and Heat Improve the Delivery and Efficacy of Nanotherapeutics by Modulating Intratumoral Fluid Dynamics. ACS Nano 2018, 12, 7583–7600. [Google Scholar] [CrossRef]
- Csoboz, B.; Balogh, G.E.; Kusz, E.; Gombos, I.; Peter, M.; Crul, T.; Gungor, B.; Haracska, L.; Bogdanovics, G.; Torok, Z.; et al. Membrane fluidity matters: Hyperthermia from the aspects of lipids and membranes. Int. J. Hyperth. 2013, 29, 491–499. [Google Scholar] [CrossRef]
- Ikeda, N.; Hayashida, O.; Kameda, H.; Ito, H.; Matsuda, T. Experimental study on thermal damage to dog normal brain. Int. J. Hyperth. 1994, 10, 553–561. [Google Scholar] [CrossRef]
- Bredlau, A.L.; Motamarry, A.; Chen, C.; McCrackin, M.A.; Helke, K.; Armeson, K.E.; Bynum, K.; Broome, A.M.; Haemmerich, D. Localized delivery of therapeutic doxorubicin dose across the canine blood-brain barrier with hyperthermia and temperature sensitive liposomes. Drug Deliv. 2018, 25, 973–984. [Google Scholar] [CrossRef]
- Nakagawa, M.; Matsumoto, K.; Higashi, H.; Furuta, T.; Ohmoto, T. Acute effects of interstitial hyperthermia on normal monkey brain--magnetic resonance imaging appearance and effects on blood-brain barrier. Neurol. Med. Chir. 1994, 34, 668–675. [Google Scholar] [CrossRef]
- Choi, M.; Ku, T.; Chong, K.; Yoon, J.; Choi, C. Minimally invasive molecular delivery into the brain using optical modulation of vascular permeability. Proc. Natl. Acad. Sci. USA 2011, 108, 9256–9261. [Google Scholar] [CrossRef] [Green Version]
- Leuthardt, E.C.; Duan, C.; Kim, M.J.; Campian, J.L.; Kim, A.H.; Miller-Thomas, M.M.; Shimony, J.S.; Tran, D.D. Hyperthermic Laser Ablation of Recurrent Glioblastoma Leads to Temporary Disruption of the Peritumoral Blood Brain Barrier. PLoS ONE 2016, 11, e0148613. [Google Scholar] [CrossRef]
- Lizzi, F.L.; Ostromogilsky, M. Analytical modelling of ultrasonically induced tissue heating. Ultrasound Med. Biol. 1987, 13, 607–618. [Google Scholar] [CrossRef]
- Prada, F.; Kalani, M.Y.S.; Yagmurlu, K.; Norat, P.; Del Bene, M.; DiMeco, F.; Kassell, N.F. Applications of Focused Ultrasound in Cerebrovascular Diseases and Brain Tumors. Neurotherapeutics 2019, 16, 67–87. [Google Scholar] [CrossRef] [PubMed]
- Wu, S.K.; Chiang, C.F.; Hsu, Y.H.; Lin, T.H.; Liou, H.C.; Fu, W.M.; Lin, W.L. Short-time focused ultrasound hyperthermia enhances liposomal doxorubicin delivery and antitumor efficacy for brain metastasis of breast cancer. Int. J. Nanomed. 2014, 9, 4485–4494. [Google Scholar] [CrossRef]
- Wu, S.K.; Chiang, C.F.; Hsu, Y.H.; Liou, H.C.; Fu, W.M.; Lin, W.L. Pulsed-wave low-dose ultrasound hyperthermia selectively enhances nanodrug delivery and improves antitumor efficacy for brain metastasis of breast cancer. Ultrason. Sonochem. 2017, 36, 198–205. [Google Scholar] [CrossRef]
- Chiang, C.F.; Hsu, Y.H.; Liu, C.C.; Liang, P.C.; Miaw, S.C.; Lin, W.L. Pulsed-wave Ultrasound Hyperthermia Enhanced Nanodrug Delivery Combined with Chloroquine Exerts Effective Antitumor Response and Postpones Recurrence. Sci. Rep. 2019, 9, 12448. [Google Scholar] [CrossRef]
- Ostrom, Q.T.; Gittleman, H.; Liao, P.; Rouse, C.; Chen, Y.; Dowling, J.; Wolinsky, Y.; Kruchko, C.; Barnholtz-Sloan, J. CBTRUS statistical report: Primary brain and central nervous system tumors diagnosed in the United States in 2007–2011. Neuro-Oncology 2014, 16 (Suppl 4), iv1–iv63. [Google Scholar] [CrossRef]
- Urbanska, K.; Sokolowska, J.; Szmidt, M.; Sysa, P. Glioblastoma multiforme—An overview. Contemp. Oncol. 2014, 18, 307–312. [Google Scholar] [CrossRef]
- Ebbini, E.S.; Cain, C.A. A spherical-section ultrasound phased array applicator for deep localized hyperthermia. IEEE Trans. Biomed. Eng. 1991, 38, 634–643. [Google Scholar] [CrossRef]
- Hand, J.W.; Shaw, A.; Sadhoo, N.; Rajagopal, S.; Dickinson, R.J.; Gavrilov, L.R. A random phased array device for delivery of high intensity focused ultrasound. Phys. Med. Biol. 2009, 54, 5675–5693. [Google Scholar] [CrossRef] [PubMed]
- Kim, K.; Zubair, M.; Adams, M.; Diederich, C.J.; Ozhinsky, E. Sonication strategies toward volumetric ultrasound hyperthermia treatment using the ExAblate body MRgFUS system. Int. J. Hyperth. 2021, 38, 1590–1600. [Google Scholar] [CrossRef] [PubMed]
- Zubair, M.; Dickinson, R. Calculating the Effect of Ribs on the Focus Quality of a Therapeutic Spherical Random Phased Array. Sensors 2021, 21, 1211. [Google Scholar] [CrossRef] [PubMed]
- Magara, A.; Buhler, R.; Moser, D.; Kowalski, M.; Pourtehrani, P.; Jeanmonod, D. First experience with MR-guided focused ultrasound in the treatment of Parkinson’s disease. J. Ther. Ultrasound 2014, 2, 11. [Google Scholar] [CrossRef] [PubMed]
- Zibly, Z.; Graves, C.A.; Harnof, S.; Hadani, M.; Cohen, Z.R. Sonoablation and application of MRI guided focused ultrasound in a preclinical model. J. Clin. Neurosci. 2014, 21, 1808–1814. [Google Scholar] [CrossRef]
- Pulkkinen, A.; Huang, Y.; Song, J.; Hynynen, K. Simulations and measurements of transcranial low-frequency ultrasound therapy: Skull-base heating and effective area of treatment. Phys. Med. Biol. 2011, 56, 4661–4683. [Google Scholar] [CrossRef]
- Shieh, J.; Chen, S.R.; Chen, G.S.; Lo, C.W.; Chen, C.S.; Chen, B.T.; Sun, M.K.; Huang, C.W.; Chen, W.S. Acrylic acid controlled reusable temperature-sensitive hydrogel phantoms for thermal ablation therapy. Appl. Therm. Eng. 2014, 62, 322–329. [Google Scholar] [CrossRef]
- Fan, X.; Hynynen, K. The effects of curved tissue layers on the power deposition patterns of therapeutic ultrasound beams. Med. Phys. 1994, 21, 25–34. [Google Scholar] [CrossRef]
- Sun, J.; Hynynen, K. Focusing of therapeutic ultrasound through a human skull: A numerical study. J. Acoust. Soc. Am. 1998, 104, 1705–1715. [Google Scholar] [CrossRef]
- Fan, X.; Hynynen, K. A study of various parameters of spherically curved phased arrays for noninvasive ultrasound surgery. Phys. Med. Biol. 1996, 41, 591–608. [Google Scholar] [CrossRef]
- Fan, X.; Hynynen, K. Control of the necrosed tissue volume during noninvasive ultrasound surgery using a 16-element phased array. Med. Phys. 1995, 22, 297–306. [Google Scholar] [CrossRef]
- Pennes, H.H. Analysis of Tissue and Arterial Blood Temperatures in the Resting Human Forearm. J. Appl. Physiol. 1948, 1, 93–122. [Google Scholar] [CrossRef] [PubMed]
- Dillenseger, J.L.; Esneault, S. Fast FFT-Based Bioheat Transfer Equation Computation. Comput. Biol. Med. 2010, 40, 119–123. [Google Scholar] [CrossRef]
- Gasselhuber, A.; Dreher, M.R.; Partanen, A.; Yarmolenko, P.S.; Woods, D.; Wood, B.J.; Haemmerich, D. Targeted drug delivery by high intensity focused ultrasound mediated hyperthermia combined with temperature-sensitive liposomes: Computational modelling and preliminary in vivovalidation. Int. J. Hyperth. 2012, 28, 337–348. [Google Scholar] [CrossRef] [PubMed]
- Partanen, A.; Yarmolenko, P.S.; Viitala, A.; Appanaboyina, S.; Haemmerich, D.; Ranjan, A.; Jacobs, G.; Woods, D.; Enholm, J.; Wood, B.J.; et al. Mild hyperthermia with magnetic resonance-guided high-intensity focused ultrasound for applications in drug delivery. Int. J. Hyperth. 2012, 28, 320–336. [Google Scholar] [CrossRef] [PubMed]
- Daum, D.R.; Hynynen, K. Thermal dose optimization via temporal switching in ultrasound surgery. IEEE Trans. Ultrason. Ferroelectr. Freq. Control 1998, 45, 208–215. [Google Scholar] [CrossRef]
- Hynynen, K.; Jolesz, F.A. Demonstration of potential noninvasive ultrasound brain therapy through an intact skull. Ultrasound Med. Biol. 1998, 24, 275–283. [Google Scholar] [CrossRef]
- Clement, G.T.; Sun, J.; Giesecke, T.; Hynynen, K. A hemisphere array for non-invasive ultrasound brain therapy and surgery. Phys. Med. Biol. 2000, 45, 3707–3719. [Google Scholar] [CrossRef]
- Meng, Y.; Huang, Y.; Solomon, B.; Hynynen, K.; Scantlebury, N.; Schwartz, M.L.; Lipsman, N. MRI-guided Focused Ultrasound Thalamotomy for Patients with Medically-refractory Essential Tremor. J. Vis. Exp. 2017, 13, e56365. [Google Scholar] [CrossRef]
- Chang, W.S.; Jung, H.H.; Zadicario, E.; Rachmilevitch, I.; Tlusty, T.; Vitek, S.; Chang, J.W. Factors associated with successful magnetic resonance-guided focused ultrasound treatment: Efficiency of acoustic energy delivery through the skull. J. Neurosurg. 2016, 124, 411–416. [Google Scholar] [CrossRef]
- Jolesz, F.A.; Bleier, A.R.; Jakab, P.; Ruenzel, P.W.; Huttl, K.; Jako, G.J. MR imaging of laser-tissue interactions. Radiology 1988, 168, 249–253. [Google Scholar] [CrossRef] [PubMed]
- Lewis, M.A.; Staruch, R.M.; Chopra, R. Thermometry and ablation monitoring with ultrasound. Int. J. Hyperth. 2015, 31, 163–181. [Google Scholar] [CrossRef] [PubMed]
- Aubry, J.F.; Tanter, M.; Pernot, M.; Thomas, J.L.; Fink, M. Experimental demonstration of noninvasive transskull adaptive focusing based on prior computed tomography scans. J. Acoust. Soc. Am. 2003, 113, 84–93. [Google Scholar] [CrossRef] [PubMed]
- Webb, T.D.; Leung, S.A.; Rosenberg, J.; Ghanouni, P.; Dahl, J.J.; Pelc, N.J.; Pauly, K.B. Measurements of the Relationship Between CT Hounsfield Units and Acoustic Velocity and How It Changes with Photon Energy and Reconstruction Method. IEEE Trans. Ultrason. Ferroelectr. Freq. Control 2018, 65, 1111–1124. [Google Scholar] [CrossRef] [PubMed]


| Parameters | Water | Skull Bone | Brain | Blood in Brain | Acrylic Skull | Hydrogel |
|---|---|---|---|---|---|---|
| ρ | 1000 | 1796 | 1030 | – | 1040 | 1160 |
| c | 1500 | 2652 | 1545 | – | 1900 | 1505 |
| α | 0 | 176 | 4 | – | 185.4 | 5.8 |
| ct or cb | – | – | 3640 | 3620 | – | 3365 |
| k | – | – | 0.528 | – | – | 0.60 |
| wb | – | – | – | 0.00833 | – | – |
| 114-Element Transducer | 381-Element Transducer | |
|---|---|---|
| Focusing pattern 1 | Focal zone of 0.75 mm × 0.70 mm × 3.00 mm at (2.05, −0.25, 0.25) and 0.85 mm × 0.90 mm × 3.45 mm at (−2.10, 0.25, 0.00) (Figure 6a–c) | Focal zone of 0.75 mm × 0.80 mm × 3.15 mm at (2.10, −0.10, 0.20) and 0.85 mm × 0.90 mm × 3.45 mm at (−2.10, 0.20, 0.00) (Figure 6d–f) |
| Focusing pattern 2 | Focal zone of 0.85 mm × 1.00 mm × 3.30 mm at (0.20, 2.10, 0.00) and 0.65 mm × 0.80 mm × 2.55 mm at (−0.20, −2.05, 0.00) (Figure 6g–i) | Focal zone 0.80 mm × 1.05 mm × 3.20 mm at (0.10, 2.10, 0.10) and 0.80 mm × 0.09 mm × 3.05 mm at (−0.10, −2, 0.10) (Figure 6j–l) |
Publisher’s Note: MDPI stays neutral with regard to jurisdictional claims in published maps and institutional affiliations. |
© 2022 by the authors. Licensee MDPI, Basel, Switzerland. This article is an open access article distributed under the terms and conditions of the Creative Commons Attribution (CC BY) license (https://creativecommons.org/licenses/by/4.0/).
Share and Cite
Chan, H.; Chang, H.-Y.; Lin, W.-L.; Chen, G.-S. Large-Volume Focused-Ultrasound Mild Hyperthermia for Improving Blood-Brain Tumor Barrier Permeability Application. Pharmaceutics 2022, 14, 2012. https://doi.org/10.3390/pharmaceutics14102012
Chan H, Chang H-Y, Lin W-L, Chen G-S. Large-Volume Focused-Ultrasound Mild Hyperthermia for Improving Blood-Brain Tumor Barrier Permeability Application. Pharmaceutics. 2022; 14(10):2012. https://doi.org/10.3390/pharmaceutics14102012
Chicago/Turabian StyleChan, Hsin, Hsin-Yun Chang, Win-Li Lin, and Gin-Shin Chen. 2022. "Large-Volume Focused-Ultrasound Mild Hyperthermia for Improving Blood-Brain Tumor Barrier Permeability Application" Pharmaceutics 14, no. 10: 2012. https://doi.org/10.3390/pharmaceutics14102012