
Investigation on the Composition of Agarose–Collagen I Blended Hydrogels as Matrices for the Growth of Spheroids from Breast Cancer Cell Lines

 ,
,  ,
,  , , and
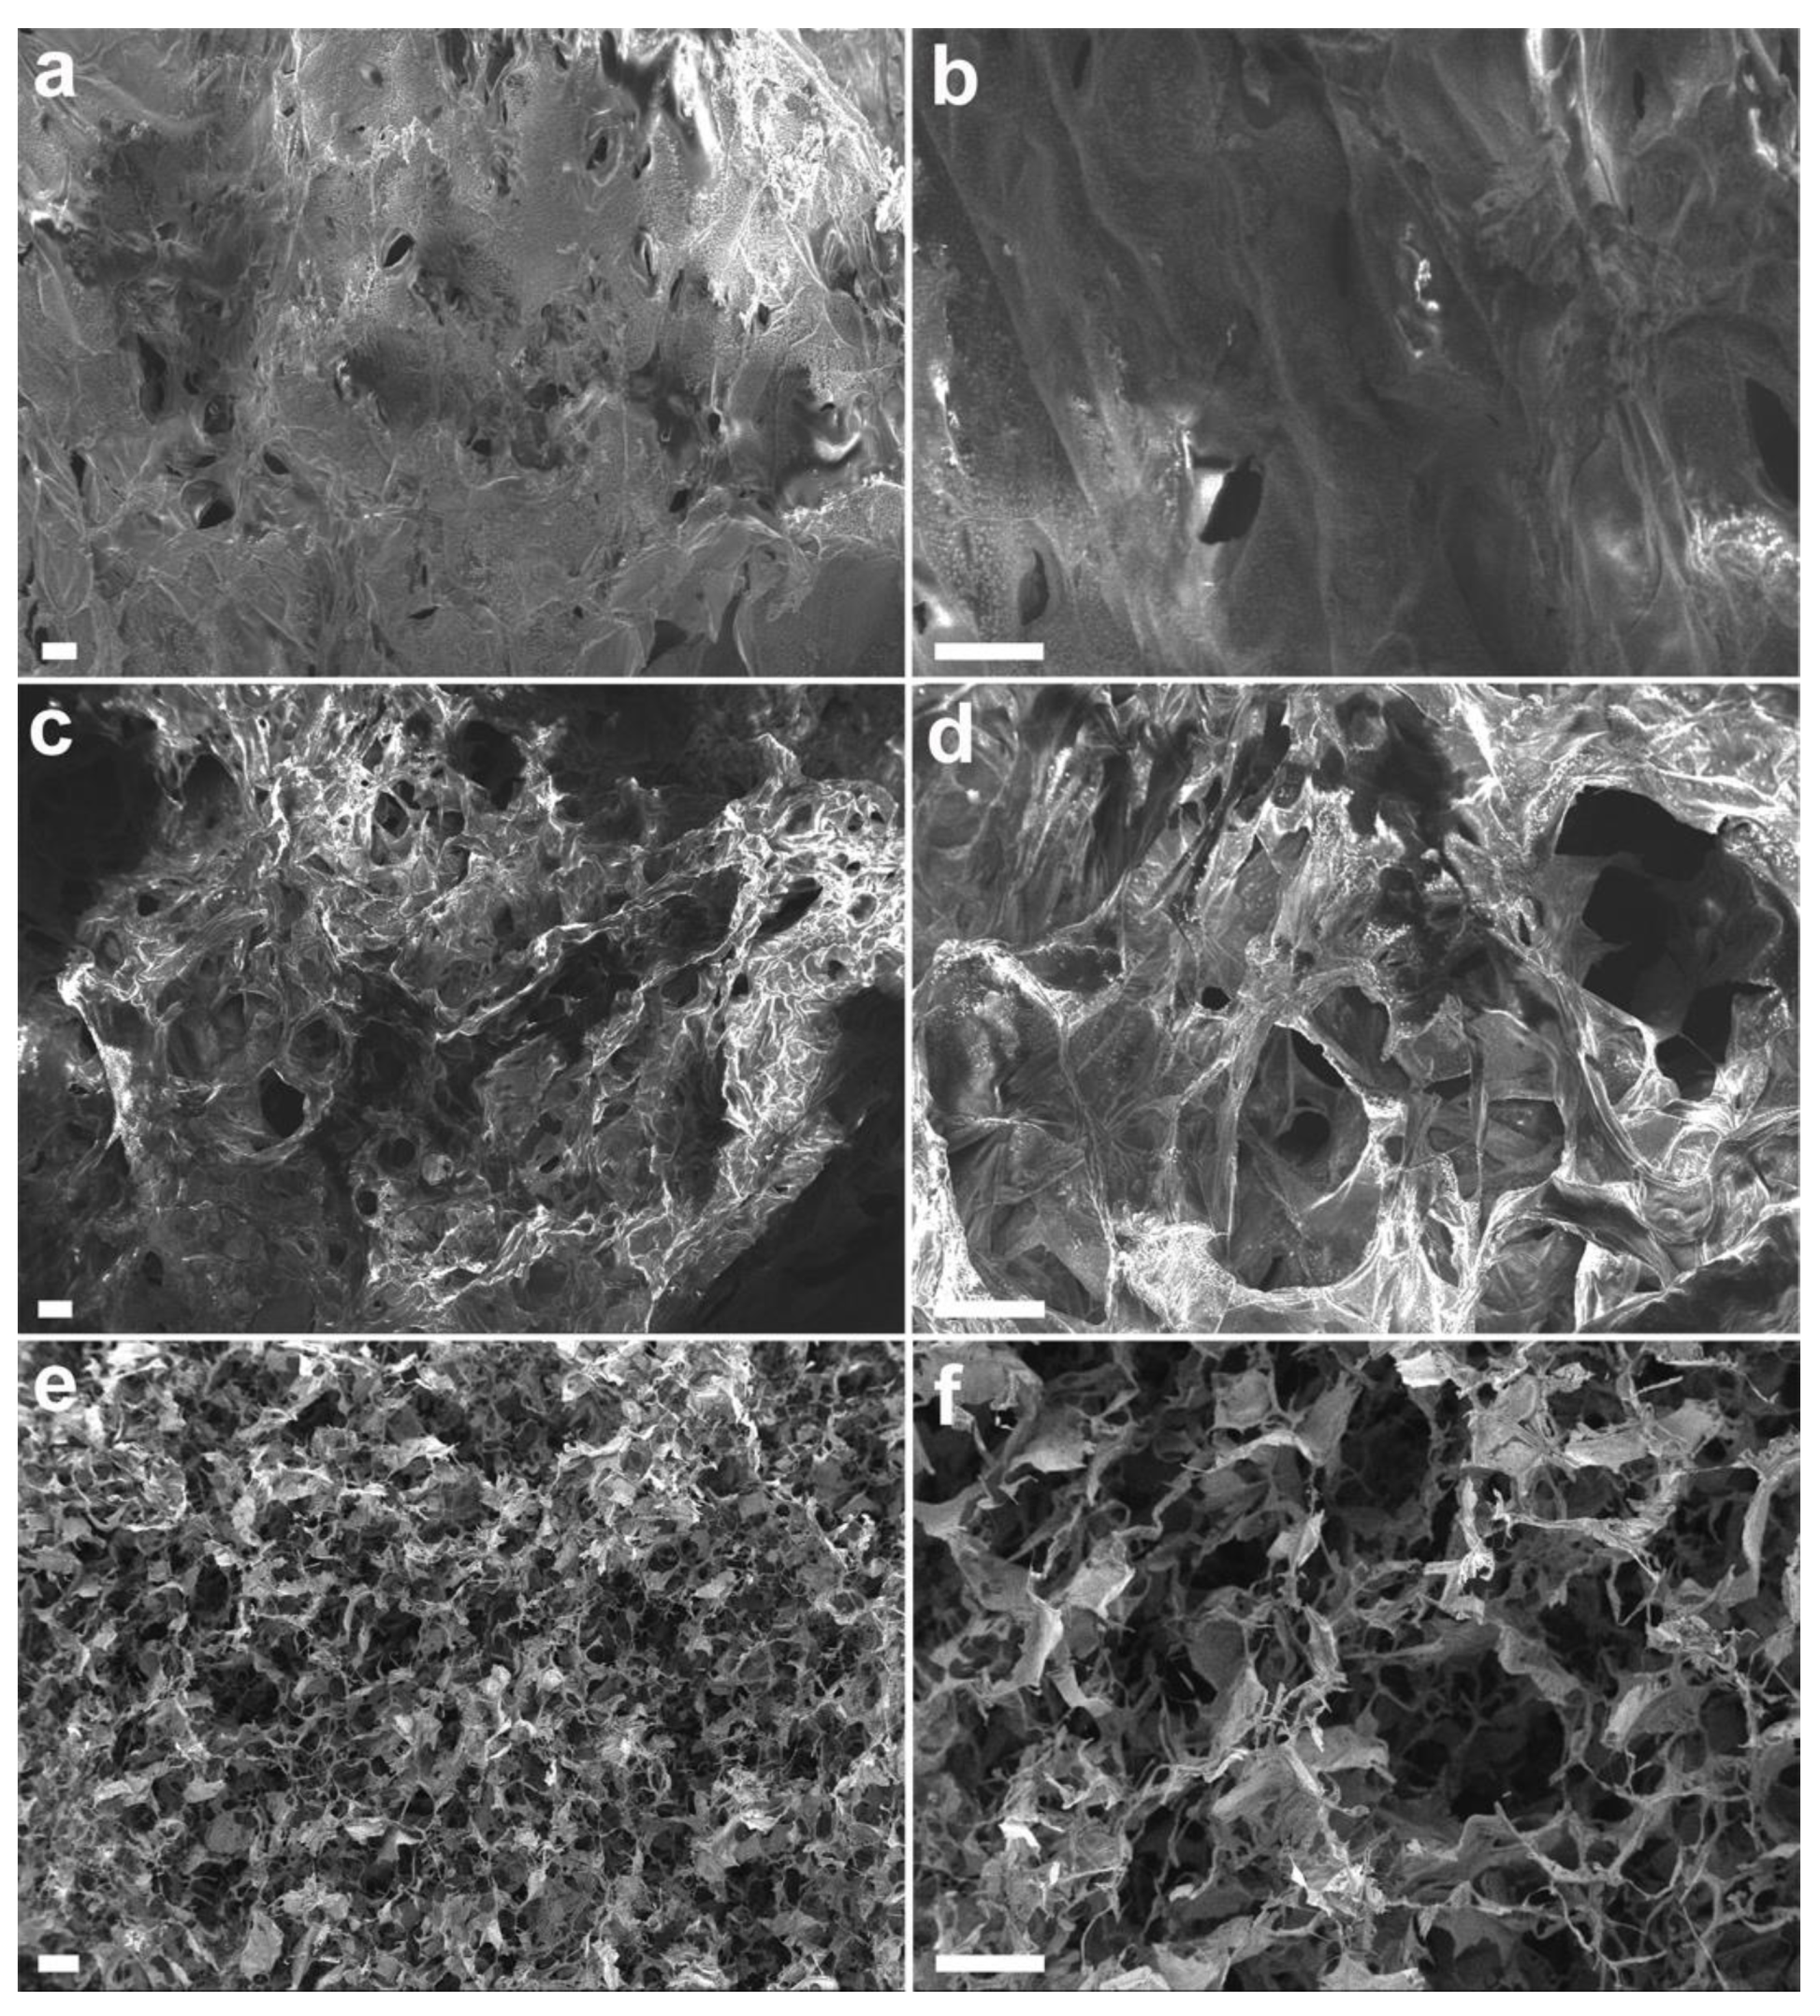
Abstract
:1. Introduction
2. Materials and Methods
2.1. Preparation of the Hydrogels
2.2. Characterization of the Hydrogels
2.2.1. Scanning Electron Microscopy (SEM)
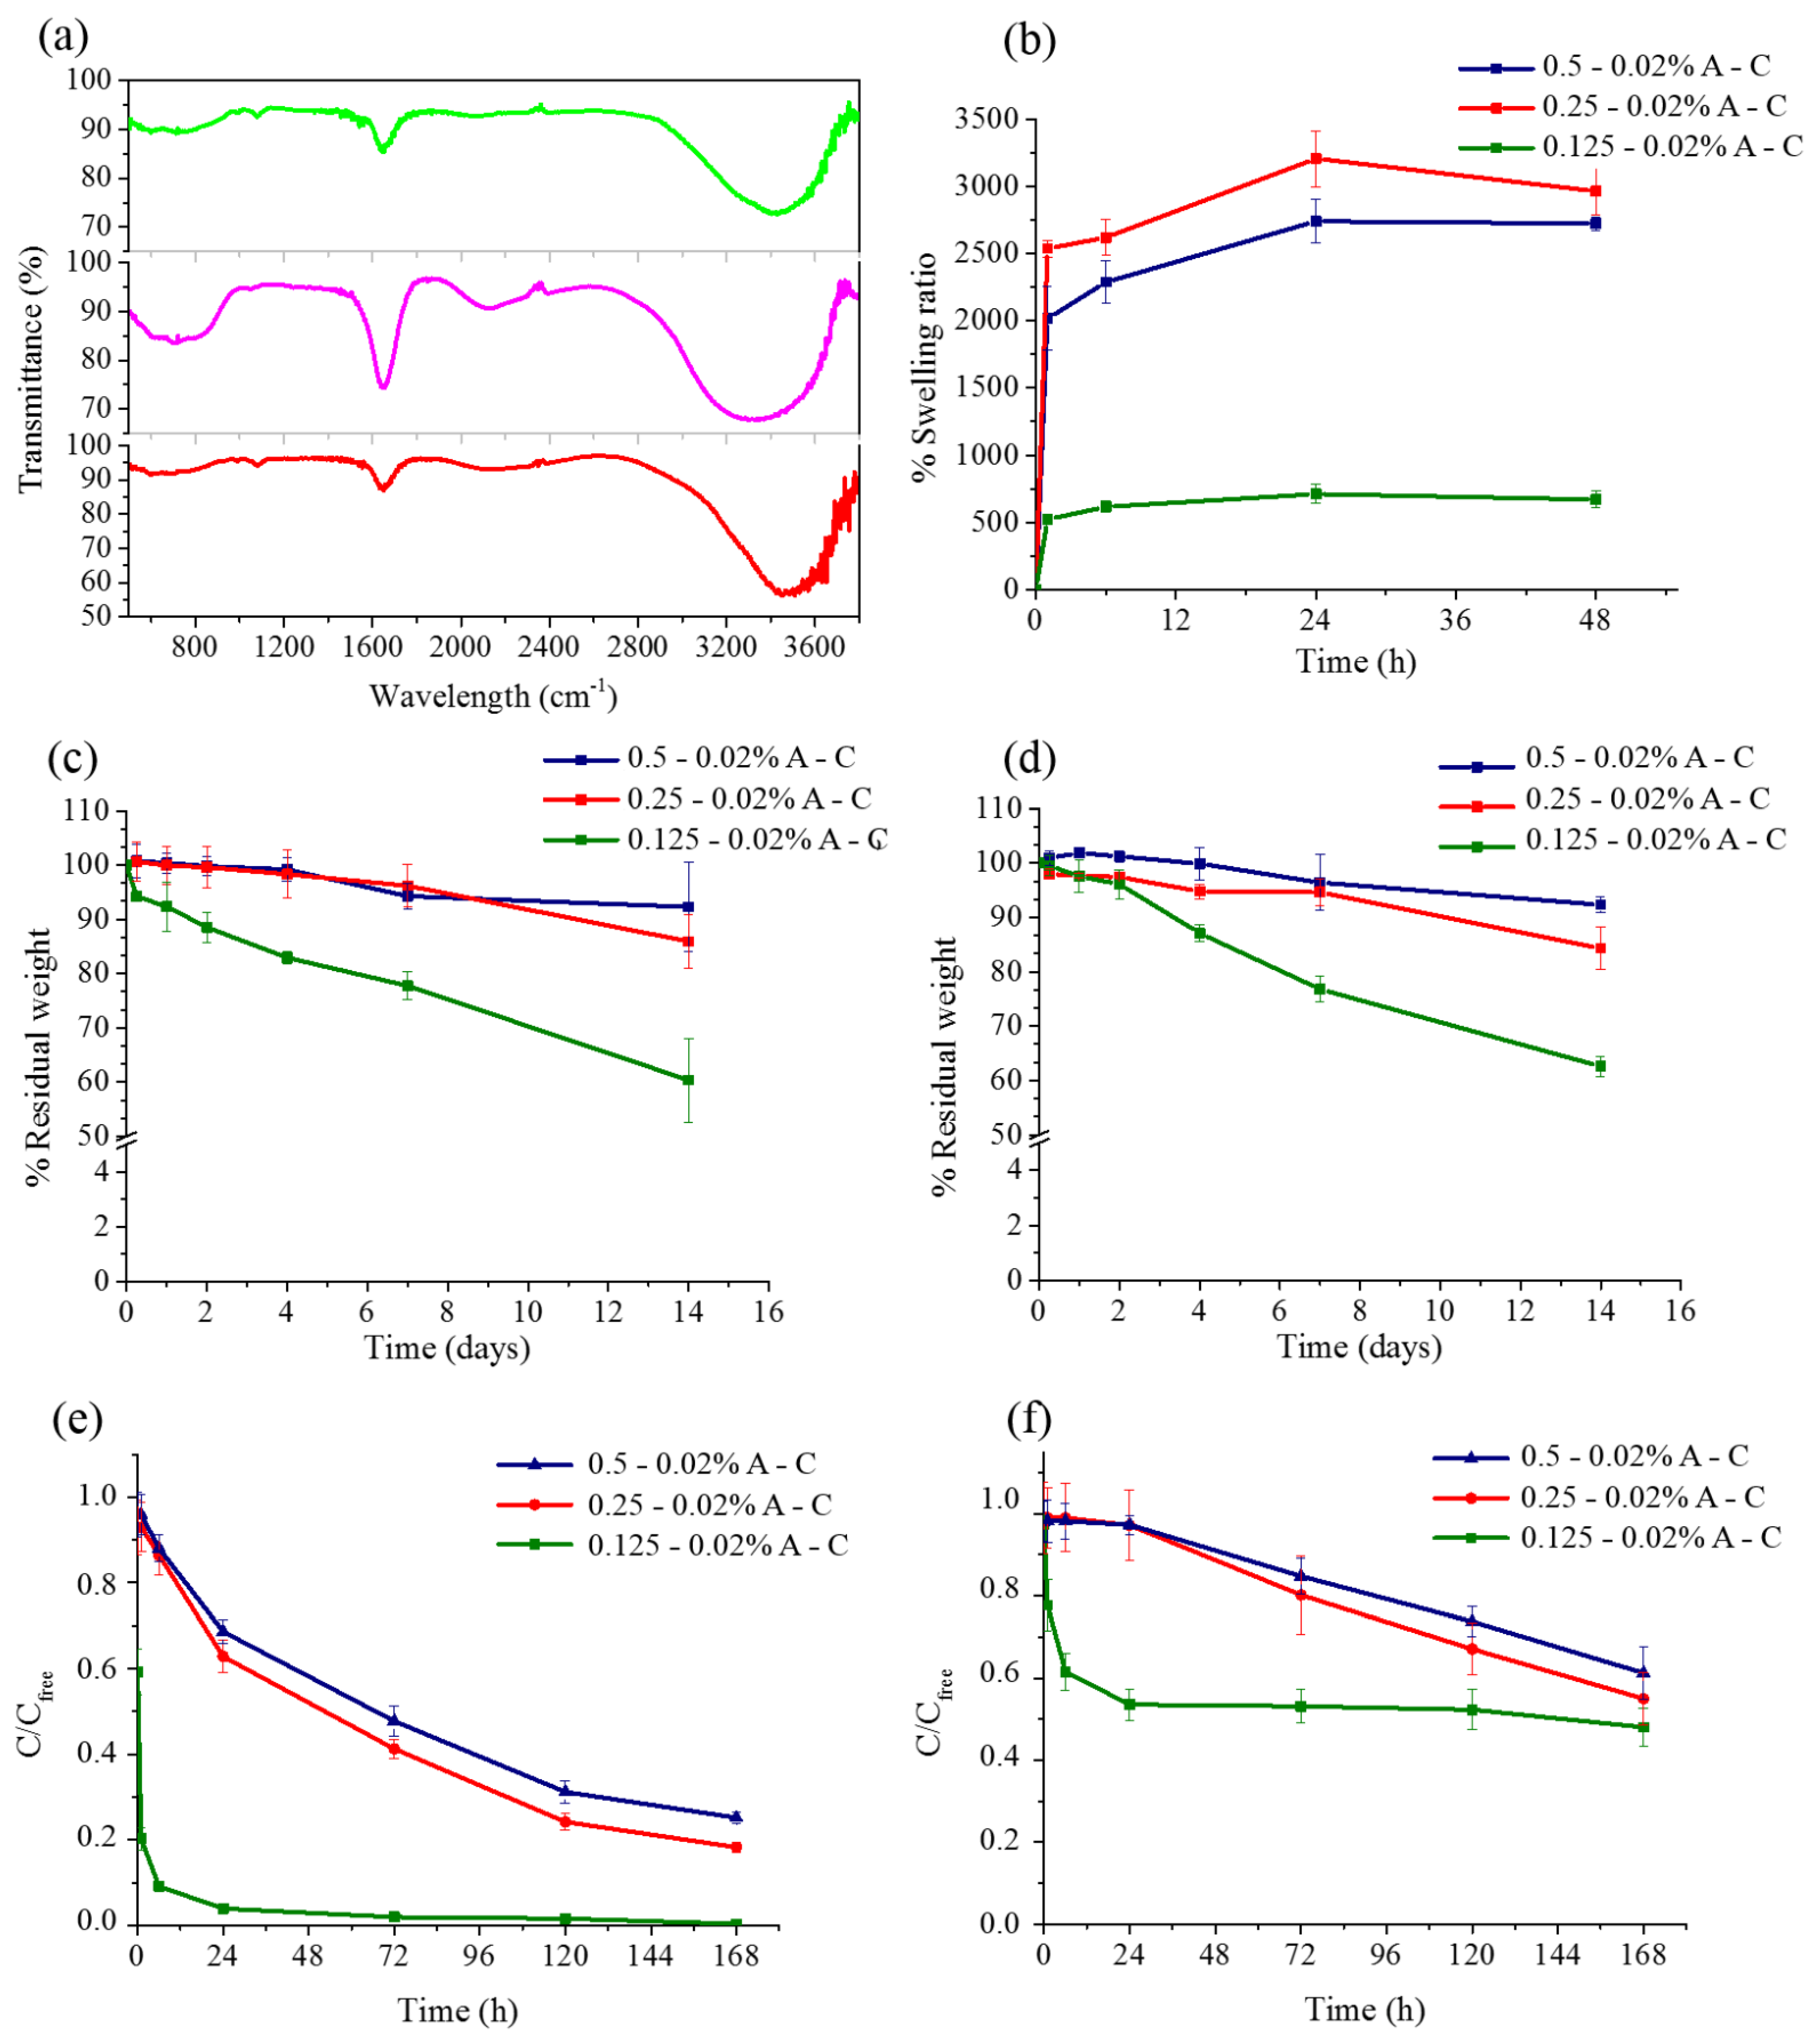
2.2.2. Stability Test
2.2.3. Swelling Behavior
2.2.4. Collagen Release
2.2.5. Fourier-Transform Infrared (FTIR) Spectroscopy
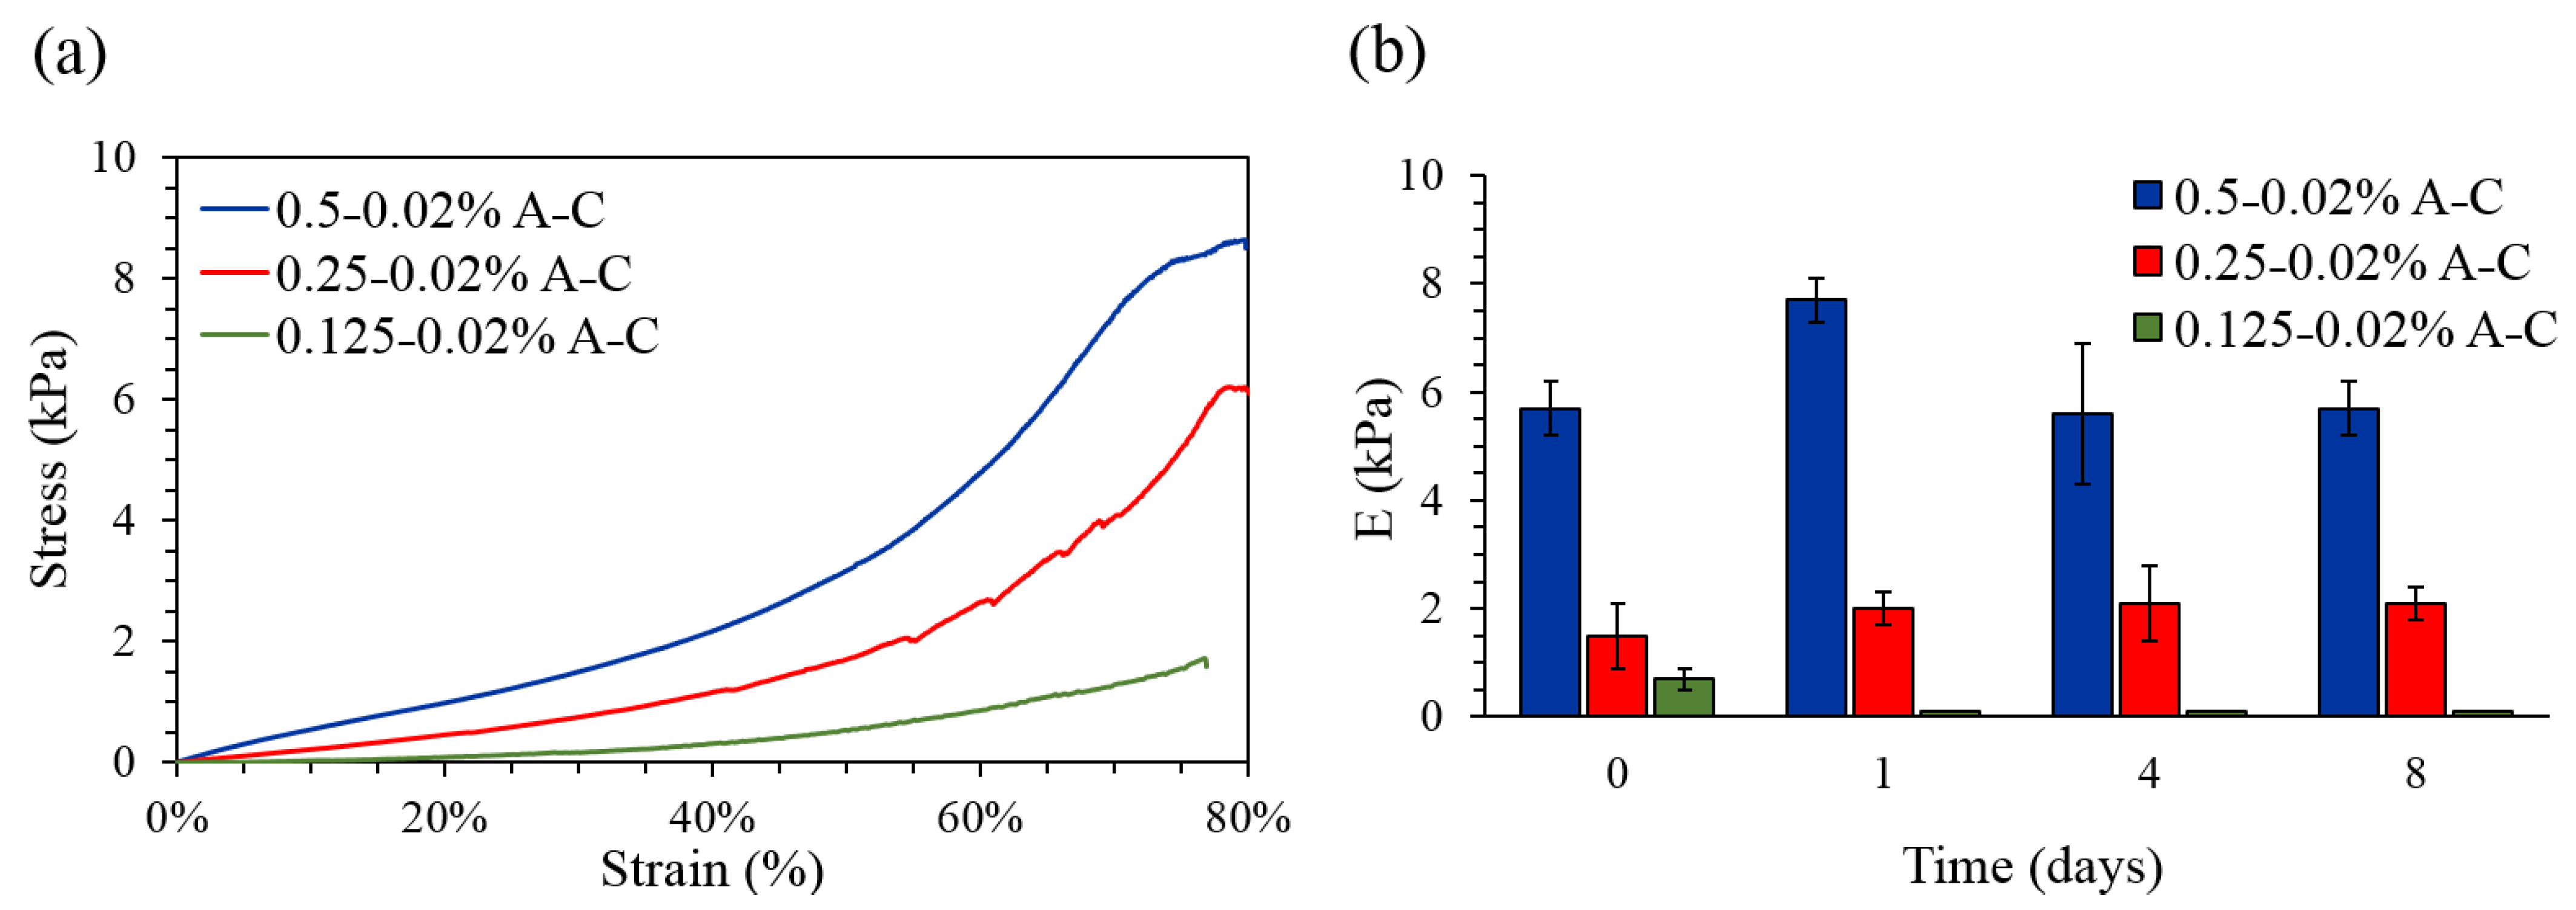
2.2.6. Mechanical Compression Test
2.2.7. Diffusion Test
2.2.8. Drug Diffusion Test
2.3. Tumor Spheroid Preparation and Characterization
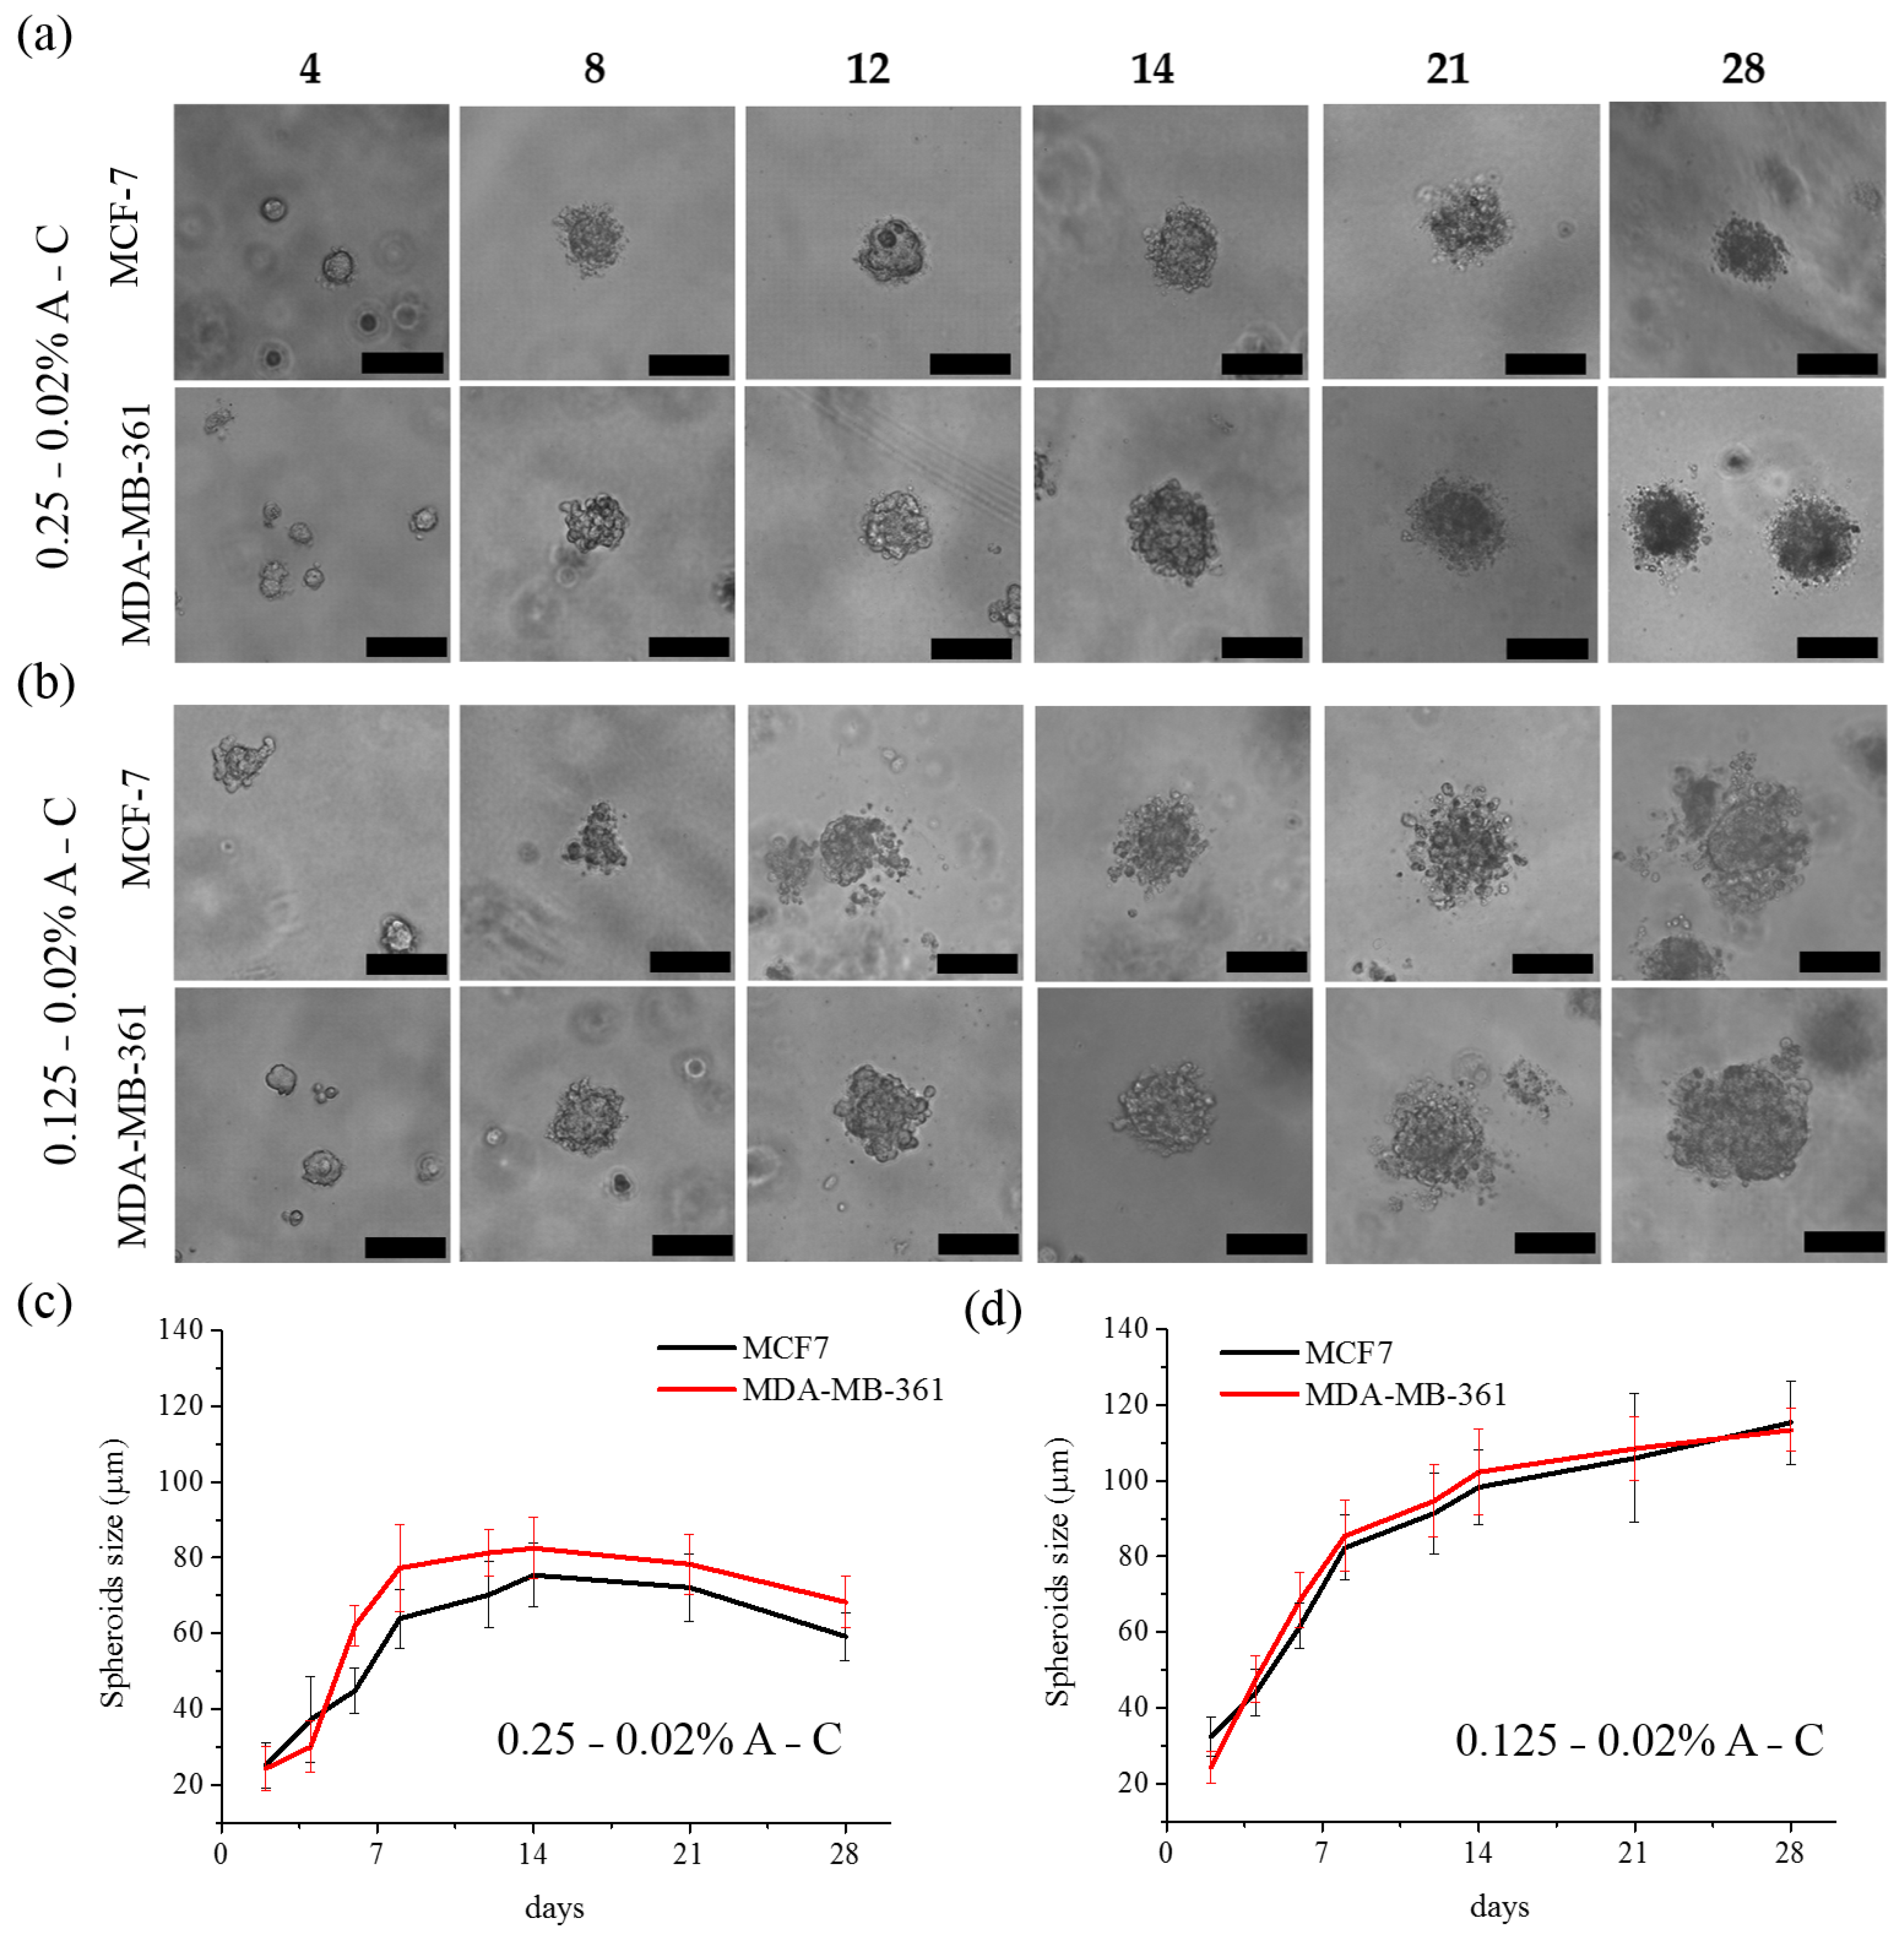
Morphological Analysis of the Tumor Spheroids
2.4. Cellular Assays
2.4.1. Live/Dead Assay
2.4.2. Mitochondria Toxicity Assay
2.4.3. Cisplatin Treatment
2.5. Immunofluorescence Microscopy Analysis
2.6. Enzymatic Digestion of Agarose for Spheroids Recovery
2.7. Ultrastructural Analysis of the Recovered Spheroids
2.8. Statistical Analysis
3. Results
3.1. Agarose–Collagen Hydrogels: Preparation and Characterization
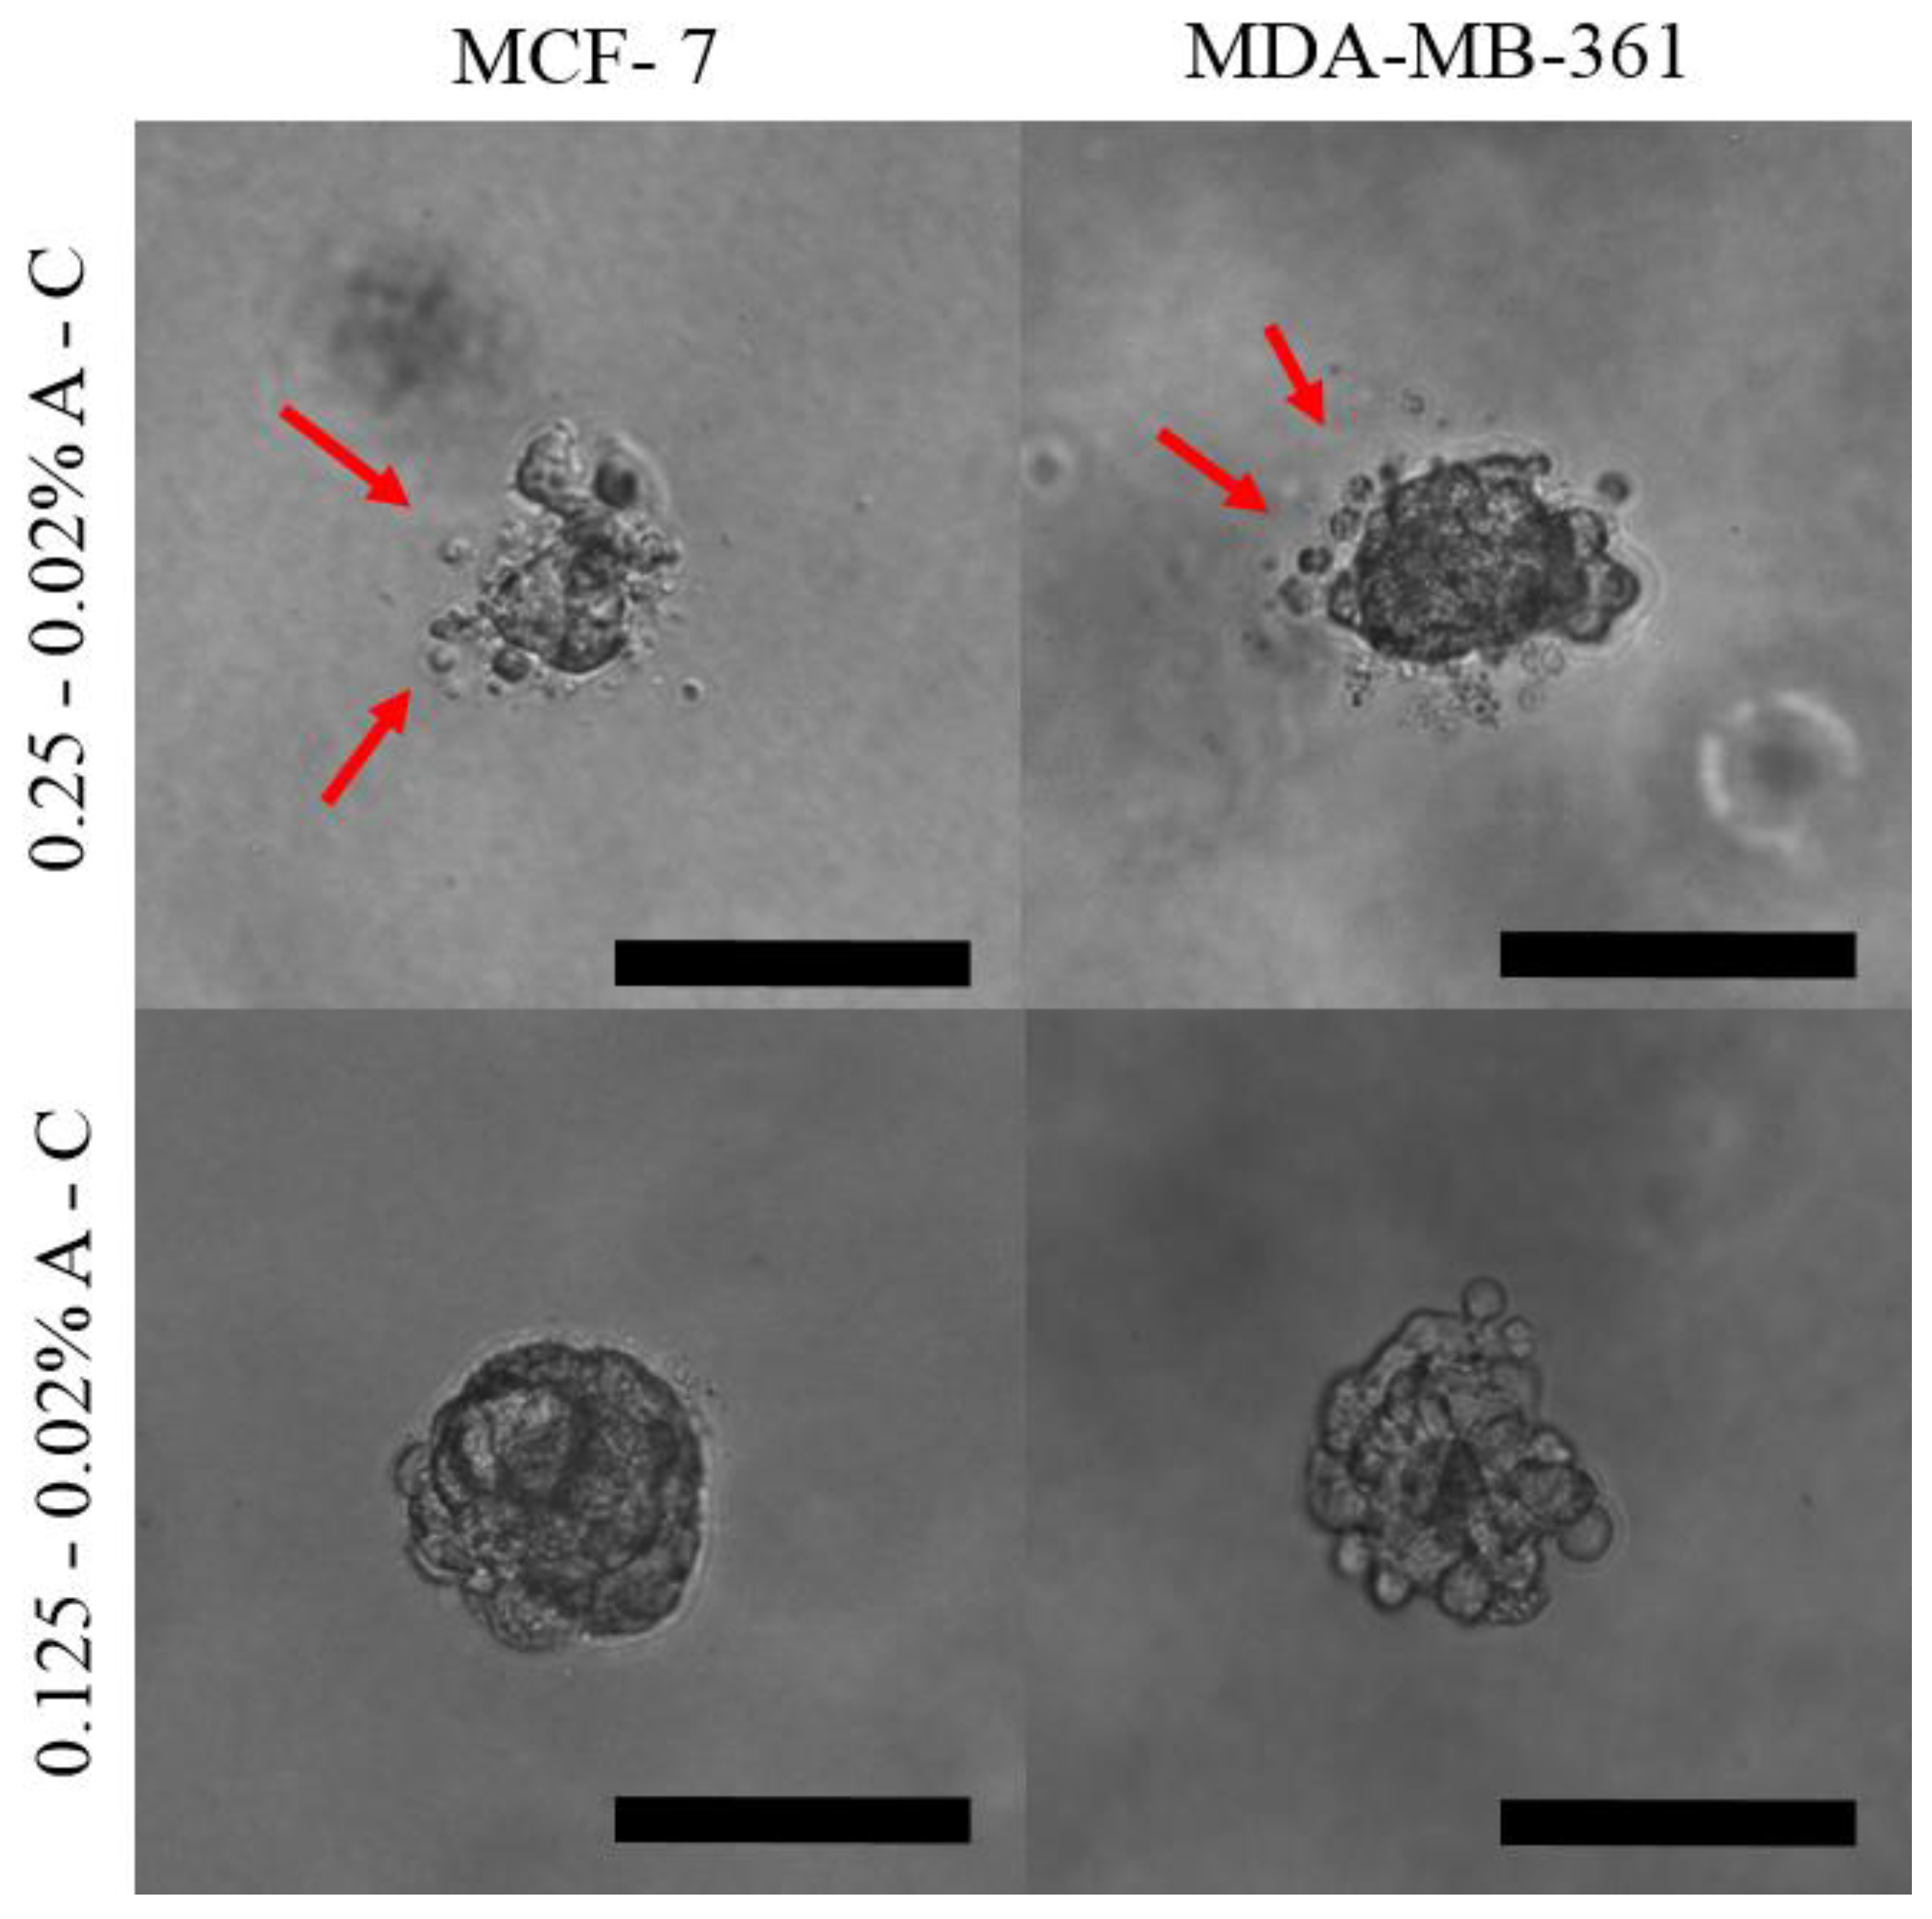
3.2. Growth of Mammary Spheroids in A-C Hydrogels
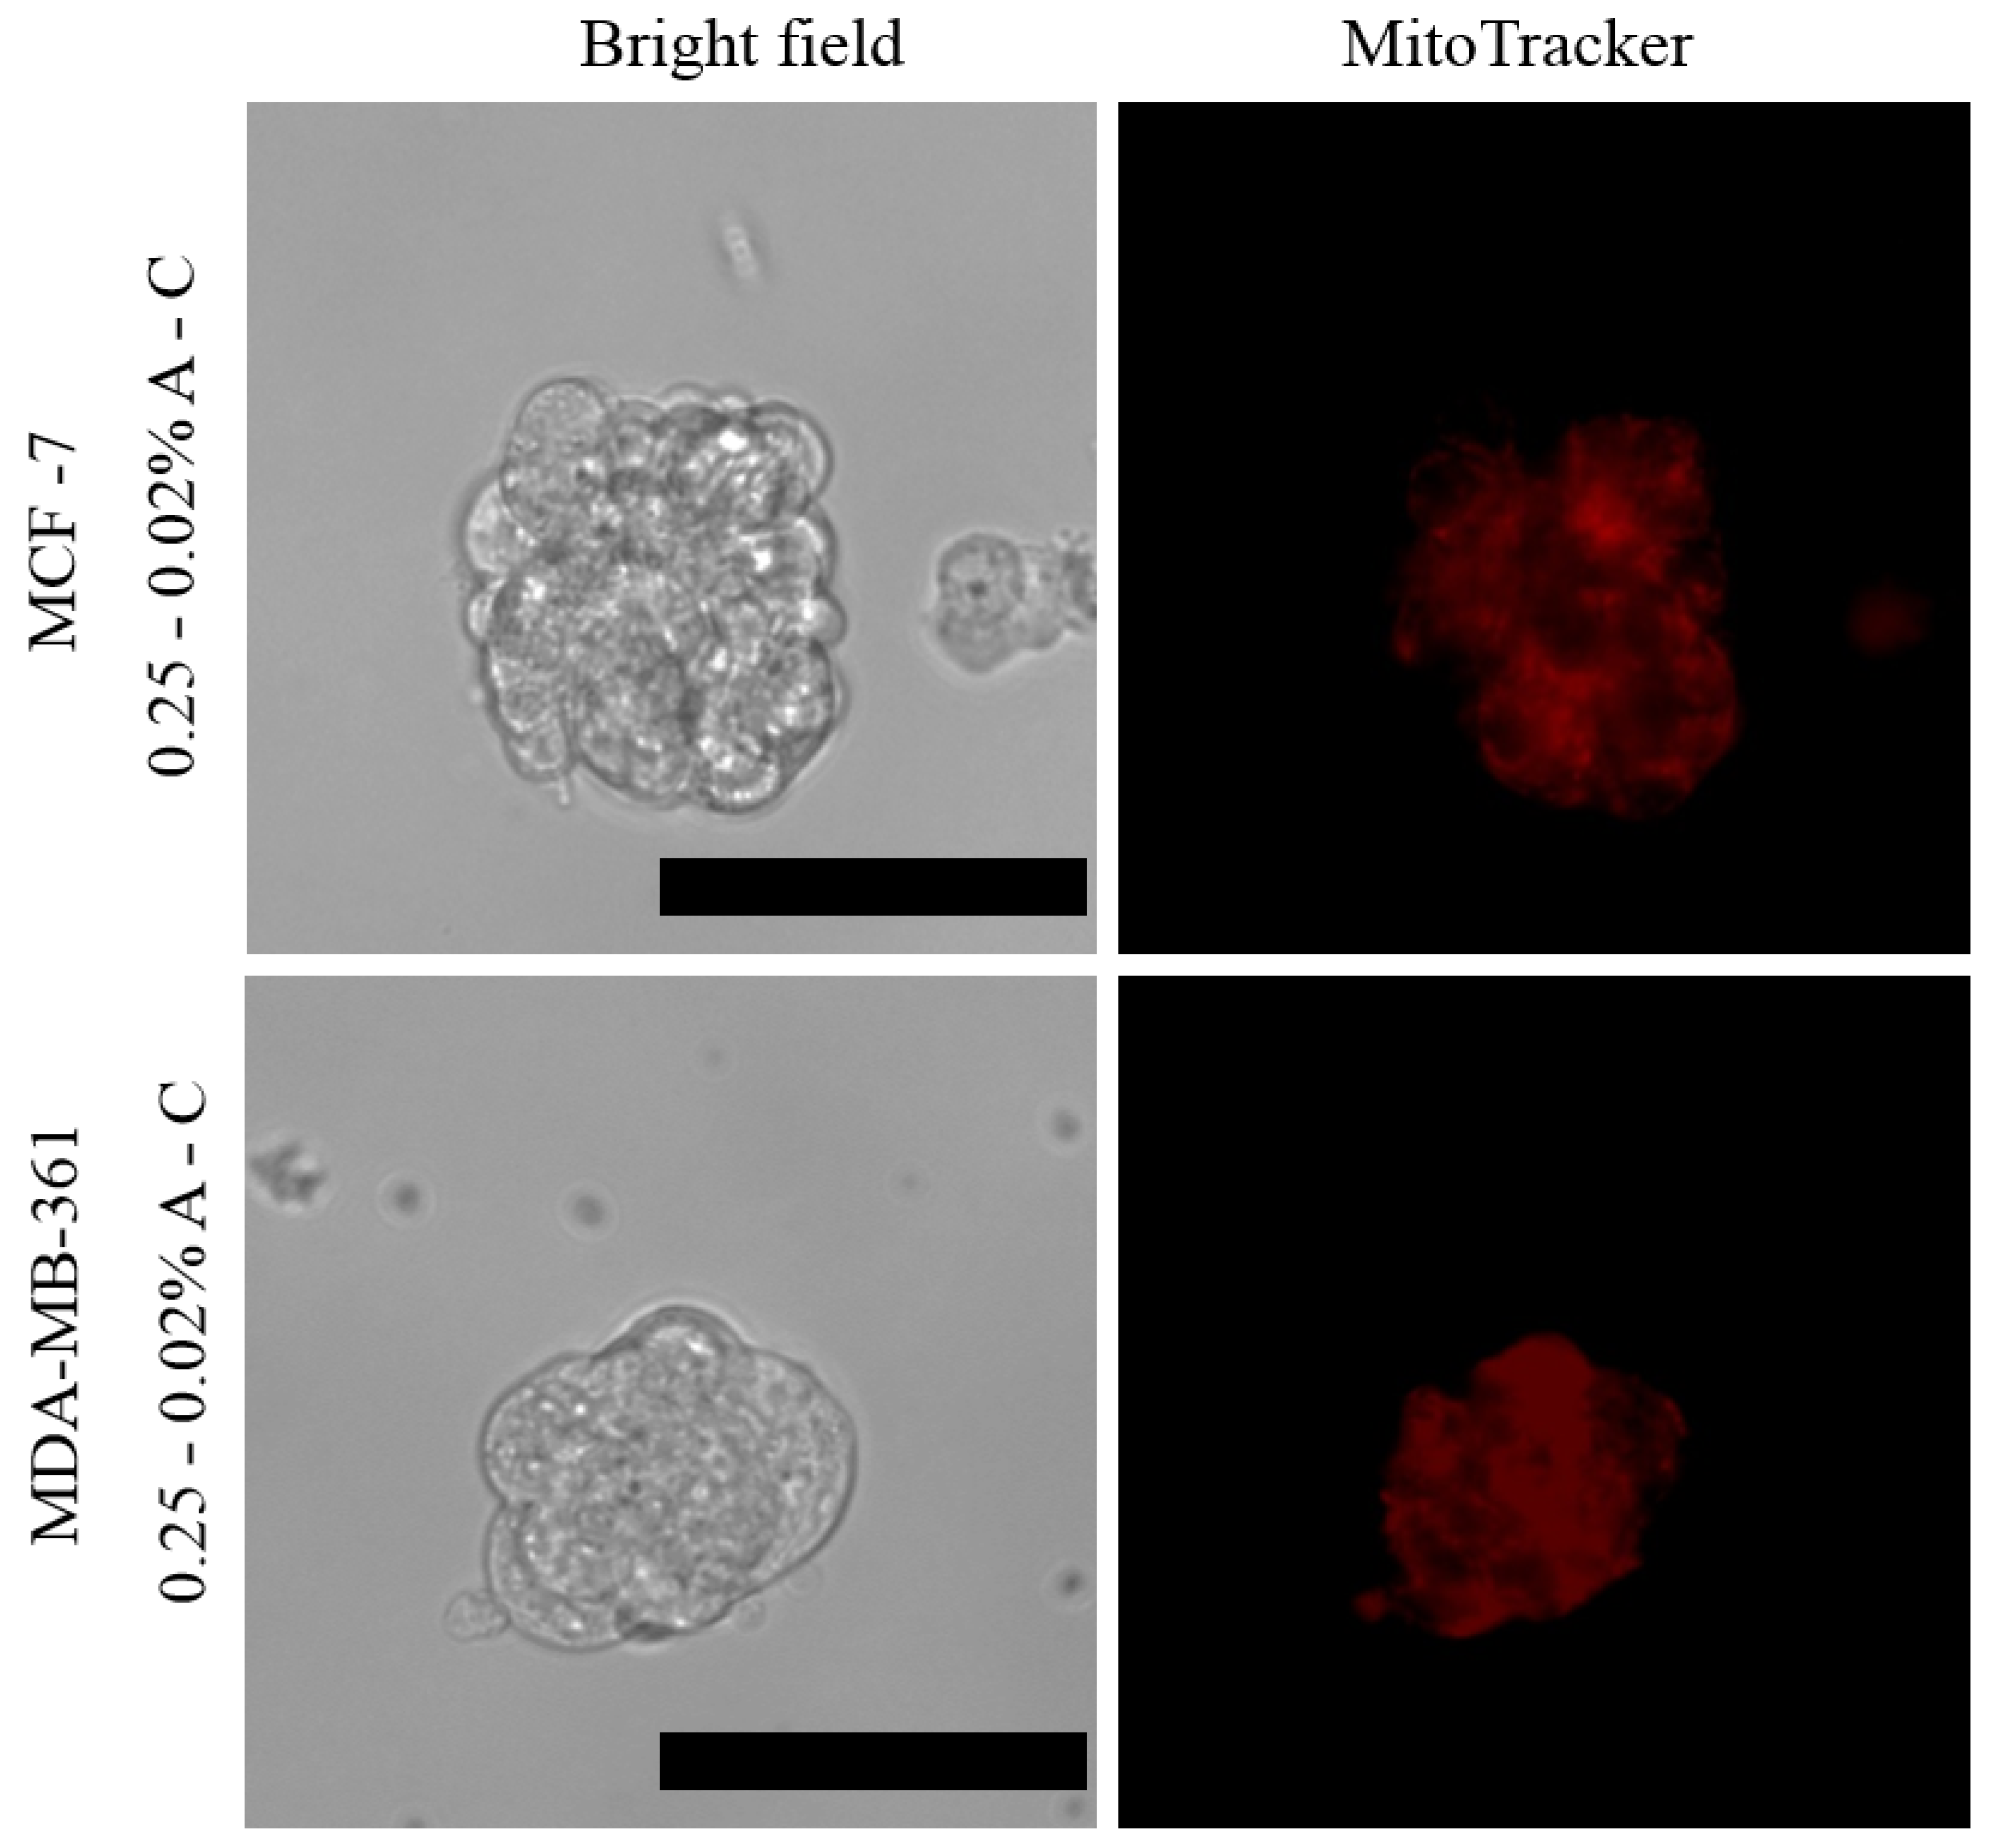
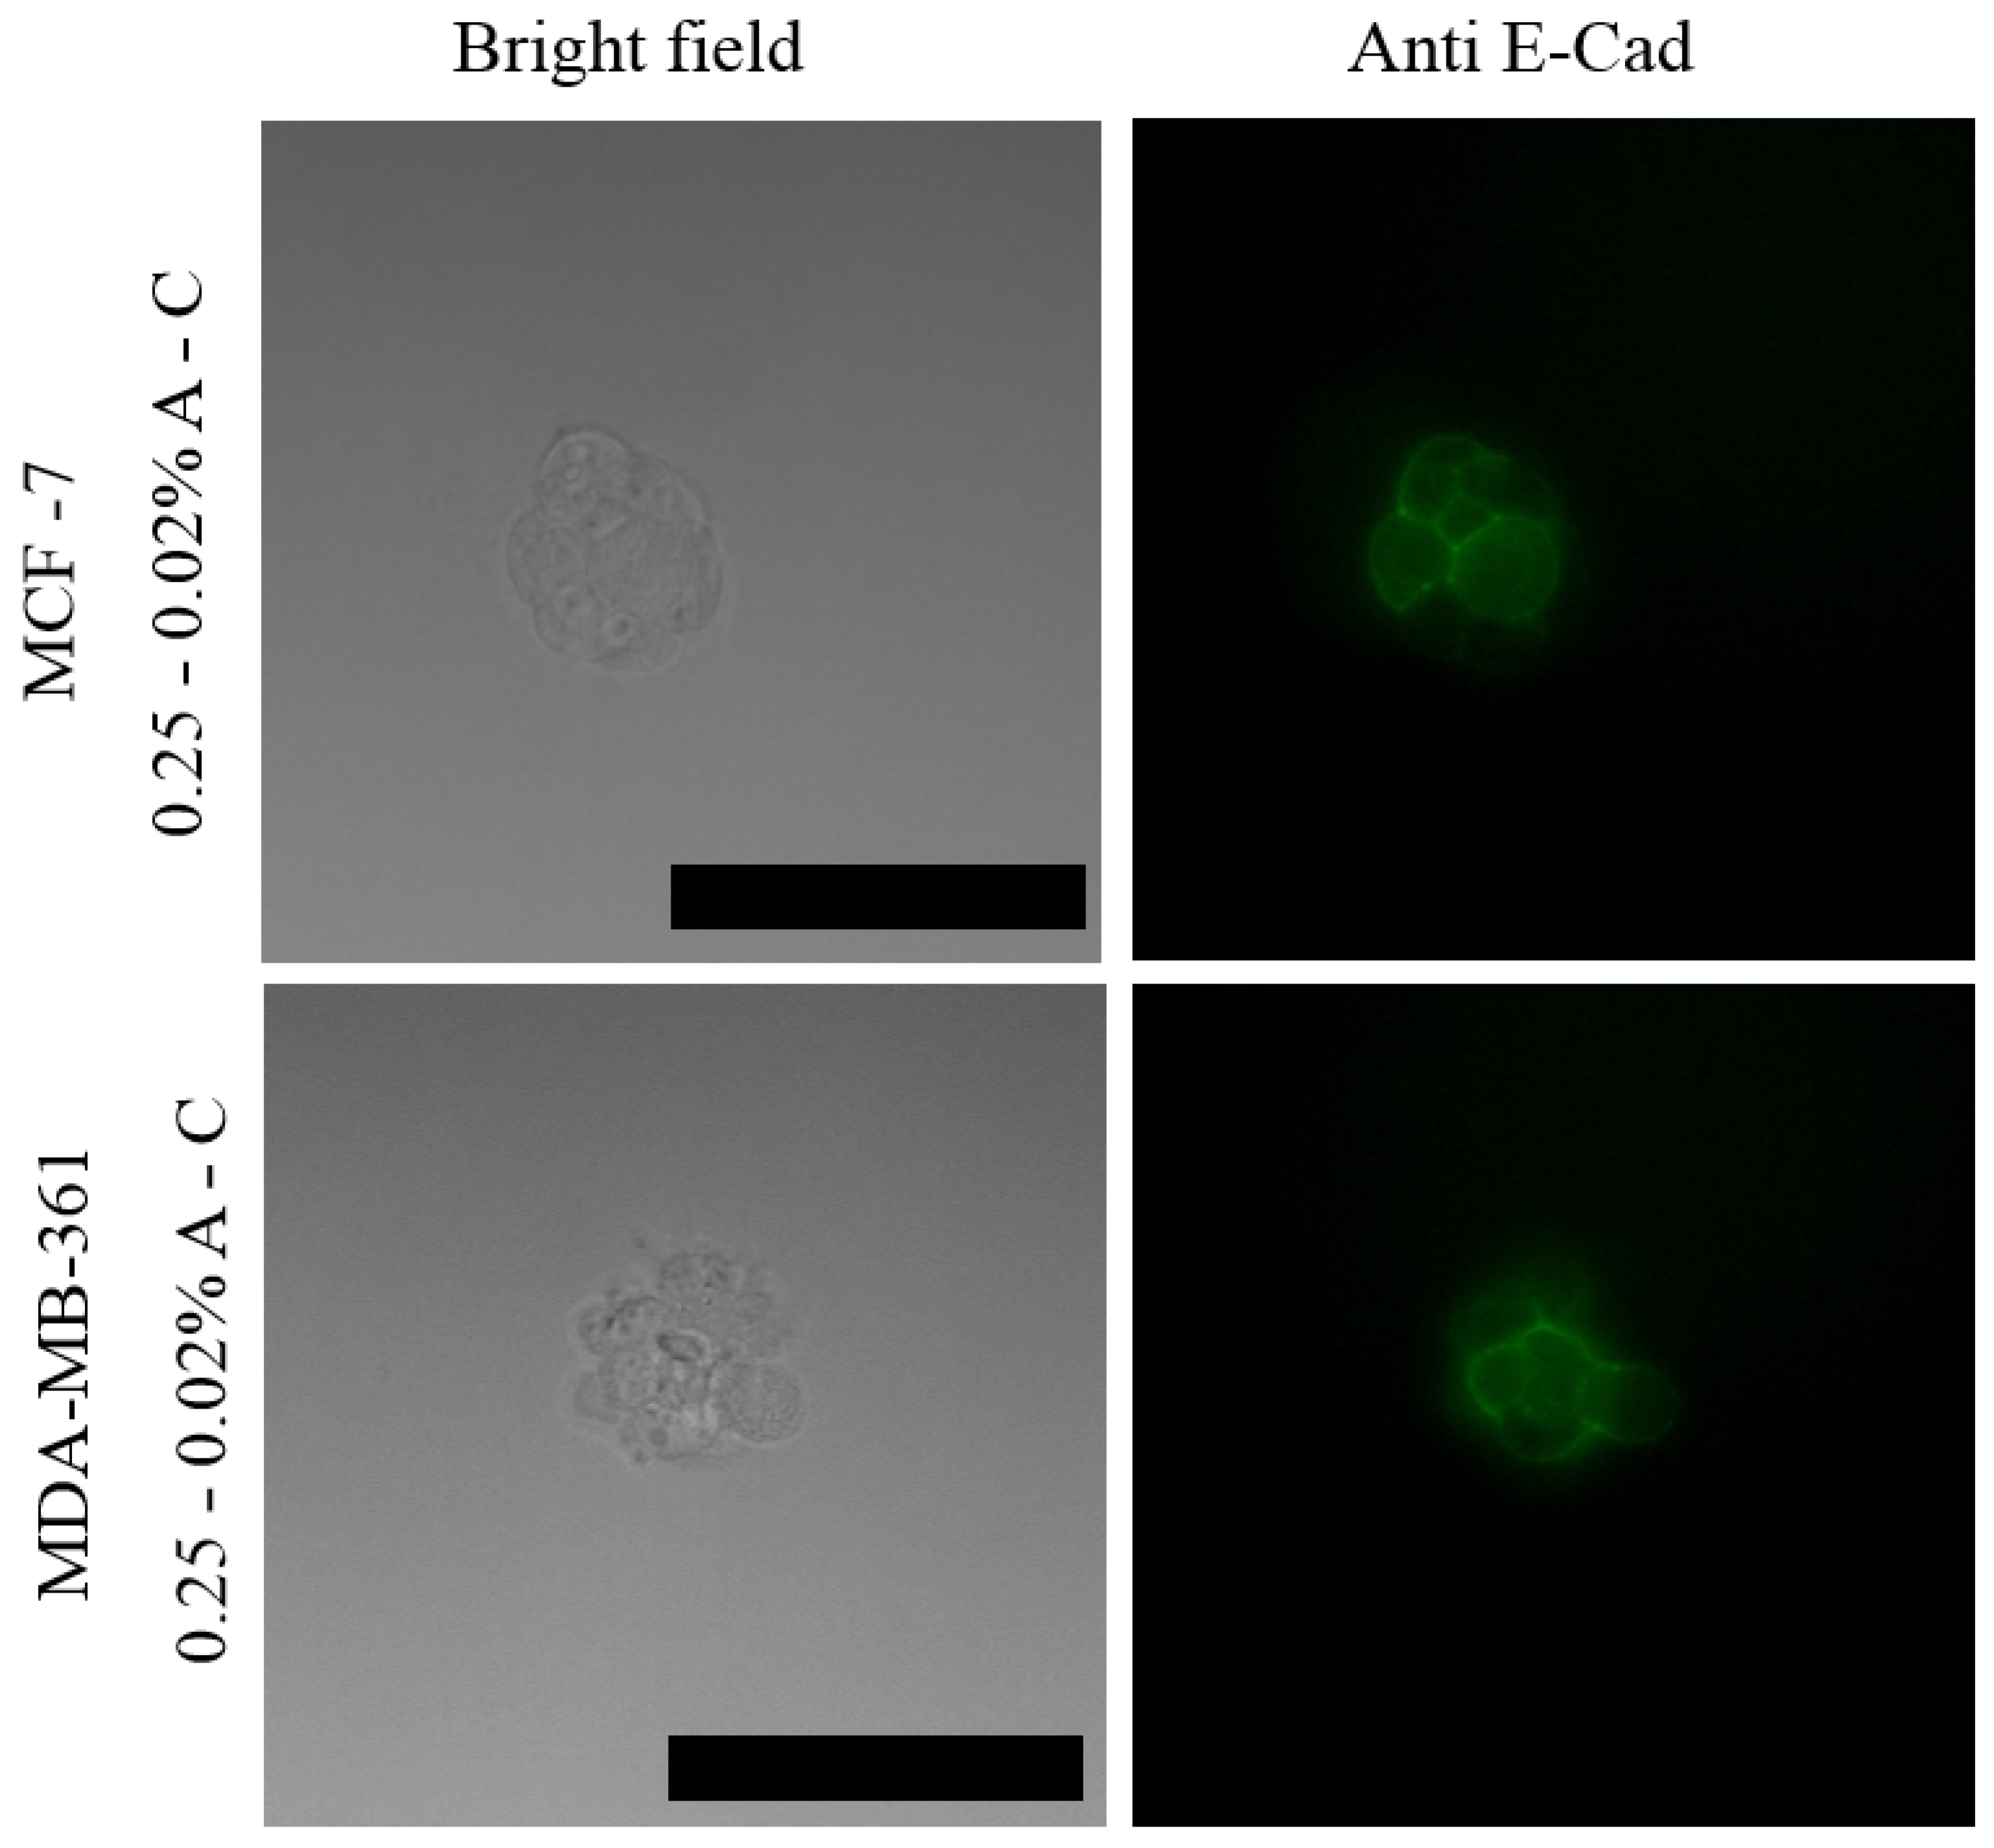
3.3. Mammary Spheroids Viability and Epithelial Markers Expression
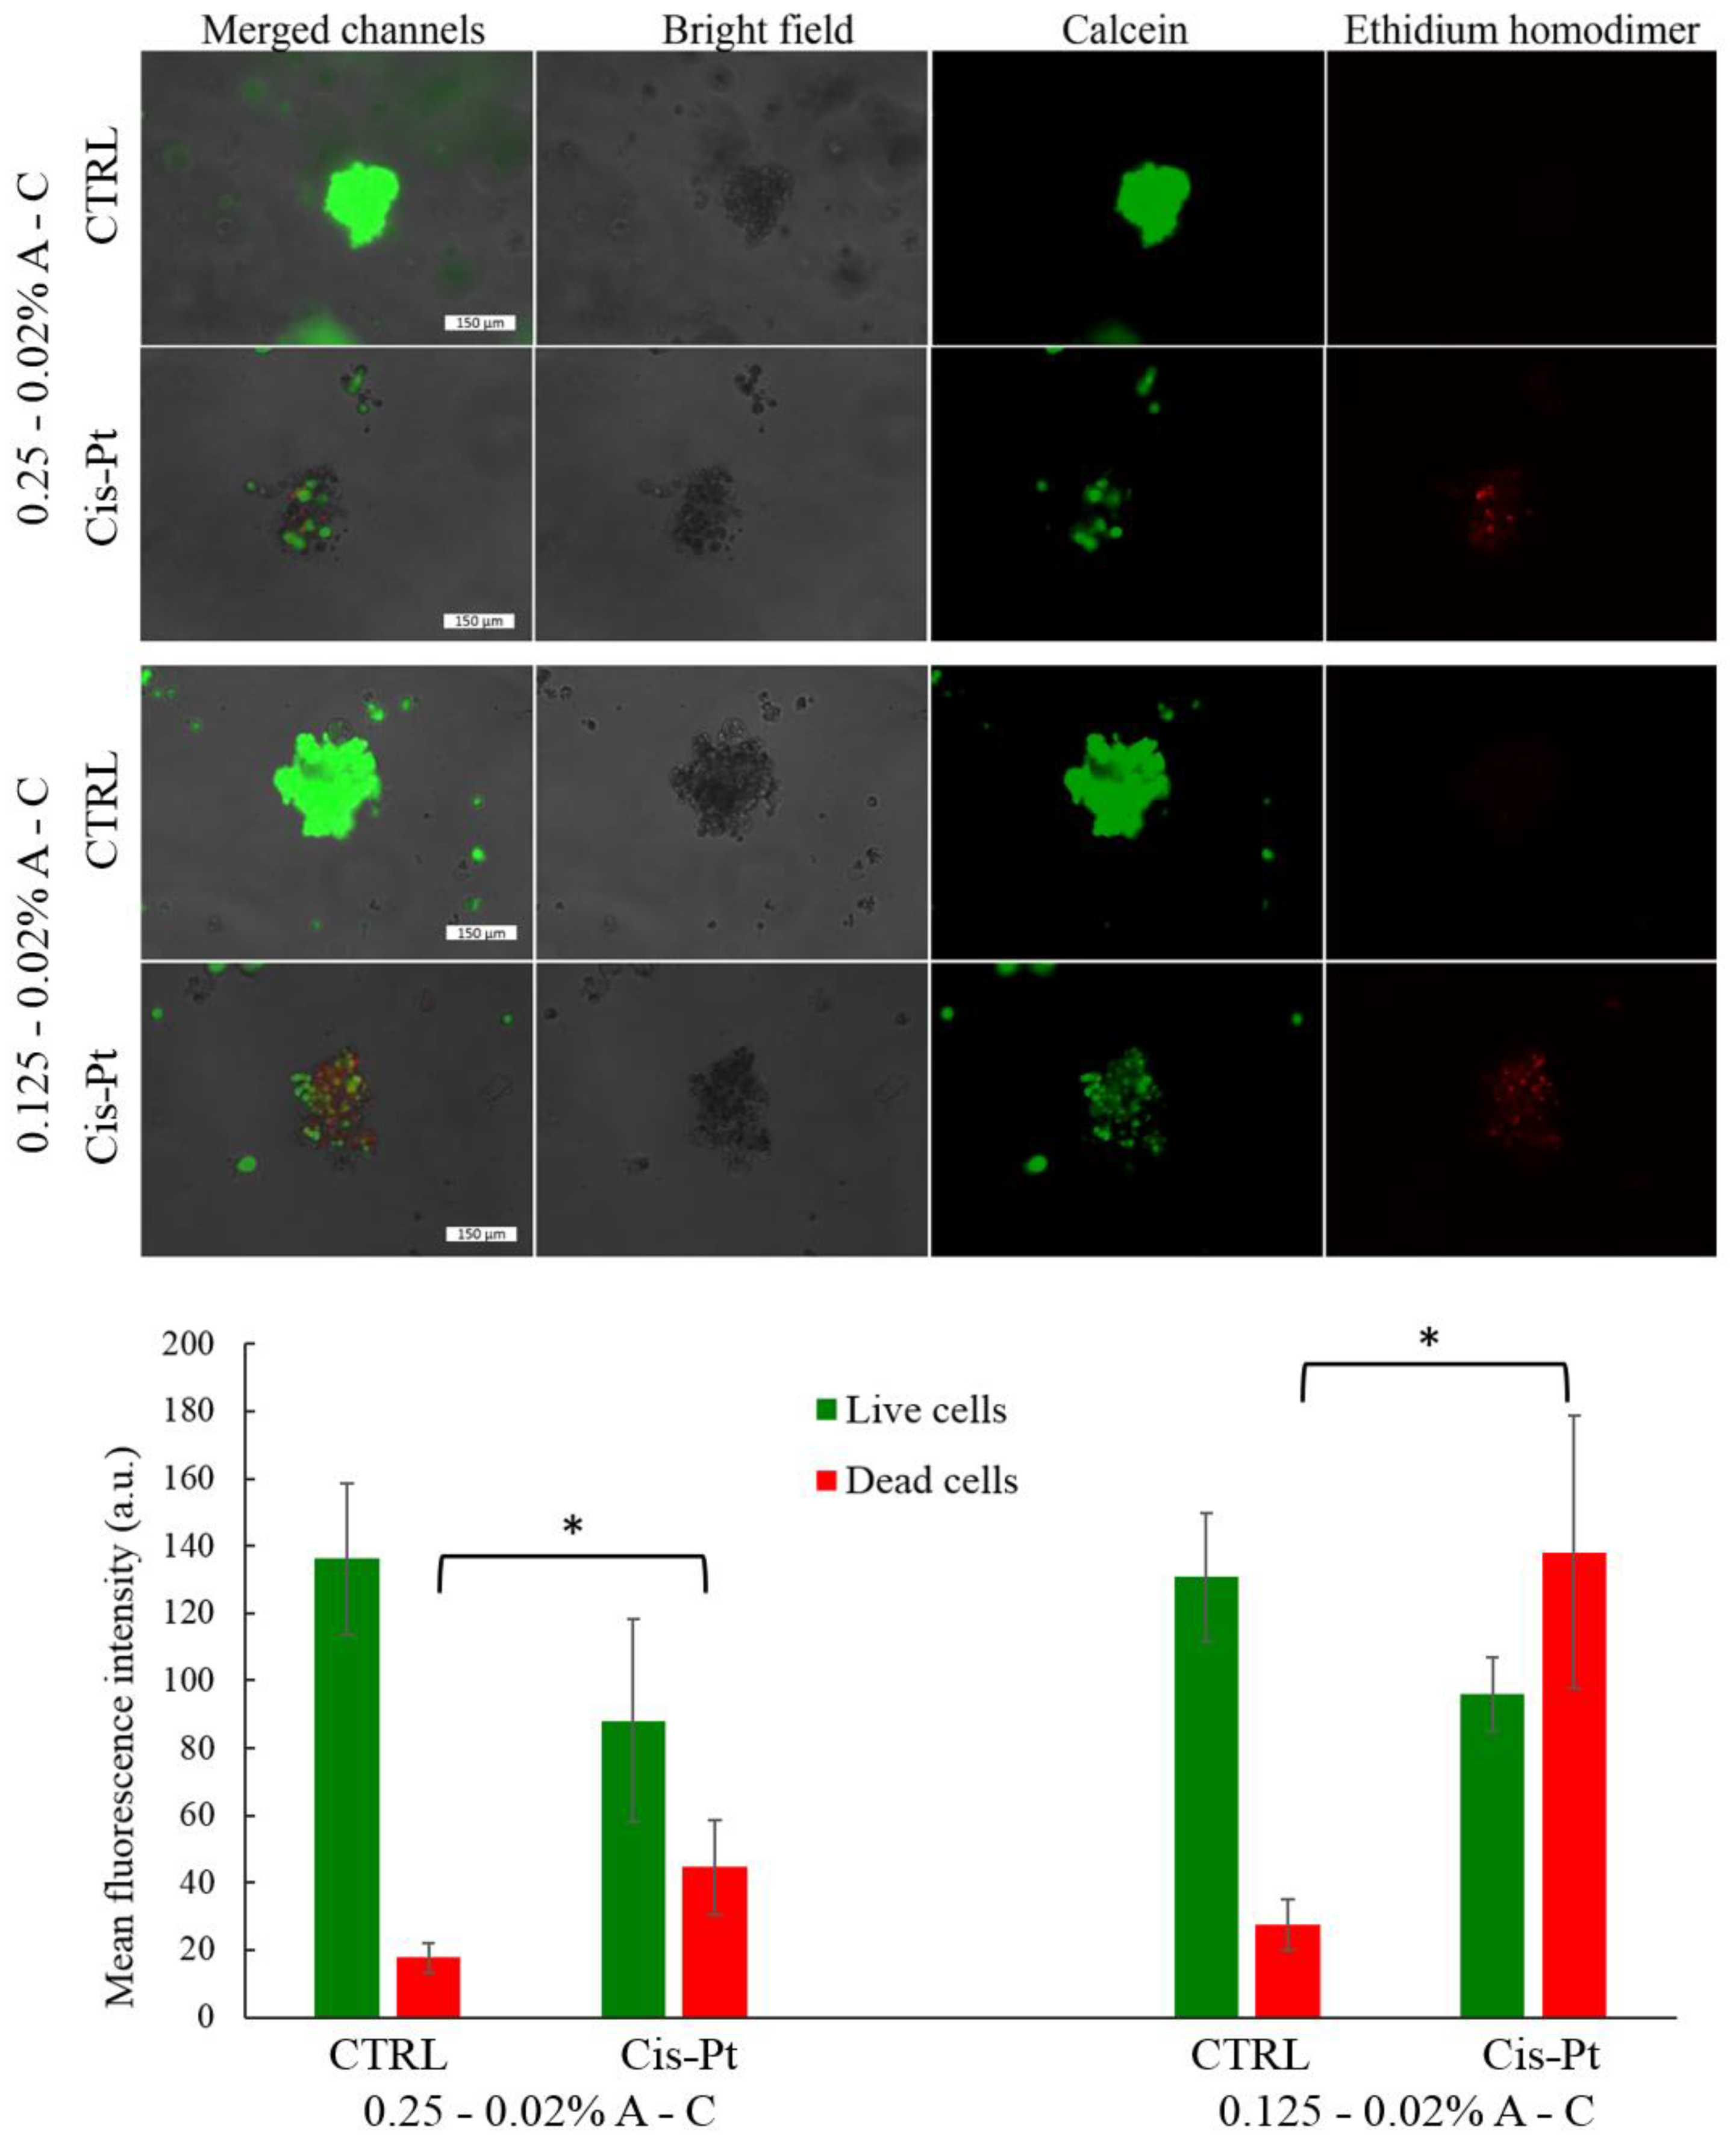
3.4. Cisplatin Delivery to the Embedded Spheroids
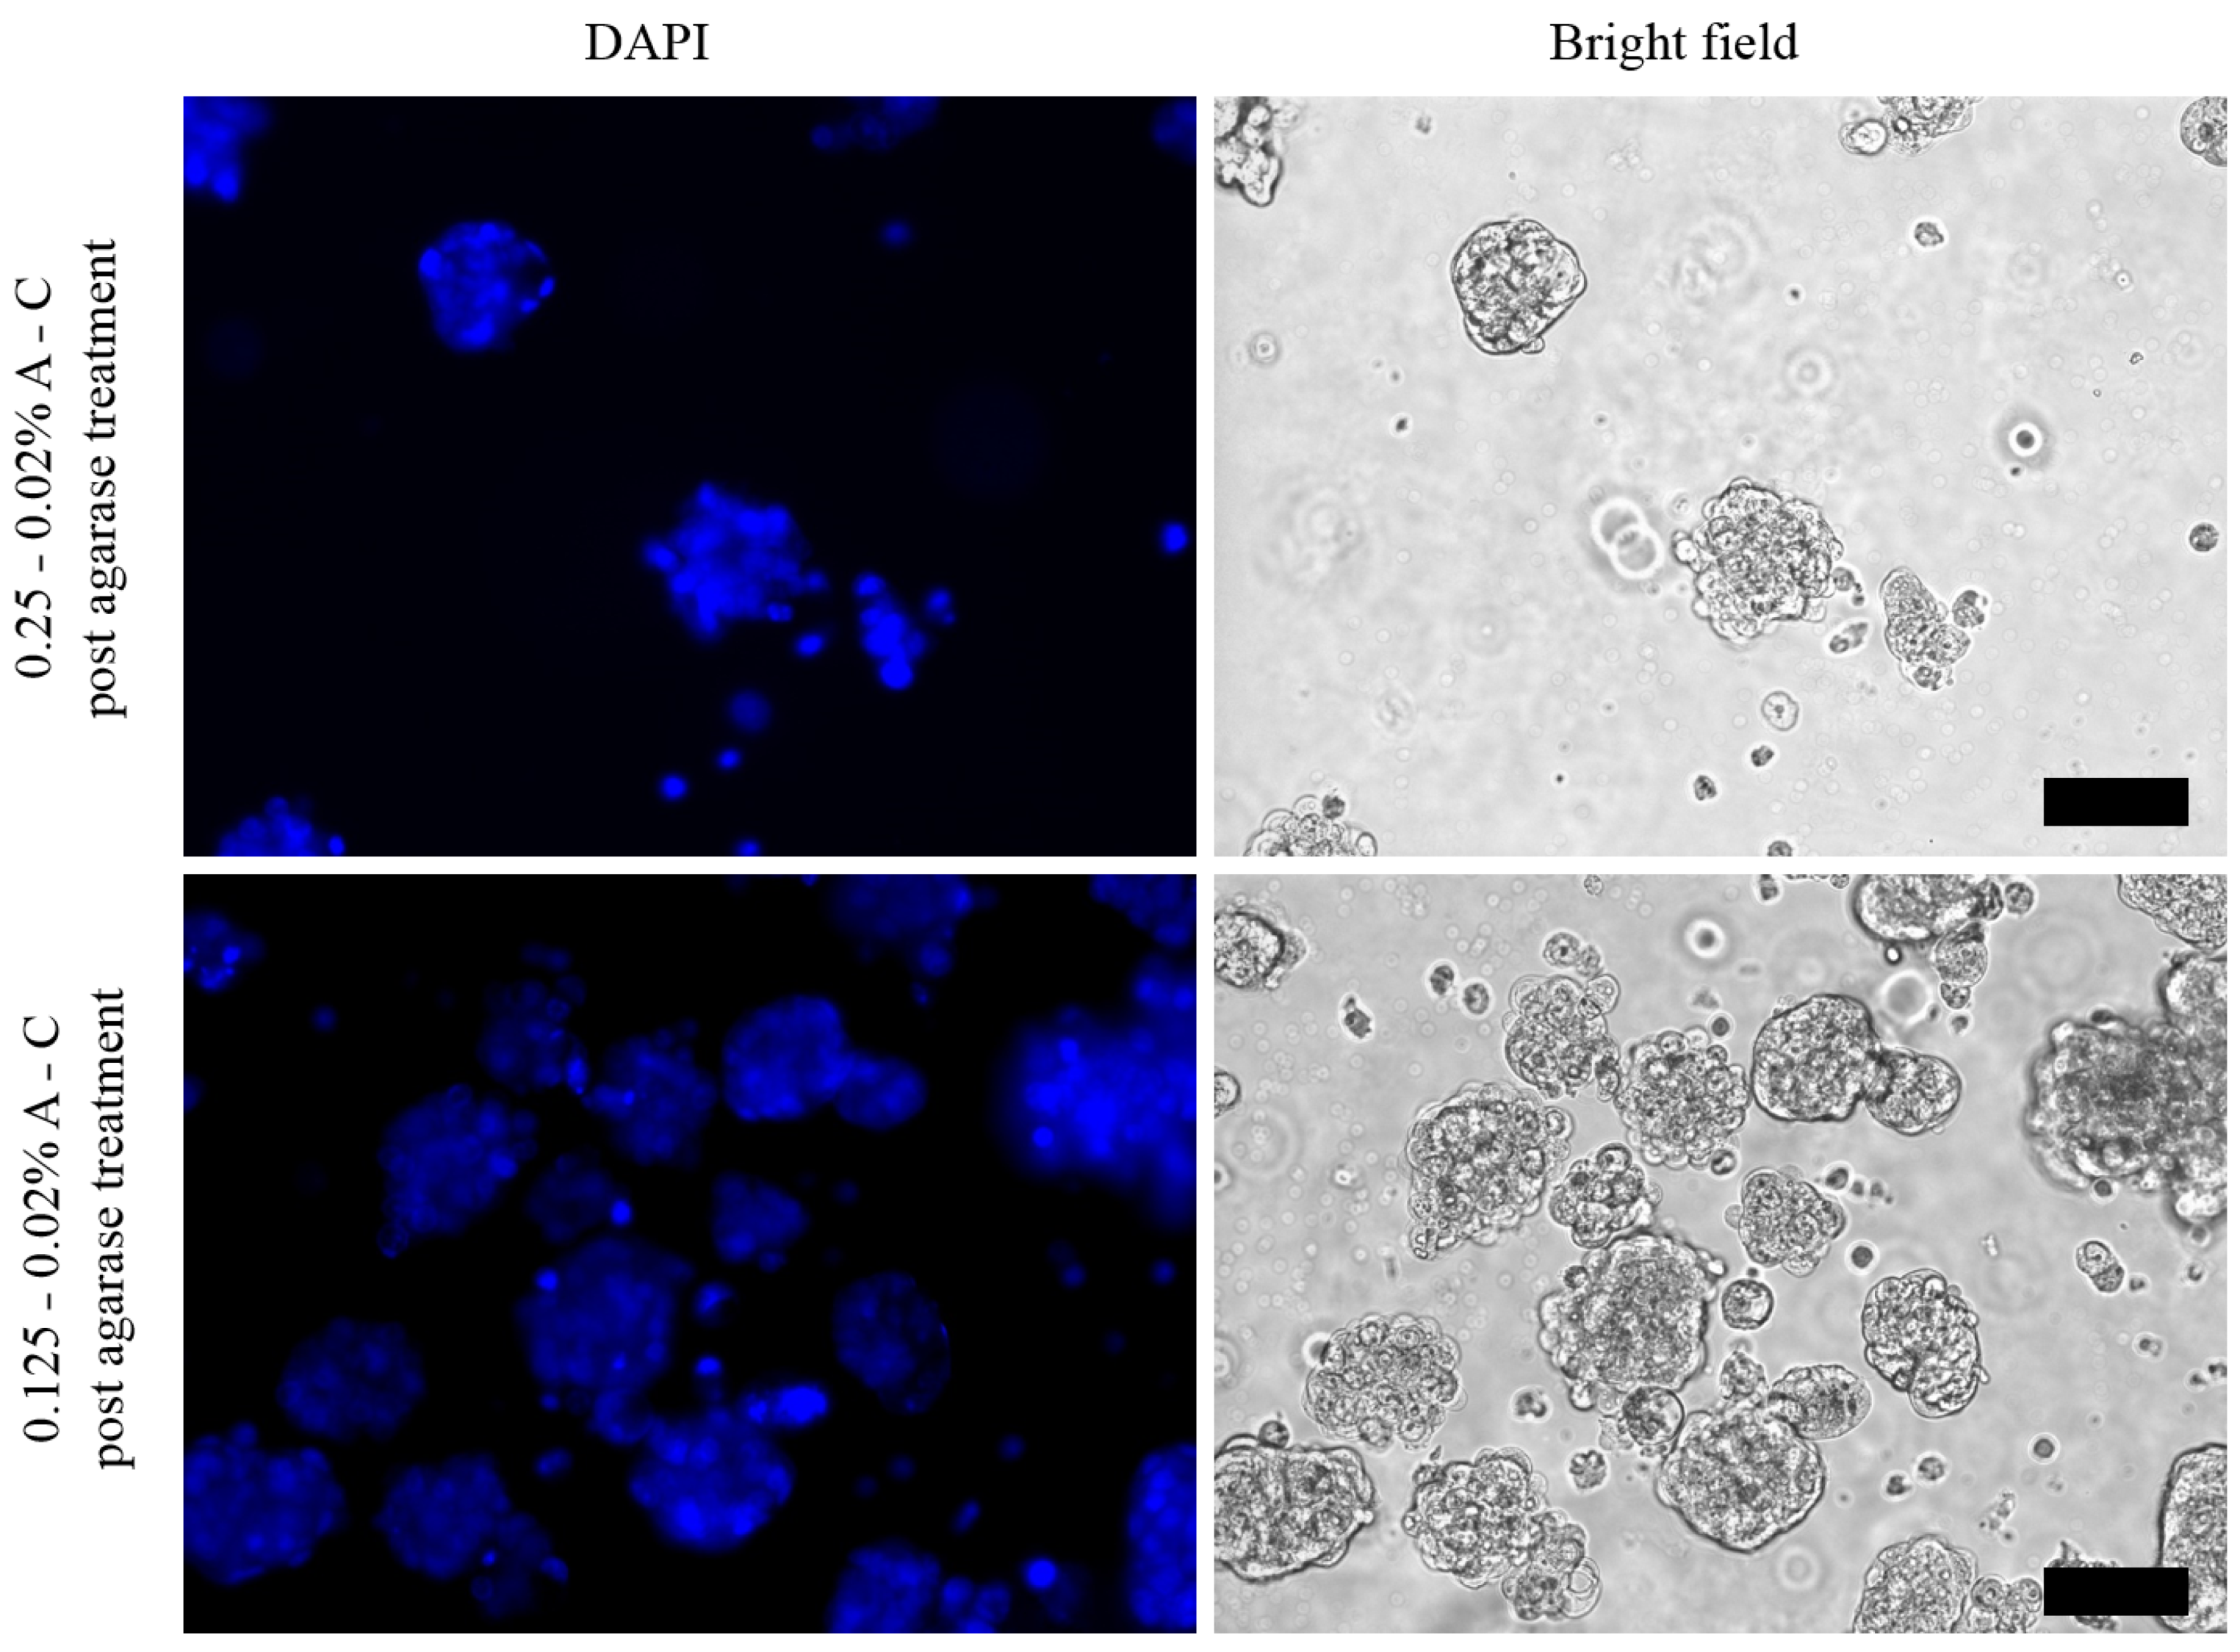
3.5. Enzymatic Digestion of Agarose for Spheroids Recovery
4. Discussion
5. Conclusions
Supplementary Materials
Author Contributions
Funding
Acknowledgments
Conflicts of Interest
References
- Cui, X.; Hartanto, Y.; Zhang, H. Advances in multicellular spheroids formation. J. R. Soc. Interface 2017, 14, 20160877. [Google Scholar] [CrossRef]
- Jensen, C.; Teng, Y. Is It Time to Start Transitioning From 2D to 3D Cell Culture? Front. Mol. Biosci. 2020, 7, 33. [Google Scholar] [CrossRef] [Green Version]
- Thakuri, P.S.; Liu, C.; Luker, G.D.; Tavana, H. Biomaterials-Based Approaches to Tumor Spheroid and Organoid Modeling. Adv. Healthc. Mater. 2018, 7, e1700980. [Google Scholar] [CrossRef] [PubMed]
- Singh, A.; Brito, I.; Lammerding, J. Beyond Tissue Stiffness and Bioadhesivity: Advanced Biomaterials to Model Tumor Microenvironments and Drug Resistance. Trends Cancer 2018, 4, 281–291. [Google Scholar] [CrossRef] [Green Version]
- Nath, S.; Devi, G.R. Three-dimensional culture systems in cancer research: Focus on tumor spheroid model. Pharmacol. Ther. 2016, 163, 94–108. [Google Scholar] [CrossRef] [PubMed] [Green Version]
- Athukorala, S.S.; Tran, T.S.; Balu, R.; Truong, V.K.; Chapman, J.; Dutta, N.K.; Roy Choudhury, N. 3D Printable Electrically Conductive Hydrogel Scaffolds for Biomedical Applications: A Review. Polymers 2021, 13, 474. [Google Scholar] [CrossRef] [PubMed]
- Zeeshan, M.; Dilshad, M.R.; Islam, A.; Iqbal, S.S.; Akram, M.S.; Mehmood, F.; Gull, N.; Khan, R.U. Synergistic effect of silane cross-linker (APTEOS) on PVA/gelatin blend films for packaging applications. High Perform. Polym. 2021, 0954008321994659. [Google Scholar] [CrossRef]
- Jiang, Z.; Liu, H.; He, H.; Ribbe, A.E.; Thayumanavan, S. Blended Assemblies of Amphiphilic Random and Block Copolymers for Tunable Encapsulation and Release of Hydrophobic Guest Molecules. Macromolecules 2020, 53, 2713–2723. [Google Scholar] [CrossRef]
- Teruki, N.; Kimiko, M.; Yasuhiko, T. Three-Dimensional Culture System of Cancer Cells Combined with Biomaterials for Drug Screening. Cancers 2020, 12, 2754. [Google Scholar] [CrossRef]
- Anderson, D.E.; Johnstone, B. Dynamic Mechanical Compression of Chondrocytes for Tissue Engineering: A Critical Review. Front. Bioeng. Biotechnol. 2017, 5, 76. [Google Scholar] [CrossRef] [PubMed] [Green Version]
- López-Marcial, G.R.; Zeng, A.Y.; Osuna, C.; Dennis, J.; García, J.M.; O’Connell, G.D. Agarose-Based Hydrogels as Suitable Bioprinting Materials for Tissue Engineering. ACS Biomater. Sci. Eng. 2018, 4, 3610–3616. [Google Scholar] [CrossRef]
- Tang, Y.; Liu, J.; Chen, Y. Agarose multi-wells for tumour spheroid formation and anti-cancer drug test. Microelectron. Eng. 2016, 158, 41–45. [Google Scholar] [CrossRef] [Green Version]
- Napolitano, A.P.; Dean, D.M.; Man, A.J.; Youssef, J.; Ho, D.N.; Rago, A.P.; Lech, M.P.; Morgan, J.R. Scaffold-free three-dimensional cell culture utilizing micromolded nonadhesive hydrogels. Biotechniques 2007, 43, 494–500. [Google Scholar] [CrossRef] [PubMed]
- Davidenko, N.; Schuster, C.F.; Bax, D.V.; Farndale, R.W.; Hamaia, S.; Best, S.M.; Cameron, R.E. Evaluation of cell binding to collagen and gelatin: A study of the effect of 2D and 3D architecture and surface chemistry. J. Mater. Sci. Mater. Med. 2016, 27, 148. [Google Scholar] [CrossRef] [PubMed] [Green Version]
- Davidenko, N.; Hamaia, S.; Bax, D.V.; Malcor, J.D.; Schuster, C.F.; Gullberg, D.; Farndale, R.W.; Best, S.M.; Cameron, R.E. Selecting the correct cellular model for assessing of the biological response of collagen-based biomaterials. Acta Biomater. 2018, 65, 88–101. [Google Scholar] [CrossRef] [PubMed]
- Hamaia, S.; Farndale, R.W. Integrin recognition motifs in the human collagens. Adv. Exp. Med. Biol. 2014, 819, 127–142. [Google Scholar] [CrossRef]
- Tibbitt, M.W.; Anseth, K.S. Hydrogels as extracellular matrix mimics for 3D cell culture. Biotechnol. Bioeng. 2009, 103, 655–663. [Google Scholar] [CrossRef] [Green Version]
- Li, Y.; Kumacheva, E. Hydrogel microenvironments for cancer spheroid growth and drug screening. Sci. Adv. 2018, 4, eaas8998. [Google Scholar] [CrossRef] [Green Version]
- Caliari, S.R.; Burdick, J.A. A practical guide to hydrogels for cell culture. Nat. Methods 2016, 13, 405–414. [Google Scholar] [CrossRef] [Green Version]
- Shin, S.; Ikram, M.; Subhan, F.; Kang, H.Y.; Lim, Y.; Lee, R.; Jin, S.; Jeong, Y.H.; Kwak, J.-Y.; Na, Y.-J.; et al. Alginate–marine collagen–agarose composite hydrogels as matrices for biomimetic 3D cell spheroid formation. RSC Adv. 2016, 6, 46952–46965. [Google Scholar] [CrossRef]
- Cambria, E.; Brunner, S.; Heusser, S.; Fisch, P.; Hitzl, W.; Ferguson, S.J.; Wuertz-Kozak, K. Cell-Laden Agarose-Collagen Composite Hydrogels for Mechanotransduction Studies. Front. Bioeng. Biotechnol. 2020, 8, 346. [Google Scholar] [CrossRef] [Green Version]
- Ulrich, T.A.; Jain, A.; Tanner, K.; MacKay, J.L.; Kumar, S. Probing cellular mechanobiology in three-dimensional culture with collagen-agarose matrices. Biomaterials 2010, 31, 1875–1884. [Google Scholar] [CrossRef]
- Guimarães, C.F.; Gasperini, L.; Marques, A.P.; Reis, R.L. The stiffness of living tissues and its implications for tissue engineering. Nat. Rev. Mater. 2020, 5, 351–370. [Google Scholar] [CrossRef]
- Butcher, D.T.; Alliston, T.; Weaver, V.M. A tense situation: Forcing tumour progression. Nat. Rev. Cancer 2009, 9, 108–122. [Google Scholar] [CrossRef]
- Gallo, N.; Lunetti, P.; Bettini, S.; Barca, A.; Madaghiele, M.; Valli, L.; Capobianco, L.; Sannino, A.; Salvatore, L. Assessment of physico-chemical and biological properties of sericin-collagen substrates for PNS regeneration. Int. J. Polym. Mater. 2020, 70, 403–413. [Google Scholar] [CrossRef]
- Terzi, A.; Storelli, E.; Bettini, S.; Sibillano, T.; Altamura, D.; Salvatore, L.; Madaghiele, M.; Romano, A.; Siliqi, D.; Ladisa, M.; et al. Effects of processing on structural, mechanical and biological properties of collagen-based substrates for regenerative medicine. Sci. Rep. 2018, 8, 1429. [Google Scholar] [CrossRef] [Green Version]
- Gallo, L.C.; Madaghiele, M.; Salvatore, L.; Barca, A.; Scialla, S.; Bettini, S.; Valli, L.; Verri, T.; Bucalá, V.; Sannino, A. Integration of PLGA Microparticles in Collagen-Based Matrices: Tunable Scaffold Properties and Interaction Between Microparticles and Human Epithelial-Like Cells. Int. J. Polym. Mater. 2020, 69, 137–147. [Google Scholar] [CrossRef]
- Monaco, G.; Cholas, R.; Salvatore, L.; Madaghiele, M.; Sannino, A. Sterilization of collagen scaffolds designed for peripheral nerve regeneration: Effect on microstructure, degradation and cellular colonization. Mater. Sci. Eng. C Mater. Biol. Appl. 2017, 71, 335–344. [Google Scholar] [CrossRef] [PubMed]
- Oza, M.D.; Prasad, K.; Siddhanta, A.K. One-pot synthesis of fluorescent polysaccharides: Adenine grafted agarose and carrageenan. Carbohydr. Res. 2012, 357, 23–31. [Google Scholar] [CrossRef] [PubMed]
- Petibois, C.; Gouspillou, G.; Wehbe, K.; Delage, J.P.; Déléris, G. Analysis of type I and IV collagens by FT-IR spectroscopy and imaging for a molecular investigation of skeletal muscle connective tissue. Anal. Bioanal. Chem. 2006, 386, 1961–1966. [Google Scholar] [CrossRef] [PubMed]
- Singh, Y.P.; Bhardwaj, N.; Mandal, B.B. Potential of Agarose/Silk Fibroin Blended Hydrogel for in Vitro Cartilage Tissue Engineering. ACS Appl. Mater. Interfaces 2016, 8, 21236–21249. [Google Scholar] [CrossRef]
- Li, Y.; Khuu, N.; Prince, E.; Tao, H.; Zhang, N.; Chen, Z.; Gevorkian, A.; McGuigan, A.P.; Kumacheva, E. Matrix Stiffness-Regulated Growth of Breast Tumor Spheroids and Their Response to Chemotherapy. Biomacromolecules 2021, 22, 419–429. [Google Scholar] [CrossRef]
- Kalli, M.; Stylianopoulos, T. Defining the Role of Solid Stress and Matrix Stiffness in Cancer Cell Proliferation and Metastasis. Front. Oncol. 2018, 8, 55. [Google Scholar] [CrossRef] [PubMed]
- Nguyen-Ngoc, K.V.; Cheung, K.J.; Brenot, A.; Shamir, E.R.; Gray, R.S.; Hines, W.C.; Yaswen, P.; Werb, Z.; Ewald, A.J. ECM microenvironment regulates collective migration and local dissemination in normal and malignant mammary epithelium. Proc. Natl. Acad. Sci. USA 2012, 109, E2595–E2604. [Google Scholar] [CrossRef] [PubMed] [Green Version]
- Antunes, J.; Gaspar, V.M.; Ferreira, L.; Monteiro, M.; Henrique, R.; Jerónimo, C.; Mano, J.F. In-air production of 3D co-culture tumor spheroid hydrogels for expedited drug screening. Acta Biomater. 2019, 94, 392–409. [Google Scholar] [CrossRef]
- Song, H.; Cai, G.-H.; Liang, J.; Ao, D.-S.; Wang, H.; Yang, Z.-H. Three-dimensional culture and clinical drug responses of a highly metastatic human ovarian cancer HO-8910PM cells in nanofibrous microenvironments of three hydrogel biomaterials. J. Nanobiotechnology 2020, 18, 90. [Google Scholar] [CrossRef] [PubMed]
- Flores-Torres, S.; Peza-Chavez, O.; Kuasne, H.; Munguia-Lopez, J.G.; Kort-Mascort, J.; Ferri, L.; Jiang, T.; Rajadurai, C.V.; Park, M.; Sangwan, V.; et al. Alginate–gelatin–Matrigel hydrogels enable the development and multigenerational passaging of patient-derived 3D bioprinted cancer spheroid models. Biofabrication 2021, 13, 025001. [Google Scholar] [CrossRef] [PubMed]
- Malmqvist, M. Degradation of agarose gels and solutions by bacterial agarase. Carbohydr. Res. 1978, 62, 337–348. [Google Scholar] [CrossRef]
- Fu, X.T.; Kim, S.M. Agarase: Review of major sources, categories, purification method, enzyme characteristics and applications. Mar. Drugs 2010, 8, 200–218. [Google Scholar] [CrossRef] [Green Version]
- Tian, Z.; Liu, W.; Li, G. The microstructure and stability of collagen hydrogel cross-linked by glutaraldehyde. Polym. Degrad. Stab. 2016, 130, 264–270. [Google Scholar] [CrossRef]
- Griffanti, G.; Nazhat, S.N. Dense fibrillar collagen-based hydrogels as functional osteoid-mimicking scaffolds. Int. Mater. Rev. 2020, 65, 502–521. [Google Scholar] [CrossRef]
- Walimbe, T.; Panitch, A. Best of Both Hydrogel Worlds: Harnessing Bioactivity and Tunability by Incorporating Glycosaminoglycans in Collagen Hydrogels. Bioengineering 2020, 7, 156. [Google Scholar] [CrossRef] [PubMed]
- Tako, M.; Nakamura, S. Gelation mechanism of agarose. Carbohydr. Res. 1988, 180, 277–284. [Google Scholar] [CrossRef]
- Monteiro, M.V.; Gaspar, V.M.; Ferreira, L.P.; Mano, J.F. Hydrogel 3D in vitro tumor models for screening cell aggregation mediated drug response. Biomater. Sci. 2020, 8, 1855–1864. [Google Scholar] [CrossRef]
- Iglesias, M.J.; Beloqui, I.; Garcia-Garcia, F.; Leis, O.; Vazquez-Martin, A.; Eguiara, A.; Cufi, S.; Pavon, A.; Menendez, J.A.; Dopazo, J.; et al. Mammosphere formation in breast carcinoma cell lines depends upon expression of E-cadherin. PLoS ONE 2013, 8, e77281. [Google Scholar] [CrossRef] [Green Version]
- Tasdemir, N.; Bossart, E.A.; Li, Z.; Zhu, L. Comprehensive Phenotypic Characterization of Human Invasive Lobular Carcinoma Cell Lines in 2D and 3D Cultures. Cancer Res. 2018, 78, 6209–6222. [Google Scholar] [CrossRef] [Green Version]
- Kruger, T.M.; Bell, K.J.; Lansakara, T.I.; Tivanski, A.V.; Doorn, J.A.; Stevens, L.L. Reduced Extracellular Matrix Stiffness Prompts SH-SY5Y Cell Softening and Actin Turnover To Selectively Increase Aβ(1–42) Endocytosis. ACS Chem. Neurosci. 2019, 10, 1284–1293. [Google Scholar] [CrossRef]
- Ranamukhaarachchi, S.K.; Modi, R.N.; Han, A.; Velez, D.O.; Kumar, A.; Engler, A.J.; Fraley, S.I. Macromolecular crowding tunes 3D collagen architecture and cell morphogenesis. Biomater. Sci. 2019, 7, 618–633. [Google Scholar] [CrossRef] [Green Version]
- Trappmann, B.; Gautrot, J.E.; Connelly, J.T.; Strange, D.G.; Li, Y.; Oyen, M.L.; Cohen Stuart, M.A.; Boehm, H.; Li, B.; Vogel, V.; et al. Extracellular-matrix tethering regulates stem-cell fate. Nat. Mater. 2012, 11, 642–649. [Google Scholar] [CrossRef]
- Wang, Y.; Gong, T.; Zhang, Z.R.; Fu, Y. Matrix Stiffness Differentially Regulates Cellular Uptake Behavior of Nanoparticles in Two Breast Cancer Cell Lines. ACS Appl. Mater. Interfaces 2017, 9, 25915–25928. [Google Scholar] [CrossRef] [PubMed]
- Wong, S.H.M.; Fang, C.M.; Chuah, L.H.; Leong, C.O.; Ngai, S.C. E-cadherin: Its dysregulation in carcinogenesis and clinical implications. Crit. Rev. Oncol. Hematol. 2018, 121, 11–22. [Google Scholar] [CrossRef] [PubMed]
- Vergara, D.; Simeone, P.; Franck, J.; Trerotola, M.; Giudetti, A.; Capobianco, L.; Tinelli, A.; Bellomo, C.; Fournier, I.; Gaballo, A.; et al. Translating epithelial mesenchymal transition markers into the clinic: Novel insights from proteomics. EuPA Open Proteom. 2016, 10, 31–41. [Google Scholar] [CrossRef] [PubMed] [Green Version]


Publisher’s Note: MDPI stays neutral with regard to jurisdictional claims in published maps and institutional affiliations. |
© 2021 by the authors. Licensee MDPI, Basel, Switzerland. This article is an open access article distributed under the terms and conditions of the Creative Commons Attribution (CC BY) license (https://creativecommons.org/licenses/by/4.0/).
Share and Cite
Quarta, A.; Gallo, N.; Vergara, D.; Salvatore, L.; Nobile, C.; Ragusa, A.; Gaballo, A. Investigation on the Composition of Agarose–Collagen I Blended Hydrogels as Matrices for the Growth of Spheroids from Breast Cancer Cell Lines. Pharmaceutics 2021, 13, 963. https://doi.org/10.3390/pharmaceutics13070963
Quarta A, Gallo N, Vergara D, Salvatore L, Nobile C, Ragusa A, Gaballo A. Investigation on the Composition of Agarose–Collagen I Blended Hydrogels as Matrices for the Growth of Spheroids from Breast Cancer Cell Lines. Pharmaceutics. 2021; 13(7):963. https://doi.org/10.3390/pharmaceutics13070963
Chicago/Turabian StyleQuarta, Alessandra, Nunzia Gallo, Daniele Vergara, Luca Salvatore, Concetta Nobile, Andrea Ragusa, and Antonio Gaballo. 2021. "Investigation on the Composition of Agarose–Collagen I Blended Hydrogels as Matrices for the Growth of Spheroids from Breast Cancer Cell Lines" Pharmaceutics 13, no. 7: 963. https://doi.org/10.3390/pharmaceutics13070963