
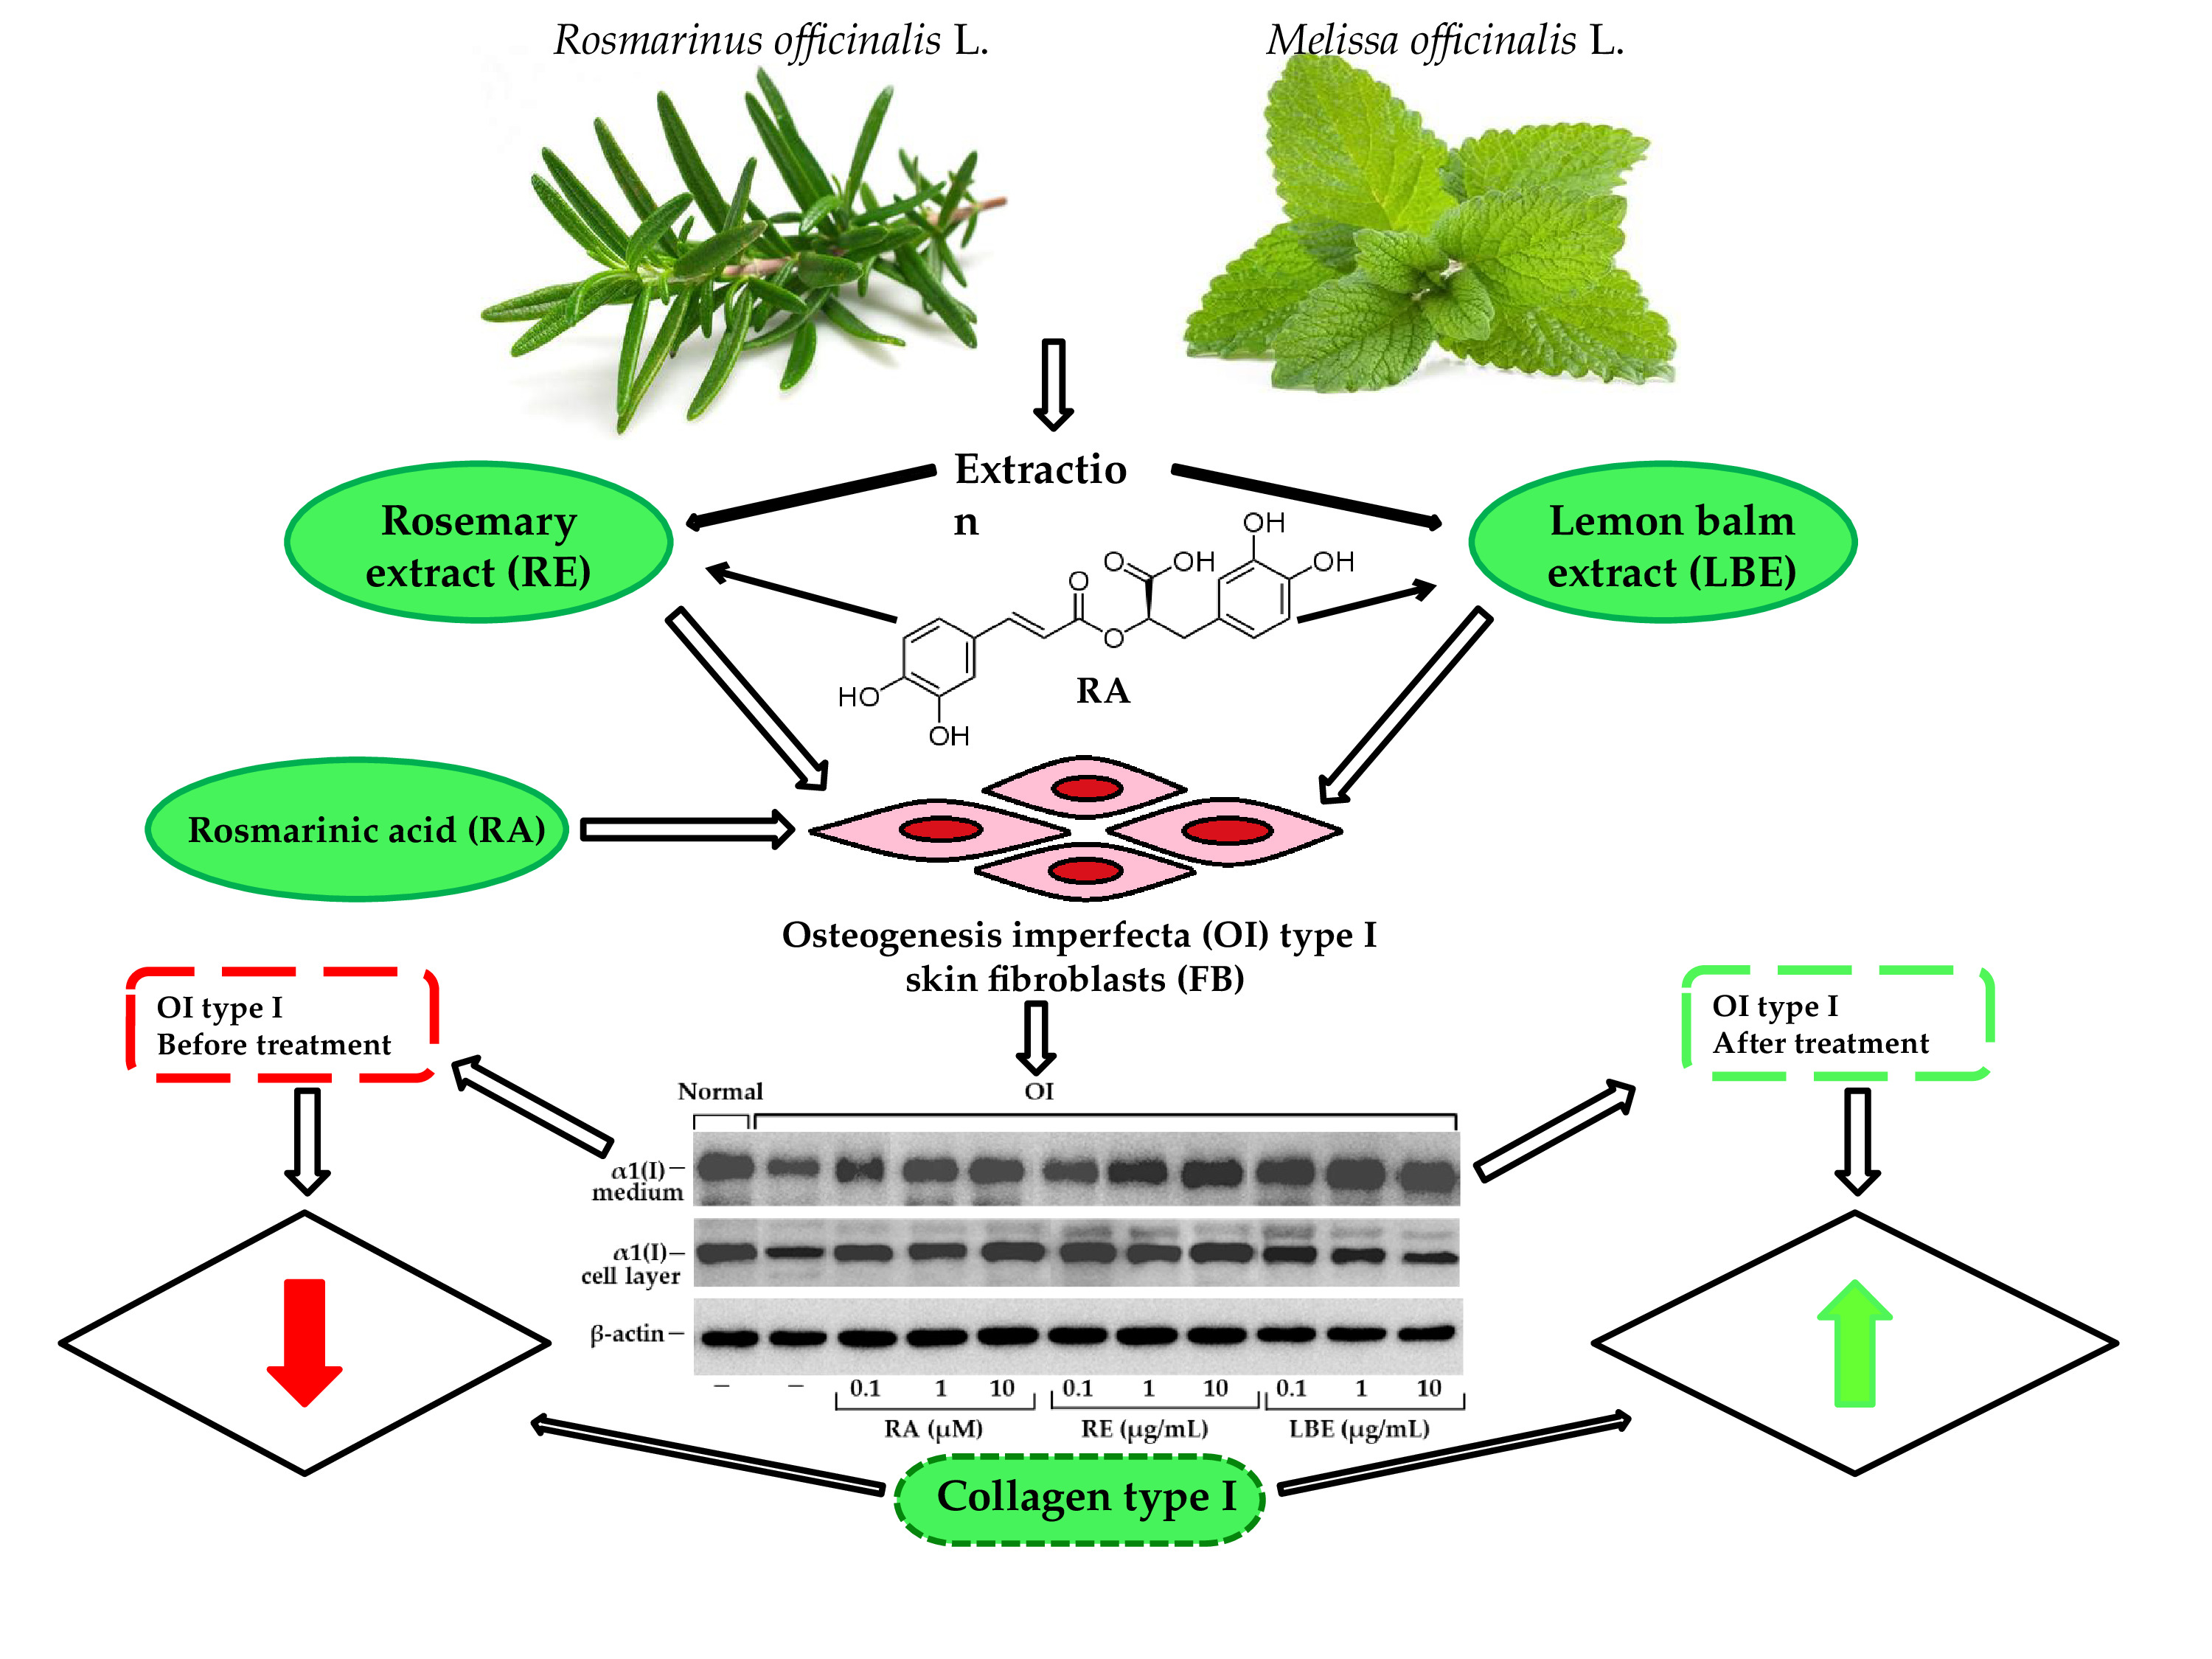
The Stimulating Effect of Rosmarinic Acid and Extracts from Rosemary and Lemon Balm on Collagen Type I Biosynthesis in Osteogenesis Imperfecta Type I Skin Fibroblasts

 , , ,
, , ,  ,
,  , and
, and
Abstract
:
1. Introduction
2. Materials and Methods
2.1. Chemicals
2.2. Preparation of RE and LBE Extracts
2.3. Liquid Chromatography-Photo-Diode Array Detector-Mass Spectrometry (LC-PDA-MS) Analysis of RE and LBE
2.4. Preparation of Standard Solution for Quantification
2.5. Method Validation
2.5.1. Selectivity
2.5.2. Linearity
2.5.3. Limits of Detection (LOD) and Quantification (LOQ)
2.5.4. Accuracy and Precision
2.6. Primary Human Skin Fibroblasts
2.7. Cell Viability Assay
2.8. Quantitative Real-Time PCR Analysis
2.9. Enzyme-Linked Immunosorbent Assay (ELISA) Measurement for Procollagen Type I
2.10. Western Blot
2.11. Steady-State Analysis of Type I Collagen
2.12. Zymography
2.13. Statistical Analysis
3. Results
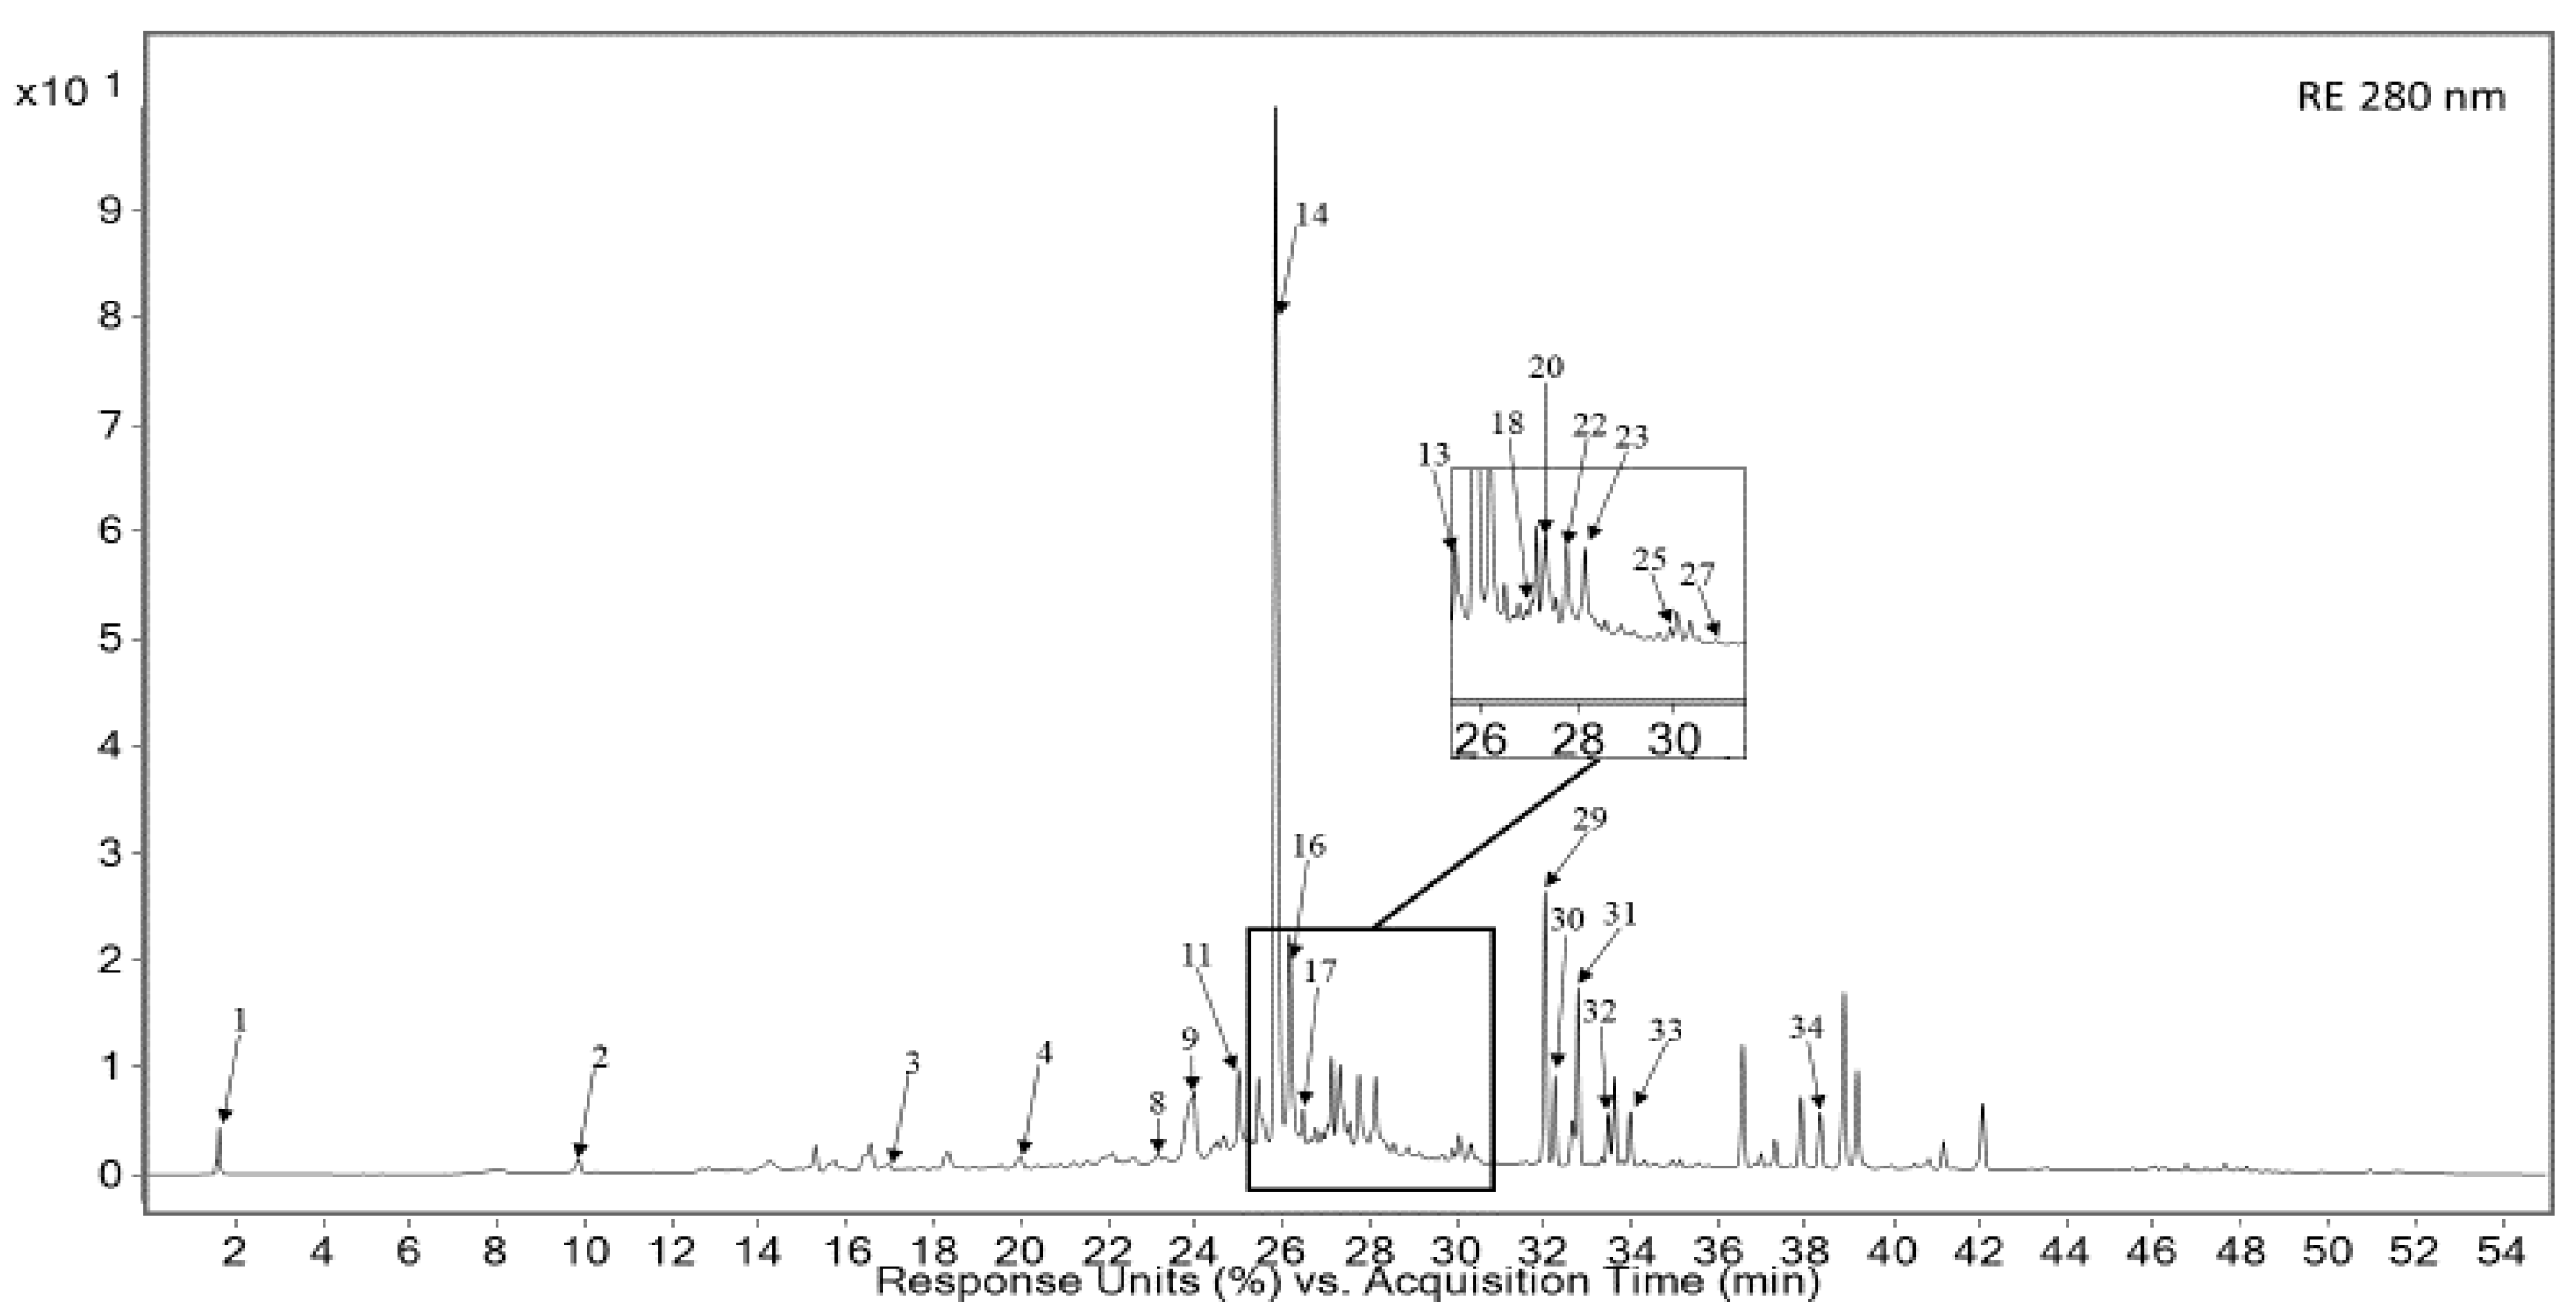
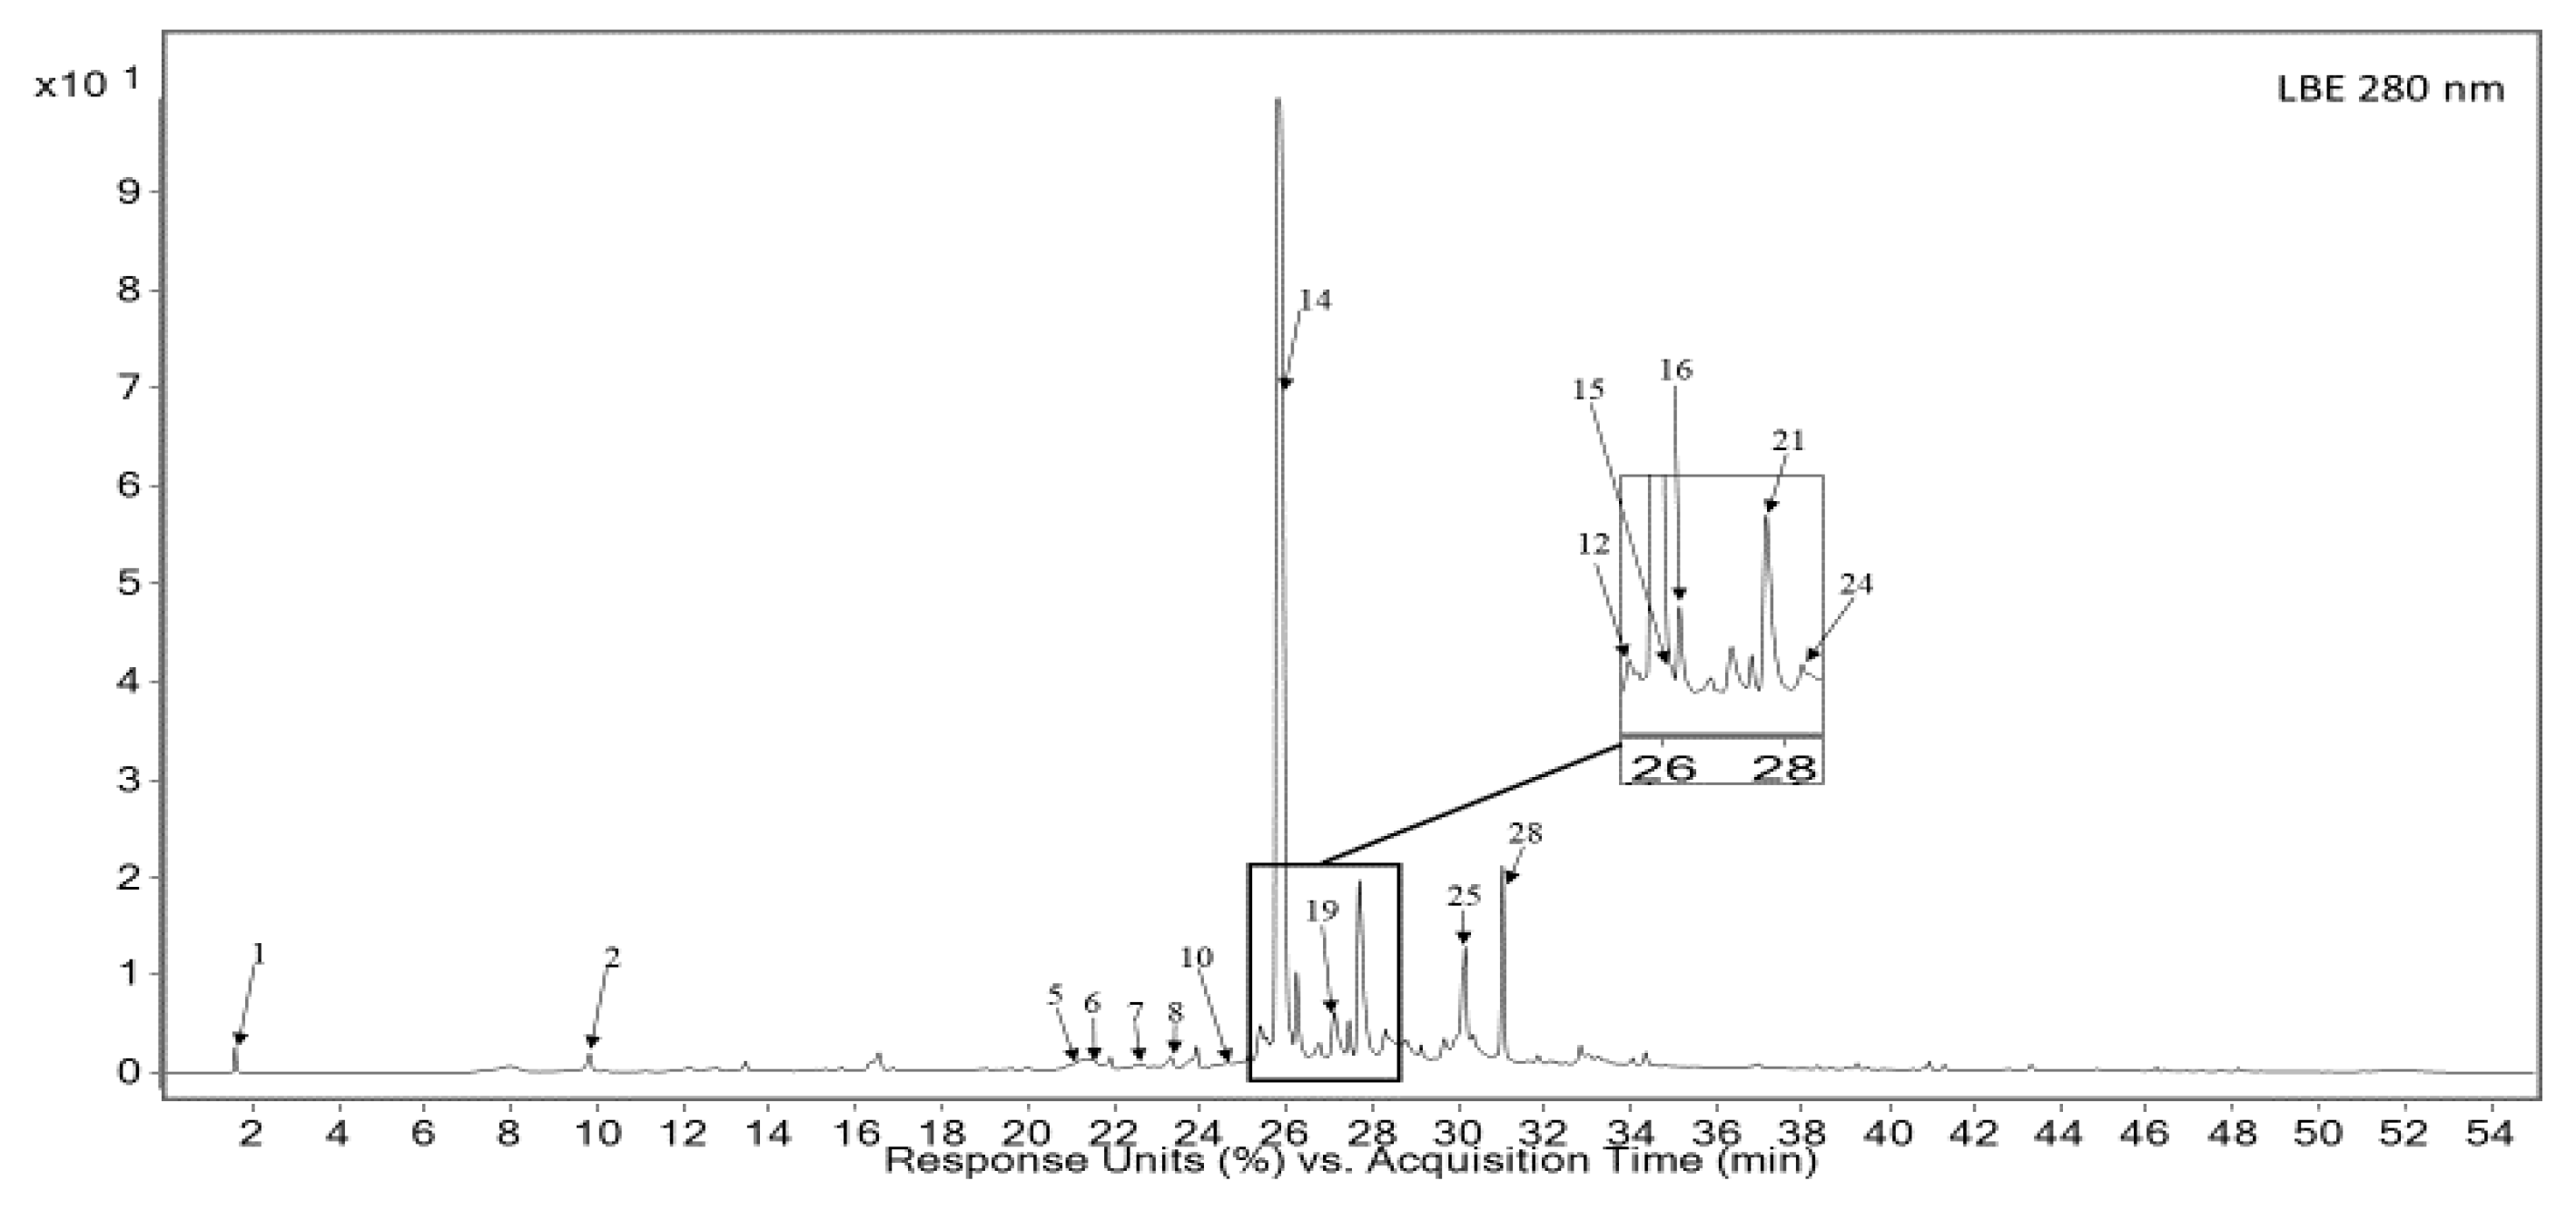
3.1. Qualitative and Quantitative Analysis of RE and LBE
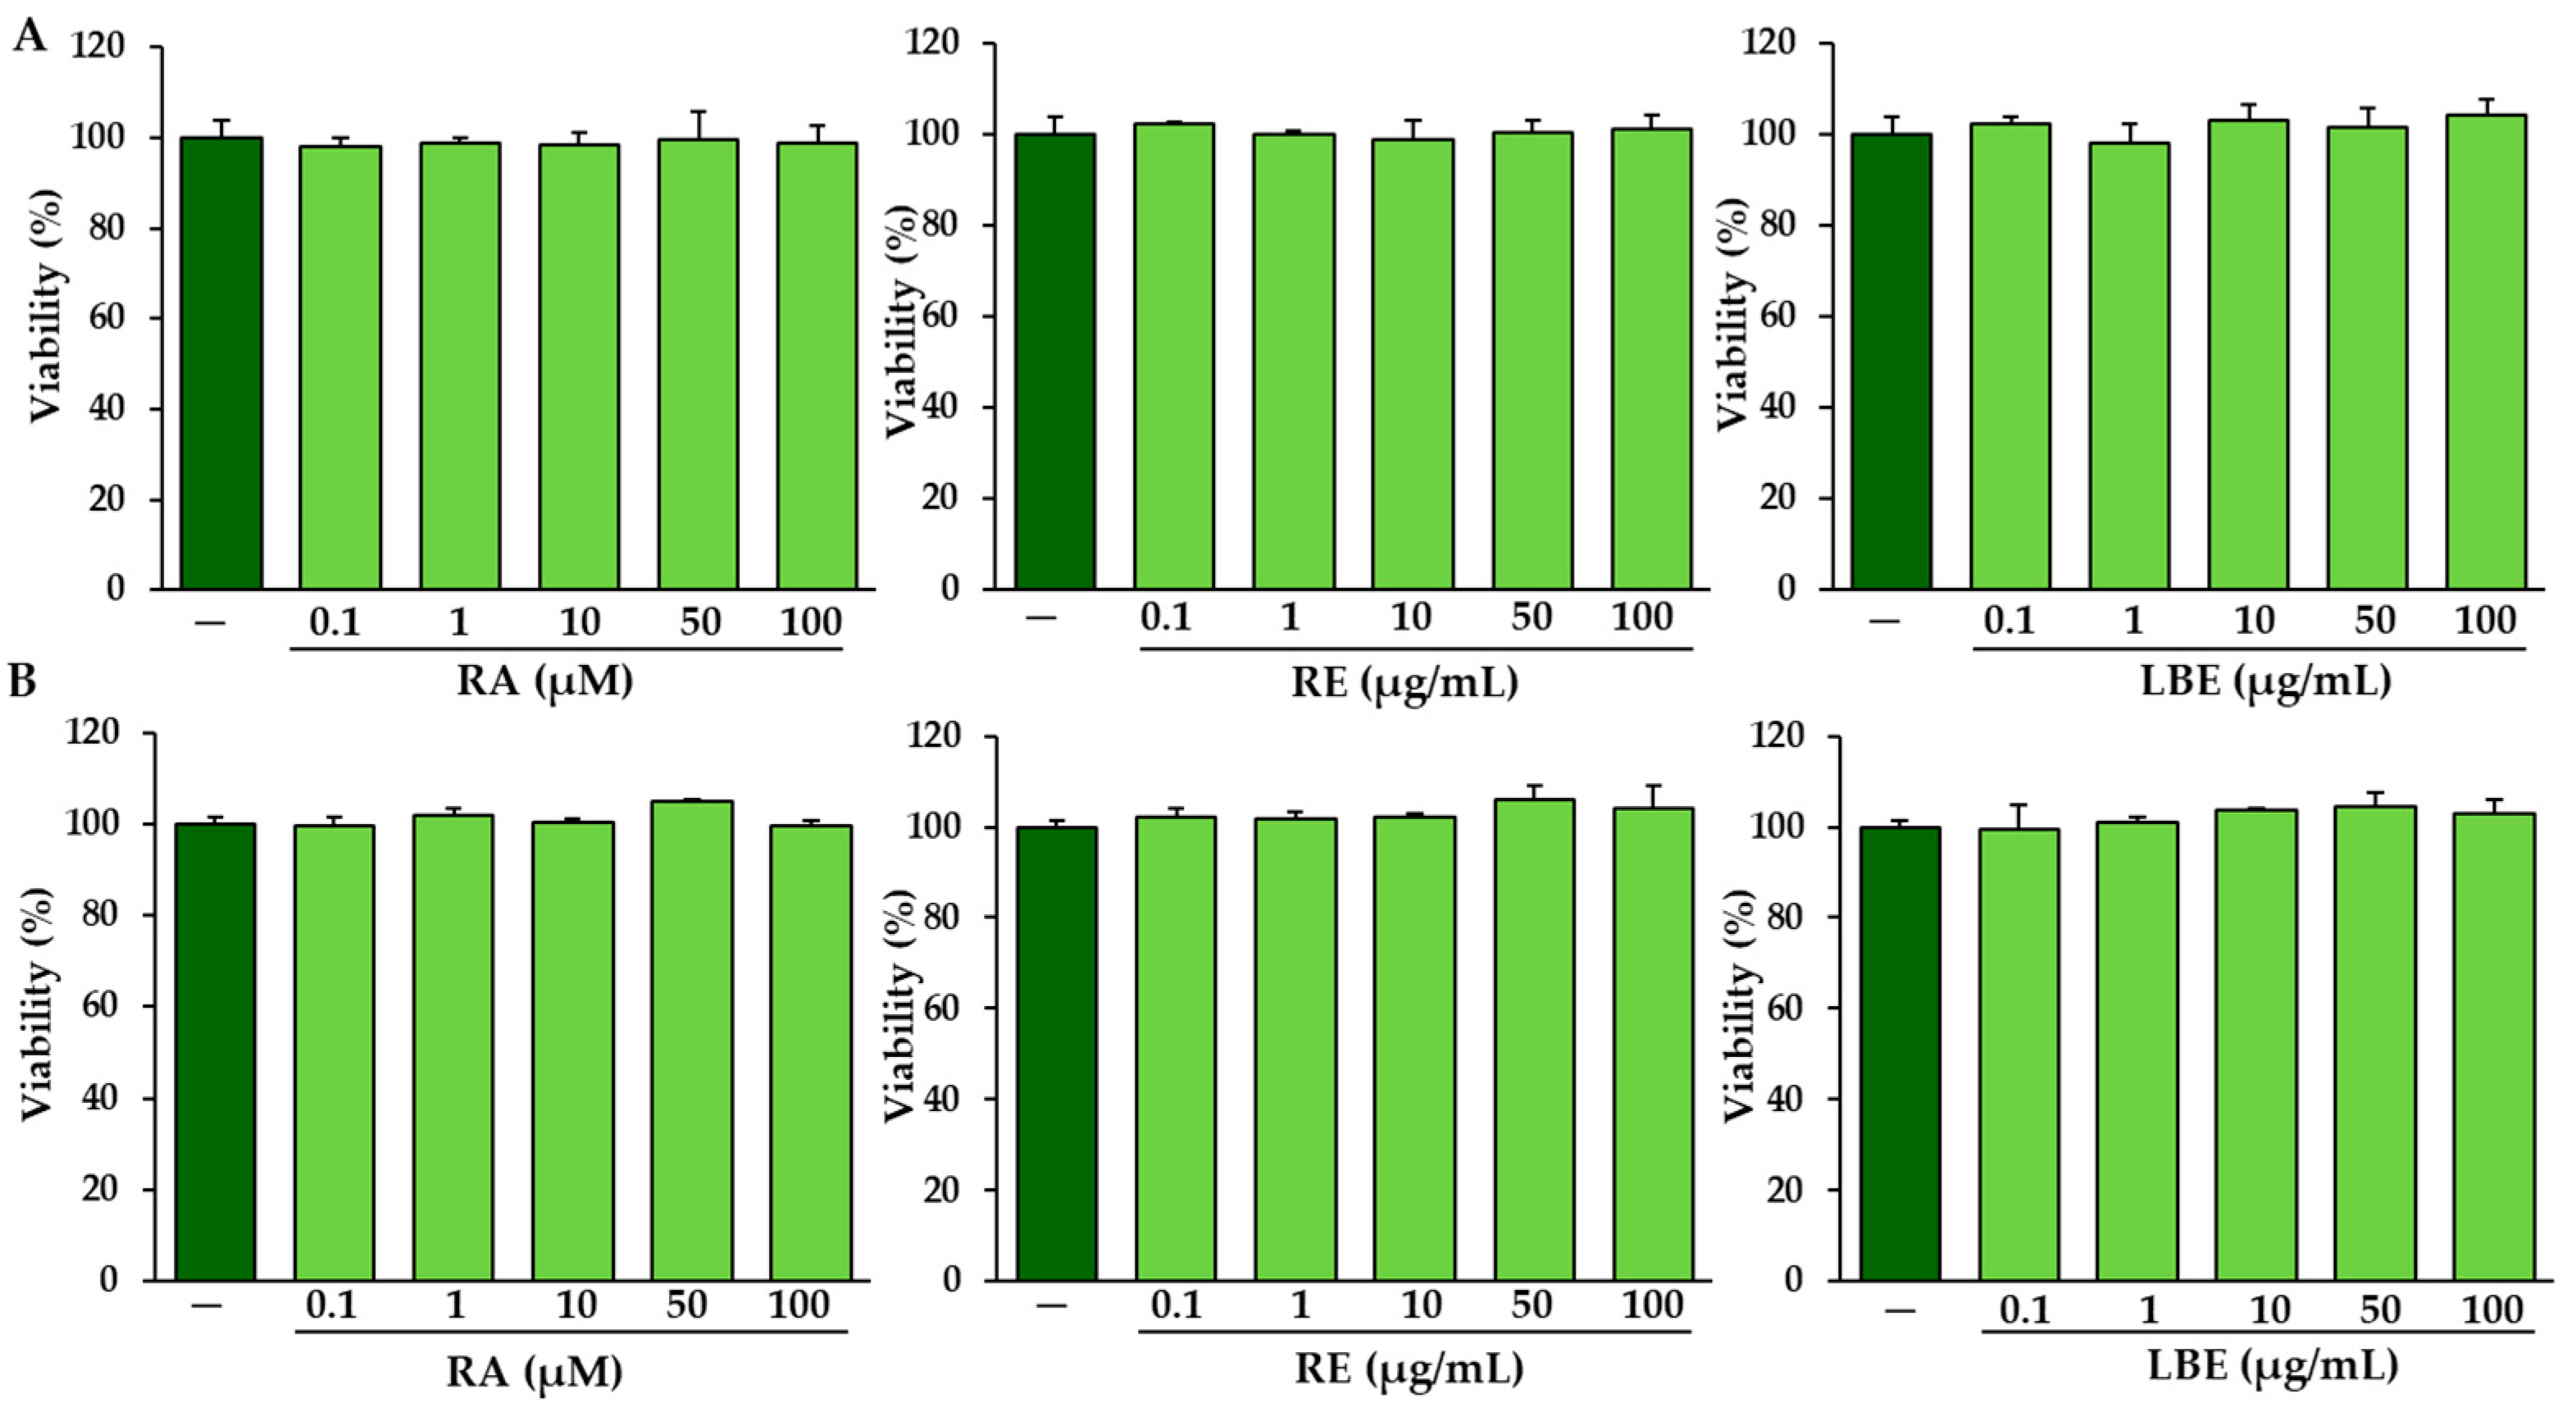
3.2. The Influence of RA, RE and LBE on the Viabiliy of Normal and OI Fibroblasts
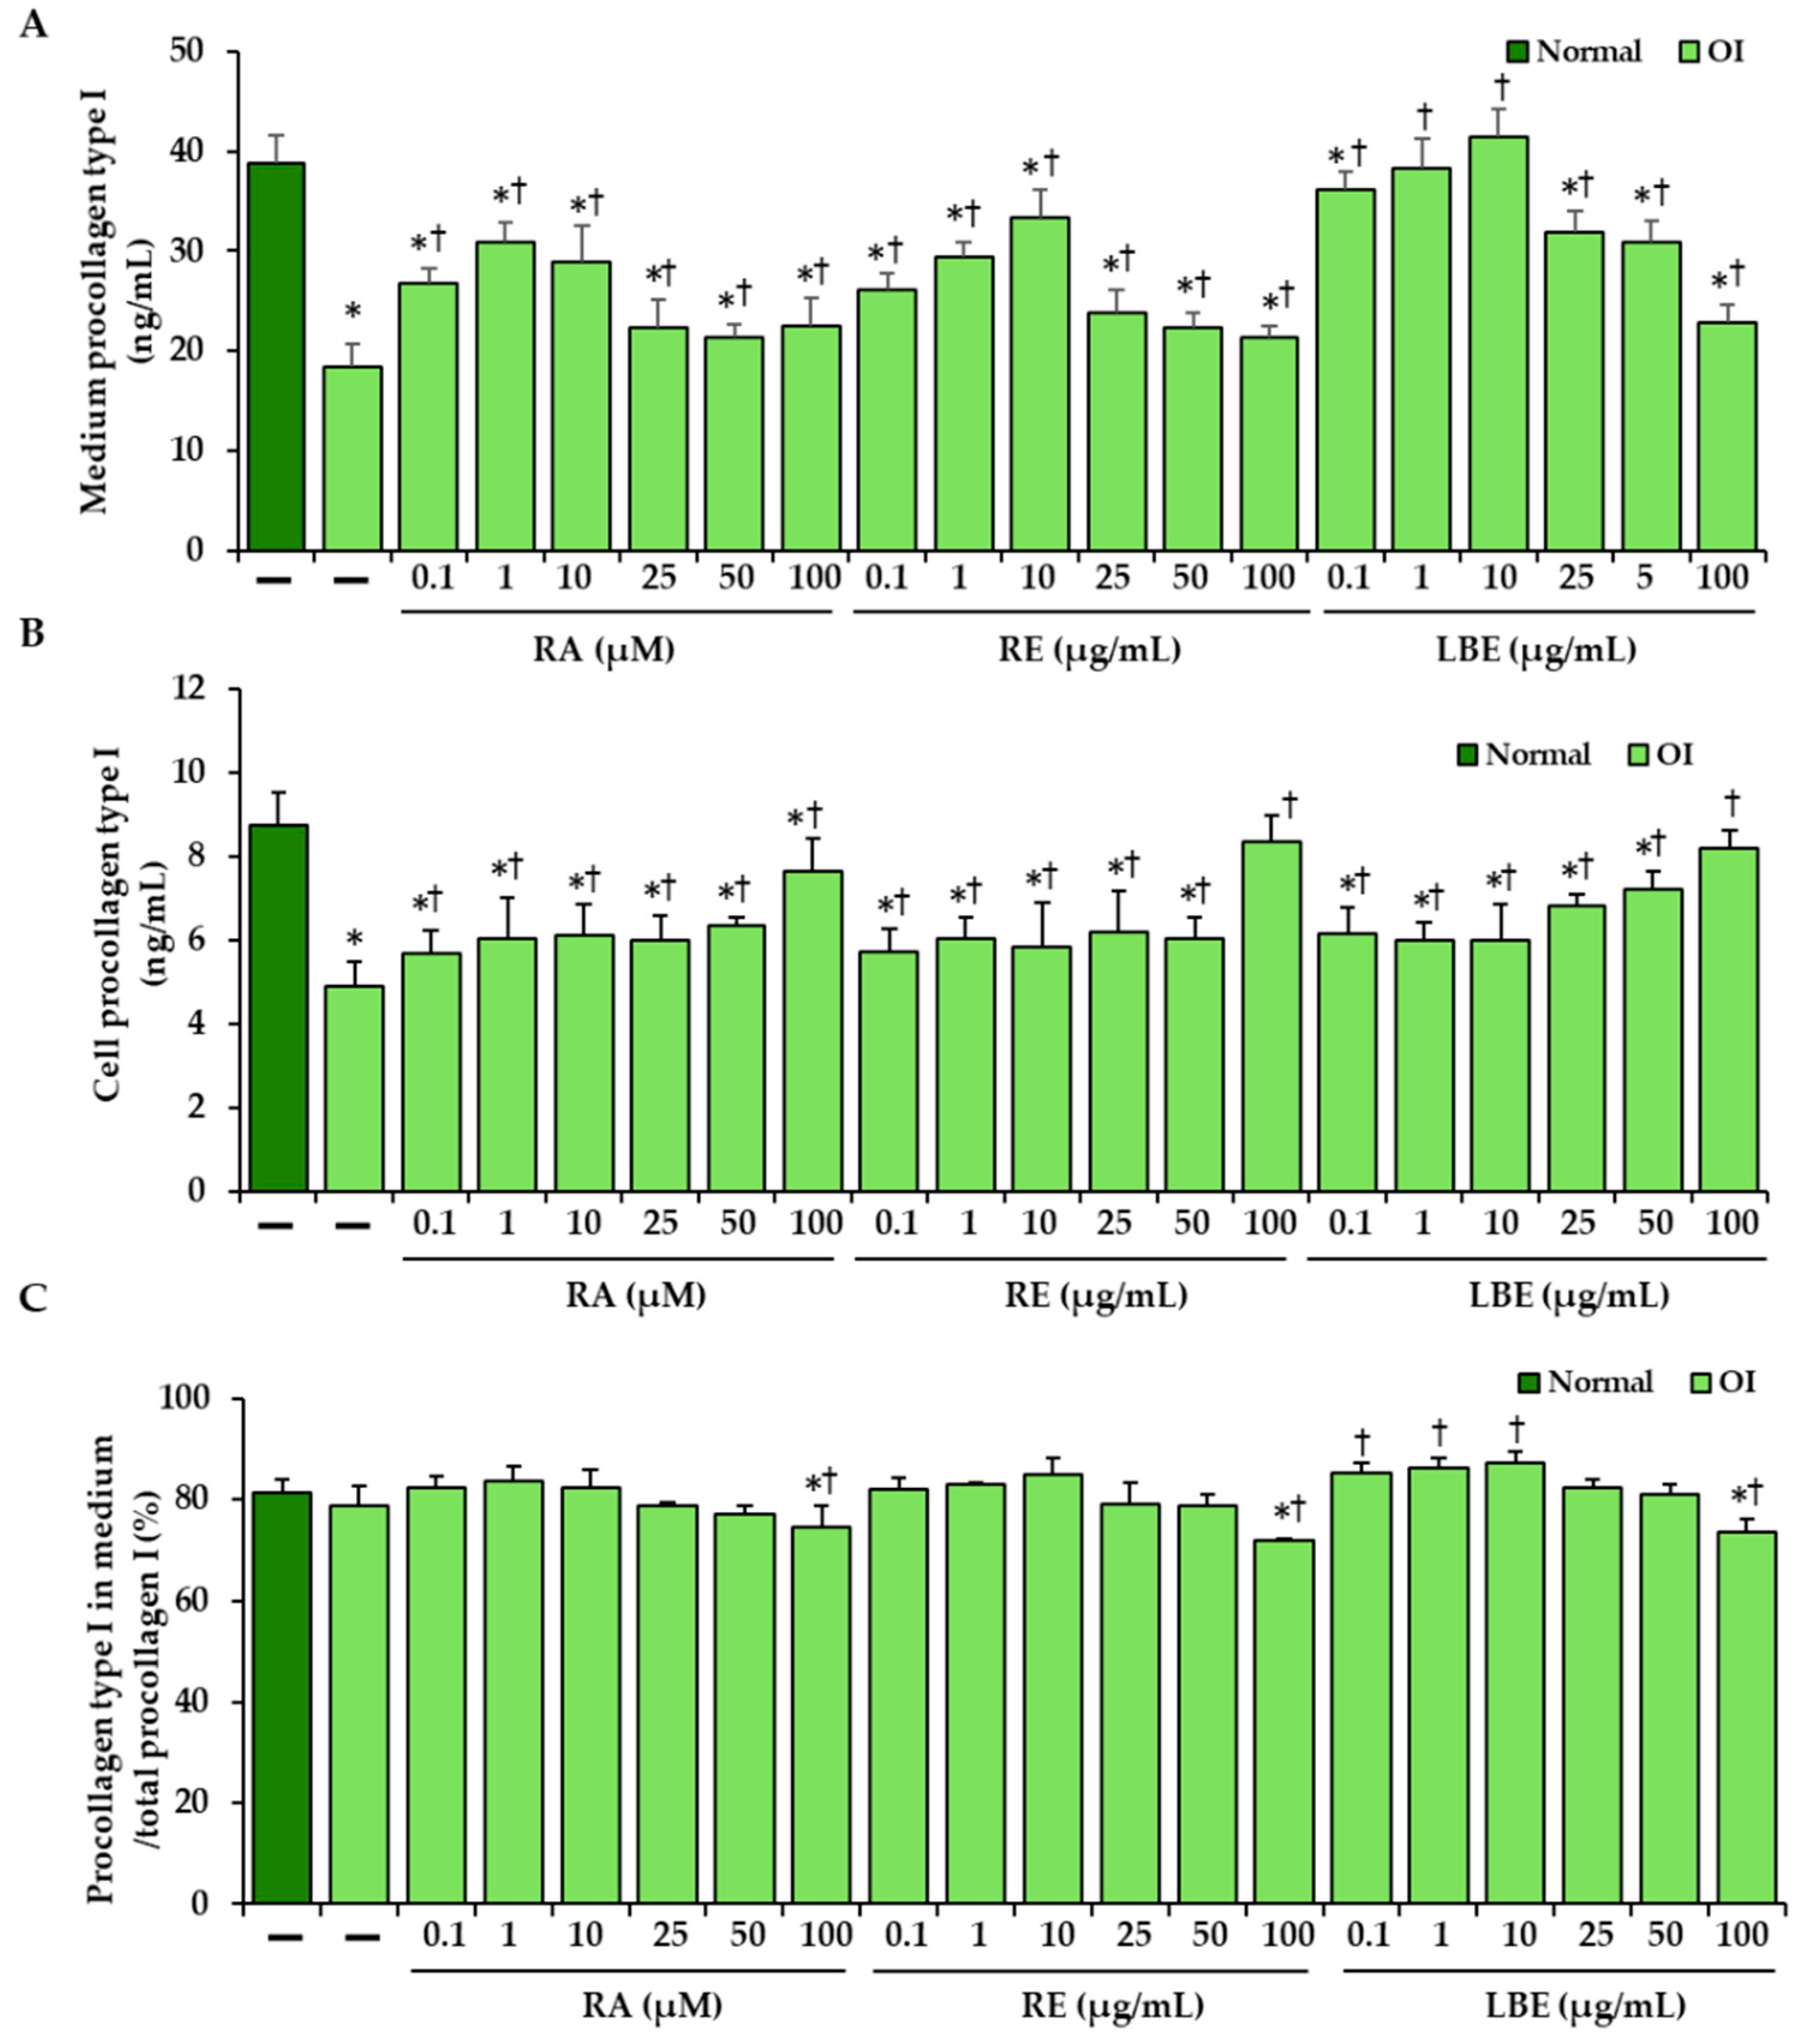
3.3. Effect of RA, RE and LBE on the Content of Intracellular and Secreted Type I Procollagen in OI Fibroblasts Determined by ELISA
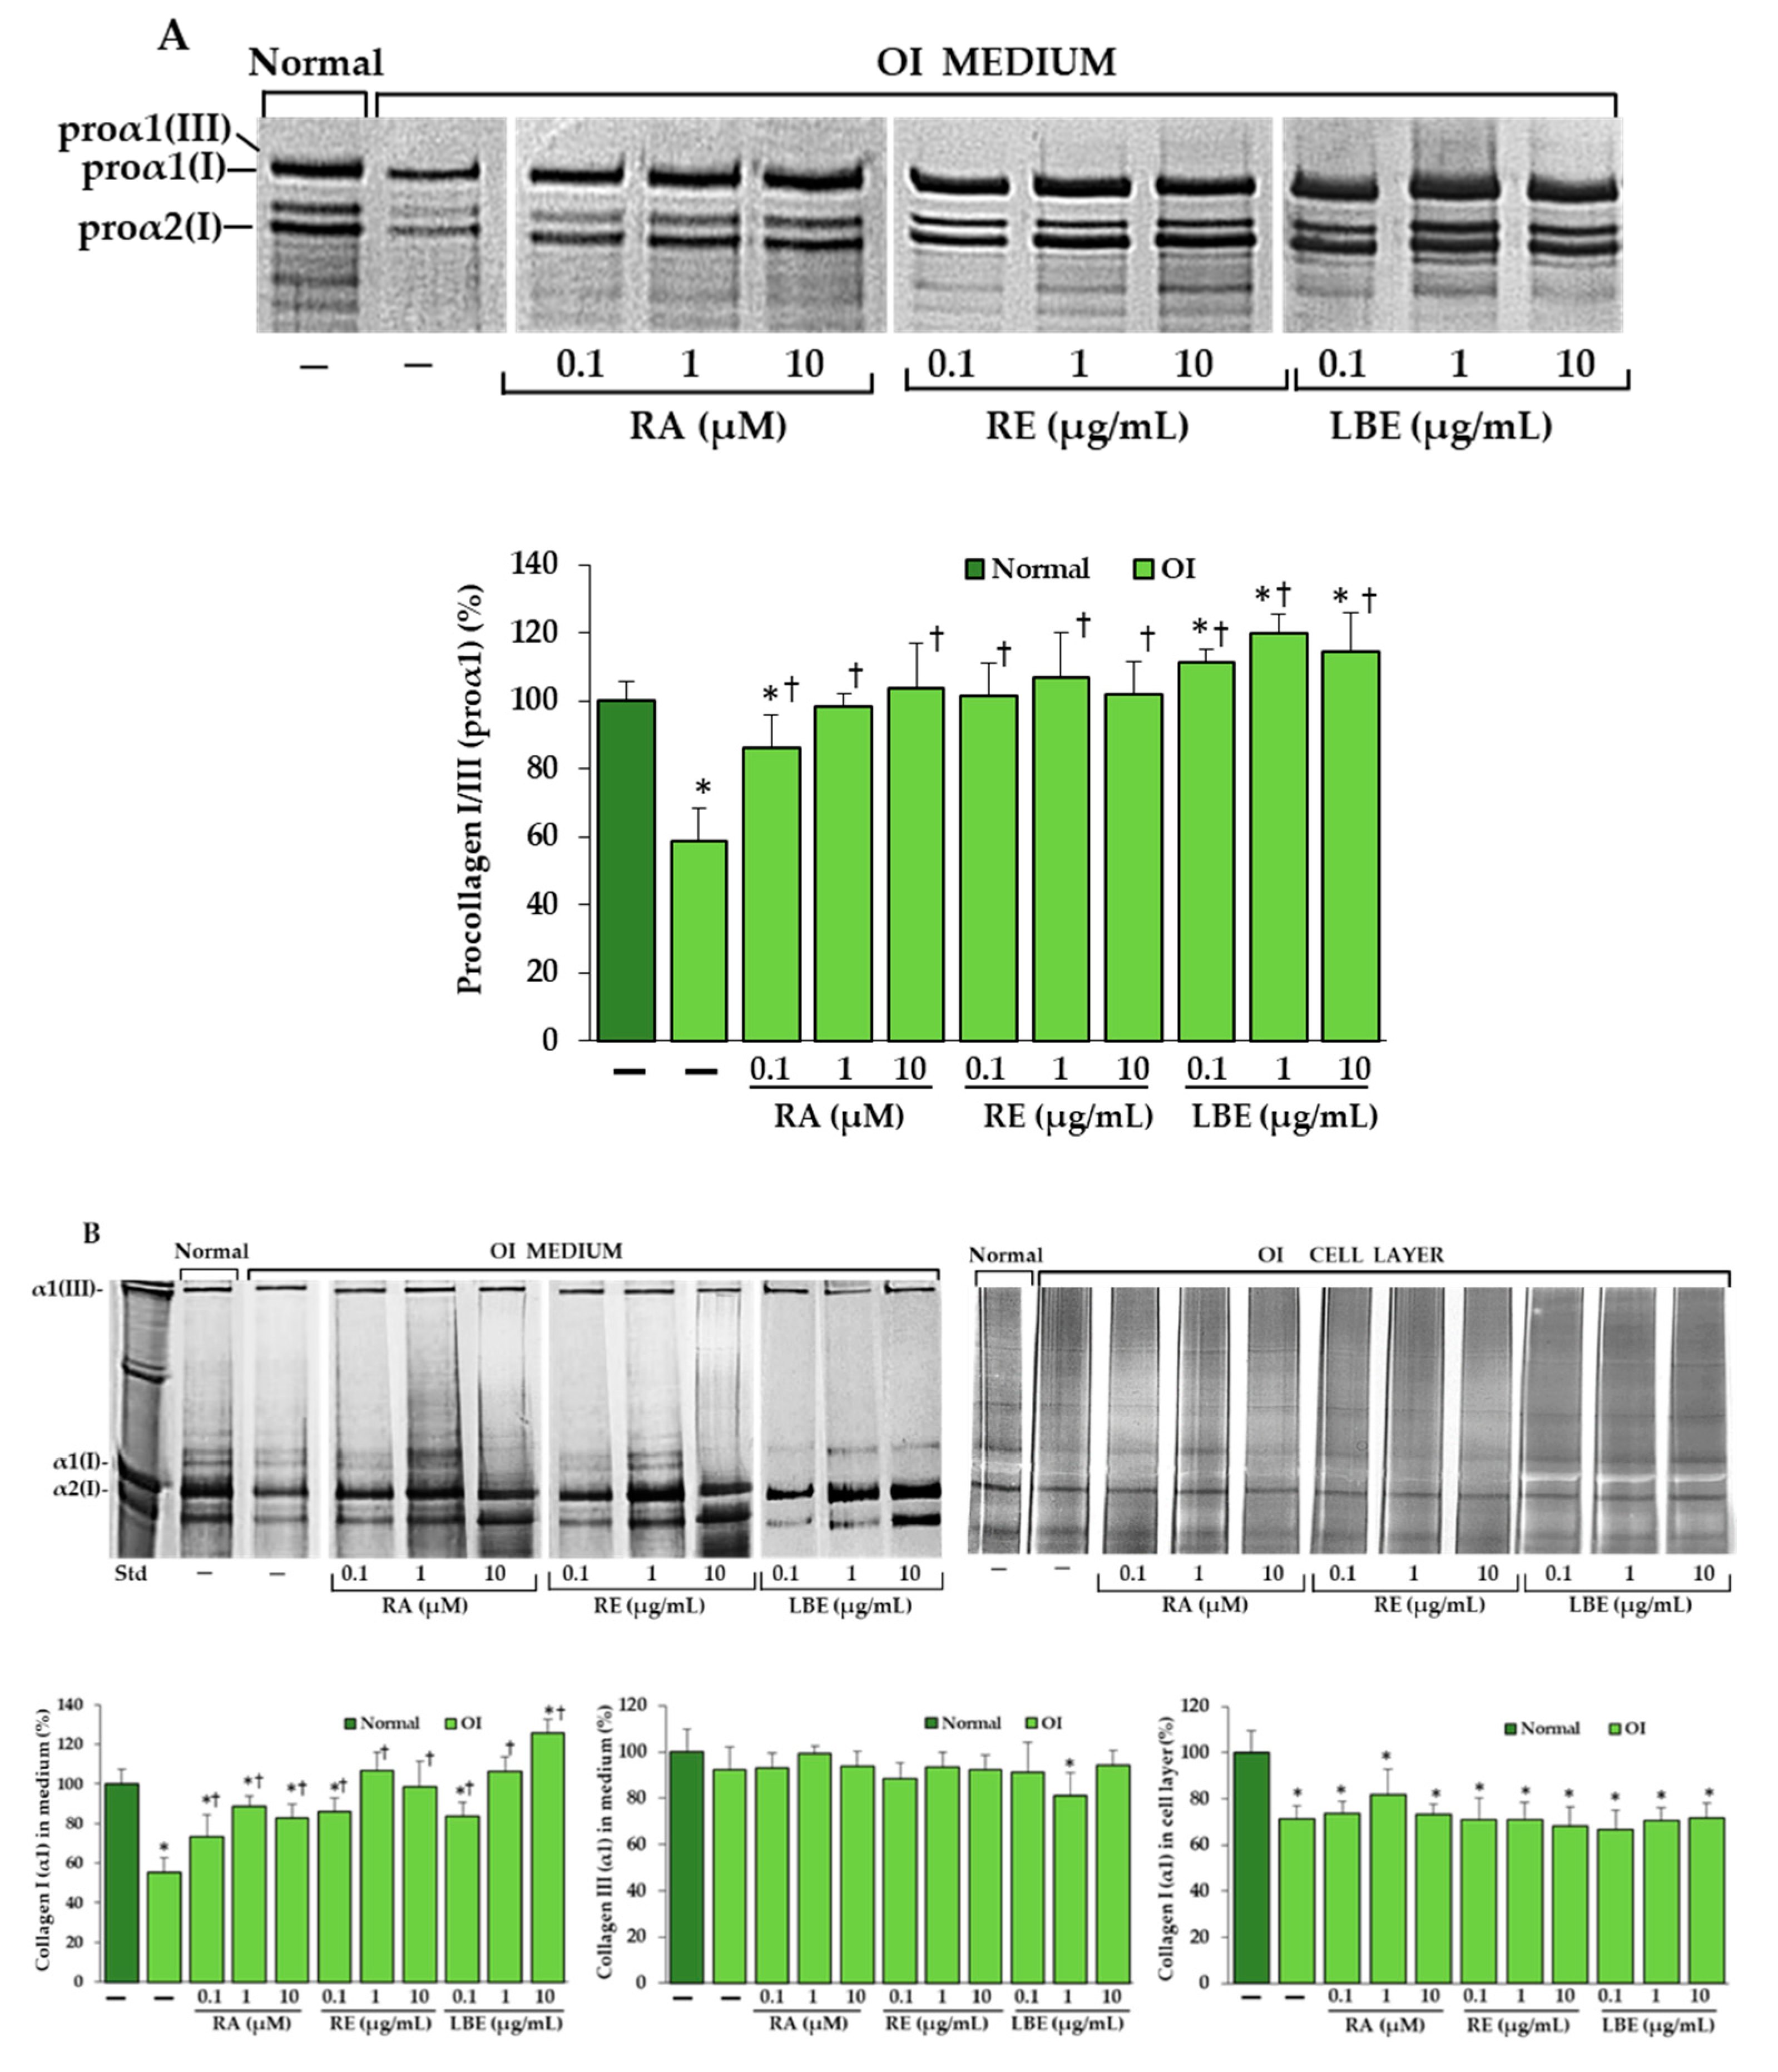
3.4. Analysis of Procollagen and Collagen Type I and III in OI Fibroblasts Treated with RA, RE and LBE
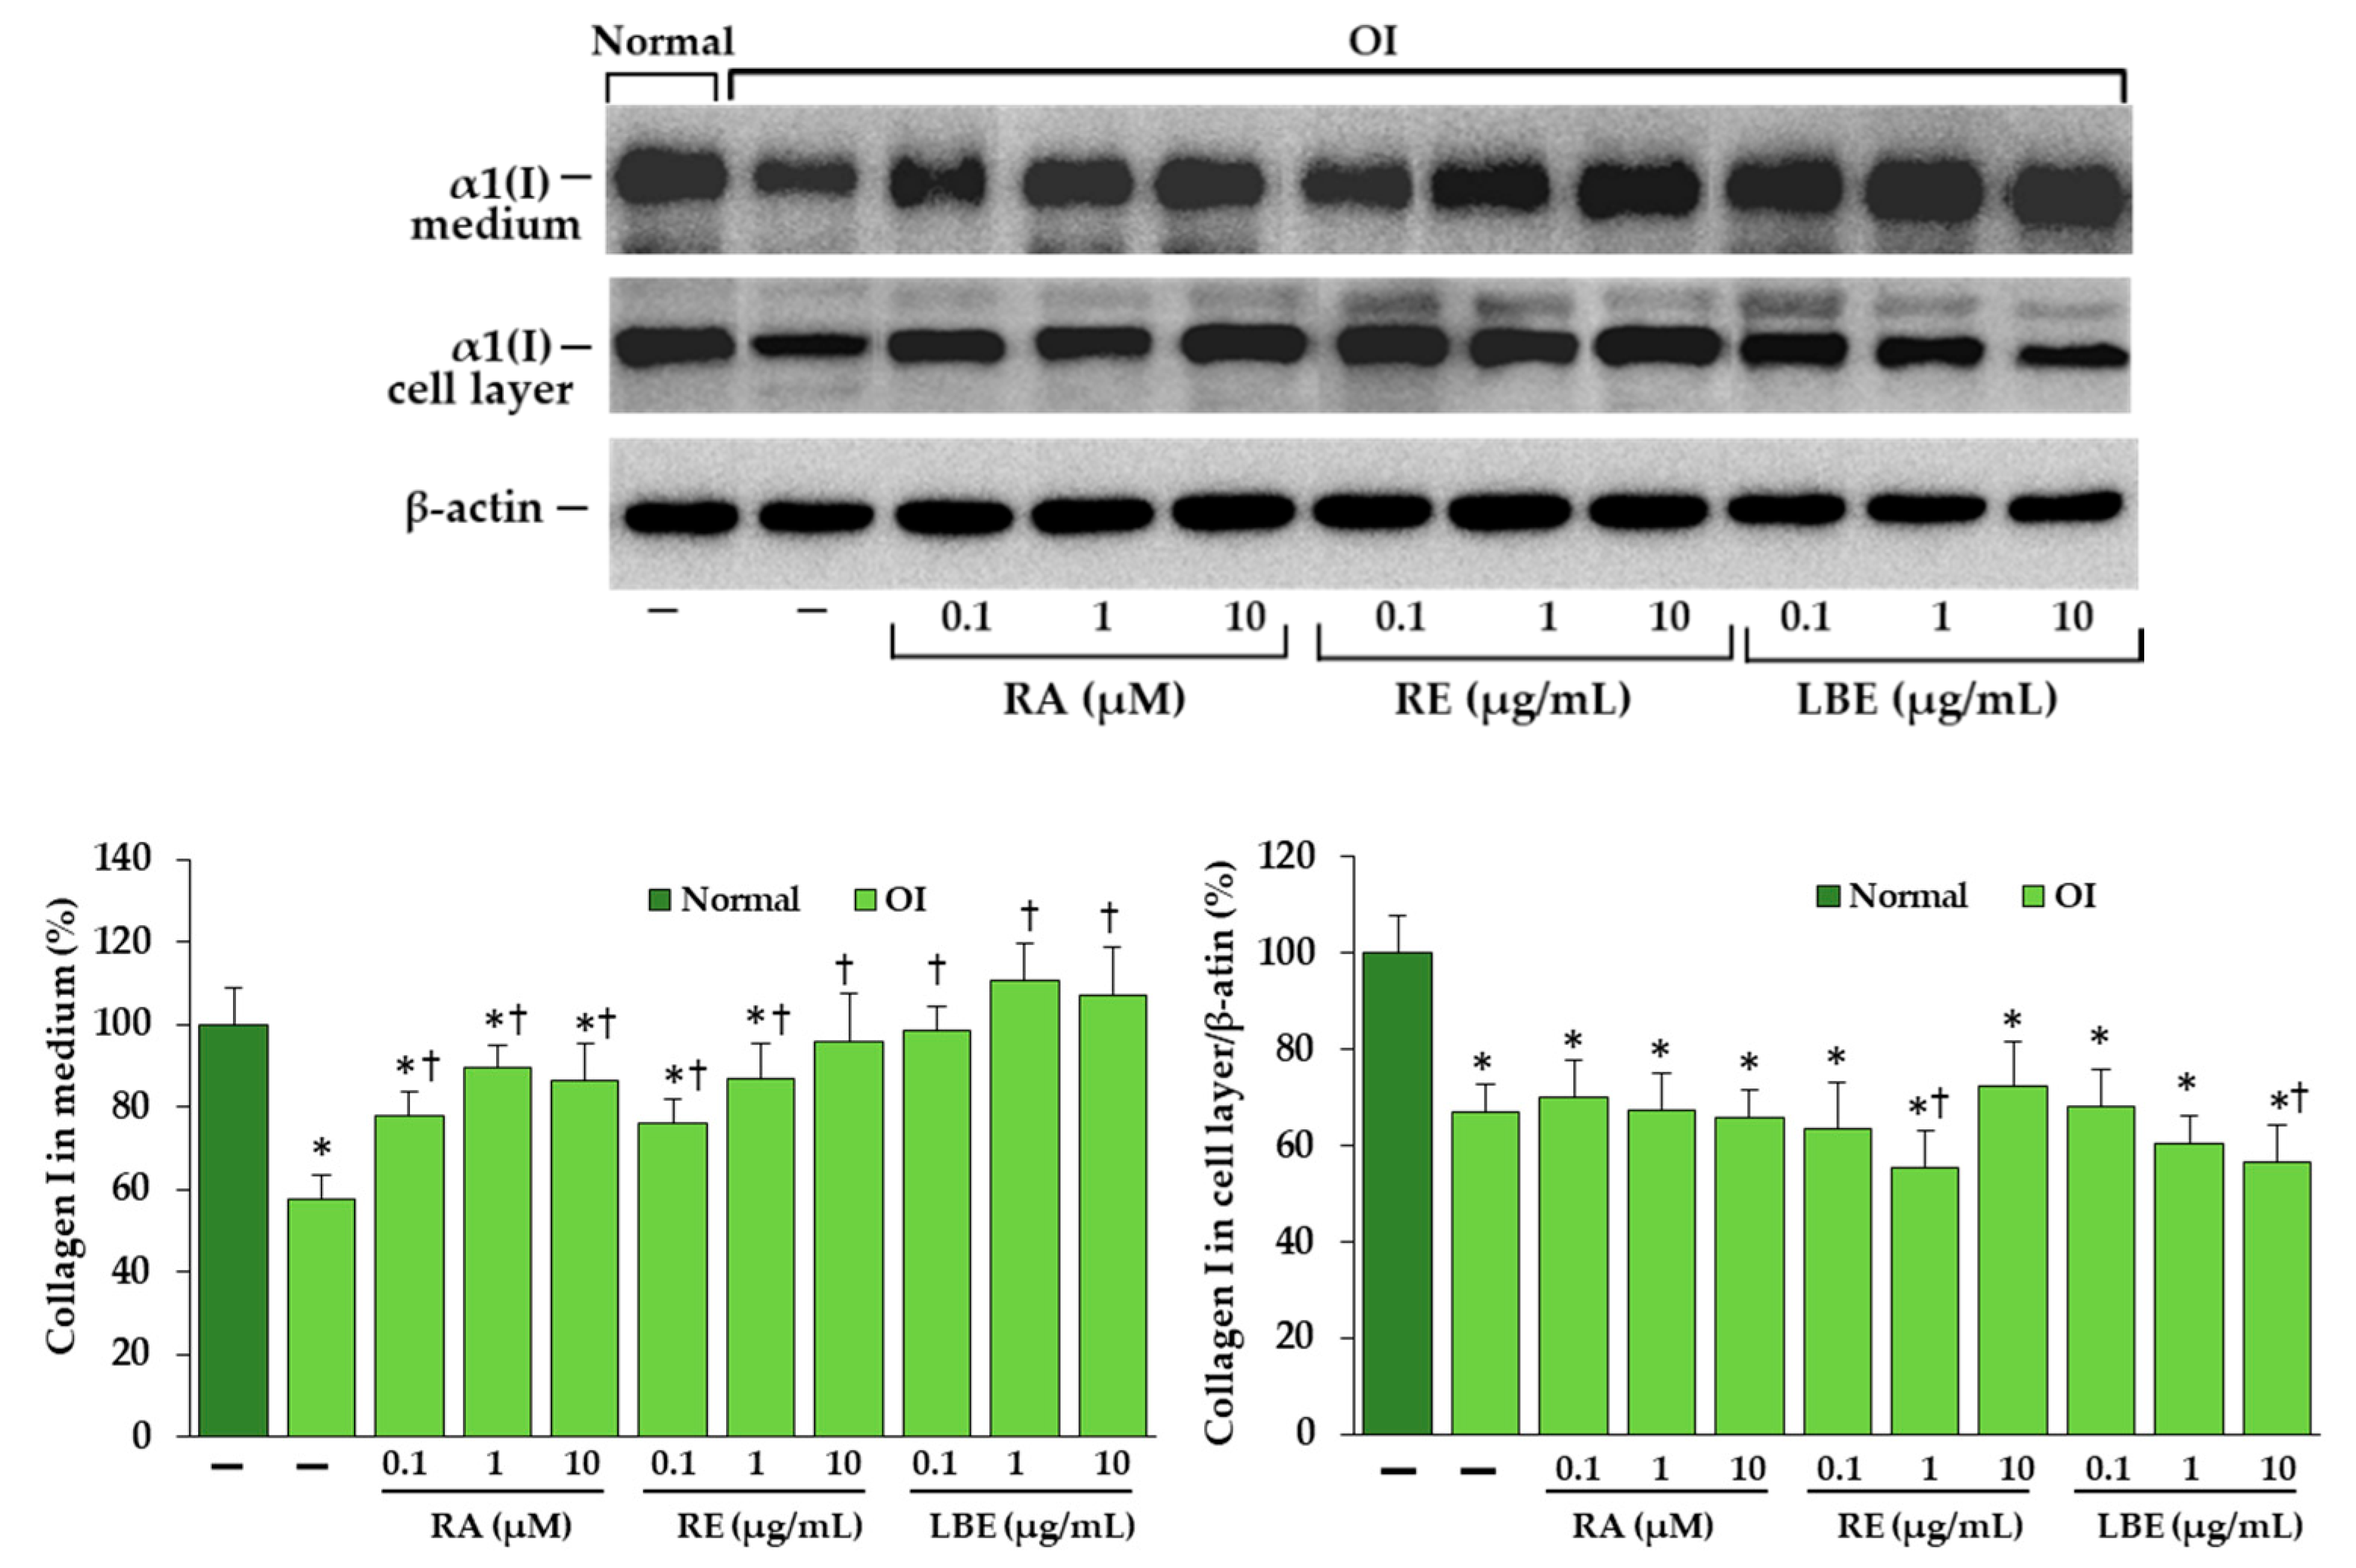
3.5. Western Blot Analysis of Expression of Collagen Type I in OI Fibroblasts
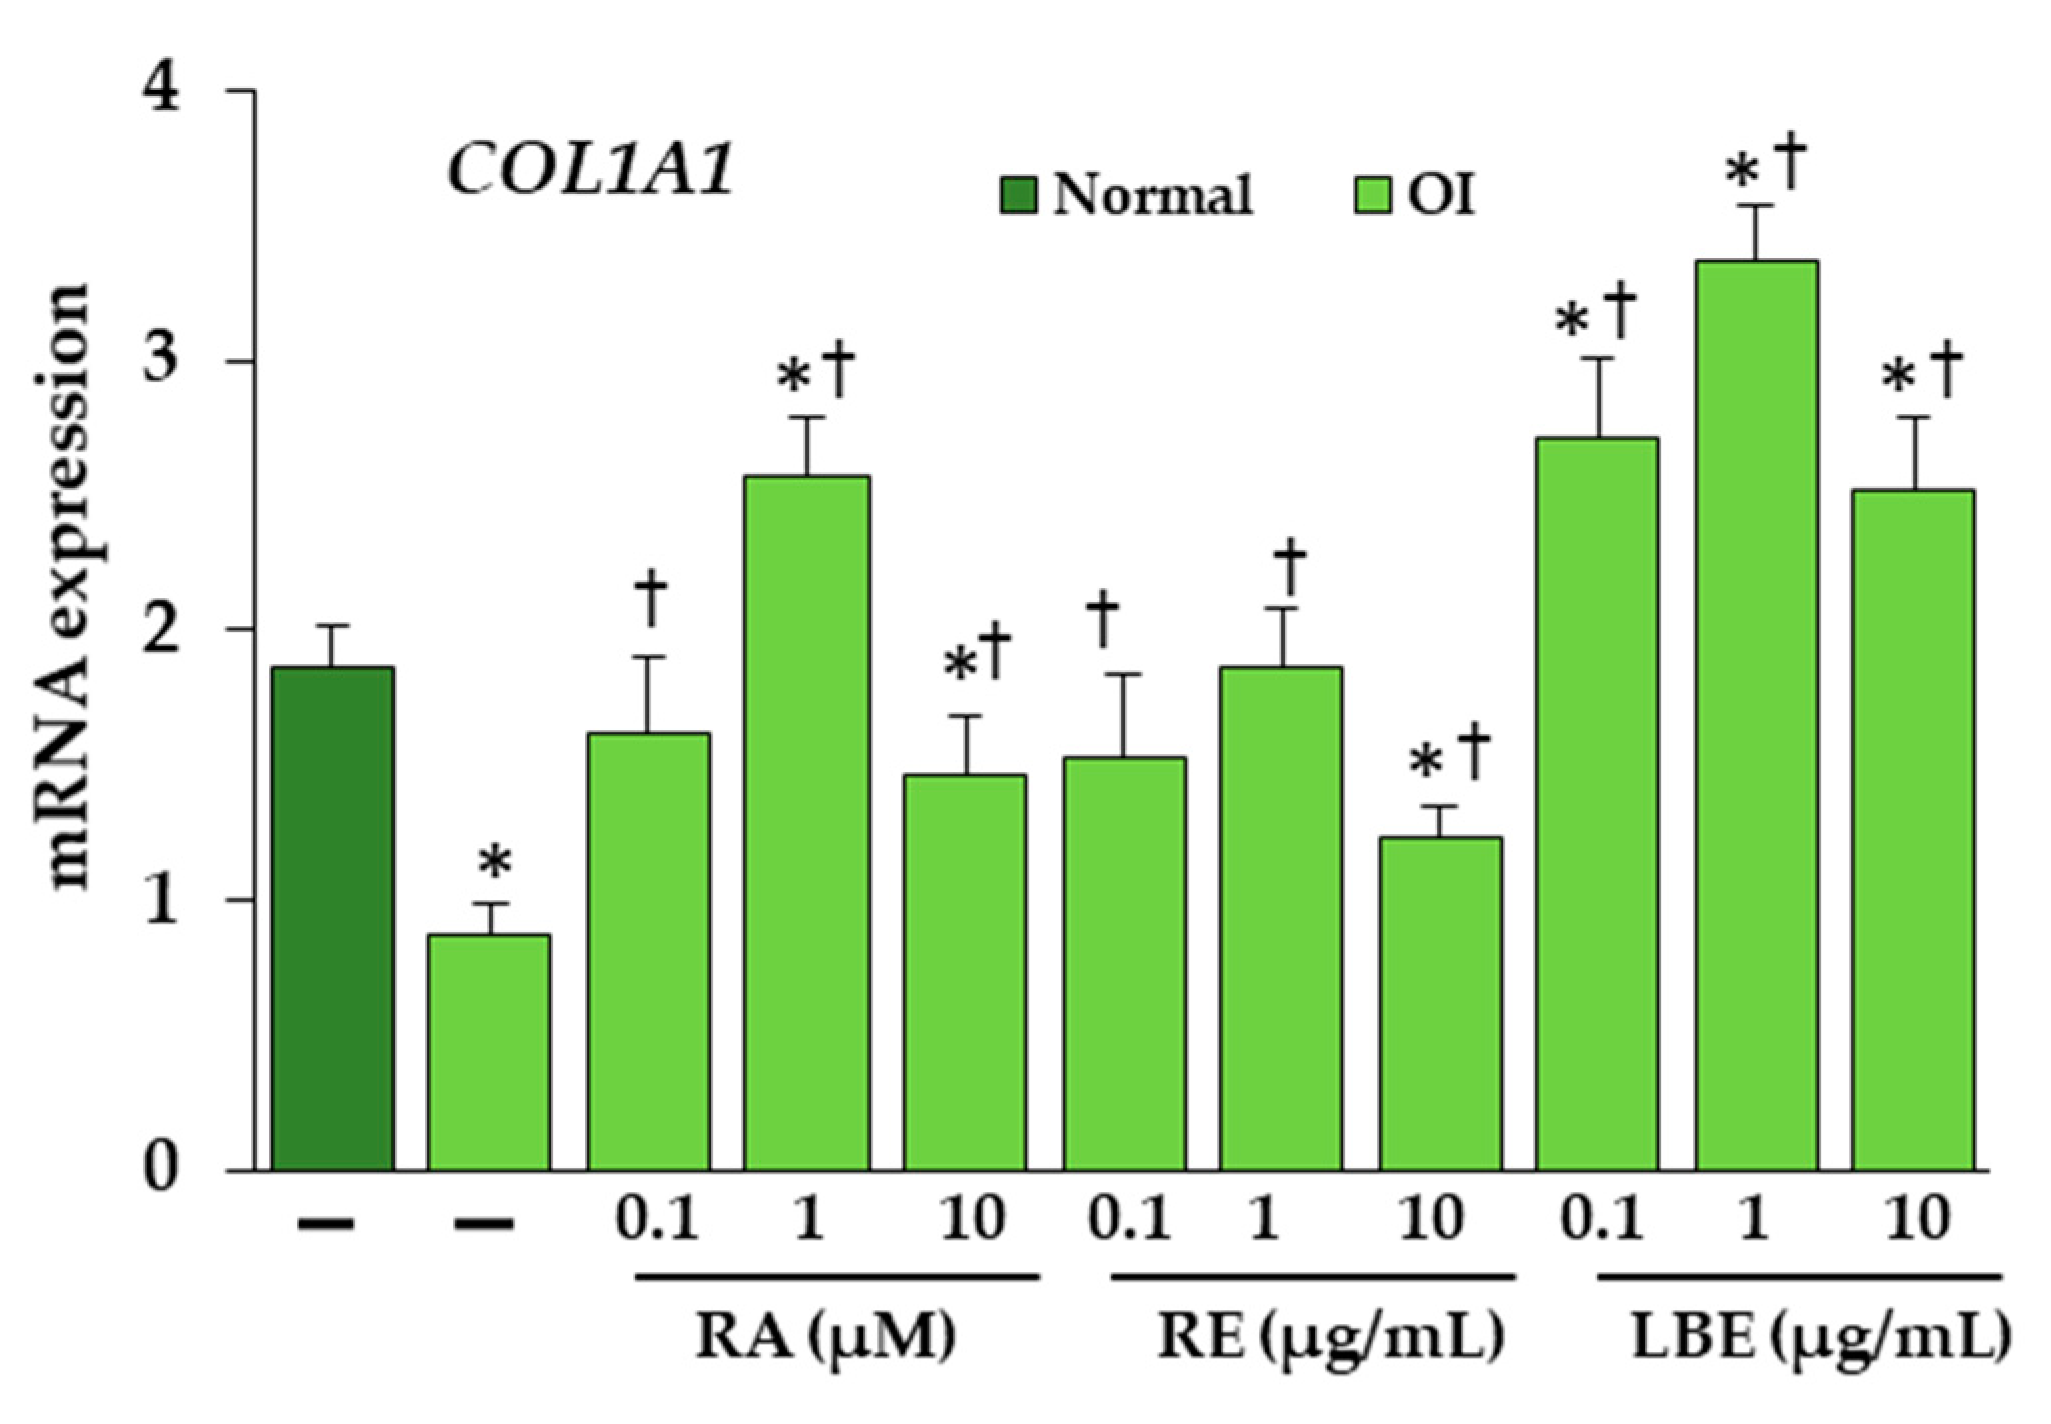
3.6. Effect of RA, RE and LBE on the Expression of Collagen Type I at mRNA Level in OI Fibroblasts
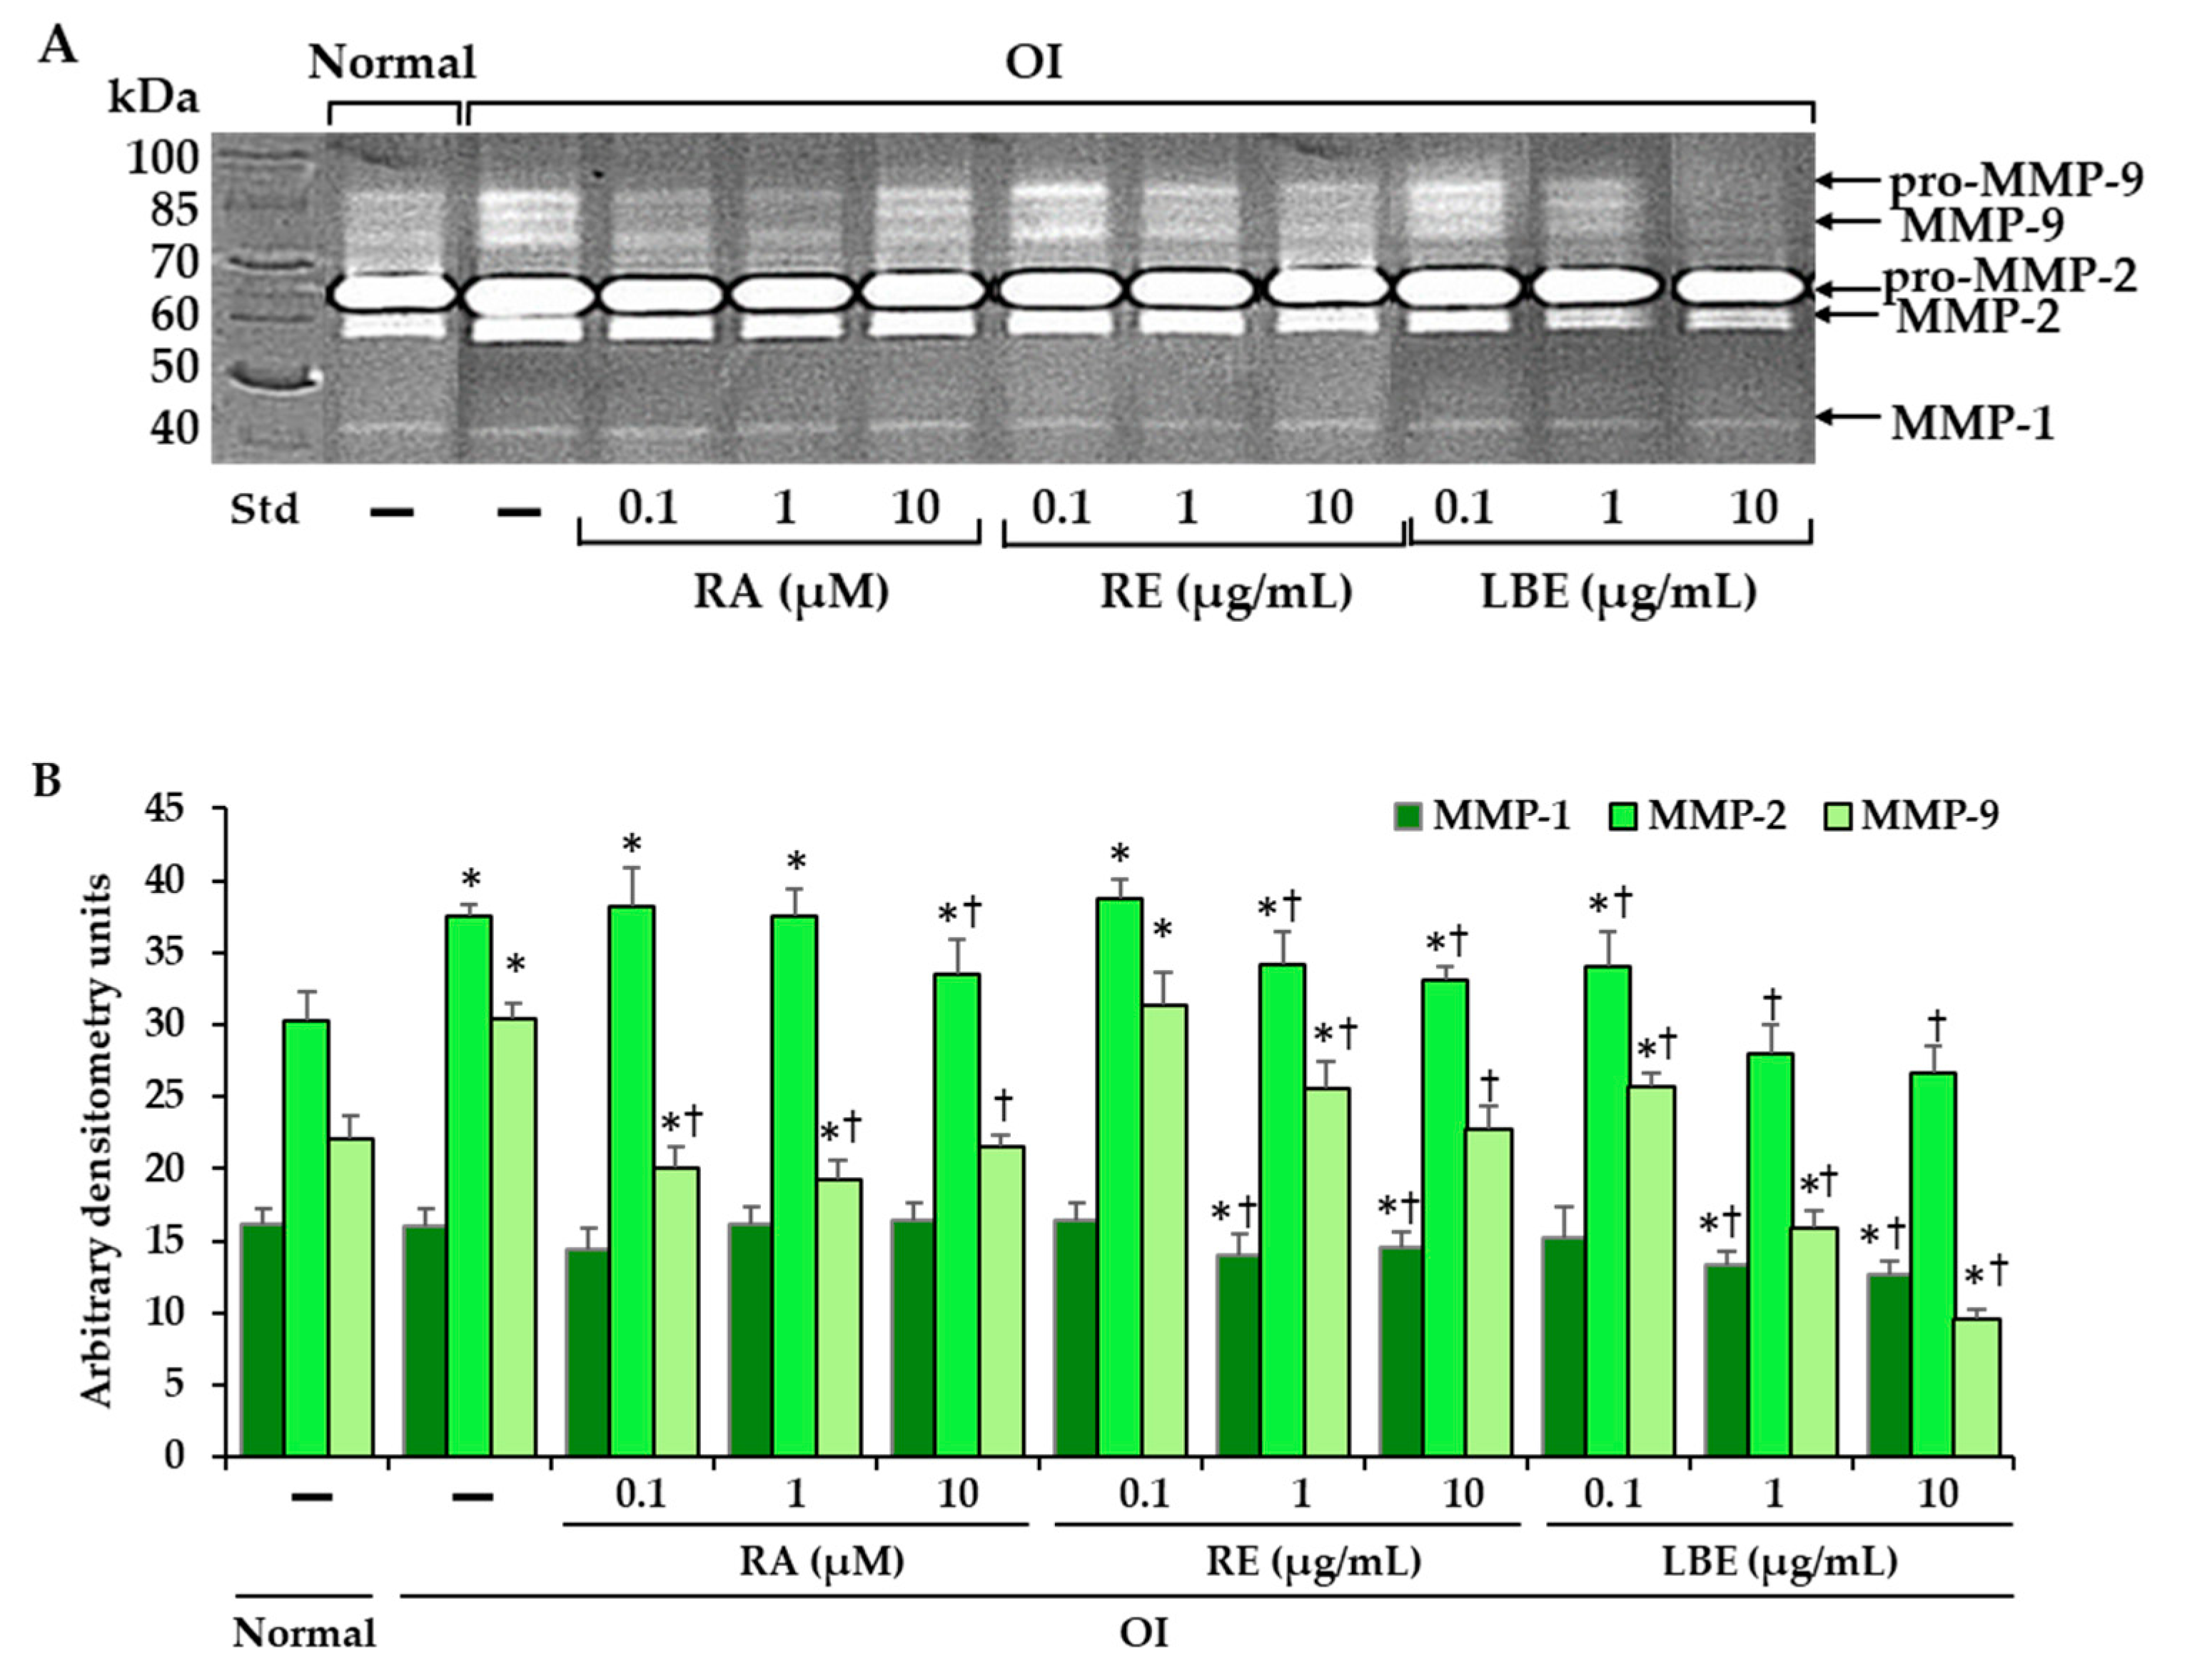
3.7. Effect of RA, RE and LBE on the Activity of MMP-1, MMP-2 and MMP-9 in OI Fibroblasts
4. Discussion
5. Conclusions
Author Contributions
Funding
Institutional Review Board Statement
Informed Consent Statement
Data Availability Statement
Acknowledgments
Conflicts of Interest
Abbreviations
| APMA | 4-aminophenylmercuric acetate |
| BSA | Bovine serum albumin |
| DMEM | Dulbecco’s minimal essential medium |
| DMSO | Dimethyl sulfoxide |
| ECM | Extracellular matrix |
| FA | Formic acid |
| FBS | Fetal bovine serum |
| LBE | Lemon balm extract |
| LC-PDA-MS | Liquid chromatography-photodiode array detection-mass spectrometry |
| MMPs | Matrix Metalloproteinases |
| MTT | (4,5-dimethylthiazol-2-yl)-2,5-diphenylte-trazolium bromide |
| OI | Osteogenesis imperfecta |
| PBS | Phosphate-buffered saline |
| PDA | Photo-diode array |
| qRT-PCR | Quantitative Real-time PCR |
| RA | Rosmarinic acid |
| RE | Rosemary extract |
| RIPA | Radioimmunoprecipitation assay buffer |
| SD | Standard deviation |
| SDS | Sodium dodecyl sulfate |
| SDS-urea PAGE | SDS-urea polyacrylamide gel electrophoresis |
| UV | Ultraviolet |
| UPW | Ultra pure water |
References
- Moradkhani, H.; Sargsyan, E.; Bibak, H.; Naseri, B.; Sadat-Hosseini, M.; Fayazi-Barjin, A.; Meftahizade, H. Melissa officinalis L., a valuable medicine plant: A review. J. Med. Plants Res. 2010, 4, 2753–2759. [Google Scholar]
- Ribeiro-Santos, R.; Carvalho-Costa, D.; Cavaleiro, C.; Costa, H.S. A novel insight on an ancient aromatic plant: The rosemary (Rosmarinus officinalis L.). Trends Food Sci. Tech. 2015, 45, 1–14. [Google Scholar] [CrossRef]
- De Oliveira, J.R.; Camargo, S.E.A.; de Oliveira, L.D. Rosmarinus officinalis L. (rosemary) as therapeutic and prophylactic agent. J. Biomed. Sci. 2019, 26, 5. [Google Scholar] [CrossRef] [PubMed]
- Świąder, K.; Startek, K.; Wijaya, C.H. The therapeutic properties of Lemon balm (Melissa officinalis L.): Reviewing novel findings and medical indications. J. Appl. Bot. Food Qual. 2019, 92, 327–335. [Google Scholar] [CrossRef]
- Shakeri, A.; Sahebkar, A.; Javadi, B. Melissa officinalis L.—A review of its traditional uses, phytochemistry and pharmacology. J. Ethnopharmacol. 2016, 188, 204–228. [Google Scholar] [CrossRef]
- Petersen, M.; Simmonds, M.S. Rosmarinic acid. Phytochemistry 2003, 62, 121–125. [Google Scholar] [CrossRef]
- Nabavi, S.F.; Tenore, G.C.; Daglia, M.; Tundis, R.; Loizzo, M.R.; Nabavi, S.M. The cellular protective effects of rosmarinic acid: From bench to bedside. Curr. Neurovasc. Res. 2015, 12, 98–105. [Google Scholar] [CrossRef]
- Hitl, M.; Kladar, N.; Gavarić, N.; Božin, B. Rosmarinic acid-human pharmacokinetics and health benefits. Planta Med. 2021, 87, 273–282. [Google Scholar] [CrossRef]
- Lou, C.; Zou, L.; Sun, H.; Peng, J.; Gao, C.; Bao, L.; Ji, R.; Jin, Y.; Sun, S. A review of the anti-inflammatory effects of rosmarinic acid on inflammatory diseases. Front. Pharmacol. 2020, 11, 153. [Google Scholar] [CrossRef]
- Allegra, A.; Tonacci, A.; Pioggia, G.; Musolino, C.; Gangemi, S. Anticancer activity of Rosmarinus officinalis L.: Mechanisms of action and therapeutic potentials. Nutrients 2020, 12, 1739. [Google Scholar] [CrossRef]
- Stansbury, J. Rosmarinic acid as a novel agent in the treatment of allergies and asthma. J. Restor. Med. 2014, 3, 121–126. [Google Scholar] [CrossRef]
- Lee, J.; Jung, E.; Koh, J.; Kim, Y.S.; Park, D. Effect of rosmarinic acid on atopic dermatitis. J. Dermatol. 2008, 35, 768–771. [Google Scholar] [CrossRef] [PubMed]
- De Macedo, L.M.; Santos, É.M.D.; Militão, L.; Tundisi, L.L.; Ataide, J.A.; Souto, E.B.; Mazzola, P.G. Rosemary (Rosmarinus officinalis L., syn Sylvia rosmarinus Spenn.) and its topical applications: A review. Plants 2020, 9, 651. [Google Scholar] [CrossRef] [PubMed]
- Mao, F.; Wu, Z.; Shen, Y.; Ren, Y.; Yang, M.; Li, X.; Zhang, L. Regulatory mechanism of rosemary extract (Rosmarinus officinalis) on human skin fibroblasts during ultraviolet A photoaging. Iran. J. Sci. Technol. Trans Sci. 2021, 45, 427–436. [Google Scholar] [CrossRef]
- González-Minero, F.J.; Bravo-Díaz, L.; Ayala-Gómez, A. Rosmarinus officinalis L. (Rosemary): An ancient plant with uses in personal healthcare and cosmetics. Cosmetics 2020, 7, 77. [Google Scholar] [CrossRef]
- Pérez-Sánchez, A.; Barrajón-Catalán, E.; Caturla, N.; Castillo, J.; Benavente-García, O.; Alcaraz, M.; Micol, V. Protective effects of citrus and rosemary extracts on UV-induced damage in skin cell model and human volunteers. J. Photochem. Photobiol. B 2014, 136, 12–18. [Google Scholar] [CrossRef]
- Pérez-Sánchez, A.; Barrajón-Catalán, E.; Herranz-López, M.; Castillo, J.; Micol, V. Lemon balm extract (Melissa officinalis L.) promotes melanogenesis and prevents UVB-induced oxidative stress and DNA damage in a skin cell model. J. Dermatol. Sci. 2016, 84, 169–177. [Google Scholar] [CrossRef]
- Yui, S.; Fujiwara, S.; Harada, K.; Motoike-Hamura, M.; Sakai, M.; Matsubara, S.; Miyazaki, K. Beneficial effects of lemon balm leaf extract on in vitro glycation of proteins, arterial stiffness, and skin elasticity in healthy adults. J. Nutr. Sci. Vitaminol. 2017, 63, 59–68. [Google Scholar] [CrossRef] [Green Version]
- Sabet Teymouri, G.; Sabet Teimouri, M. The comparative effect of hydro alcoholic and hydro distillation extracts of Melissa officinalis on acne and pimple. Int. J. Pharmacol. Phytochem. Ethnomed. 2019, 12, 35–43. [Google Scholar] [CrossRef] [Green Version]
- Nazaruk, J.; Galicka, A. The influence of selected flavonoids from the leaves of Cirsium palustre (L.) Scop. on collagen expression in human skin fibroblasts. Phytother. Res. 2014, 28, 1399–1405. [Google Scholar] [CrossRef]
- Galicka, A.; Nazaruk, J. Stimulation of collagen biosynthesis by flavonoid glycosides in skin fibroblasts of osteogenesis imperfecta type I and the potential mechanism of their action. Int. J. Mol. Med. 2007, 20, 889–895. [Google Scholar] [CrossRef] [Green Version]
- Matwiejczuk, N.; Galicka, A.; Zaręba, I.; Brzóska, M.M. The protective effect of rosmarinic acid against unfavorable influence of methylparaben and propylparaben on collagen in human skin fibroblasts. Nutrients 2020, 12, 1282. [Google Scholar] [CrossRef] [PubMed]
- Sillence, D.O.; Senn, A.; Danks, D.M. Genetic heterogeneity in osteogenesis imperfecta. J. Med. Genet. 1979, 16, 101–116. [Google Scholar] [CrossRef] [PubMed] [Green Version]
- Gajko-Galicka, A. Mutations in type I collagen genes resulting in osteogenesis imperfecta in humans. Acta Biochim. Pol. 2002, 49, 433–441. [Google Scholar] [CrossRef] [Green Version]
- Forlino, A.; Marini, J.C. Osteogenesis imperfecta. Lancet 2016, 387, 1657–1671. [Google Scholar] [CrossRef]
- Marini, J.C.; Forlino, A.; Bächinger, H.P.; Bishop, N.J.; Byers, P.H.; Paepe, A.; Fassier, F.; Fratzl-Zelman, N.; Kozloff, K.M.; Krakow, D.; et al. Osteogenesis imperfecta. Nat. Rev. Dis. Primers 2017, 3, 17052. [Google Scholar] [CrossRef] [PubMed]
- Etich, J.; Leβmeier, L.; Rehberg, M.; Sill, H.; Zaucke, F.; Netzer, C.; Semler, O. Osteogenesis imperfecta—Pathophysiology and therapeutic options. Mol. Cell Pediatr. 2020, 7, 9. [Google Scholar] [CrossRef]
- Hansen, B.; Jemec, G.B. The mechanical properties of skin in osteogenesis imperfecta. Arch. Dermatol. 2002, 138, 909–911. [Google Scholar] [CrossRef] [Green Version]
- Chien, A.L.; Mu, E.W.; Kang, S. Skin in Osteogenesis Imperfecta. In Osteogenesis Imperfecta: A Translational Approach to Brittle Bone Disease, 1st ed.; Shapiro, J., Kassim, J., Sponseller, P., Eds.; Elsevier Inc.: Amsterdam, The Netherlands, 2013; pp. 283–288. [Google Scholar] [CrossRef]
- Ricard-Blum, S. The collagen family. Cold Spring Harb. Perspect. Biol. 2011, 3, a004978. [Google Scholar] [CrossRef] [Green Version]
- Sandhu, S.V.; Grupta, S.; Bansal, H.; Singla, K. Collagen in health and disease. J. Orofac. Res. 2012, 2, 153–159. [Google Scholar] [CrossRef]
- Tomczyk, M. Preliminary phytochemical investigation of Lychnis flos-cuculi herbs. J. Nat. Med. 2008, 62, 473–475. [Google Scholar] [CrossRef]
- Tomczykowa, M.; Tomczyk, M.; Leszczyńska, K.; Kalemba, D. Flavonoids and essential oil of Bidens cernua of Polish origin and in vitro antimicrobial Activity of the oil. Rec. Nat. Prod. 2017, 11, 468–473. [Google Scholar] [CrossRef]
- Nazaruk, J.; Jakoniuk, P. Flavonoid composition and antimicrobial activity of Cirsium rivulare (Jacq.) All. flowers. J. Ethnopharmacol. 2005, 102, 208–212. [Google Scholar] [CrossRef] [PubMed]
- Nazaruk, J.; Gudej, J. Flavonoid compounds from the flowers of Cirsium rivulare (Jacq.) All. Acta Polon. Pharm. 2003, 60, 87–89. [Google Scholar]
- Isidorov, V.; Szoka, Ł.; Nazaruk, J. Cytotoxicity of white birch bud extracts: Perspectives for therapy of tumours. PLoS ONE 2018, 13, e0201949. [Google Scholar] [CrossRef]
- Okuda, M.; Kaihara, S.; Murakami, T.; Koide, D.; Ohe, K. Wiley StatsRef: Statistics Reference Online; John Wiley & Sons, Ltd.: Chichester, UK, 2014; Volume 18, pp. 71–77. [Google Scholar]
- Kumar, G. Principle and method of silver staining of proteins separated by sodium dodecyl sulfate-polyacrylamide gel electrophoresis. Methods Mol. Biol. 2018, 1853, 231–236. [Google Scholar] [CrossRef]
- Borrás Linares, I.; Arráez-Román, D.; Herrero, M.; Ibáñez, E.; Segura-Carretero, A.; Fernández-Gutiérrez, A. Comparison of different extraction procedures for the comprehensive characterization of bioactive phenolic compounds in Rosmarinus officinalis by reversed-phase high-performance liquid chromatography with diode array detection coupled to electrospray time-of-flight mass spectrometry. J. Chromatogr. A 2011, 1218, 7682–7690. [Google Scholar] [CrossRef] [Green Version]
- Ozarowski, M.; Mikolajczak, P.L.; Piasecka, A.; Kachlicki, P.; Kujawski, R.; Bogacz, A.; Bartkowiak-Wieczorek, J.; Szulc, M.; Kaminska, E.; Kujawska, M.; et al. Influence of the Melissa officinalis leaf extract on long-term memory in scopolamine animal model with assessment of mechanism of action. Evid. Based Complement. Alternat. Med. 2016, 2016, 1–17. [Google Scholar] [CrossRef] [PubMed] [Green Version]
- Hossain, M.B.; Rai, D.K.; Brunton, N.P.; Martin-Diana, A.B.; Barry-Ryan, C. Characterization of phenolic composition in Lamiaceae spices by LC-ESI-MS/MS. J. Agric. Food Chem. 2010, 58, 10576–10581. [Google Scholar] [CrossRef]
- Nie, J.Y.; Li, R.; Wang, Y.; Tan, J.; Tang, S.H.; Jiang, Z.T. Antioxidant activity evaluation of rosemary ethanol extract and their cellular antioxidant activity toward HeLa cells. J. Food Biochem. 2019, 43, e12851. [Google Scholar] [CrossRef]
- Willing, M.C.; Deschenes, S.P.; Scott, D.A.; Byers, P.H.; Slayton, R.L.; Pitts, S.H.; Arikat, H.; Roberts, E.J. Osteogenesis imperfecta type I: Molecular heterogeneity for COL1A1 null alleles of type I collagen. Am. J. Hum. Genet. 1994, 55, 638–647. [Google Scholar]
- Schleit, J.; Bailey, S.S.; Tran, T.; Chen, D.; Stowers, S.; Schwarze, U.; Byers, P.H. Molecular outcome, prediction, and clinical consequences of splice variants in COL1A1, which encodes the proα1(I) chains of type I procollagen. Hum. Mutat. 2015, 36, 728–739. [Google Scholar] [CrossRef] [PubMed]
- Bardai, G.; Lemyre, E.; Moffatt, P.; Palomo, T.; Glorieux, F.H.; Tung, J.; Ward, L.; Rauch, F. Osteogenesis imperfecta type I caused by COL1A1 deletions. Calcif. Tissue Int. 2016, 98, 76–84. [Google Scholar] [CrossRef] [PubMed]
- Galicka, A.; Wolczynski, S.; Gindzienski, A. Comparative studies of osteoblast and fibroblast type I collagen in a patient with osteogenesis imperfecta type IV. J. Pathol. 2002, 196, 235–237. [Google Scholar] [CrossRef]
- Sarafova, A.P.; Choi, H.; Forlino, A.; Gajko, A.; Cabral, W.A.; Tosi, L.; Reinig, C.M.; Marini, J.C. Three novel type I collagen mutations in osteogenesis imperfecta type IV probands are associated with discrepancies between electrophoretic migration of osteoblast and fibroblast collagen. Hum. Mutat. 1998, 11, 395–403. [Google Scholar] [CrossRef]
- Frantz, C.; Stewart, K.M.; Weaver, V.M. The extracellular matrix at a glance. J. Cell Sci. 2010, 123, 4195–4200. [Google Scholar] [CrossRef] [PubMed] [Green Version]
- Chung, J.H.; Seo, J.Y.; Choi, H.R.; Lee, M.K.; Youn, C.S.; Rhie, G.; Cho, K.H.; Kim, K.H.; Park, K.C.; Eun, H.C. Modulation of skin collagen metabolism in aged and photoaged human skin in vivo. J. Inverst. Dematol. 2001, 117, 1218–1224. [Google Scholar] [CrossRef] [Green Version]
- Brizola, E.; Felix, T.; Shapiro, J. Pathophysiology and therapeutic options in osteogenesis imperfecta: An update. Res. Rep. Endocr. Disord. 2016, 6, 17–30. [Google Scholar] [CrossRef] [Green Version]
- Marom, R.; Rabenhorst, B.M.; Morello, R. Osteogenesis imperfecta: An update on clinical features and therapies. Eur. J. Endocrinol. 2020, 83, R95–R106. [Google Scholar] [CrossRef]
- Tauer, J.T.; Robinson, M.E.; Rauch, F. Osteogenesis imperfecta: New perspectives from clinical and translational research. JBMR Plus 2019, 3, e10174. [Google Scholar] [CrossRef] [Green Version]
- Sharma, Y.; Velamuri, R.; Fagan, J.; Schaefer, J. Full-specrum analysis of bioactive compounds in rosemary (Rosmarinus officinalis L.) as influenced by different extraction methods. Molecules 2020, 25, 4599. [Google Scholar] [CrossRef] [PubMed]
- Skotti, E.; Sotiropoulou, N.S.; Lappa, I.; Kaiafa, M.; Tsitsigiannis, D.; Tarantilis, P. Screening of lemon balm extracts for anti-aflatoxigenic, antioxidant and other biological activities. Preprints 2019. [Google Scholar] [CrossRef]
- Sodagam, L.; Lewinska, A.; Kwasniewicz, E.; Kokhanovska, S.; Wnuk, M.; Siems, K.; Rattan, S.I.S. Phytochemicals rosmarinic acid, ampelopsin, and amorfrutin–a can modulate age-related phenotype of serially passaged human skin fibroblasts in vitro. Front. Genet. 2019, 10, 81. [Google Scholar] [CrossRef]
- D’Orazio, J.; Jarrett, S.; Amaro-Ortiz, A.; Scott, T. UV radiation and the skin. Int. J. Mol. Sci. 2013, 14, 12222–12248. [Google Scholar] [CrossRef] [PubMed] [Green Version]
- Fernando, P.M.; Piao, M.J.; Kang, K.A.; Ryu, Y.S.; Hewage, S.R.; Chae, S.W.; Hyun, J.W. Rosmarinic acid attenuates cell damage against UVB radiation-induced oxidative stress via enhancing antioxidant effects in human HaCaT cells. Biomol. Ther. 2016, 24, 75–84. [Google Scholar] [CrossRef] [Green Version]
- Rodríguez-Luna, A.; Ávila-Román, J.; Oliveira, H.; Motilva, V.; Talero, E. Fucoxanthin and rosmarinic acid combination has anti-inflammatory effects through regulation of NLRP3 inflammasome in UVB-Exposed HaCaT keratinocytes. Mar. Drugs 2019, 17, 451. [Google Scholar] [CrossRef] [PubMed] [Green Version]
- Yoshikawa, M.; Okano, Y.; Masaki, H. An Ocimum basilicum extract containing rosmarinic acid restores the disruption of collagen fibres caused by repetitive UVA irradiation of dermal fibroblasts. J. Oleo Sci. 2020, 69, 1487–1495. [Google Scholar] [CrossRef]
- Matwiejczuk, N.; Galicka, A.; Brzóska, M.M. Review of the safety of application of cosmetic products containing parabens. J. Appl. Toxicol. 2020, 40, 176–210. [Google Scholar] [CrossRef]
- Zhou, M.W.; Jiang, R.H.; Kim, K.D.; Lee, J.H.; Kim, C.D.; Yin, W.T.; Lee, J.H. Rosmarinic acid inhibits poly(I:C)-induced inflammatory reaction of epidermal keratinocytes. Life Sci. 2016, 155, 189–194. [Google Scholar] [CrossRef]
- Ezzat, S.M.; Salama, M.M.; ElMeshad, A.N.; Teaima, M.H.; Rashad, L.A. HPLC-DAD-MS/MS profiling of standardized rosemary extract and enhancement of its anti-wrinkle activity by encapsulation in elastic nanovesicles. Arch. Pharm. Res. 2016, 39, 912–925. [Google Scholar] [CrossRef]
- Auh, J.H.; Madhavan, J. Protective effect of a mixture of marigold and rosemary extracts on UV-induced photoaging in mice. Biomed. Pharmacother. 2021, 135, 111178. [Google Scholar] [CrossRef] [PubMed]
- Han, Y.P.; Tuan, T.L.; Wu, H.; Hughes, M.; Garner, W.L. TNF-alpha stimulates activation of pro-MMP2 in human skin through NF-(kappa)B mediated induction of MT1-MMP. J. Cell Sci. 2001, 114, 131–139. [Google Scholar] [CrossRef] [PubMed]
- Noguchi-Shinohara, M.; Ono, K.; Hamaguchi, T.; Iwasa, K.; Nagai, T.; Kobayashi, S.; Nakamura, H.; Yamada, M. Pharmacokinetics, safety and tolerability of Melissa officinalis extract which contained rosmarinic acid in healthy individuals: A randomized controlled trial. PLoS ONE 2015, 10, e0126422. [Google Scholar] [CrossRef] [PubMed]


| Analyte | Regression Equation a | R2 | Linear Range [mg/mL] | LOD [mg/mL] | LOQ [mg/mL] | Accuracy [%] | Precision [%] |
|---|---|---|---|---|---|---|---|
| RA | y = 4338.7x + 85.712 | 0.9998 | 0.1–3.0 | 0.0694 | 0.2103 | 99.88 ± 2.53 | 1.73 |
| No | Rt (min) | Tentatively Identified Compounds | λ Max (nm) | [M + H]+/[M + H] (m/z) | Extracts |
|---|---|---|---|---|---|
| 1 | 1.50 | Quinic acid a | 290 | -/191 | RE, LBE |
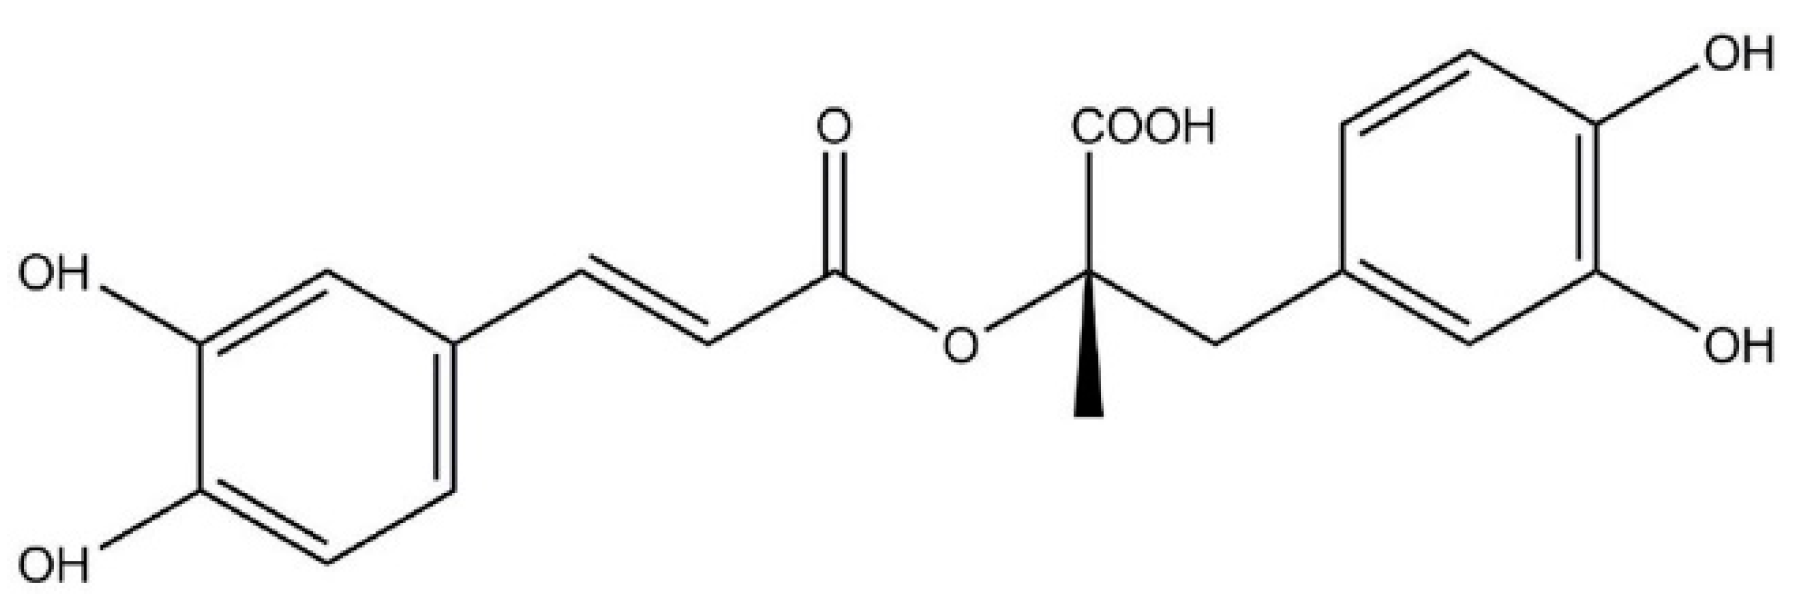
| 2 | 9.88 | 2-hydroxy-3-(3,4-dihydroxyphenyl)-propanoic acid b | 283 | -/197 | RE, LBE |
| 3 | 17.54 | Medioresinol c | 290 | -/387 | RE |
| 4 | 20.20 | Gallocatechin d | 280 | -/305, 225 | RE |
| 5 | 20.60 | Hydroxyjasmonic acid sulphated b | 275, 325 | -/305, 225 | LBE |
| 6 | 21.20 | Salvianolic acid derivative isomer 1 b | 275, 325 | -/537, 493, 295 | LBE |
| 7 | 22.68 | Luteolin glucosylrhamnoside b | 280, 330 | -/593 | LBE |
| 8 | 23.05 | Luteolin 7-O-glucoside s | 282, 333 | 287, 449/285, 447 | RE, LBE |
| 9 | 23.88 | Nepetin 7-O-glucoside a | 272, 345 | 317, 479/477 | RE |
| 10 | 24.71 | Apigenin 7-O-glucoside s | 280, 338 | 271, 433/- | LBE |
| 11 | 24.94 | Hesperitin-7-rhamnoglucoside s | 284, 330 | 303, 610/301, 609 | RE |
| 12 | 25.12 | Salvianolic acid B b | 280, 325 | -/717 | LBE |
| 13 | 25.40 | Hispidulin 7-O-glucoside s | 274, 334 | 301, 463/461 | RE |
| 14 | 25.81 | Rosmarinic acid s | 290, 330 | 361, 343, 505/359 | RE, LBE |
| 15 | 26.12 | Sagerinic acid b | 280, 330 | -/719, 359, 161 | LBE |
| 16 | 26.15 | Luteolin 7-O-glucuronide b | 268, 340 | 287, 463/461 | RE, LBE |
| 17 | 26.45 | Nepetin derivative a | 275, 335 | 317, 685/683 | RE |
| 18 | 27.12 | Cirsimaritin derivative a | 278, 332 | 315, 477, 655/653 | RE |
| 19 | 27.12 | Lithospermic acid isomer 1 b | 290, 325 | -/537, 493, 359 | LBE |
| 20 | 27.32 | Luteolin 3′-O-(O-acetyl)-glucuronide isomer 1 a | 268, 335 | 505/285, 459, 503 | RE |
| 21 | 27.71 | Lithospermic acid isomer 2 b | 290, 325 | -/537, 493, 359 | LBE |
| 22 | 27.77 | Luteolin 3′-O-(O-acetyl)-glucuronide isomer 2 a | 268, 335 | 505/285, 459, 503 | RE |
| 23 | 28.14 | Luteolin 3′-O-(O-acetyl)-glucuronide isomer 3 a | 268, 335 | 505/285, 459, 503 | RE |
| 24 | 28.32 | Rosmarinic acid sulphated isomer b | 290, 328 | -/439, 359 | LBE |
| 25 | 29.90 | Apigenin s | 268, 335 | 271/269 | RE |
| 26 | 30.15 | Salvianolic acid derivative isomer 2 b | 290, 327 | -/715 | LBE |
| 27 | 30.50 | Hispidulin s | 276, 334 | 301/299 | RE |
| 28 | 30.82 | Salvianolic acid derivative isomer 3 b | 290, 327 | -/715 | LBE |
| 29 | 32.04 | Rosmanol isomer 1 a | 284 | 369/283, 301, 345 | RE |
| 30 | 32.26 | Cirsimaritin s | 275, 335 | 315/313 | RE |
| 31 | 32.80 | Rosmanol isomer 2 a | 284 | 369/283, 301, 345 | RE |
| 32 | 33.65 | Rosmanol isomer 3 a | 288 | 369/283, 301, 345 | RE |
| 33 | 34.00 | Genkwanin a | 268, 334 | 285/283 | RE |
| 34 | 38.38 | Miltipolone isomer a | 285 | 345/299 | RE |
| Sample | RA Concentration [mg/g] | SD [mg/g] | RSD [%] |
|---|---|---|---|
| RE | 27.23 | 0.54 | 2.01 |
| LBE | 80.26 | 1.21 | 1.51 |
Publisher’s Note: MDPI stays neutral with regard to jurisdictional claims in published maps and institutional affiliations. |
© 2021 by the authors. Licensee MDPI, Basel, Switzerland. This article is an open access article distributed under the terms and conditions of the Creative Commons Attribution (CC BY) license (https://creativecommons.org/licenses/by/4.0/).
Share and Cite
Sutkowska, J.; Hupert, N.; Gawron, K.; Strawa, J.W.; Tomczyk, M.; Forlino, A.; Galicka, A. The Stimulating Effect of Rosmarinic Acid and Extracts from Rosemary and Lemon Balm on Collagen Type I Biosynthesis in Osteogenesis Imperfecta Type I Skin Fibroblasts. Pharmaceutics 2021, 13, 938. https://doi.org/10.3390/pharmaceutics13070938
Sutkowska J, Hupert N, Gawron K, Strawa JW, Tomczyk M, Forlino A, Galicka A. The Stimulating Effect of Rosmarinic Acid and Extracts from Rosemary and Lemon Balm on Collagen Type I Biosynthesis in Osteogenesis Imperfecta Type I Skin Fibroblasts. Pharmaceutics. 2021; 13(7):938. https://doi.org/10.3390/pharmaceutics13070938
Chicago/Turabian StyleSutkowska, Joanna, Natalia Hupert, Katarzyna Gawron, Jakub W. Strawa, Michał Tomczyk, Antonella Forlino, and Anna Galicka. 2021. "The Stimulating Effect of Rosmarinic Acid and Extracts from Rosemary and Lemon Balm on Collagen Type I Biosynthesis in Osteogenesis Imperfecta Type I Skin Fibroblasts" Pharmaceutics 13, no. 7: 938. https://doi.org/10.3390/pharmaceutics13070938