
A Whole-Body Physiologically Based Pharmacokinetic Model Characterizing Interplay of OCTs and MATEs in Intestine, Liver and Kidney to Predict Drug-Drug Interactions of Metformin with Perpetrators


Abstract
:
1. Introduction
2. Materials and Methods
2.1. Collection of Data
2.2. Development of PBPK Model
2.3. Model Validation
2.4. Sensitivity Analysis of Model Parameters
3. Results and Discussion
3.1. Collection of DDI Data
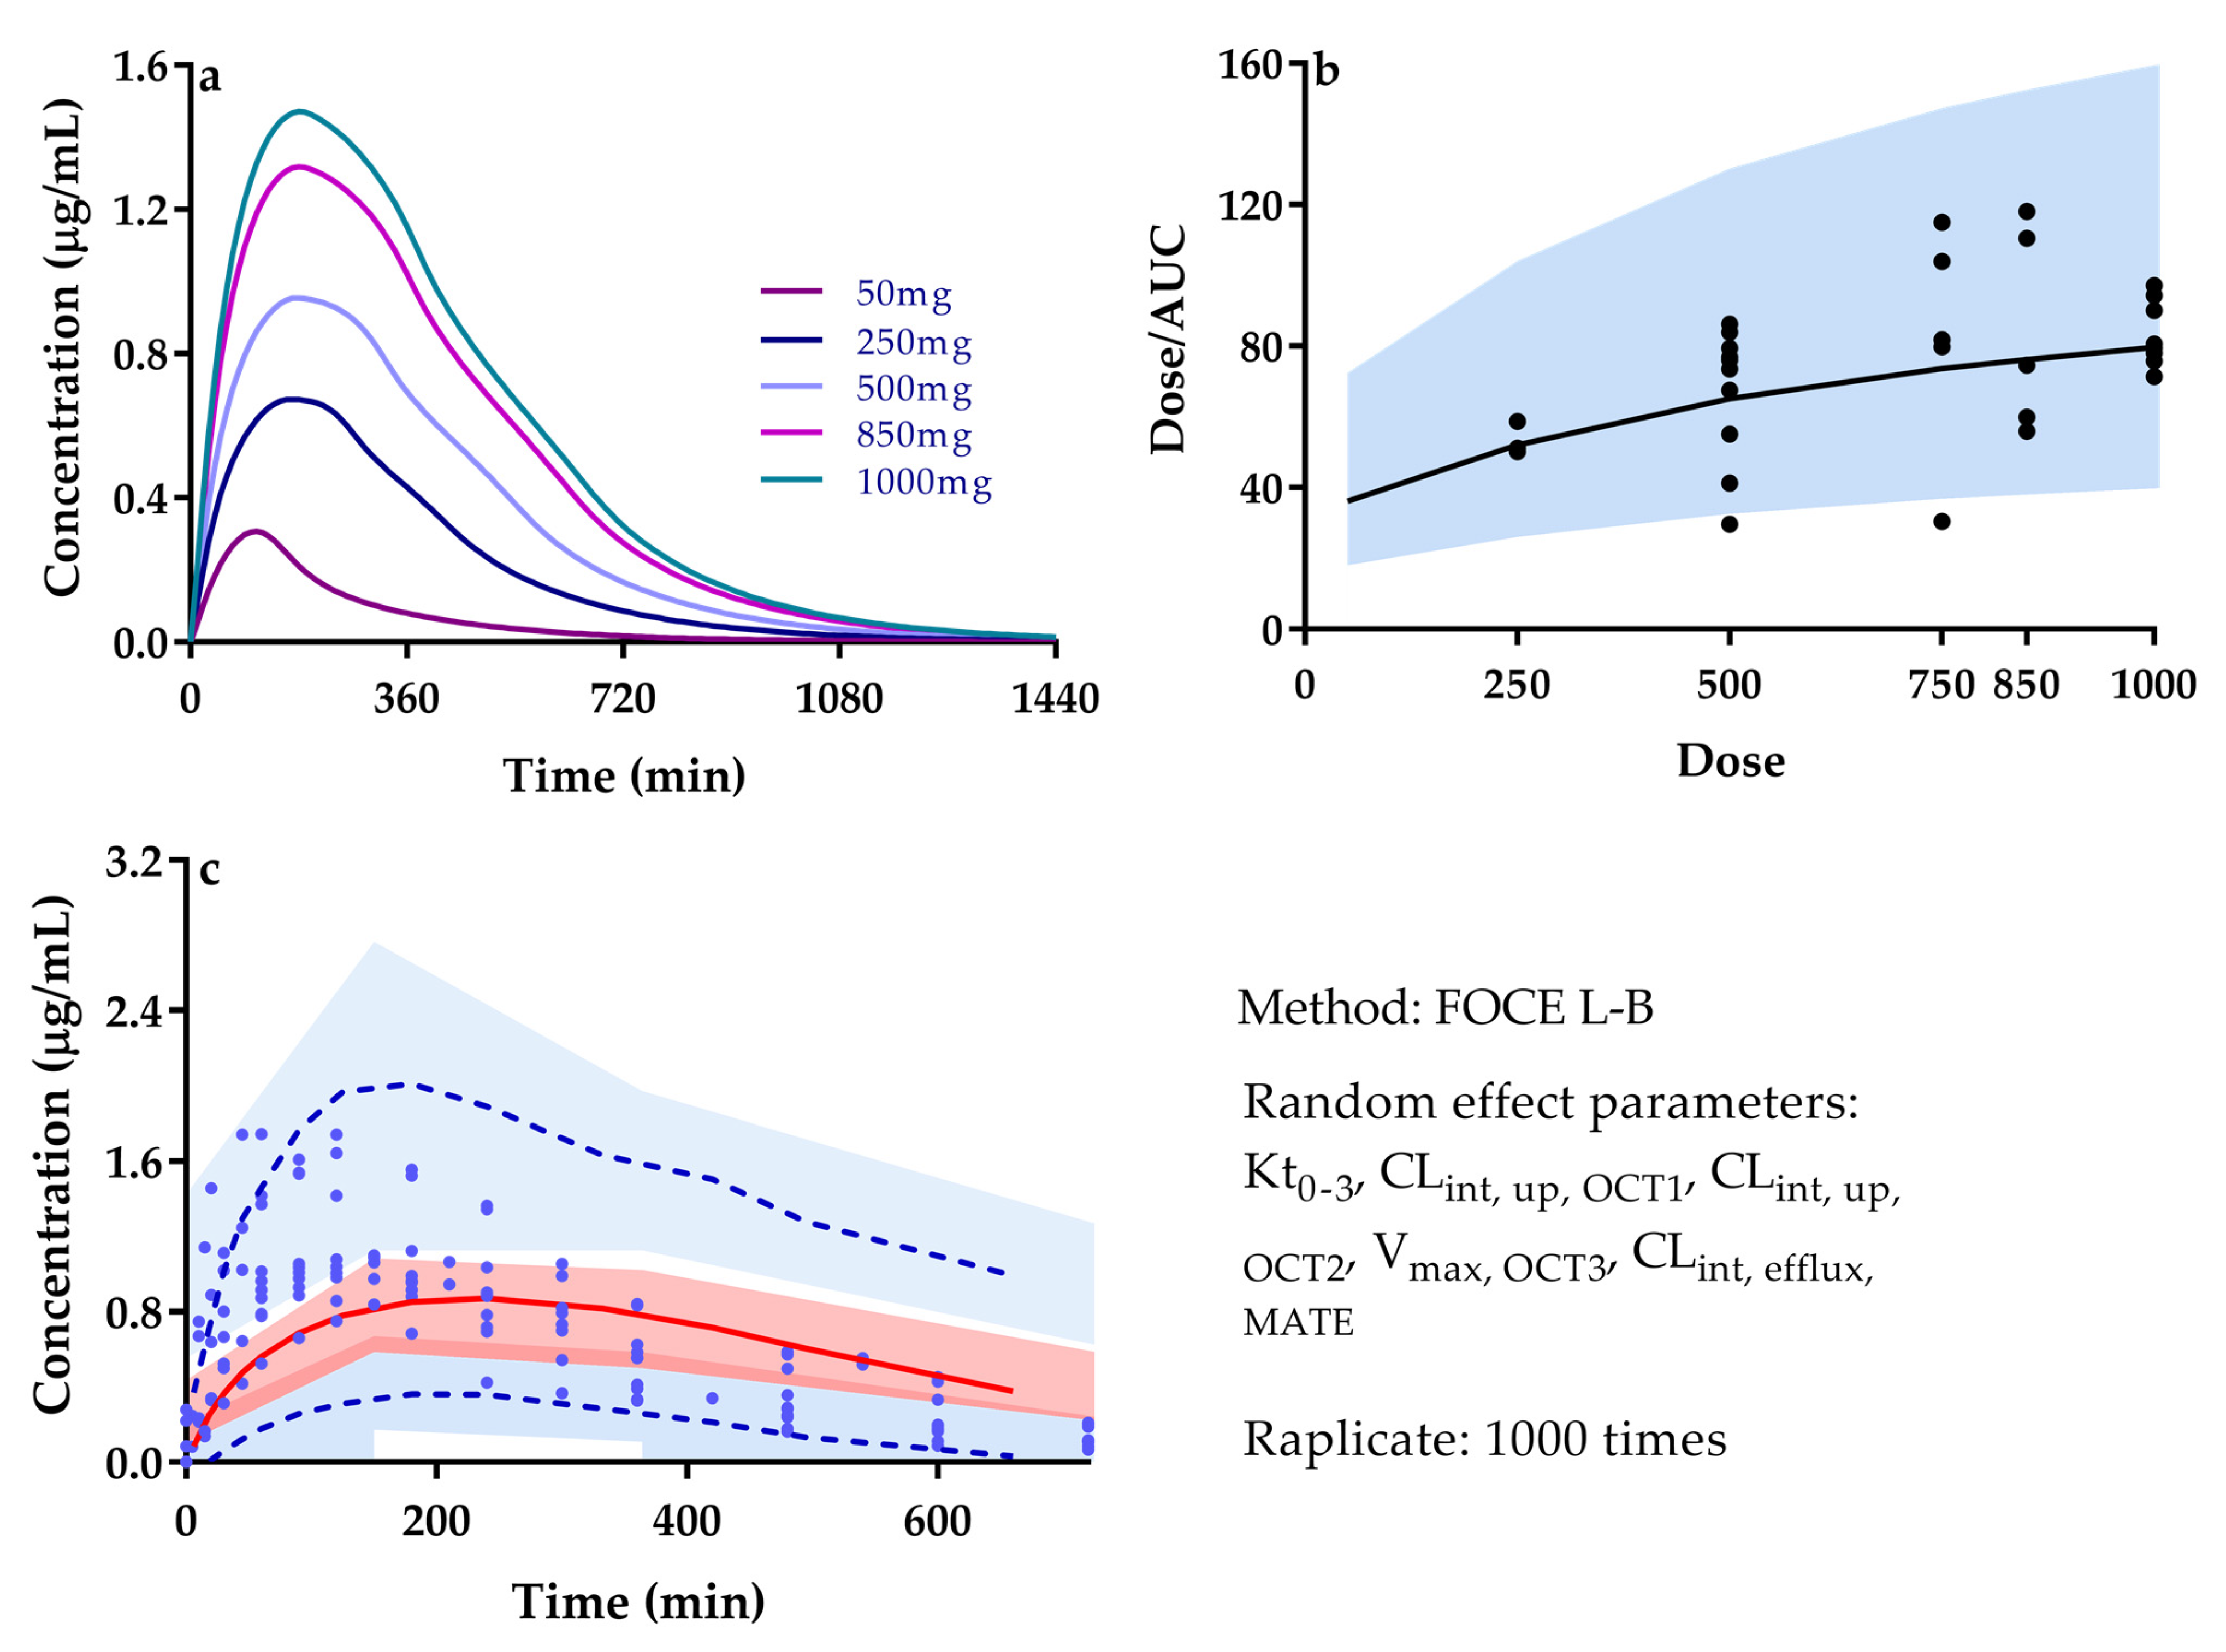
3.2. Quantitatively Predicted Disposition Kinetics for Metformin and Perpetrators

| Drug | Ref. | Dose (mg) | Cmax (μg/mL) | Ratio | AUC0–t (μg·h/mL) | Ratio | ||
|---|---|---|---|---|---|---|---|---|
| Pre | Obs | Pre/Obs | Pre | Obs | Pre/Obs | |||
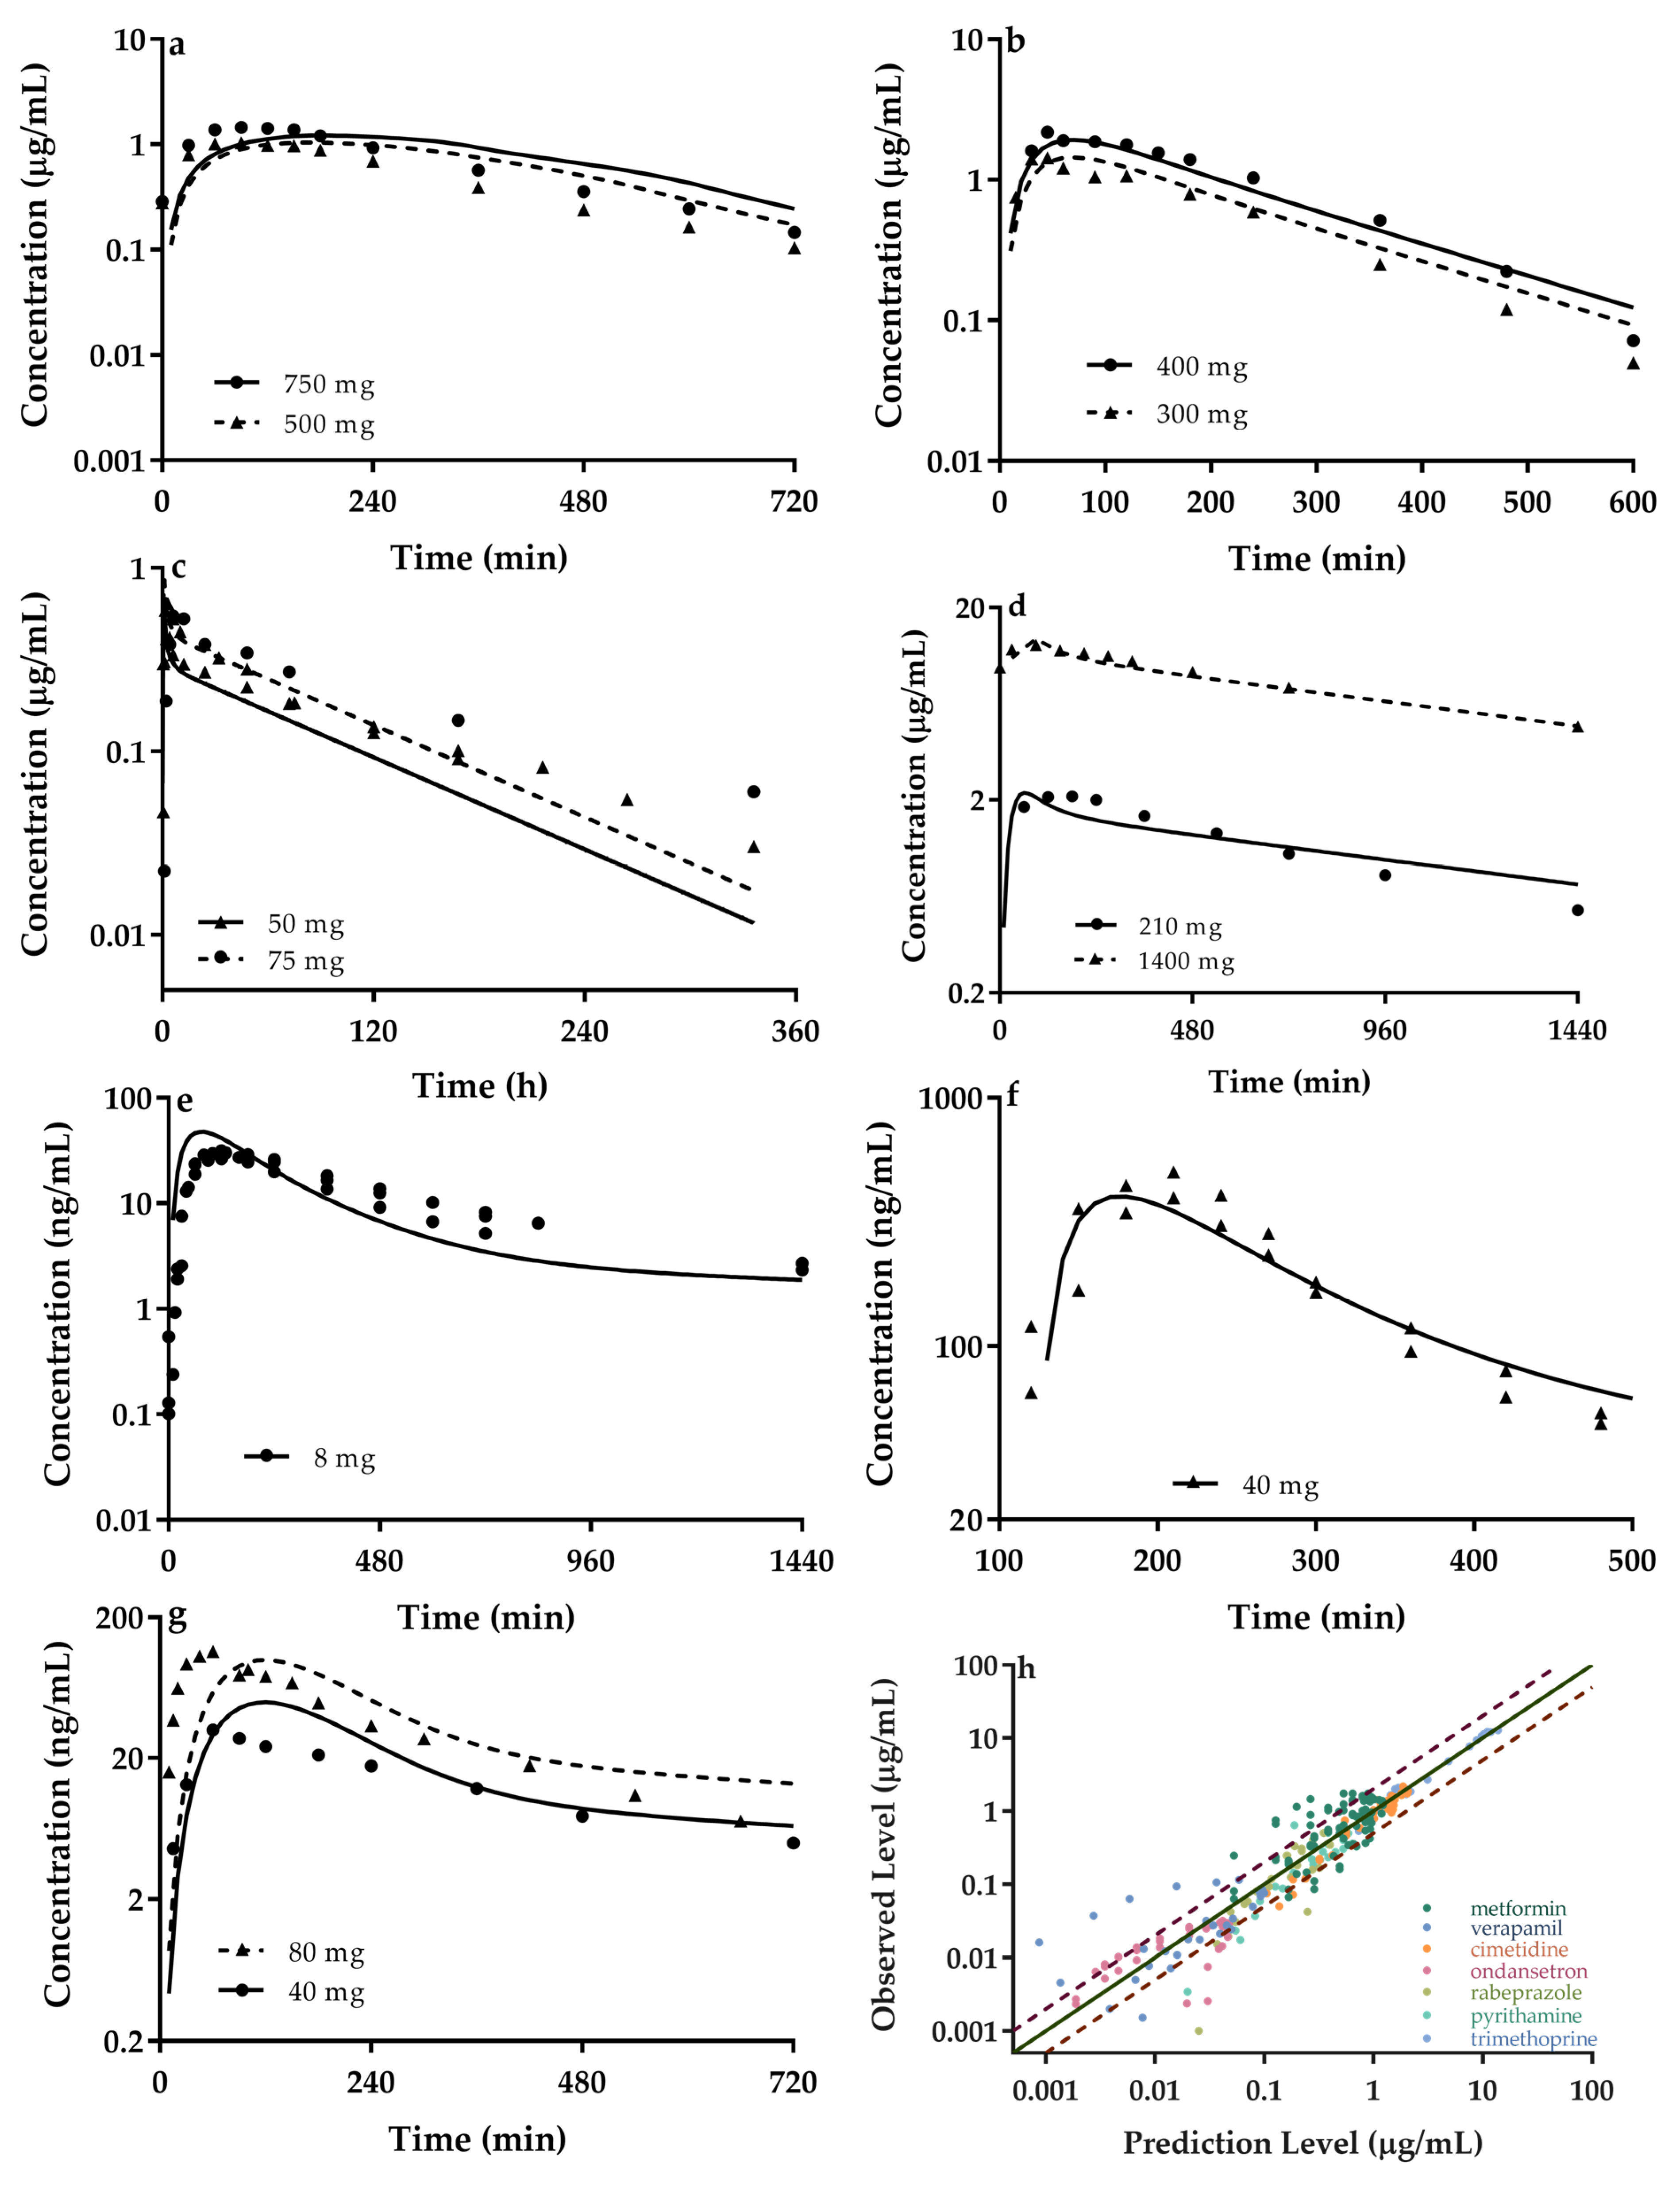
| Metformin | [68] | 750 | 1.22 | 1.5 | 0.81 | 11.05 | 9.4 | 1.18 |
| [69] | 500 | 0.95 | 1.55 | 0.61 | 7.04 | 9.08 | 0.78 | |
| Cimetidine | [70] | 400 | 2.06 | 2.20 | 0.94 | 9.17 | 8.03 | 1.14 |
| [71] | 300 | 1.53 | 1.53 | 1.00 | 6.68 | 5.22 | 1.28 | |
| Pyrimethamine | [72] | 50 | 0.57 | 0.76 | 0.75 | 31.18 | 76 | 0.41 |
| [73] | 50 | 0.57 | 0.37 | 1.54 | 31.18 | 42.83 | 0.73 | |
| [74] | 75 | 0.86 | 0.86 | 1.00 | 46.77 | 124.6 | 0.38 | |
| [75] | 75 | 0.86 | 0.60 | 1.43 | 46.77 | 68.34 | 0.68 | |
| Trimethoprim | [76] | 210 | 2.18 | 2.35 | 0.93 | 28.26 | 37.1 | 0.76 |
| [77] | 1400 | 13.76 | 12.78 | 1.08 | 302.34 | 299.31 | 1.01 | |
| Ondansetron | [78] | 8 | 0.046 | 0.0272 | 1.69 | 0.203 | 0.198 | 1.03 |
| [79] | 8 | 0.046 | 0.037 | 1.24 | 0.233 | 0.254 | 0.92 | |
| Rabeprazole | [80] | 40 | 0.40 | 0.502 | 0.80 | 1.27 | 1.315 | 0.97 |
| [80] | 40 | 0.40 | 0.444 | 0.90 | 1.27 | 1.332 | 0.95 | |
| [81] | 20 | 0.20 | 0.252 | 0.79 | 0.63 | 0.575 | 1.10 | |
| Verapamil | [82] | 40 | 0.050 | 0.033 | 1.52 | 0.28 | 0.22 | 1.27 |
| [83] | 80 | 0.099 | 0.13 | 0.76 | 0.564 | 0.387 | 1.46 | |

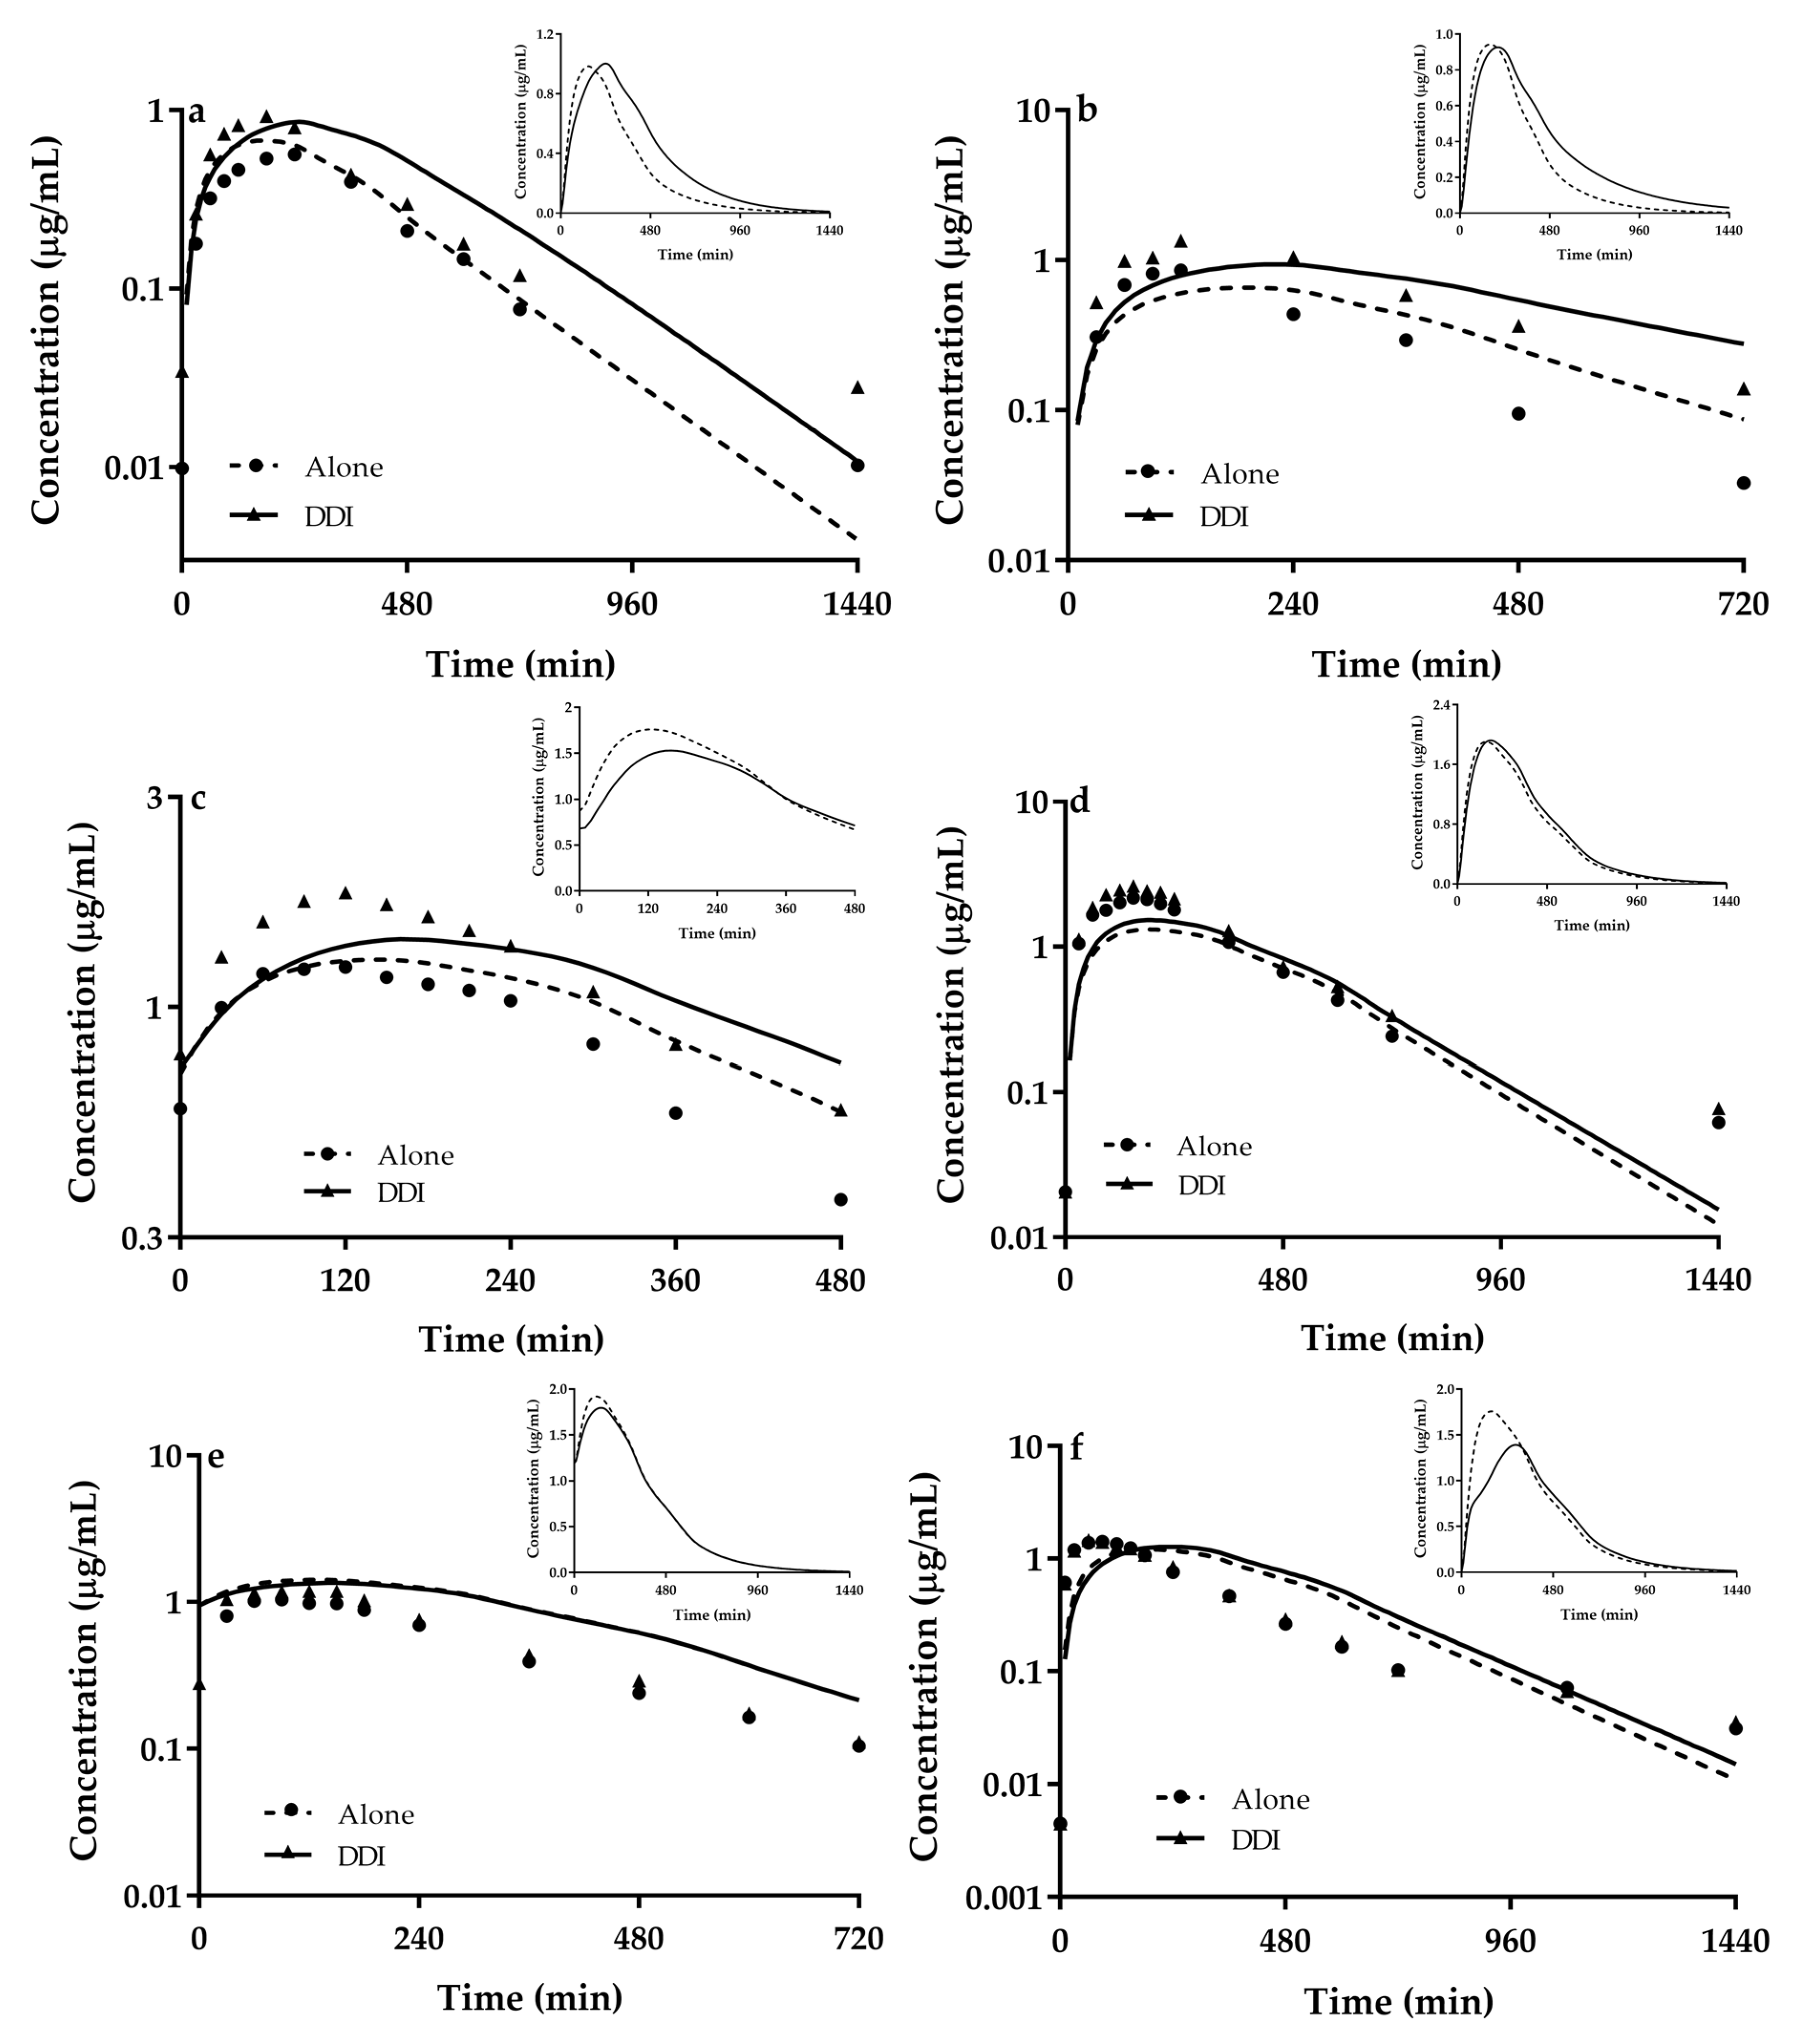
3.3. Predicted DDIs of Metformin with Perpetrators
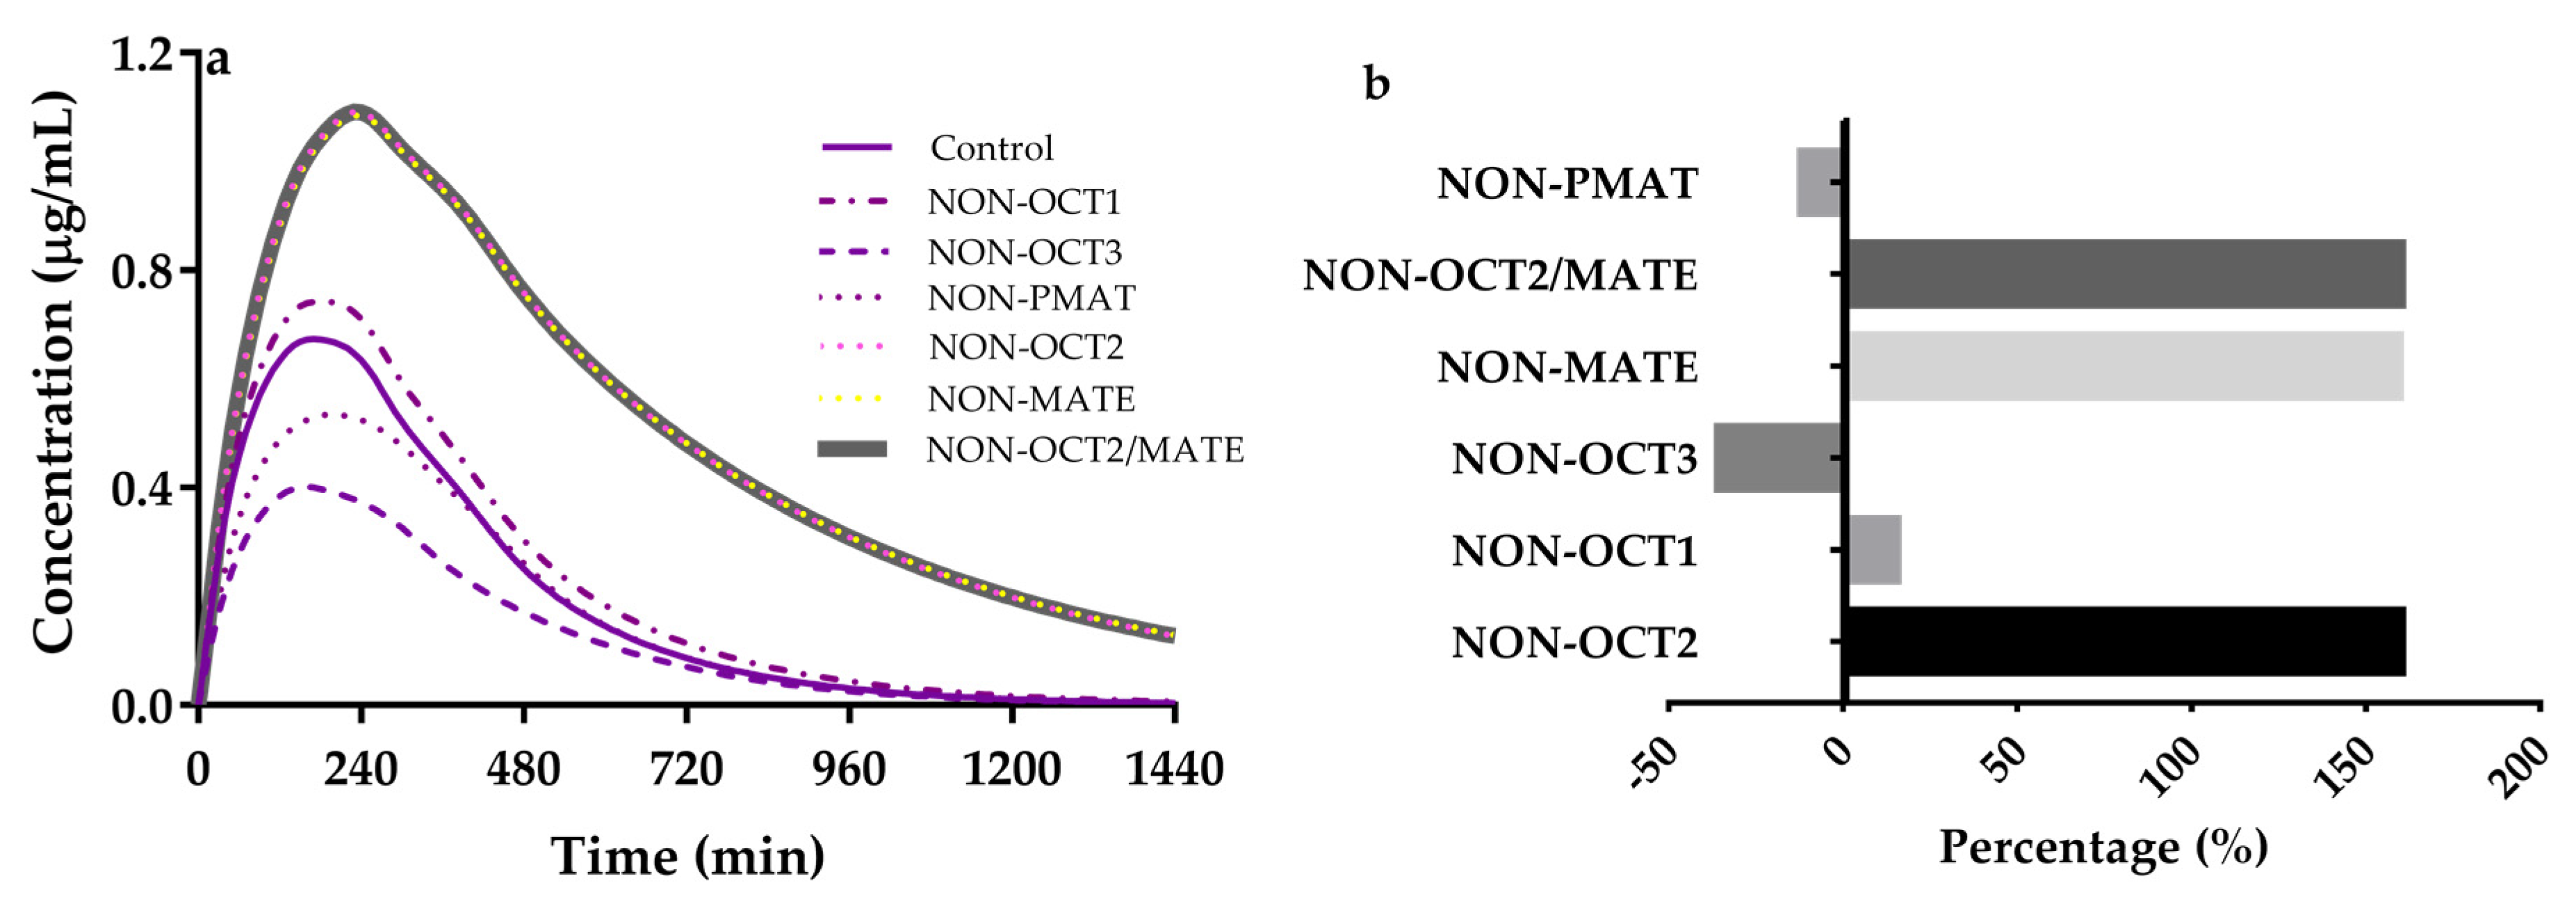
3.4. Sensitivity Analysis
4. Conclusions
Supplementary Materials
Author Contributions
Funding
Institutional Review Board Statement
Informed Consent Statement
Data Availability Statement
Conflicts of Interest
References
- Liang, X.; Giacomini, K.M. Transporters Involved in Metformin Pharmacokinetics and Treatment Response. J. Pharm. Sci. 2017, 106, 2245–2250. [Google Scholar] [CrossRef] [Green Version]
- Koepsell, H. Organic cation transporters in intestine, kidney, liver, and brain. Annu. Rev. Physiol. 1998, 60, 243–266. [Google Scholar] [CrossRef] [PubMed]
- Muller, J.; Lips, K.S.; Metzner, L.; Neubert, R.H.; Koepsell, H.; Brandsch, M. Drug specificity and intestinal membrane localization of human organic cation transporters (OCT). Biochem. Pharmacol. 2005, 70, 1851–1860. [Google Scholar] [CrossRef]
- Wright, S.H. Role of organic cation transporters in the renal handling of therapeutic agents and xenobiotics. Toxicol. Appl. Pharmacol. 2005, 204, 309–319. [Google Scholar] [CrossRef]
- Wu, X.; Kekuda, R.; Huang, W.; Fei, Y.J.; Leibach, F.H.; Chen, J.; Conway, S.J.; Ganapathy, V. Identity of the organic cation transporter OCT3 as the extraneuronal monoamine transporter (uptake2) and evidence for the expression of the transporter in the brain. J. Biol. Chem. 1998, 273, 32776–32786. [Google Scholar] [CrossRef] [Green Version]
- Chen, E.C.; Liang, X.; Yee, S.W.; Geier, E.G.; Stocker, S.L.; Chen, L.; Giacomini, K.M. Targeted disruption of organic cation transporter 3 attenuates the pharmacologic response to metformin. Mol. Pharmacol. 2015, 88, 75–83. [Google Scholar] [CrossRef] [PubMed] [Green Version]
- Shirasaka, Y.; Lee, N.; Zha, W.; Wagner, D.; Wang, J. Involvement of organic cation transporter 3 (Oct3/Slc22a3) in the bioavailability and pharmacokinetics of antidiabetic metformin in mice. Drug Metab. Pharmacokinet. 2016, 31, 385–388. [Google Scholar] [CrossRef] [PubMed] [Green Version]
- Al-Eitan, L.N.; Almomani, B.A.; Nassar, A.M.; Elsaqa, B.Z.; Saadeh, N.A. Metformin Pharmacogenetics: Effects of SLC22A1, SLC22A2, and SLC22A3 Polymorphisms on Glycemic Control and HbA1c Levels. J. Pers. Med. 2019, 9, 17. [Google Scholar] [CrossRef] [Green Version]
- Hosseyni-Talei, S.R.; Mahrooz, A.; Hashemi-Soteh, M.B.; Ghaffari-Cherati, M.; Alizadeh, A. Association between the synonymous variant organic cation transporter 3 (OCT3)-1233G>A and the glycemic response following metformin therapy in patients with type 2 diabetes. Iran. J. Basic Med. Sci. 2017, 20, 250–255. [Google Scholar] [CrossRef] [PubMed]
- Hakooz, N.; Jarrar, Y.B.; Zihlif, M.; Imraish, A.; Hamed, S.; Arafat, T. Effects of the genetic variants of organic cation transporters 1 and 3 on the pharmacokinetics of metformin in Jordanians. Drug. Metab. Pers. Ther. 2017, 32, 157–162. [Google Scholar] [CrossRef]
- Graham, G.G.; Punt, J.; Arora, M.; Day, R.O.; Doogue, M.P.; Duong, J.K.; Furlong, T.J.; Greenfield, J.R.; Greenup, L.C.; Kirkpatrick, C.M.; et al. Clinical pharmacokinetics of metformin. Clin. Pharmacokinet. 2011, 50, 81–98. [Google Scholar] [CrossRef] [PubMed]
- Liu, X. Transporter-Mediated Drug-Drug Interactions and Their Significance. Adv. Exp. Med. Biol. 2019, 1141, 241–291. [Google Scholar] [CrossRef]
- Somogyi, A.; Stockley, C.; Keal, J.; Rolan, P.; Bochner, F. Reduction of metformin renal tubular secretion by cimetidine in man. Br. J. Clin. Pharmacol. 1987, 23, 545–551. [Google Scholar] [CrossRef] [PubMed] [Green Version]
- Kusuhara, H.; Ito, S.; Kumagai, Y.; Jiang, M.; Shiroshita, T.; Moriyama, Y.; Inoue, K.; Yuasa, H.; Sugiyama, Y. Effects of a MATE protein inhibitor, pyrimethamine, on the renal elimination of metformin at oral microdose and at therapeutic dose in healthy subjects. Clin. Pharmacol. Ther. 2011, 89, 837–844. [Google Scholar] [CrossRef]
- Oh, J.; Chung, H.; Park, S.I.; Yi, S.J.; Jang, K.; Kim, A.H.; Yoon, J.; Cho, J.Y.; Yoon, S.H.; Jang, I.J.; et al. Inhibition of the multidrug and toxin extrusion (MATE) transporter by pyrimethamine increases the plasma concentration of metformin but does not increase antihyperglycaemic activity in humans. Diabetes Obes. Metab. 2016, 18, 104–108. [Google Scholar] [CrossRef] [PubMed]
- Grun, B.; Kiessling, M.K.; Burhenne, J.; Riedel, K.D.; Weiss, J.; Rauch, G.; Haefeli, W.E.; Czock, D. Trimethoprim-metformin interaction and its genetic modulation by OCT2 and MATE1 transporters. Br. J. Clin. Pharmacol. 2013, 76, 787–796. [Google Scholar] [CrossRef] [Green Version]
- Song, I.H.; Zong, J.; Borland, J.; Jerva, F.; Wynne, B.; Zamek-Gliszczynski, M.J.; Humphreys, J.E.; Bowers, G.D.; Choukour, M. The Effect of Dolutegravir on the Pharmacokinetics of Metformin in Healthy Subjects. J. Acquir. Immune Defic. Syndr. 2016, 72, 400–407. [Google Scholar] [CrossRef] [Green Version]
- Johansson, S.; Read, J.; Oliver, S.; Steinberg, M.; Li, Y.; Lisbon, E.; Mathews, D.; Leese, P.T.; Martin, P. Pharmacokinetic evaluations of the co-administrations of vandetanib and metformin, digoxin, midazolam, omeprazole or ranitidine. Clin. Pharmacokinet. 2014, 53, 837–847. [Google Scholar] [CrossRef]
- Li, Q.; Yang, H.; Guo, D.; Zhang, T.; Polli, J.E.; Zhou, H.; Shu, Y. Effect of Ondansetron on Metformin Pharmacokinetics and Response in Healthy Subjects. Drug Metab. Dispos. 2016, 44, 489–494. [Google Scholar] [CrossRef] [Green Version]
- Liu, G.; Wen, J.; Guo, D.; Wang, Z.; Hu, X.; Tang, J.; Liu, Z.; Zhou, H.; Zhang, W. The effects of rabeprazole on metformin pharmacokinetics and pharmacodynamics in Chinese healthy volunteers. J. Pharmacol. Sci. 2016, 132, 244–248. [Google Scholar] [CrossRef] [Green Version]
- U.S. FDA. Drug Development and Drug Interactions: Table of Substrates, Inhibitors and Inducers. Available online: https://www.fda.gov/drugs/drug-interactions-labeling/drug-development-and-drug-interactions-table-substrates-inhibitors-and-inducers (accessed on 10 March 2020).
- U.S. FDA. FDA Approved Drug Products. Guidance for Industry: Physiologically Based Pharmacokinetic Analysis. Available online: https://www.fda.gov/drugs/guidance-compliance-regulatory-information/guidances-drugs (accessed on 25 January 2021).
- EMA. Guideline on the Qualification and Reporting of Physiologically Based Pharmacokinetic (PBPK) Modelling and Simulation. Available online: https://www.ema.europa.eu/en/documents/scientific-guideline/draft-guideline-qualification-reporting-physiologically-based-pharmacokinetic-pbpk-modelling_en.pdf (accessed on 21 July 2016).
- Nishiyama, K.; Toshimoto, K.; Lee, W.; Ishiguro, N.; Bister, B.; Sugiyama, Y. Physiologically-Based Pharmacokinetic Modeling Analysis for Quantitative Prediction of Renal Transporter-Mediated Interactions Between Metformin and Cimetidine. CPT Pharmacomet. Syst. Pharm. 2019, 8, 396–406. [Google Scholar] [CrossRef] [PubMed] [Green Version]
- Burt, H.J.; Neuhoff, S.; Almond, L.; Gaohua, L.; Harwood, M.D.; Jamei, M.; Rostami-Hodjegan, A.; Tucker, G.T.; Rowland-Yeo, K. Metformin and cimetidine: Physiologically based pharmacokinetic modelling to investigate transporter mediated drug-drug interactions. Eur. J. Pharm. Sci. 2016, 88, 70–82. [Google Scholar] [CrossRef] [PubMed]
- Hanke, N.; Turk, D.; Selzer, D.; Ishiguro, N.; Ebner, T.; Wiebe, S.; Muller, F.; Stopfer, P.; Nock, V.; Lehr, T. A Comprehensive Whole-Body Physiologically Based Pharmacokinetic Drug-Drug-Gene Interaction Model of Metformin and Cimetidine in Healthy Adults and Renally Impaired Individuals. Clin. Pharmacokinet. 2020. [Google Scholar] [CrossRef]
- Kim, A.; Chung, I.; Yoon, S.H.; Yu, K.S.; Lim, K.S.; Cho, J.Y.; Lee, H.; Jang, I.J.; Chung, J.Y. Effects of proton pump inhibitors on metformin pharmacokinetics and pharmacodynamics. Drug Metab. Dispos. 2014, 42, 1174–1179. [Google Scholar] [CrossRef] [PubMed] [Green Version]
- Han, T.K.; Proctor, W.R.; Costales, C.L.; Cai, H.; Everett, R.S.; Thakker, D.R. Four cation-selective transporters contribute to apical uptake and accumulation of metformin in Caco-2 cell monolayers. J. Pharmacol. Exp. Ther. 2015, 352, 519–528. [Google Scholar] [CrossRef] [Green Version]
- Horie, A.; Sakata, J.; Nishimura, M.; Ishida, K.; Taguchi, M.; Hashimoto, Y. Mechanisms for membrane transport of metformin in human intestinal epithelial Caco-2 cells. Biopharm. Drug Dispos. 2011, 32, 253–260. [Google Scholar] [CrossRef] [PubMed]
- Abuhelwa, A.Y.; Foster, D.J.R.; Upton, R.N. A Quantitative Review and Meta-Models of the Variability and Factors Affecting Oral Drug Absorption-Part I: Gastrointestinal pH. AAPS J. 2016, 18, 1309–1321. [Google Scholar] [CrossRef]
- Harwood, M.D.; Zhang, M.; Pathak, S.M.; Neuhoff, S. The Regional-Specific Relative and Absolute Expression of Gut Transporters in Adult Caucasians: A Meta-Analysis. Drug Metab. Dispos. 2019, 47, 854–864. [Google Scholar] [CrossRef] [Green Version]
- Nakada, T.; Kudo, T.; Kume, T.; Kusuhara, H.; Ito, K. Quantitative analysis of elevation of serum creatinine via renal transporter inhibition by trimethoprim in healthy subjects using physiologically-based pharmacokinetic model. Drug Metab. Pharmacokinet. 2018, 33, 103–110. [Google Scholar] [CrossRef]
- Zhou, W.; Johnson, T.N.; Bui, K.H.; Cheung, S.Y.A.; Li, J.; Xu, H.; Al-Huniti, N.; Zhou, D. Predictive Performance of Physiologically Based Pharmacokinetic (PBPK) Modeling of Drugs Extensively Metabolized by Major Cytochrome P450s in Children. Clin. Pharmacol. Ther. 2018, 104, 188–200. [Google Scholar] [CrossRef]
- Heikkinen, A.T.; Baneyx, G.; Caruso, A.; Parrott, N. Application of PBPK modeling to predict human intestinal metabolism of CYP3A substrates—an evaluation and case study using GastroPlus. Eur. J. Pharm. Sci. 2012, 47, 375–386. [Google Scholar] [CrossRef]
- Ahmad, R.A.; Rogers, H.J. Pharmacokinetics and protein binding interactions of dapsone and pyrimethamine. Br. J. Clin. Pharmacol. 1980, 10, 519–524. [Google Scholar] [CrossRef] [PubMed]
- Qi, F.; Zhu, L.; Li, N.; Ge, T.; Xu, G.; Liao, S. Influence of different proton pump inhibitors on the pharmacokinetics of voriconazole. Int. J. Antimicrob. Agents 2017, 49, 403–409. [Google Scholar] [CrossRef]
- Wang, J.; Xia, S.; Xue, W.; Wang, D.; Sai, Y.; Liu, L.; Liu, X. A semi-physiologically-based pharmacokinetic model characterizing mechanism-based auto-inhibition to predict stereoselective pharmacokinetics of verapamil and its metabolite norverapamil in human. Eur. J. Pharm. Sci. 2013, 50, 290–302. [Google Scholar] [CrossRef] [PubMed]
- Edstein, M.D. Pharmacokinetics of sulfadoxine and pyrimethamine after Fansidar administration in man. Chemotherapy 1987, 33, 229–233. [Google Scholar] [CrossRef] [PubMed]
- Eatman, F.B.; Maggio, A.C.; Pocelinko, R.; Boxenbaum, H.G.; Geitner, K.A.; Glover, W.; Macasieb, T.; Holazo, A.; Weinfeld, R.E.; Kaplan, S.A. Blood and salivary concentrations of sulfamethoxazole and trimethoprim in man. J. Pharmacokinet. Biopharm. 1977, 5, 615–624. [Google Scholar] [CrossRef] [PubMed]
- Elsby, R.; Chidlaw, S.; Outteridge, S.; Pickering, S.; Radcliffe, A.; Sullivan, R.; Jones, H.; Butler, P. Mechanistic in vitro studies confirm that inhibition of the renal apical efflux transporter multidrug and toxin extrusion (MATE) 1, and not altered absorption, underlies the increased metformin exposure observed in clinical interactions with cimetidine, trimethoprim or pyrimethamine. Pharmacol. Res. Perspect. 2017, 5. [Google Scholar] [CrossRef]
- Bell, D.J.; Nyirongo, S.K.; Mukaka, M.; Molyneux, M.E.; Winstanley, P.A.; Ward, S.A. Population pharmacokinetics of sulfadoxine and pyrimethamine in Malawian children with malaria. Clin. Pharmacol. Ther. 2011, 89, 268–275. [Google Scholar] [CrossRef]
- Miura, M.; Kagaya, H.; Tada, H.; Uno, T.; Yasui-Furukori, N.; Tateishi, T.; Suzuki, T. Enantioselective disposition of rabeprazole in relation to CYP2C19 genotypes. Br. J. Clin. Pharmacol. 2006, 61, 315–320. [Google Scholar] [CrossRef] [PubMed] [Green Version]
- Almond, D.S.; Szwandt, I.S.; Edwards, G.; Lee, M.G.; Winstanley, P.A. Disposition of intravenous pyrimethamine in healthy volunteers. Antimicrob. Agents Chemother. 2000, 44, 1691–1693. [Google Scholar] [CrossRef] [PubMed] [Green Version]
- Miura, M.; Satoh, S.; Tada, H.; Habuchi, T.; Suzuki, T. Stereoselective metabolism of rabeprazole-thioether to rabeprazole by human liver microsomes. Eur. J. Clin. Pharmacol. 2006, 62, 113–117. [Google Scholar] [CrossRef] [PubMed]
- Mouankie, J.B.; Senczuk, W.; Florek, E. Urinary elimination kinetics of pyrimethamine. Eur. J. Drug Metab. Pharmacokinet. 2009, 34, 169–172. [Google Scholar] [CrossRef] [PubMed]
- Zhu, P.; Ye, Z.; Guo, D.; Xiong, Z.; Huang, S.; Guo, J.; Zhang, W.; Polli, J.E.; Zhou, H.; Li, Q.; et al. Irinotecan Alters the Disposition of Morphine Via Inhibition of Organic Cation Transporter 1 (OCT1) and 2 (OCT2). Pharm. Res. 2018, 35, 243. [Google Scholar] [CrossRef] [PubMed]
- Nies, A.T.; Hofmann, U.; Resch, C.; Schaeffeler, E.; Rius, M.; Schwab, M. Proton pump inhibitors inhibit metformin uptake by organic cation transporters (OCTs). PLoS ONE 2011, 6, e22163. [Google Scholar] [CrossRef] [PubMed] [Green Version]
- Chu, X.; Bleasby, K.; Chan, G.H.; Nunes, I.; Evers, R. The Complexities of Interpreting Reversible Elevated Serum Creatinine Levels in Drug Development: Does a Correlation with Inhibition of Renal Transporters Exist? Drug Metab. Dispos. 2016, 44, 1498–1509. [Google Scholar] [CrossRef] [Green Version]
- Nakada, T.; Kudo, T.; Kume, T.; Kusuhara, H.; Ito, K. Estimation of changes in serum creatinine and creatinine clearance caused by renal transporter inhibition in healthy subjects. Drug Metab. Pharmacokinet. 2019, 34, 233–238. [Google Scholar] [CrossRef] [PubMed]
- Guo, H.; Liu, C.; Li, J.; Zhang, M.; Hu, M.; Xu, P.; Liu, L.; Liu, X. A mechanistic physiologically based pharmacokinetic-enzyme turnover model involving both intestine and liver to predict CYP3A induction-mediated drug-drug interactions. J. Pharm. Sci. 2013, 102, 2819–2836. [Google Scholar] [CrossRef]
- Zhou, M.; Xia, L.; Wang, J. Metformin transport by a newly cloned proton-stimulated organic cation transporter (plasma membrane monoamine transporter) expressed in human intestine. Drug Metab. Dispos. 2007, 35, 1956–1962. [Google Scholar] [CrossRef] [Green Version]
- Solbach, T.F.; Grube, M.; Fromm, M.F.; Zolk, O. Organic cation transporter 3: Expression in failing and nonfailing human heart and functional characterization. J. Cardiovasc. Pharmacol. 2011, 58, 409–417. [Google Scholar] [CrossRef]
- Paine, M.F.; Khalighi, M.; Fisher, J.M.; Shen, D.D.; Kunze, K.L.; Marsh, C.L.; Perkins, J.D.; Thummel, K.E. Characterization of interintestinal and intraintestinal variations in human CYP3A-dependent metabolism. J. Pharmacol. Exp. Ther. 1997, 283, 1552–1562. [Google Scholar]
- Peters, S.A.; Jones, C.R.; Ungell, A.L.; Hatley, O.J. Predicting Drug Extraction in the Human Gut Wall: Assessing Contributions from Drug Metabolizing Enzymes and Transporter Proteins using Preclinical Models. Clin. Pharmacokinet. 2016, 55, 673–696. [Google Scholar] [CrossRef] [Green Version]
- DeSesso, J.M.; Jacobson, C.F. Anatomical and physiological parameters affecting gastrointestinal absorption in humans and rats. Food Chem. Toxicol. 2001, 39, 209–228. [Google Scholar] [CrossRef]
- Gomez, D.M.; Demeester, M.; Steinmetz, P.R.; Lowenstein, J.; Sammons, B.P.; Baldwin, D.S.; Chasis, H. Functional blood volume and distribution of specific blood flow in the kidney of man. J. Appl. Physiol. 1965, 20, 703–708. [Google Scholar] [CrossRef]
- Mathialagan, S.; Piotrowski, M.A.; Tess, D.A.; Feng, B.; Litchfield, J.; Varma, M.V. Quantitative Prediction of Human Renal Clearance and Drug-Drug Interactions of Organic Anion Transporter Substrates Using In Vitro Transport Data: A Relative Activity Factor Approach. Drug Metab. Dispos. 2017, 45, 409–417. [Google Scholar] [CrossRef] [Green Version]
- Liu, X.I.; Momper, J.D.; Rakhmanina, N.; van den Anker, J.N.; Green, D.J.; Burckart, G.J.; Best, B.M.; Mirochnick, M.; Capparelli, E.V.; Dallmann, A. Physiologically Based Pharmacokinetic Models to Predict Maternal Pharmacokinetics and Fetal Exposure to Emtricitabine and Acyclovir. J. Clin. Pharmacol. 2020, 60, 240–255. [Google Scholar] [CrossRef] [PubMed]
- Parrott, N.; Paquereau, N.; Coassolo, P.; Lave, T. An evaluation of the utility of physiologically based models of pharmacokinetics in early drug discovery. J. Pharm. Sci. 2005, 94, 2327–2343. [Google Scholar] [CrossRef] [PubMed]
- Jalal, F.E.; Xu, Y.; Iqbal, M.; Javed, M.F.; Jamhiri, B. Predictive modeling of swell-strength of expansive soils using artificial intelligence approaches: ANN, ANFIS and GEP. J. Environ. Manag. 2021, 289, 112420. [Google Scholar] [CrossRef]
- Qian, C.Q.; Zhao, K.J.; Chen, Y.; Liu, L.; Liu, X.D. Simultaneously predict pharmacokinetic interaction of rifampicin with oral versus intravenous substrates of cytochrome P450 3A/Pglycoprotein to healthy human using a semi-physiologically based pharmacokinetic model involving both enzyme and transporter turnover. Eur. J. Pharm. Sci. 2019, 134, 194–204. [Google Scholar] [CrossRef] [PubMed]
- Li, J.; Guo, H.F.; Liu, C.; Zhong, Z.; Liu, L.; Liu, X.D. Prediction of drug disposition in diabetic patients by means of a physiologically based pharmacokinetic model. Clin. Pharmacokinet. 2015, 54, 179–193. [Google Scholar] [CrossRef]
- Rodgers, T.; Rowland, M. Physiologically based pharmacokinetic modelling 2: Predicting the tissue distribution of acids, very weak bases, neutrals and zwitterions. J. Pharm. Sci. 2006, 95, 1238–1257. [Google Scholar] [CrossRef] [PubMed]
- Drozdzik, M.; Groer, C.; Penski, J.; Lapczuk, J.; Ostrowski, M.; Lai, Y.; Prasad, B.; Unadkat, J.D.; Siegmund, W.; Oswald, S. Protein abundance of clinically relevant multidrug transporters along the entire length of the human intestine. Mol. Pharm. 2014, 11, 3547–3555. [Google Scholar] [CrossRef] [PubMed]
- Groer, C.; Bruck, S.; Lai, Y.; Paulick, A.; Busemann, A.; Heidecke, C.D.; Siegmund, W.; Oswald, S. LC-MS/MS-based quantification of clinically relevant intestinal uptake and efflux transporter proteins. J. Pharm. Biomed. Anal. 2013, 85, 253–261. [Google Scholar] [CrossRef]
- Moon, S.J.; Oh, J.; Lee, S.H.; Choi, Y.; Yu, K.S.; Chung, J.Y. Effect of plasma membrane monoamine transporter genetic variants on pharmacokinetics of metformin in humans. Transl. Clin. Pharmacol. 2018, 26, 79–85. [Google Scholar] [CrossRef] [Green Version]
- Kwon, E.Y.; Chung, J.Y.; Park, H.J.; Kim, B.M.; Kim, M.; Choi, J.H. OCT3 promoter haplotype is associated with metformin pharmacokinetics in Koreans. Sci. Rep. 2018, 8, 16965. [Google Scholar] [CrossRef]
- Cho, S.K.; Yoon, J.S.; Lee, M.G.; Lee, D.H.; Lim, L.A.; Park, K.; Park, M.S.; Chung, J.Y. Rifampin enhances the glucose-lowering effect of metformin and increases OCT1 mRNA levels in healthy participants. Clin. Pharmacol. Ther. 2011, 89, 416–421. [Google Scholar] [CrossRef] [PubMed]
- Pentikainen, P.J.; Neuvonen, P.J.; Penttila, A. Pharmacokinetics of metformin after intravenous and oral administration to man. Eur. J. Clin. Pharmacol. 1979, 16, 195–202. [Google Scholar] [CrossRef]
- Jantratid, E.; Prakongpan, S.; Amidon, G.L.; Dressman, J.B. Feasibility of biowaiver extension to biopharmaceutics classification system class III drug products: Cimetidine. Clin. Pharmacokinet. 2006, 45, 385–399. [Google Scholar] [CrossRef] [PubMed]
- Walkenstein, S.S.; Dubb, J.W.; Randolph, W.C.; Westlake, W.J.; Stote, R.M.; Intoccia, A.P. Bioavailability of cimetidine in man. Gastroenterology 1978, 74, 360–365. [Google Scholar] [CrossRef]
- Mansor, S.M.; Navaratnam, V.; Mohamad, M.; Hussein, S.; Kumar, A.; Jamaludin, A.; Wernsdorfer, W.H. Single dose kinetic study of the triple combination mefloquine/sulphadoxine/pyrimethamine (Fansimef) in healthy male volunteers. Br. J. Clin. Pharmacol. 1989, 27, 381–386. [Google Scholar] [CrossRef] [Green Version]
- Iida, T.; Nand, R.A.; Ino, H.; Ogura, H.; Itoh, H.; Igarashi, H.; Numachi, Y.; Gross, A.S. Evaluation of the Pharmacokinetics, Safety, and Tolerability of a Single Oral Dose of Pyrimethamine in Healthy Male Subjects of Japanese and European Ancestry. Clin. Pharmacol. Drug Dev. 2020, 9, 768–773. [Google Scholar] [CrossRef]
- Minzi, O.M.; Gupta, A.; Haule, A.F.; Kagashe, G.A.; Massele, A.Y.; Gustafsson, L.L. Lack of impact of artesunate on the disposition kinetics of sulfadoxine/pyrimethamine when the two drugs are concomitantly administered. Eur. J. Clin. Pharmacol. 2007, 63, 457–462. [Google Scholar] [CrossRef]
- Chhonker, Y.S.; Bhosale, V.V.; Sonkar, S.K.; Chandasana, H.; Kumar, D.; Vaish, S.; Choudhary, S.C.; Bhadhuria, S.; Sharma, S.; Singh, R.K.; et al. Assessment of Clinical Pharmacokinetic Drug-Drug Interaction of Antimalarial Drugs alpha/beta-Arteether and Sulfadoxine-Pyrimethamine. Antimicrob. Agents Chemother. 2017, 61. [Google Scholar] [CrossRef] [Green Version]
- Hoppu, K.; Tuomisto, J.; Koskimies, O.; Simell, O. Food and guar decrease absorption of trimethoprim. Eur. J. Clin. Pharmacol. 1987, 32, 427–429. [Google Scholar] [CrossRef] [PubMed]
- Hruska, M.W.; Frye, R.F. Determination of trimethoprim in low-volume human plasma by liquid chromatography. J. Chromatogr. B Analyt. Technol. Biomed. Life Sci. 2004, 807, 301–305. [Google Scholar] [CrossRef] [PubMed]
- Villikka, K.; Kivisto, K.T.; Neuvonen, P.J. The effect of rifampin on the pharmacokinetics of oral and intravenous ondansetron. Clin. Pharmacol. Ther. 1999, 65, 377–381. [Google Scholar] [CrossRef]
- Zhu, Y.; Zhang, Q.; Zou, J.; Wan, M.; Zhao, Z.; Zhu, J. Pharmacokinetics and bioavailability study of two ondansetron oral soluble film formulations in fasting healthy male Chinese volunteers. Drug Des. Devel. Ther. 2015, 9, 4621–4629. [Google Scholar] [CrossRef] [Green Version]
- Chen, J.; Jiang, W.M.; Gao, X.L.; Jiang, X.; Zhang, Q.Z.; Zheng, Z.H. Bioequivalence evaluation of two rabeprazole enteric coated formulations in healthy Chinese volunteers. Eur. J. Drug Metab. Pharmacokinet. 2004, 29, 103–106. [Google Scholar] [CrossRef]
- Noubarani, M.; Keyhanfar, F.; Motevalian, M.; Mahmoudian, M. Improved HPLC method for determination of four PPIs, omeprazole, pantoprazole, lansoprazole and rabeprazole in human plasma. J. Pharm. Pharm. Sci. 2010, 13, 1–10. [Google Scholar] [CrossRef] [Green Version]
- Sawicki, W. Pharmacokinetics of verapamil and norverapamil from controlled release floating pellets in humans. Eur. J. Pharm. Biopharm. 2002, 53, 29–35. [Google Scholar] [CrossRef]
- Dadashzadeh, S.; Javadian, B.; Sadeghian, S. The effect of gender on the pharmacokinetics of verapamil and norverapamil in human. Biopharm. Drug Dispos. 2006, 27, 329–334. [Google Scholar] [CrossRef] [PubMed]
- Rocha, J.F.; Vaz-da-Silva, M.; Almeida, L.; Falcao, A.; Nunes, T.; Santos, A.T.; Martins, F.; Fontes-Ribeiro, C.; Macedo, T.; Soares-da-Silva, P. Effect of eslicarbazepine acetate on the pharmacokinetics of metformin in healthy subjects. Int. J. Clin. Pharmacol. Ther. 2009, 47, 255–261. [Google Scholar] [CrossRef]
- Nyunt, M.M.; Adam, I.; Kayentao, K.; van Dijk, J.; Thuma, P.; Mauff, K.; Little, F.; Cassam, Y.; Guirou, E.; Traore, B.; et al. Pharmacokinetics of sulfadoxine and pyrimethamine in intermittent preventive treatment of malaria in pregnancy. Clin. Pharmacol. Ther. 2010, 87, 226–234. [Google Scholar] [CrossRef]
- Wang, Y.; Yuan, Y.; Meng, L.; Fan, H.; Xu, J.; Zhang, H.; Wang, M.; Yuan, H.; Ou, N.; Zhang, H.; et al. Study of the pharmacokinetics and intragastric pH of rabeprazole given as successive intravenous infusion to healthy Chinese volunteers. Eur. J. Clin. Pharmacol. 2011, 67, 25–31. [Google Scholar] [CrossRef]
- Stevens, R.C.; Laizure, S.C.; Williams, C.L.; Stein, D.S. Pharmacokinetics and adverse effects of 20-mg/kg/day trimethoprim and 100-mg/kg/day sulfamethoxazole in healthy adult subjects. Antimicrob. Agents Chemother. 1991, 35, 1884–1890. [Google Scholar] [CrossRef] [Green Version]
- Rong, G.; Zhong, M.Y.; Xia, Z.H.; Yuan, W.Z.; Hong, Z.W.; Long, Y.H. Bioequivalence of metformin hydrochloride tablets in healthy Chinese subjects. Chin. J. Clin. Pharmacol 2021, 37, 222–226. [Google Scholar]
- Chen, L.; Zhang, X.; LU, X.; Xiao, C.Y.; Qiao, K.; Chen, X.W.; Tong, L.J. Bioequivalence of metformin hydrochloride in Chinese healthy subjects. Chin. J. Clin. Pharmacol. 2019, 35, 854–857. [Google Scholar] [CrossRef]
- Wang, Z.J.; Yin, O.Q.; Tomlinson, B.; Chow, M.S. OCT2 polymorphisms and in-vivo renal functional consequence: Studies with metformin and cimetidine. Pharmacogenet. Genom. 2008, 18, 637–645. [Google Scholar] [CrossRef]
- Garza-Ocanas, L.; Gonzalez-Canudas, J.; Tamez-de la, O.E.; Badillo-Castaneda, C.; Gomez-Meza, M.V.; Romero-Antonio, Y.; Molina-Perez, A.; Amador-Hernandez, A.G. Comparative Bioavailability of Metformin Hydrochloride Oral Solution Versus Metformin Hydrochloride Tablets in Fasting Mexican Healthy Volunteers. Adv. Ther. 2019, 36, 407–415. [Google Scholar] [CrossRef] [PubMed]
- McCreight, L.J.; Stage, T.B.; Connelly, P.; Lonergan, M.; Nielsen, F.; Prehn, C.; Adamski, J.; Brosen, K.; Pearson, E.R. Pharmacokinetics of metformin in patients with gastrointestinal intolerance. Diabetes Obes. Metab. 2018, 20, 1593–1601. [Google Scholar] [CrossRef] [PubMed] [Green Version]
- Jang, K.; Chung, H.; Yoon, J.S.; Moon, S.J.; Yoon, S.H.; Yu, K.S.; Kim, K.; Chung, J.Y. Pharmacokinetics, Safety, and Tolerability of Metformin in Healthy Elderly Subjects. J. Clin. Pharmacol. 2016, 56, 1104–1110. [Google Scholar] [CrossRef] [PubMed]
- Groen-Wijnberg, M.; van Dijk, J.; Krauwinkel, W.; Kerbusch, V.; Meijer, J.; Tretter, R.; Zhang, W.; van Gelderen, M. Pharmacokinetic Interactions Between Mirabegron and Metformin, Warfarin, Digoxin or Combined Oral Contraceptives. Eur. J. Drug Metab. Pharmacokinet. 2017, 42, 417–429. [Google Scholar] [CrossRef] [PubMed]
- Te Brake, L.H.M.; Yunivita, V.; Livia, R.; Soetedjo, N.; van Ewijk-Beneken Kolmer, E.; Koenderink, J.B.; Burger, D.M.; Santoso, P.; van Crevel, R.; Alisjahbana, B.; et al. Rifampicin Alters Metformin Plasma Exposure but Not Blood Glucose Levels in Diabetic Tuberculosis Patients. Clin. Pharmacol. Ther. 2019, 105, 730–737. [Google Scholar] [CrossRef] [PubMed] [Green Version]
- Zaharenko, L.; Kalnina, I.; Geldnere, K.; Konrade, I.; Grinberga, S.; Zidzik, J.; Javorsky, M.; Lejnieks, A.; Nikitina-Zake, L.; Fridmanis, D.; et al. Single nucleotide polymorphisms in the intergenic region between metformin transporter OCT2 and OCT3 coding genes are associated with short-term response to metformin monotherapy in type 2 diabetes mellitus patients. Eur. J. Endocrinol. 2016, 175, 531–540. [Google Scholar] [CrossRef]
- Kim, S.; Jang, I.J.; Shin, D.; Shin, D.S.; Yoon, S.; Lim, K.S.; Yu, K.S.; Li, J.; Zhang, H.; Liu, Y.; et al. Investigation of bioequivalence of a new fixed-dose combination of acarbose and metformin with the corresponding loose combination as well as the drug-drug interaction potential between both drugs in healthy adult male subjects. J. Clin. Pharm. Ther. 2014, 39, 424–431. [Google Scholar] [CrossRef] [PubMed]
- Wen, J.; Zeng, M.; Liu, Z.; Zhou, H.; Xu, H.; Huang, M.; Zhang, W. The influence of telmisartan on metformin pharmacokinetics and pharmacodynamics. J. Pharmacol. Sci. 2019, 139, 37–41. [Google Scholar] [CrossRef] [PubMed]
- Cho, S.K.; Kim, C.O.; Park, E.S.; Chung, J.Y. Verapamil decreases the glucose-lowering effect of metformin in healthy volunteers. Br. J. Clin. Pharmacol. 2014, 78, 1426–1432. [Google Scholar] [CrossRef] [Green Version]
- Shibata, M.; Toyoshima, J.; Kaneko, Y.; Oda, K.; Nishimura, T. A drug-drug interaction study to evaluate the impact of peficitinib on OCT1-and MATE1-mediated transport of metformin in healthy volunteers. Eur. J. Clin. Pharmacol. 2020, 76, 1135–1141. [Google Scholar] [CrossRef]
- Shu, Y.; Brown, C.; Castro, R.A.; Shi, R.J.; Lin, E.T.; Owen, R.P.; Sheardown, S.A.; Yue, L.; Burchard, E.G.; Brett, C.M.; et al. Effect of genetic variation in the organic cation transporter 1, OCT1, on metformin pharmacokinetics. Clin. Pharmacol. Ther. 2008, 83, 273–280. [Google Scholar] [CrossRef] [Green Version]
- Morrissey, K.M.; Stocker, S.L.; Chen, E.C.; Castro, R.A.; Brett, C.M.; Giacomini, K.M. The Effect of Nizatidine, a MATE2K Selective Inhibitor, on the Pharmacokinetics and Pharmacodynamics of Metformin in Healthy Volunteers. Clin. Pharmacokinet. 2016, 55, 495–506. [Google Scholar] [CrossRef] [Green Version]
- Muller, F.; Pontones, C.A.; Renner, B.; Mieth, M.; Hoier, E.; Auge, D.; Maas, R.; Zolk, O.; Fromm, M.F. N(1)-methylnicotinamide as an endogenous probe for drug interactions by renal cation transporters: Studies on the metformin-trimethoprim interaction. Eur. J. Clin. Pharmacol. 2015, 71, 85–94. [Google Scholar] [CrossRef]
- Hibma, J.E.; Zur, A.A.; Castro, R.A.; Wittwer, M.B.; Keizer, R.J.; Yee, S.W.; Goswami, S.; Stocker, S.L.; Zhang, X.; Huang, Y.; et al. The Effect of Famotidine, a MATE1-Selective Inhibitor, on the Pharmacokinetics and Pharmacodynamics of Metformin. Clin. Pharmacokinet. 2016, 55, 711–721. [Google Scholar] [CrossRef] [PubMed] [Green Version]
- Dawra, V.K.; Cutler, D.L.; Zhou, S.; Krishna, R.; Shi, H.; Liang, Y.; Alvey, C.; Hickman, A.; Saur, D.; Terra, S.G.; et al. Assessment of the Drug Interaction Potential of Ertugliflozin With Sitagliptin, Metformin, Glimepiride, or Simvastatin in Healthy Subjects. Clin. Pharmacol. Drug Dev. 2019, 8, 314–325. [Google Scholar] [CrossRef] [Green Version]
- Padwal, R.S.; Gabr, R.Q.; Sharma, A.M.; Langkaas, L.A.; Birch, D.W.; Karmali, S.; Brocks, D.R. Effect of gastric bypass surgery on the absorption and bioavailability of metformin. Diabetes Care 2011, 34, 1295–1300. [Google Scholar] [CrossRef] [Green Version]
- Smolders, E.J.; Colbers, A.; de Kanter, C.; Velthoven-Graafland, K.; Wolberink, L.T.; van Ewijk-Beneken Kolmer, N.; Drenth, J.P.H.; Aarnoutse, R.E.; Tack, C.J.; Burger, D.M. Metformin and daclatasvir: Absence of a pharmacokinetic-pharmacodynamic drug interaction in healthy volunteers. Br. J. Clin. Pharmacol. 2017, 83, 2225–2234. [Google Scholar] [CrossRef]
- Sanchez, R.I.; Yee, K.L.; Fan, L.; Cislak, D.; Martell, M.; Jordan, H.R.; Iwamoto, M.; Khalilieh, S. Evaluation of the Pharmacokinetics of Metformin Following Coadministration With Doravirine in Healthy Volunteers. Clin. Pharmacol. Drug Dev. 2020, 9, 107–114. [Google Scholar] [CrossRef]
- Conde-Carmona, I.; Garcia-Medina, S.; Jimenez-Vargas, J.M.; Martinez-Munoz, A.; Lee, S.H. Pharmacokinetic Interactions Between Gemigliptin and Metformin, and Potential Differences in the Pharmacokinetic Profile of Gemigliptin Between the Mexican and Korean Populations: A Randomized, Open-label Study in Healthy Mexican Volunteers. Clin. Ther. 2018, 40, 1729–1740. [Google Scholar] [CrossRef]
- Christensen, M.M.H.; Hojlund, K.; Hother-Nielsen, O.; Stage, T.B.; Damkier, P.; Beck-Nielsen, H.; Brosen, K. Steady-state pharmacokinetics of metformin is independent of the OCT1 genotype in healthy volunteers. Eur. J. Clin. Pharmacol. 2015, 71, 691–697. [Google Scholar] [CrossRef]
- Yi, L.; Zhang, H.; Zhang, J.W.; You, X.M.; Ning, Z.Q.; Yu, J.; Qian, L.F.; Miao, L.Y. Study on Drug-Drug Interactions between Chiglitazar, a Novel PPAR Pan-Agonist, and Metformin Hydrochloride in Healthy Subjects. Clin. Pharm. Drug Dev. 2019, 8, 934–941. [Google Scholar] [CrossRef]
- Lesko, L.J.; Offman, E.; Brew, C.T.; Garza, D.; Benton, W.; Mayo, M.R.; Romero, A.; Du Mond, C.; Weir, M.R. Evaluation of the Potential for Drug Interactions With Patiromer in Healthy Volunteers. J. Cardiovasc. Pharm. T 2017, 22, 434–446. [Google Scholar] [CrossRef] [PubMed] [Green Version]
- Kuhlmann, I.; Pedersen, S.A.; Esbech, P.S.; Stage, T.B.; Christensen, M.M.H.; Brosen, K. Using a limited sampling strategy to investigate the interindividual pharmacokinetic variability in metformin: A large prospective trial. Br. J. Clin. Pharmaco. 2020. [Google Scholar] [CrossRef]
- Santoro, A.B.; Stage, T.B.; Struchiner, C.J.; Christensen, M.M.; Brosen, K.; Suarez-Kurtz, G. Limited sampling strategy for determining metformin area under the plasma concentration-time curve. Br. J. Clin. Pharmacol. 2016, 82, 1002–1010. [Google Scholar] [CrossRef] [Green Version]
- Kong, W.M.; Sun, B.B.; Wang, Z.J.; Zheng, X.K.; Zhao, K.J.; Chen, Y.; Zhang, J.X.; Liu, P.H.; Zhu, L.; Xu, R.J.; et al. Physiologically based pharmacokinetic-pharmacodynamic modeling for prediction of vonoprazan pharmacokinetics and its inhibition on gastric acid secretion following intravenous/oral administration to rats, dogs and humans. Acta Pharmacol. Sin. B 2020, 41, 852–865. [Google Scholar] [CrossRef]
- Marathe, P.H.; Wen, Y.; Norton, J.; Greene, D.S.; Barbhaiya, R.H.; Wilding, I.R. Effect of altered gastric emptying and gastrointestinal motility on metformin absorption. Br. J. Clin. Pharmacol. 2000, 50, 325–332. [Google Scholar] [CrossRef] [PubMed] [Green Version]
- Tucker, G.T.; Casey, C.; Phillips, P.J.; Connor, H.; Ward, J.D.; Woods, H.F. Metformin kinetics in healthy subjects and in patients with diabetes mellitus. Br. J. Clin. Pharmacol. 1981, 12, 235–246. [Google Scholar] [CrossRef] [PubMed]
- Thomas, M.C.; Tikellis, C.; Kantharidis, P.; Burns, W.C.; Cooper, M.E.; Forbes, J.M. The role of advanced glycation in reduced organic cation transport associated with experimental diabetes. J. Pharmacol. Exp. Ther. 2004, 311, 456–466. [Google Scholar] [CrossRef] [Green Version]
- Thomas, M.C.; Tikellis, C.; Burns, W.C.; Thallas, V.; Forbes, J.M.; Cao, Z.; Osicka, T.M.; Russo, L.M.; Jerums, G.; Ghabrial, H.; et al. Reduced tubular cation transport in diabetes: Prevented by ACE inhibition. Kidney Int. 2003, 63, 2152–2161. [Google Scholar] [CrossRef] [Green Version]
- Karim, A.; Slater, M.; Bradford, D.; Schwartz, L.; Zhao, Z.; Cao, C.; Laurent, A. Oral antidiabetic drugs: Bioavailability assessment of fixed-dose combination tablets of pioglitazone and metformin. Effect of body weight, gender, and race on systemic exposures of each drug. J. Clin. Pharmacol. 2007, 47, 37–47. [Google Scholar] [CrossRef]
- Tzvetkov, M.V.; Vormfelde, S.V.; Balen, D.; Meineke, I.; Schmidt, T.; Sehrt, D.; Sabolic, I.; Koepsell, H.; Brockmoller, J. The effects of genetic polymorphisms in the organic cation transporters OCT1, OCT2, and OCT3 on the renal clearance of metformin. Clin. Pharmacol. Ther. 2009, 86, 299–306. [Google Scholar] [CrossRef]
- Chen, Y.; Li, S.; Brown, C.; Cheatham, S.; Castro, R.A.; Leabman, M.K.; Urban, T.J.; Chen, L.; Yee, S.W.; Choi, J.H.; et al. Effect of genetic variation in the organic cation transporter 2 on the renal elimination of metformin. Pharmacogenet. Genom. 2009, 19, 497–504. [Google Scholar] [CrossRef] [Green Version]
- Christensen, M.M.; Pedersen, R.S.; Stage, T.B.; Brasch-Andersen, C.; Nielsen, F.; Damkier, P.; Beck-Nielsen, H.; Brosen, K. A gene-gene interaction between polymorphisms in the OCT2 and MATE1 genes influences the renal clearance of metformin. Pharmacogenet. Genom. 2013, 23, 526–534. [Google Scholar] [CrossRef]


| Parameter | Unit | Met | Cim | Pyr | Tri | Ond | Rab | Ver |
|---|---|---|---|---|---|---|---|---|
| fub a | 1 [25] | 0.82 [24] | 0.15 [35] | 0.43 [32] | 0.325 [33] | 0.04 [36] | 0.14 [37] | |
| Rb | 1 [25] | 0.97 [24] | 0.86 [38] | 1.29 [39] | 0.83 [33] | 0.75 [36] | 0.68 [37] | |
| Peff | cm/min | 0.00311 [40] | 0.012 [24] | / | / | 0.012 [33] | 0.0156 [34] | |
| ka | mL/min | / | / | 0.062 [41] | 0.0355 [32] | 0.029 b [42] | / | |
| CLtotal | mL/min | / | / | 3.62 [43] | / | / | / | |
| CLint,met,h | mL/min | 110.57 [25] | 188.3 [24] | 27.29 [43] | 52.4 [32] | 1365.14 [33] | 955.6 [44] | 17883 [34] |
| CLint,OCT1 | mL/min | 63.95 [25] | 200 [24] | / | / | / | / | |
| CLint,OCT2 | mL/min | 256.45 [25] | 539.8 [25] | / | / | / | / | |
| CLint,MATE | mL/min | 299.8 [25] | 532.2 [25] | / | / | / | / | |
| CLrenal | mL/min | 132.9 | 132.9 | 0.47 [45] | 77.86 [32] | / | / | |
| Ki,OCT1 | μM | / | 101 [12] | 4.46 [12] | 27.7 [12] | 0.27 [46] | 3.0 [47] | 9.62 [46] |
| Ki,OCT2 | μM | / | 2.97 [48] | 0.61 [48] | 19.8 [48] | 0.89 [46] | 5.7 [47] | 3.24 [46] |
| Ki,OCT3 | μM | / | 45.7 [49] | >100 [48] | 12.3 [48] | 17.4 [49] | 3.0 [47] | 3.6 [46] |
| Ki,MATE | μM | / | 0.65 [49] | 0.02 [48] | 0.51 [48] | 0.01 [49] | 4.60 [49] | / |
| Perpetrators (mg) | Drug (mg) | Ref. | Cmax (μg/mL) | Ratio | AUC0–t (μg·h/mL) | Ratio | ||
|---|---|---|---|---|---|---|---|---|
| Pre | Obs | Pre/Obs | Pre | Obs | Pre/Obs | |||
| Metformin (250) | [13] | 0.67 | 0.59 | 1.14 | 5.12 | 4.26 | 1.20 | |
| Cimetidine (400) | +cimetidine | 0.83 | 1.02 | 0.81 | 7.33 | 6.23 | 1.18 | |
| CmaxR & AUCR | 1.28 | 1.73 | 0.74 | 1.58 | 1.46 | 1.08 | ||
| Metformin (500) | [90] | 0.95 | 1.19 | 0.80 | 7.93 | 6.58 | 1.21 | |
| Cimetidine (400) | +cimetidine | 1.33 | 1.78 | 0.75 | 12.09 | 10.3 | 1.17 | |
| CmaxR & AUCR | 1.4 | 1.5 | 0.93 | 1.52 | 1.57 | 0.97 | ||
| Metformin (250) | [14] | 0.63 | 0.852 | 0.74 | 4.42 | 3.77 | 1.17 | |
| Pyrimethamine (50) | +pyrimethamine | 1.1 | 1.35 | 0.81 | 13.46 | 8.68 | 1.55 | |
| CmaxR & AUCR | 1.75 | 1.58 | 1.10 | 3.05 | 2.30 | 1.32 | ||
| Metformin (0.1) | [14] | 0.00089 | 0.00042 | 2.12 | 0.0029 | 0.0021 | 1.38 | |
| Pyrimethamine (50) | +pyrimethamine | 0.0012 | 0.0004 | 3.00 | 0.0066 | 0.0023 | 2.87 | |
| CmaxR & AUCR | 1.35 | 0.95 | 1.42 | 2.28 | 1.10 | 2.08 | ||
| Metformin (500) | [15] | 0.93 | 1.14 | 0.82 | 6.95 | 5.91 | 1.18 | |
| Pyrimethamine (50) | +pyrimethamine | 1.61 | 2.32 | 0.69 | 14.52 | 15.24 | 0.95 | |
| CmaxR & AUCR | 1.73 | 2.04 | 0.85 | 2.09 | 2.58 | 0.81 | ||
| Metformin (500) | [16] | 1.28 | 1.3 | 0.98 | 8.1 | 6.8 | 1.19 | |
| Trimethoprim (200) | +trimethoprim | 1.42 | 1.8 | 0.79 | 9.24 | 9.3 | 0.99 | |
| CmaxR & AUCR | 1.11 | 1.38 | 0.80 | 1.14 | 1.37 | 0.83 | ||
| Metformin (850) | [103] | 1.81 | 1.17 | 1.55 | 16.15 | 6.69 | 2.41 | |
| Trimethoprim (200) | +trimethoprim | 2.07 | 1.4 | 1.48 | 20.37 | 8.68 | 2.35 | |
| CmaxR & AUCR | 1.14 | 1.2 | 0.95 | 1.26 | 1.3 | 0.97 | ||
| Metformin (850) | [19] | 1.32 | 2.28 | 0.58 | 12.13 | 15.2 | 0.80 | |
| Ondansetron (8) | +ondansetron | 1.53 | 2.75 | 0.56 | 14.1 | 18.3 | 0.77 | |
| CmaxR & AUCR | 1.16 | 1.21 | 0.96 | 1.16 | 1.2 | 0.97 | ||
| Metformin (500) | [27] | 1.42 | 1.1 | 1.29 | 10.24 | 5.9 | 1.74 | |
| Rabeprazole (20) | +rabeprazole | 1.35 | 1.3 | 1.04 | 10.21 | 6.8 | 1.50 | |
| CmaxR & AUCR | 0.95 | 1.18 | 0.81 | 1 | 1.15 | 0.87 | ||
| Metformin (750) | [20] | 1.79 | 4.2 | 0.43 | 13.56 | 24.69 | 0.55 | |
| Rabeprazole (20) | +rabeprazole | 1.72 | 5 | 0.34 | 13.29 | 28.28 | 0.47 | |
| CmaxR & AUCR | 0.96 | 1.19 | 0.81 | 0.98 | 1.15 | 0.85 | ||
| Metformin (750) | [99] | 1.22 | 1.51 | 0.81 | 10.35 | 8.22 | 1.26 | |
| Verapamil (180) | +verapamil | 1.28 | 1.64 | 0.78 | 11.32 | 8.84 | 1.28 | |
| CmaxR & AUCR | 1.05 | 1.09 | 0.96 | 1.09 | 1.08 | 1.01 | ||
Publisher’s Note: MDPI stays neutral with regard to jurisdictional claims in published maps and institutional affiliations. |
© 2021 by the authors. Licensee MDPI, Basel, Switzerland. This article is an open access article distributed under the terms and conditions of the Creative Commons Attribution (CC BY) license (https://creativecommons.org/licenses/by/4.0/).
Share and Cite
Yang, Y.; Zhang, Z.; Li, P.; Kong, W.; Liu, X.; Liu, L. A Whole-Body Physiologically Based Pharmacokinetic Model Characterizing Interplay of OCTs and MATEs in Intestine, Liver and Kidney to Predict Drug-Drug Interactions of Metformin with Perpetrators. Pharmaceutics 2021, 13, 698. https://doi.org/10.3390/pharmaceutics13050698
Yang Y, Zhang Z, Li P, Kong W, Liu X, Liu L. A Whole-Body Physiologically Based Pharmacokinetic Model Characterizing Interplay of OCTs and MATEs in Intestine, Liver and Kidney to Predict Drug-Drug Interactions of Metformin with Perpetrators. Pharmaceutics. 2021; 13(5):698. https://doi.org/10.3390/pharmaceutics13050698
Chicago/Turabian StyleYang, Yiting, Zexin Zhang, Ping Li, Weimin Kong, Xiaodong Liu, and Li Liu. 2021. "A Whole-Body Physiologically Based Pharmacokinetic Model Characterizing Interplay of OCTs and MATEs in Intestine, Liver and Kidney to Predict Drug-Drug Interactions of Metformin with Perpetrators" Pharmaceutics 13, no. 5: 698. https://doi.org/10.3390/pharmaceutics13050698