1. Introduction
Clinically, the majority of drugs are orally administered [
1]. Prior to reaching the blood circulation system, the administered pharmaceutical agents have to pass through the intestinal barrier via passive diffusion, active uptake, and/or efflux transport processes [
2,
3,
4], as illustrated by Figure 10.2 of Proctor et al. [
2]. In passive diffusion, drug molecules can permeate the epithelial cell layers through the transcellular pathway, in which they penetrate through the cell membrane, or the paracellular pathway, in which they can cross the epithelial cell layer through the tight junction between cells [
5]. The significance of active transporters on intestinal absorption has been detailed elsewhere [
6]. Principally, active transport can be modulated by the efflux transporters of the ATP-binding cassette (ABC) family as well the influx transporters of the solute carrier (SLC) family [
6], of which the efflux transporters can pump the administrated drugs out of enterocytes, leading to the reduction of the accumulated concentration, whereas the influx can enhance the intestinal uptake, resulting in the increased drug accumulation [
7]. Of various active influx and efflux transporters, P-glycoprotein (P-gp), also termed multidrug resistance 1 protein (MDR1/encoded by
ABCB1 gene), breast cancer resistance protein (BCRP/
ABCG2), organic anion transporting polypeptide 2B1 (OATP2B1/
SLCO2B1), and peptide transporter 1 (PEPT1/
SLC15A1) play predominant roles in intestinal absorption [
8].
Passive diffusion depends on a number of physicochemical properties, whereas active transport relies on the characteristics of specific binding sites on the transport proteins [
9]. The uncharged and modest hydrophobic drugs such as testosterone [
10] can permeate through the membrane. Conversely, it is very difficult for highly hydrophobic molecules to get across cells, since they can be adhered to the membrane [
5]. On the other hand, hydrophilic drugs such as mannitol predominantly pass through the paracellular pathway [
10].
Of various drug absorption, distribution, metabolism, elimination, and toxicity (ADME/Tox) properties, drug absorption plays a pivotal role in drug discovery, since they substantially contribute to the earlier preclinical go/no-go decisions for the drug candidates [
10,
11] to achieve the “fail fast, fail early” paradigm [
12]. As such, numerous in vivo and in situ assays have been developed to evaluate the intestinal absorption [
13,
14]. For instance, the in situ single-pass intestinal perfusion (SPIP) model measures the appearance of the drug in plasma after intravenous and intraintestinal drug administration [
13,
15]. The drug is orally administrated or directly given into the intestine or stomach in some animal species in in vivo assay [
13,
14,
16].
In addition to in vivo and in situ assays, various in vitro assays have been devised, since they have more advantages such as low cost and time efficiency as compared with their in situ and in vivo counterparts [
15]. Of various in vitro assays to evaluate intestinal absorption, human colon carcinoma monolayer cells (Caco-2) [
3], parallel artificial membrane permeability (PAMPA) [
17,
18], and Madin–Darby canine kidney cells (MDCK) [
19] are most frequently used. In fact, a comprehensive drug absorption profile should include the Caco-2, MDCK, and PAMPA permeability data to explore drug solubility and bioavailability [
20]. Moreover, Caco-2, which can be adopted to evaluate the drug permeability through the cytoplasm (transcellular uptake) or between cells (paracellular uptake) and active transport [
6], has become the golden standard for predicting intestinal drug permeability and absorption because of its similarity in morphology and function with human enterocytes [
21,
22,
23]. The Caco-2 protocol has been clearly described in detail by Hubatsch et al. As compared with the biological membrane, the Caco-2 system still suffers from a range of disadvantages such as high technical complexity, the limitations related to the differences between cell monolayers and intestinal membrane structurally and functionally [
24], in addition to its long culture periods (21‒24 days) with the significantly extensive costs, contributing to the major concerns in practical applications [
21,
25].
The Caco-2 permeability is normally expressed by the apparent permeability coefficient (
Papp), in which the drug solution is added to the apical side, viz. the donor compartment, and the
Papp value in the basolateral side, viz. the receiver compartment, is measured [
23]
where
dQ/
dt is the linear appearance rate of mass in the receiver solution transported during sink conditions,
A is the membrane surface area, and
C0 is the initial concentration at the donor compartment [
26]. However, it is not uncommon to observe in vitro permeability variations among different from research groups, because the cultured cells can vary based on culture conditions, passage number, monolayer age, seeding density, and stage of differentiation [
27,
28], as exemplified by those compounds listed in Table 3 of Lee et al. [
29]. Furthermore, Yamashita et al. have found that the different pH values of apical medium and the different solvents can produce different drug absorption values [
30]. For instance, the
Papp values of alprenolol are (6.06 ± 0.18) × 10
‒6 cm/s and (30.0 ± 1.8) × 10
‒6 cm/s at pH 6.0 and pH 7.4, respectively. More examples of
Papp variations at different pH values can be found in Table 1 of Yamashita et al. [
30].
In silico technologies have become an essential component in drug discovery and development according to the fact that they can provide guidance in the early stages in the drug discovery process such as the activity classification (high/moderate/poor) or quantitative predictions [
31,
32]. As such, a great number of in silico models have been established to predict the ADME/Tox properties [
33]. The relationship between biological activity and chemical characteristics can be established by quantitative structure–activity or structure–property relationships (QSAR and QSPR) [
34]. Numerous QSAR models have been generated to predict Caco-2 permeability based on a variety of physicochemical and physiological descriptors [
35,
36,
37,
38,
39,
40,
41,
42,
43,
44,
45,
46,
47,
48,
49,
50,
51]. Nevertheless, the difficulties in developing sound in silico models to predict the intestinal permeability still remain unanswered mainly due to the fact that Caco-2 permeability is a dramatically perplexing process that can take place through numerous non-linear routes (vide supra).
More specifically, the ABC transporters, which are efflux transporters, can reduce the drug absorption, whereas the SLC transporters, which are influx transporters, can enhance the drug uptake, leading to the decrease and/or increase of drug absorption, respectively. In fact, such controversy can establish a paramount barrier in model development. For instance, the number of aromatic rings (
nAr) can enhance the compound hydrophobicity [
52] and facilitate the passive diffusion consequently. Conversely,
nAr is also an important feature for P-gp substrate recognition and modulates the compound efflux correspondingly [
53]. Thus,
nAr can simultaneously affect the active efflux and passive diffusion.
It is exceedingly difficult, if not nearly impossible, to derive a robust in silico model, which can properly render the complex relationships between the selected descriptors and Caco-2 permeability. However, the hierarchical support vector regression (HSVR) scheme, which is an innovative machine learning-based scheme initially developed by Leong et al. [
54], can properly address the complicated and varied dependencies of descriptors that, in turn, can be greatly contributed to its advantageous features of both a local model and a global model, namely wider coverage of applicability domain (AD) and a higher capability of prediction, respectively. When comparing with most theoretical models, which are vulnerable to the outliers that represent mathematic extrapolations, HSVR can still show consistent performance, as demonstrated elsewhere [
1,
54,
55,
56,
57]. Herein, the objective of this study was to develop an in silico model based on the HSVR scheme to predict Caco-2 permeability in conjunction with previously published PAMPA permeability, intestinal absorption, and MDCK efflux in silico models [
1,
55,
57] to facilitate drug discovery and development, since medicinal chemists can employ these models to predict the drug absorption of (virtual) hit compounds as well as drug metabolism and pharmacokinetics (DM/PK) scientists can adopt these models to prioritize the lead compounds.
4. Discussion
Caco-2 has been commonly adopted to predict the intestinal permeability in the process of drug discovery because of its morphological and functional similarity with human enterocytes [
105]. The mechanism of Caco-2 permeation is rather complex, since it can take place through passive diffusion, which can go through the paracellular and transcellular routes and active transport. The passive diffusion is predominately governed by the concentration gradient, and most hydrophilic drugs prefer to penetrate between cells in a paracellular fashion, whereas hydrophobic drugs are inclined to get across the cells via the transcellular route. Drugs that can permeate the Caco-2 cells by the active transport can interact with the influx and/or efflux transporters expressed on the cell surface [
106]. As such, Caco-2 permeability is affected by some physicochemical and physiological properties [
106].
Hydrophobicity or lipophilicity plays an important role in passive diffusion through membranes as well as the drug–receptor interactions [
17,
107,
108]. In addition, hydrophobicity, which can represent by the
n-octanol‒water partition coefficient,
viz. log
P, is also an important factor affecting the interaction between the molecules and the target protein, since more lipophilic molecules tend to have stronger interactions with both target protein and biological membrane. Therefore, the very lipophilic molecules have poor oral absorption from the stomach [
107,
109]. Polar and hydrophobic drug must penetrate through the Caco-2 cell membrane [
17,
110]. In addition, it has been observed that log
P, hydrogen bond propensity, weight, and volume are closely related with
Papp [
43]. As such, log
P was adopted in this study (
Table 1), which is consistent with the fact that numerous published in silico models to predict intestinal absorption, PAMPA permeability [
1,
111], and Caco-2 permeability also have employed this descriptor [
40,
112,
113,
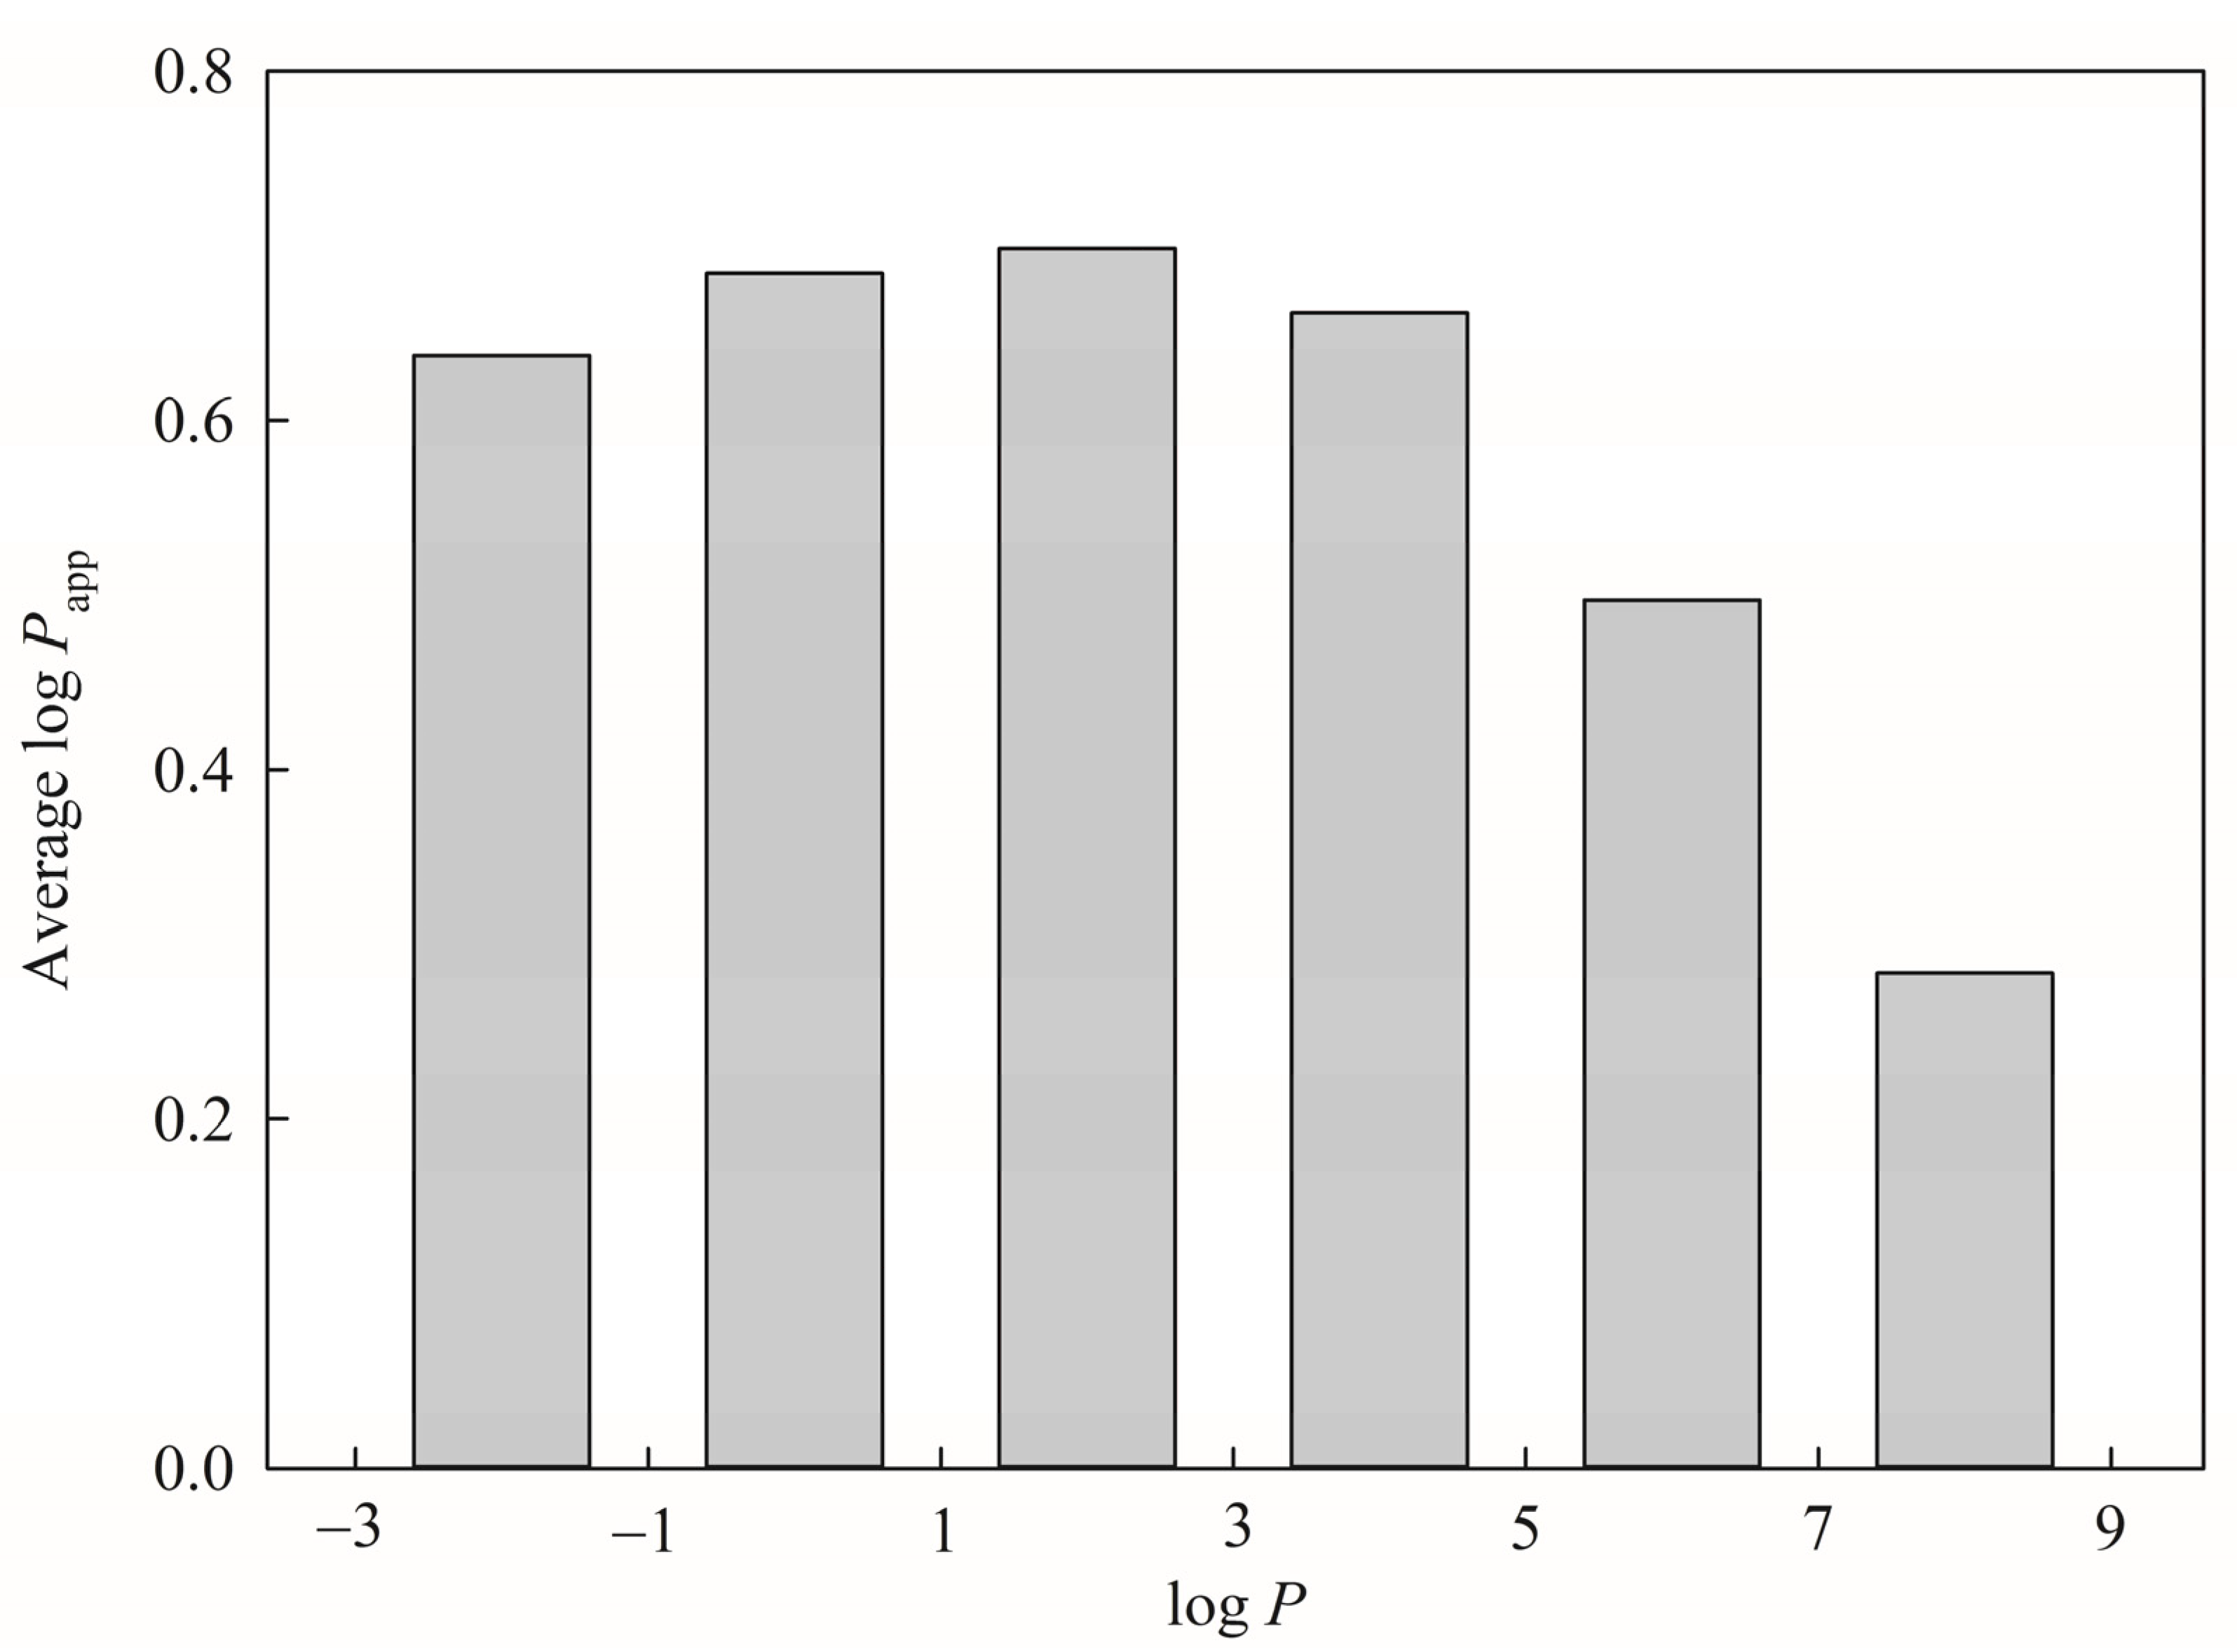
114]. It can be observed from
Figure 8, which displays the average log
Papp for each histogram bin of log
P for all molecules included in this investigation, that log
Papp increased with log
P value initially and then decreased afterward, leading to a seemingly bilinear relationship between log
Papp and log
P. This perplexing dependency can be realized by the fact that the more hydrophobic solutes can easier approach the lipid bilayer to penetrate the membrane. The opposite relationship between hydrophobicity and permeability will be resulted when the solutes are too hydrophobic due to stronger attractions between solutes and the membrane as well as stronger repulsive forces from the solvent molecules upon the entrance to the solvent environment that can be illustrated by the PAMPA permeability [
1,
115,
116]. Complexity can be even profound when taking into account the fact that P-gp and BCRP, which are efflux transporters in Caco-2 (vide supra), can interact with substrates by hydrophobicity [
117], subsequently leading to a low correlation between log
Papp and log
P (
r = 0.15).
It has been observed that the number of aromatic rings (
nAr) has a positive correlation with log
P with an
r value of 0.67 [
118], suggesting that a predictive model can be over-trained once both log
P and
nAr are adopted simultaneously. However, this issue was not concerned in this study, since only SVR C adopted this descriptor, whereas SVR A and SVR B included log
P (
Table 1). In addition, the aromatic ring is a non-polar group, which can enhance the hydrophobicity [
52] and increase the passive diffusion [
119,
120]. In addition, aromatic ring moieties have been implicated in P-gp substrate recognition and efflux modulation [
53], leading to the fact that
nAr can be an important factor in P-gp modulation action [
121] and BCRP‒substrate interactions [
122]. As such,
nAr plays a complex role in both passive diffusion and active transport in Caco-2 permeability.
It has been recognized that both PSA and
µ are associated with passive diffusion [
37,
123,
124,
125]. In addition, these descriptors have been adopted by published in silico Caco-2 permeability models [
37,
45,
46,
47,
48,
49,
126,
127,
128]. It has been reported in the PAMPA permeability study that larger PSA,
µ, and polarity can enhance the solute‒solute and solute‒solvent interactions, which, in turn, require more desolvation energy when the solutes penetrate through the lipophilic membrane to the donor compartment [
123,
129,
130,
131,
132], and conversely decrease the passive diffusion [
1], consequently, making permeability less favorable. Therefore, it has been shown that PSA has a negative impact in the permeation rate [
133,
134]. In addition, Joung et al. have indicated that PSA shows an important role in distinguishing the P-gp substrate from the non-substrates [
135]. Accordingly, PSA and
µ were adopted in this study due to their pivotal roles in Caco-2 permeability.
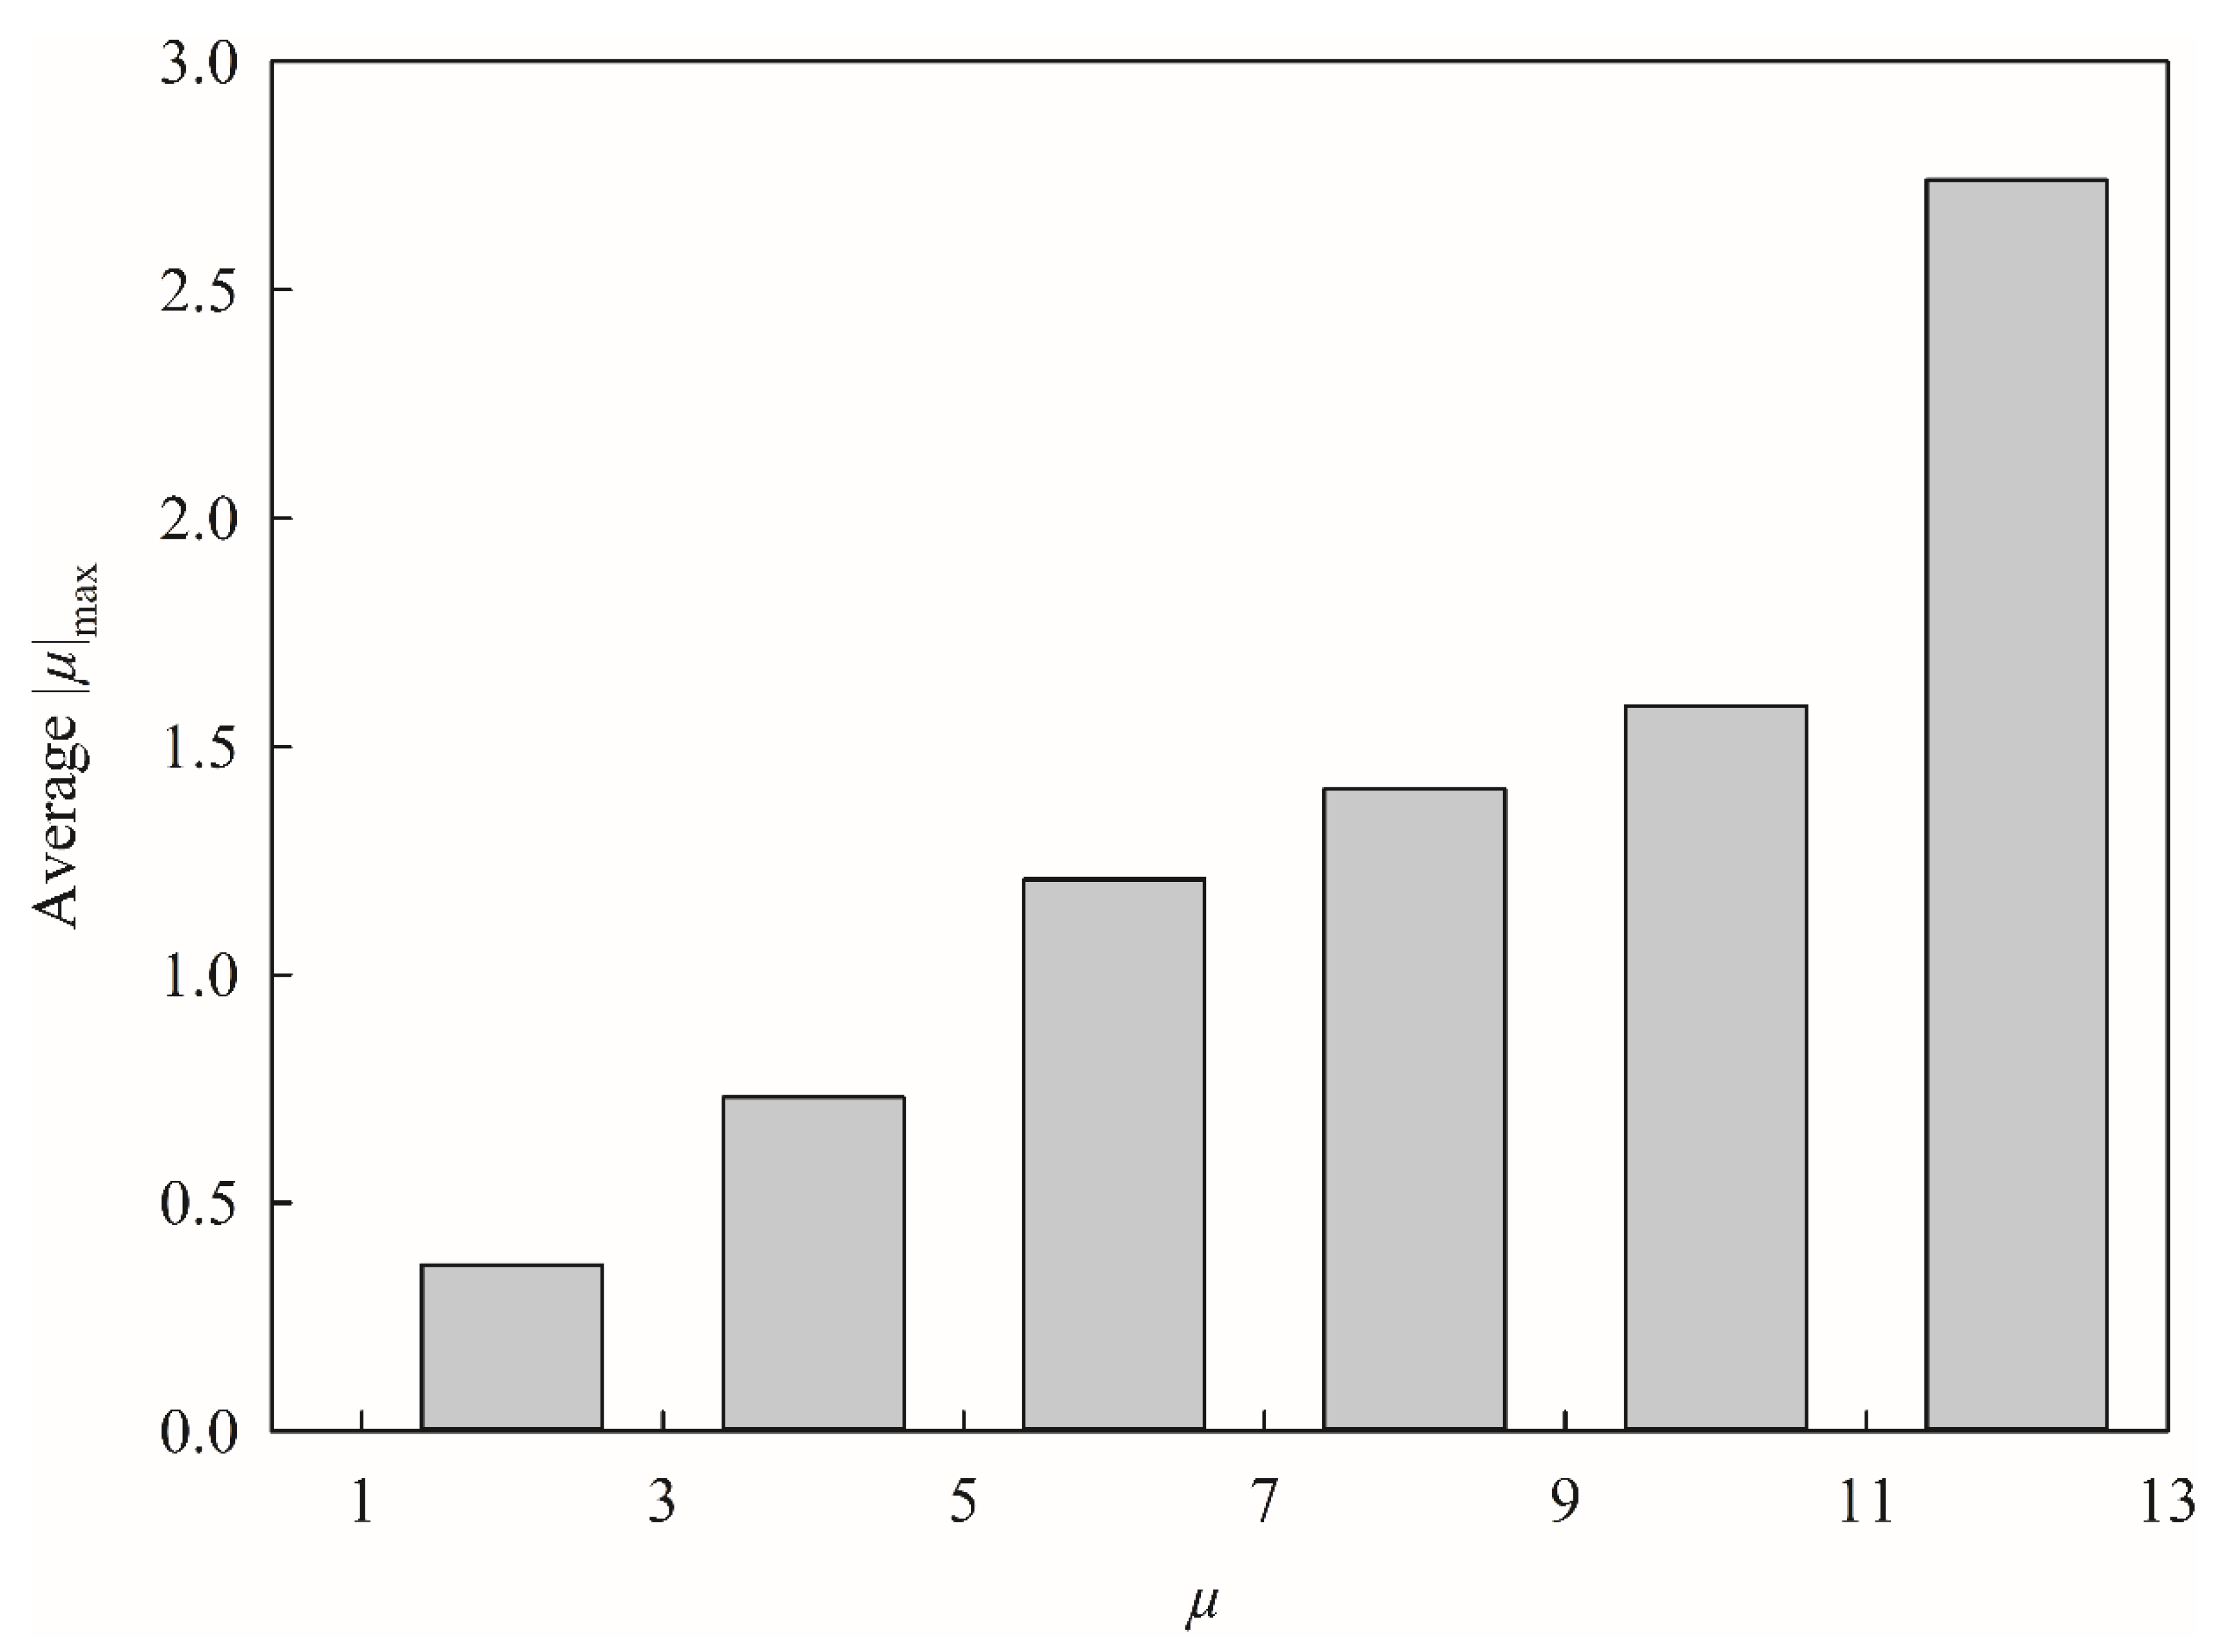
It is seemingly unusual to include the descriptor |
µ|
max, which is the absolute maximum component of the molecular dipole, in this study, since it has never been employed by any published model before. This inconsistency actually can be manifested by
Figure 9, which displays the average |
µ|
max for each histogram bin of
µ, that the larger
µ, the larger |
µ|
max, suggesting that they were positively correlated with each other. In addition,
µ was recruited by SVR A and SVR C, whereas |
µ|
max was enlisted by SVR B only, suggesting that it is less likely to produce an over-trained HSVR, since no single model adopted both two descriptors simultaneously. More importantly, the empirical observation has revealed that HSVR including these selections executed better than the others (data not shown) plausibly because of the descriptor‒descriptor interaction [
1]. Any other traditional linear or machine learning-based QSAR schemes, conversely, cannot properly render such contradictory descriptor selections.
It has been reported that the molecular size of the solute molecule is of critical importance in the diffusivity of the biological membrane [
37,
125,
136], and the intestinal absorption can decrease with the increase of molecular size [
137]. Furthermore, the molecular size also affects passive diffusion through membranes [
138,
139] and active transport through the P-gp‒substrate interactions [
121,
138]. Molecular size can be represented by a number of descriptors such α,
nRing,
Vm, and
nrot [
140,
141,
142], which were adopted in the investigation and negatively associated with log
Papp (
Table 1). Conversely, Fujiwara et al. adopted the descriptor molecule weight (MW) to develop a theoretical Caco-2 permeability model [
37], whereas MW was not included in this study. This discrepancy can be realized by the fact that α was highly correlated with MW with an
r value of 0.98 for all molecules enlisted in this study, suggesting that it is plausible to replace MW by α in order not to produce an over-trained model. In addition, it has been observed that α is positively correlated to log
P [
143] and is highly associated with absorption [
50].
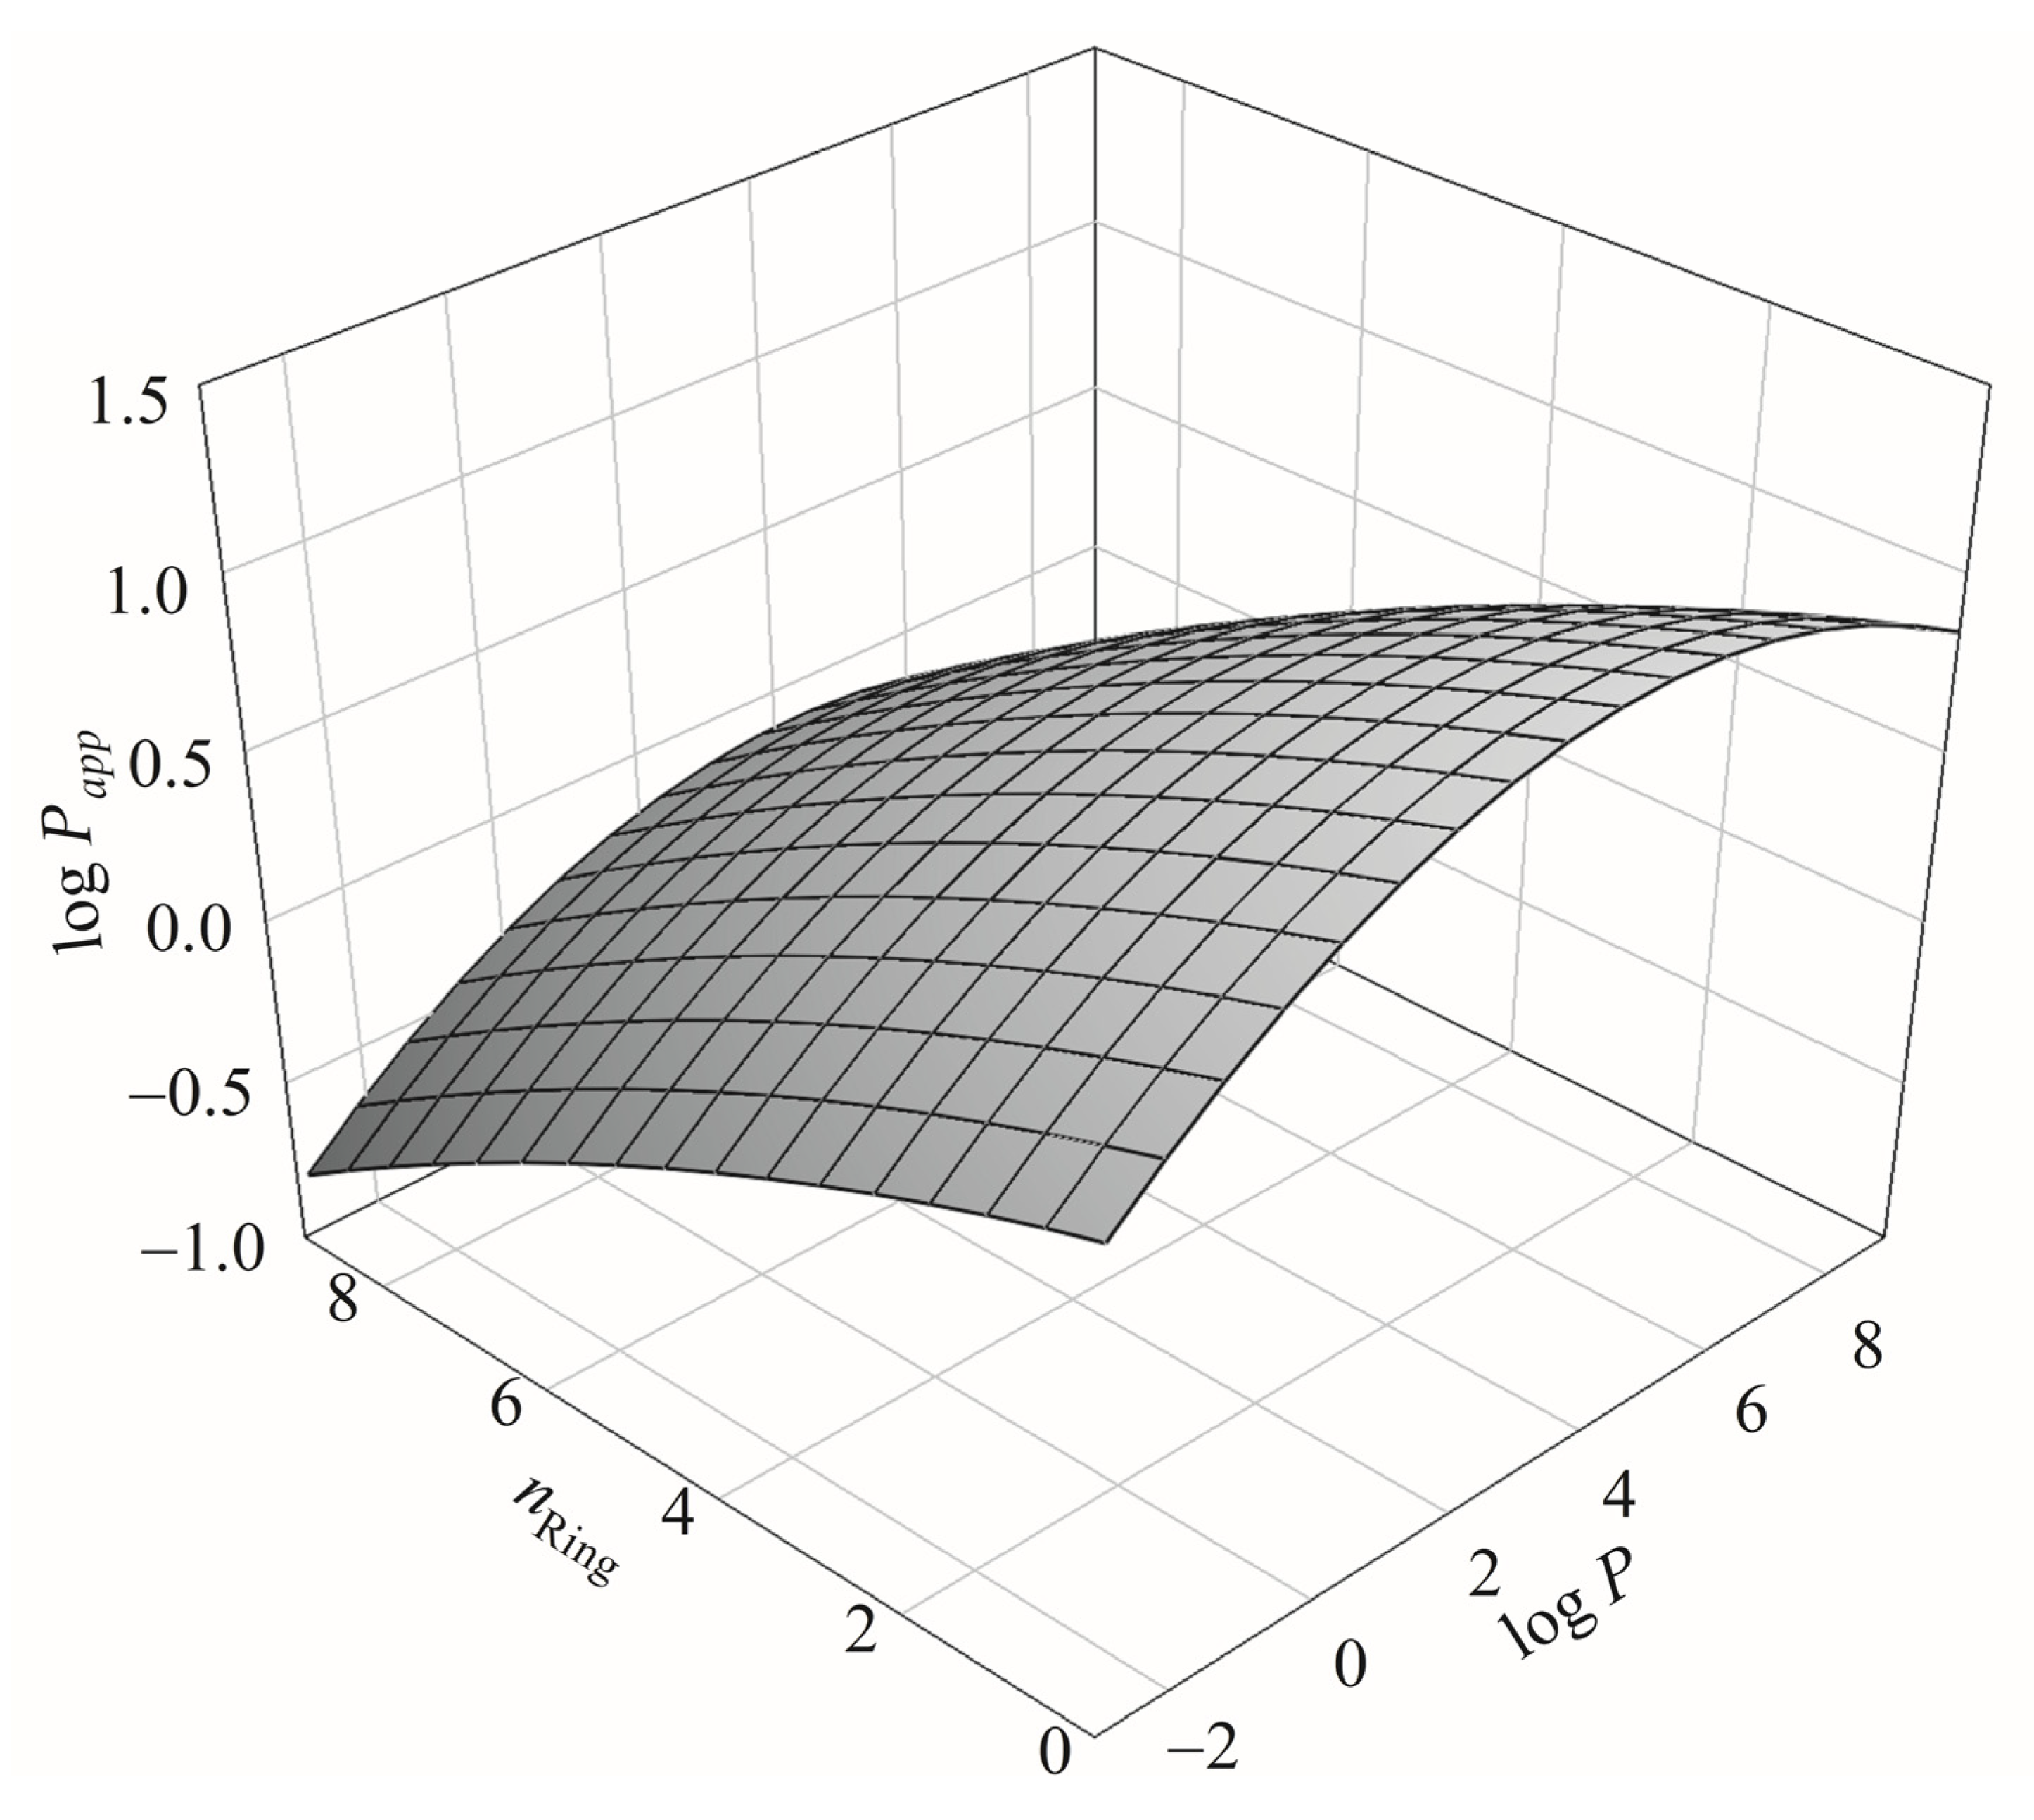
The descriptor
nRing, which is reportedly related to molecular size [
136,
141], has never been adopted by any published Caco-2 permeability predictive model and yet was selected by SVR C (
Table 1). This disagreement can be recognized by the fact that
nRing was greatly correlated with α with an
r value of 0.78 for all molecules recruited in this study. As such, it is plausible to expect that both
nRing and α play similar roles in Caco-2 permeability. The relationship among log
Papp,
nRing, and log
P can be further perplexing as illustrated by
Figure 10, which shows the 3D plot of log
Papp,
nRing, and log
P. The relationship between
nRing and log
P has been detailed by Pham-The et al. [
125].
It has been observed that
Vm plays an important role in passive absorption [
9,
144,
145] and it is adopted by a published Caco-2 permeability model [
146] as well as in this study. It has been observed in the rat that fewer rotatable bonds, viz. smaller
nrot, can lead to better oral bioavailability, and
nrot can also exert a positive effect on the permeation rate [
133,
143], since more rigid molecules will have smaller
nrot values that, in turn, can enhance permeability [
125]. Furthermore,
nrot is of importance in intestinal absorption [
147], since increased
nrot can reduce the permeability [
133]. Furthermore, a number of published membrane permeability models have also employed the descriptor CSA, which is another feature associated with molecular size and also plays a pivotal role in membrane permeability [
70,
71]. However,
nrot was greatly associated with CSA with an
r value of 0.80 for all molecules enrolled in this investigation, suggesting that using
nrot in lieu of CSA without producing the over-trained model is plausible. Li et al. also have found that
nrot is another feature to discriminate P-gp substrates from non-substrates [
148]. As such, it is of necessity to recruit
nrot in model development to properly render Caco-2 permeability as suggested [
71,
72].
Hydrogen bonding potential, which can be expressed by HBD and HBA, is another important factor in determining the solute–solvent interactions [
37], and it is the main contributor for the passive diffusion [
143]. It has been observed that Caco-2 permeability is a function of HBD and/or HBA, since more permeable solutes tend to have smaller HBD and/or HBA [
130,
131,
149]. Between HBD and HBA, HBD seemingly shows a more profound effect on Caco-2 permeability as compared with HBA [
150] as manifested by the fact that several published in silico models have selected HBD to predict Caco-2 permeability instead of HBA [
35,
42]. Mechanistically, HBD is one of the features associated with P-gp‒substrate interactions [
148,
151]. In addition to efflux transport, HDB is one of the features linked to substrate binding with OATP2B1 [
7] as well as PepT1 [
152]. Thus, it is of necessity to include in Caco-2 predictive models to take into consideration the passive diffusion as well as the active influx/efflux transport.
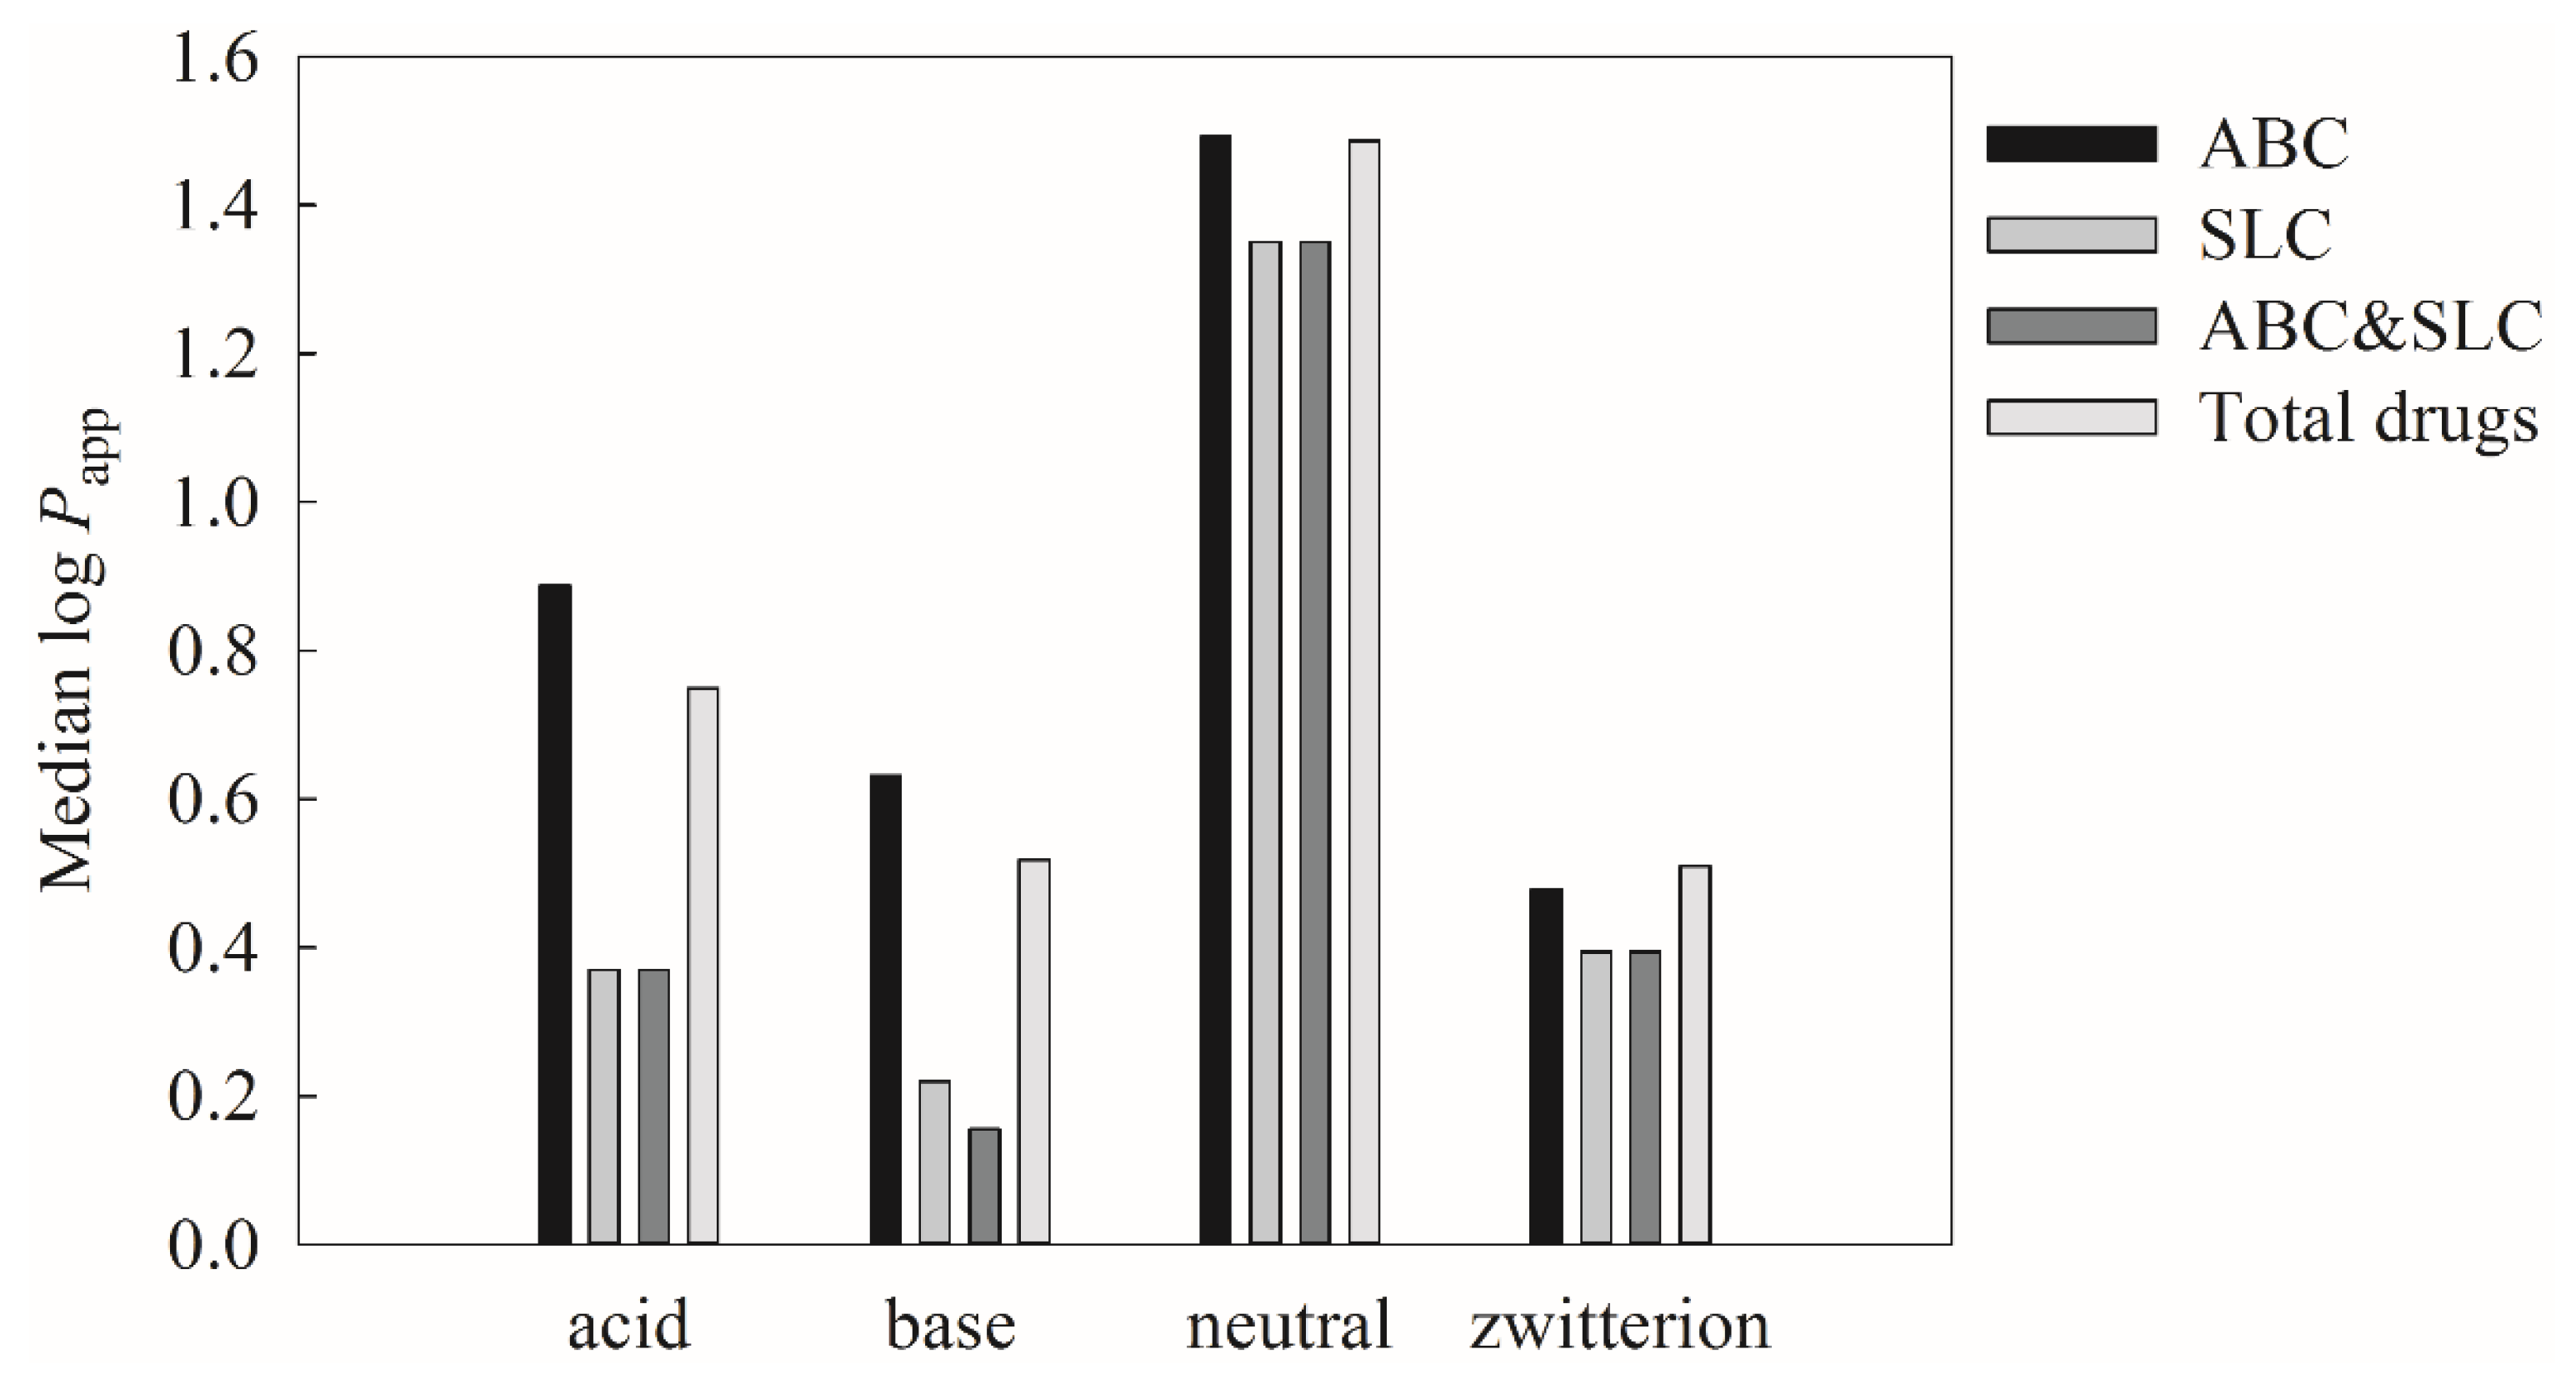
The descriptor p
Ka(Max) was selected in this study due to the fact that higher p
Ka(Max) can lead to the lower ionized form of drugs in the donor compartment, which, in turn, can increase the penetration through hydrophobic membrane [
153]. Furthermore, it has been recognized that neutral compounds can have higher membrane permeability than the other ion classes [
154]. Accordingly, all molecules included in this investigation were categorized into different ion classes based on their p
Ka values. In addition, ABC and/or SLC substrates were also identified based on the drug information retrieved from DrugBank to understand if the dependence of ion class can be varied by their ion classes. It can be found from
Figure 11, which displays the histograms of median log
Papp versus all molecules, ABC substrates, SLC substrates, as well as ABC and SLC substrates for four different ion classes, that the median log
Papp values of neutral compounds are substantially larger than the others, suggesting that neutral compounds exhibit higher Caco-2 permeability regardless of active transporter substrate classes, viz. influx transporter or efflux transporter. This observation actually is very similar to the PAMPA permeability, since the ionized compounds will demand larger desolvation energies, which, in turn, can hinder their penetration [
134].
Initially, numerous efforts were made in attempting to build assorted 2-QSAR models by employing the partial least square (PLS) scheme, and yet no productive models were produced (data not shown) [
1]. This challenge can be realized by the fact that the correlations between the designated descriptors and log
Papp for all molecules included in this investigation were small, and the largest absolute maximum
r was only 0.56 between PSA and log
Papp (
Table 1), signifying the high non-linearity between them. More significantly, the substantial difference in 2-QSAR development between the passive diffusion, viz. the PAMPA system, and Caco-2 permeability can be greatly attributed to the complex active (influx and efflux) transport. Thus, it is extremely difficult, if not absolutely impossible, to derive a linear Cacao-2 permeability QSAR model. Conversely, the accurate and predictive HSVR model can properly render such non-linear dependence of log
Papp on descriptors.


