
Natural Carbon Nanodots: Toxicity Assessment and Theranostic Biological Application

 , , and
Abstract
:1. Introduction
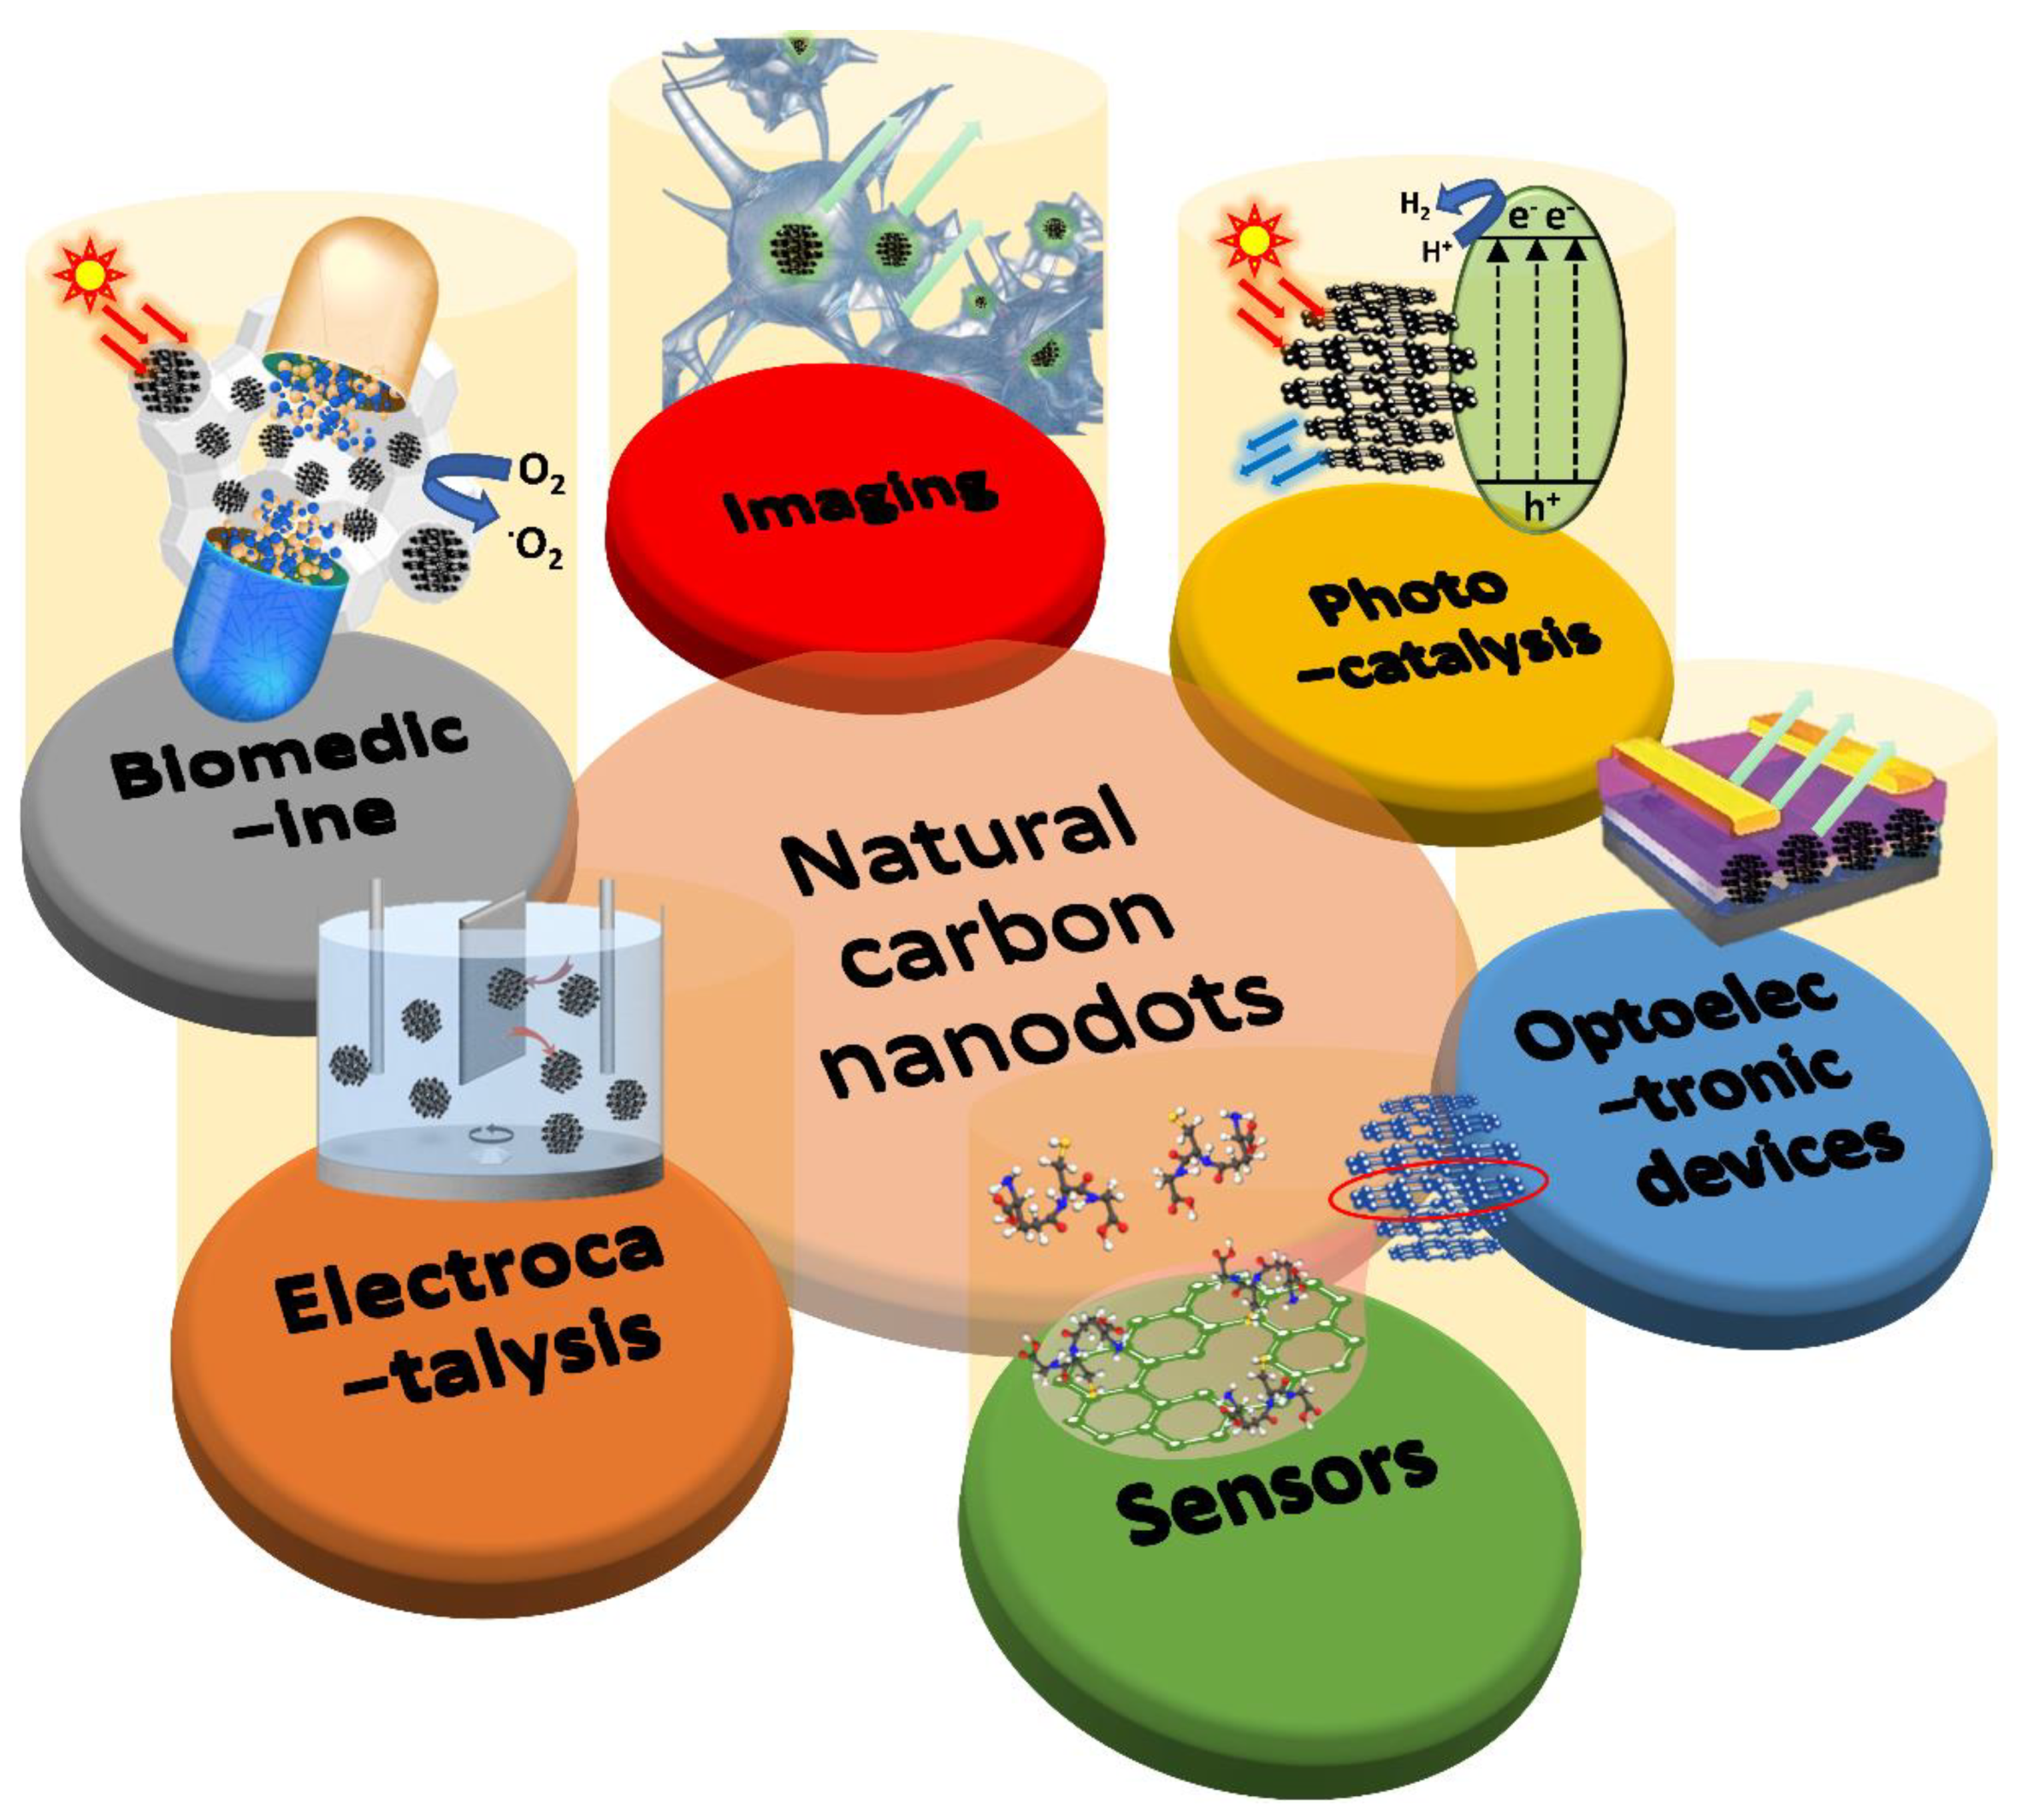
2. Natural Carbon Nanodots
- Imaging: multicolor fluorescent images of mammalian cells, plant cells, and micro-organisms, and imaging in mice;
- Photocatalysis: the degradation of organic molecules, the reduction in CO2, and water splitting;
- Optoelectronic devices: LEDs and solar cells (sensitizer/co-sensitizer, transport layer, electrolyte, and/or co-catalyst for counter electrode);
- Sensors: food quality and safety, drug analysis, environmental pollution determination, immunoassay, and other fields, such as detecting heavy metal ions, anions, pesticides, molecules, small organic molecules, and/or nucleic acids;
- Electrocatalysis: mainly used in oxidation-reduction reactions, oxygen evolution reactions, hydrogen evolution reactions, and reduction reactions for carbon dioxide, and dual-function catalysts;
- Biomedicine: photodynamic therapy, photosensitizers for cancer cell destruction, radiotherapy, the tracing and delivery of drugs or genes, drug release, and anticancer drugs.
3. Toxicity Evaluation of Natural Carbon Nanodots

| Material | Sources | Concentration | QY (%) | Cells or Animal Models | Toxicity | Ref. |
|---|---|---|---|---|---|---|
| Carbon quantum dots | Medicinal mulberry leaves | 500 ug/mL | 9.7 | Human normal hepatic stellate cell line LX-2 cells and human HCC cell line HepG2 cells | Almost non-cytotoxic | [133] |
| Carbon dots | Mango peel | 500 ug/L | 8.5 | A549 cells | Remained above 90% Low toxicity | [134] |
| Nitrogen-doped carbon quantum dots | Watermelon juice | 300 ug/mL | 10.6 | HepG2 cells | Remained 90% Low cytotoxicity | [135] |
| N-doped carbon quantum dots | Bio-waste lignin | 100 mg/mL | 8.1 | Mouse macrophage cells | Remained 96.8% Low toxicity | [136] |
| Carbon dots | Roast duck | 1 mg/mL | 38.05 | PC12 cells and C. elegans | Remained 91.19% Low toxicity | [122] |
| Nitrogen-doped carbon dots | P. acidus fruit juice | 200 ug/mL | 12.5 | Cells and C. elegans | Remained 93% Low cytotoxicity | [137] |
| Carbon quantum dots | Salvia hispanica L. seeds | 250 ug/mL | 17.8 | HEK293 cell line | Remained 91.7% Low toxicity | [138] |
| Carbon dots | Wheat straw | 0.8 mg/mL | 7.5 | HeLa cells | Negligible cytotoxicity | [139] |
| Carbon dots | Malus floribunda fruit | 200 ug/mL | 19 | Cells and C. elegans | Remained 93% and low toxicity | [140] |
| Carbon quantum dots | Banana peel waste | 200 ug/mL | 20 | C. elegans | Low toxicity | [141] |
| Nitrogen and sulfur dual-doped carbon quantum dots | Fungus fibers | 400 ug/mL | 28.11 | HepG2 cells | Remained over 95% Low cytotoxicity | [142] |
| Carbon dots | Sweet lemon peel | 500 ug/mL | n/a | MDA-MB231 cells | Remained above 75% Low cytotoxicity | [143] |
| Carbon dots | Lychee waste | 1.2 mg/mL | 23.5 | Skin melanoma cells | Remained above 89% Low cytotoxicity | [144] |
| Nitrogen-doped carbon quantum dots | Citrus lemon | 2 mg/mL | 31 | Human breast adenocarcinoma cells | Remained above 88% low cytotoxicity, | [145] |
| Carbon dots | Daucus carota subsp. sativus roots | 1 mg/mL | 7.6 | MCF-7 cells | Remained above 95% Low toxicity | [146] |
| Carbon nanodots | Custard apple peel waste biomass | 100 ug/mL | n/a | HeLa and L929 cells | Remained above 85% Low toxicity | [147] |
| Carbon quantum dots | Pineapple peel | 1 mg/mL | 42 | HeLa and MCF-7 cells | Remained 84% Low toxicity | [148] |
| N-carbon dots | Jackfruit seeds | 2 mg/mL | 17.91 | A549 cells | Remained 96% and less toxic | [149] |
4. Theranostic Application of Natural Carbon Nanodots
4.1. Bioimaging
4.2. Sensors
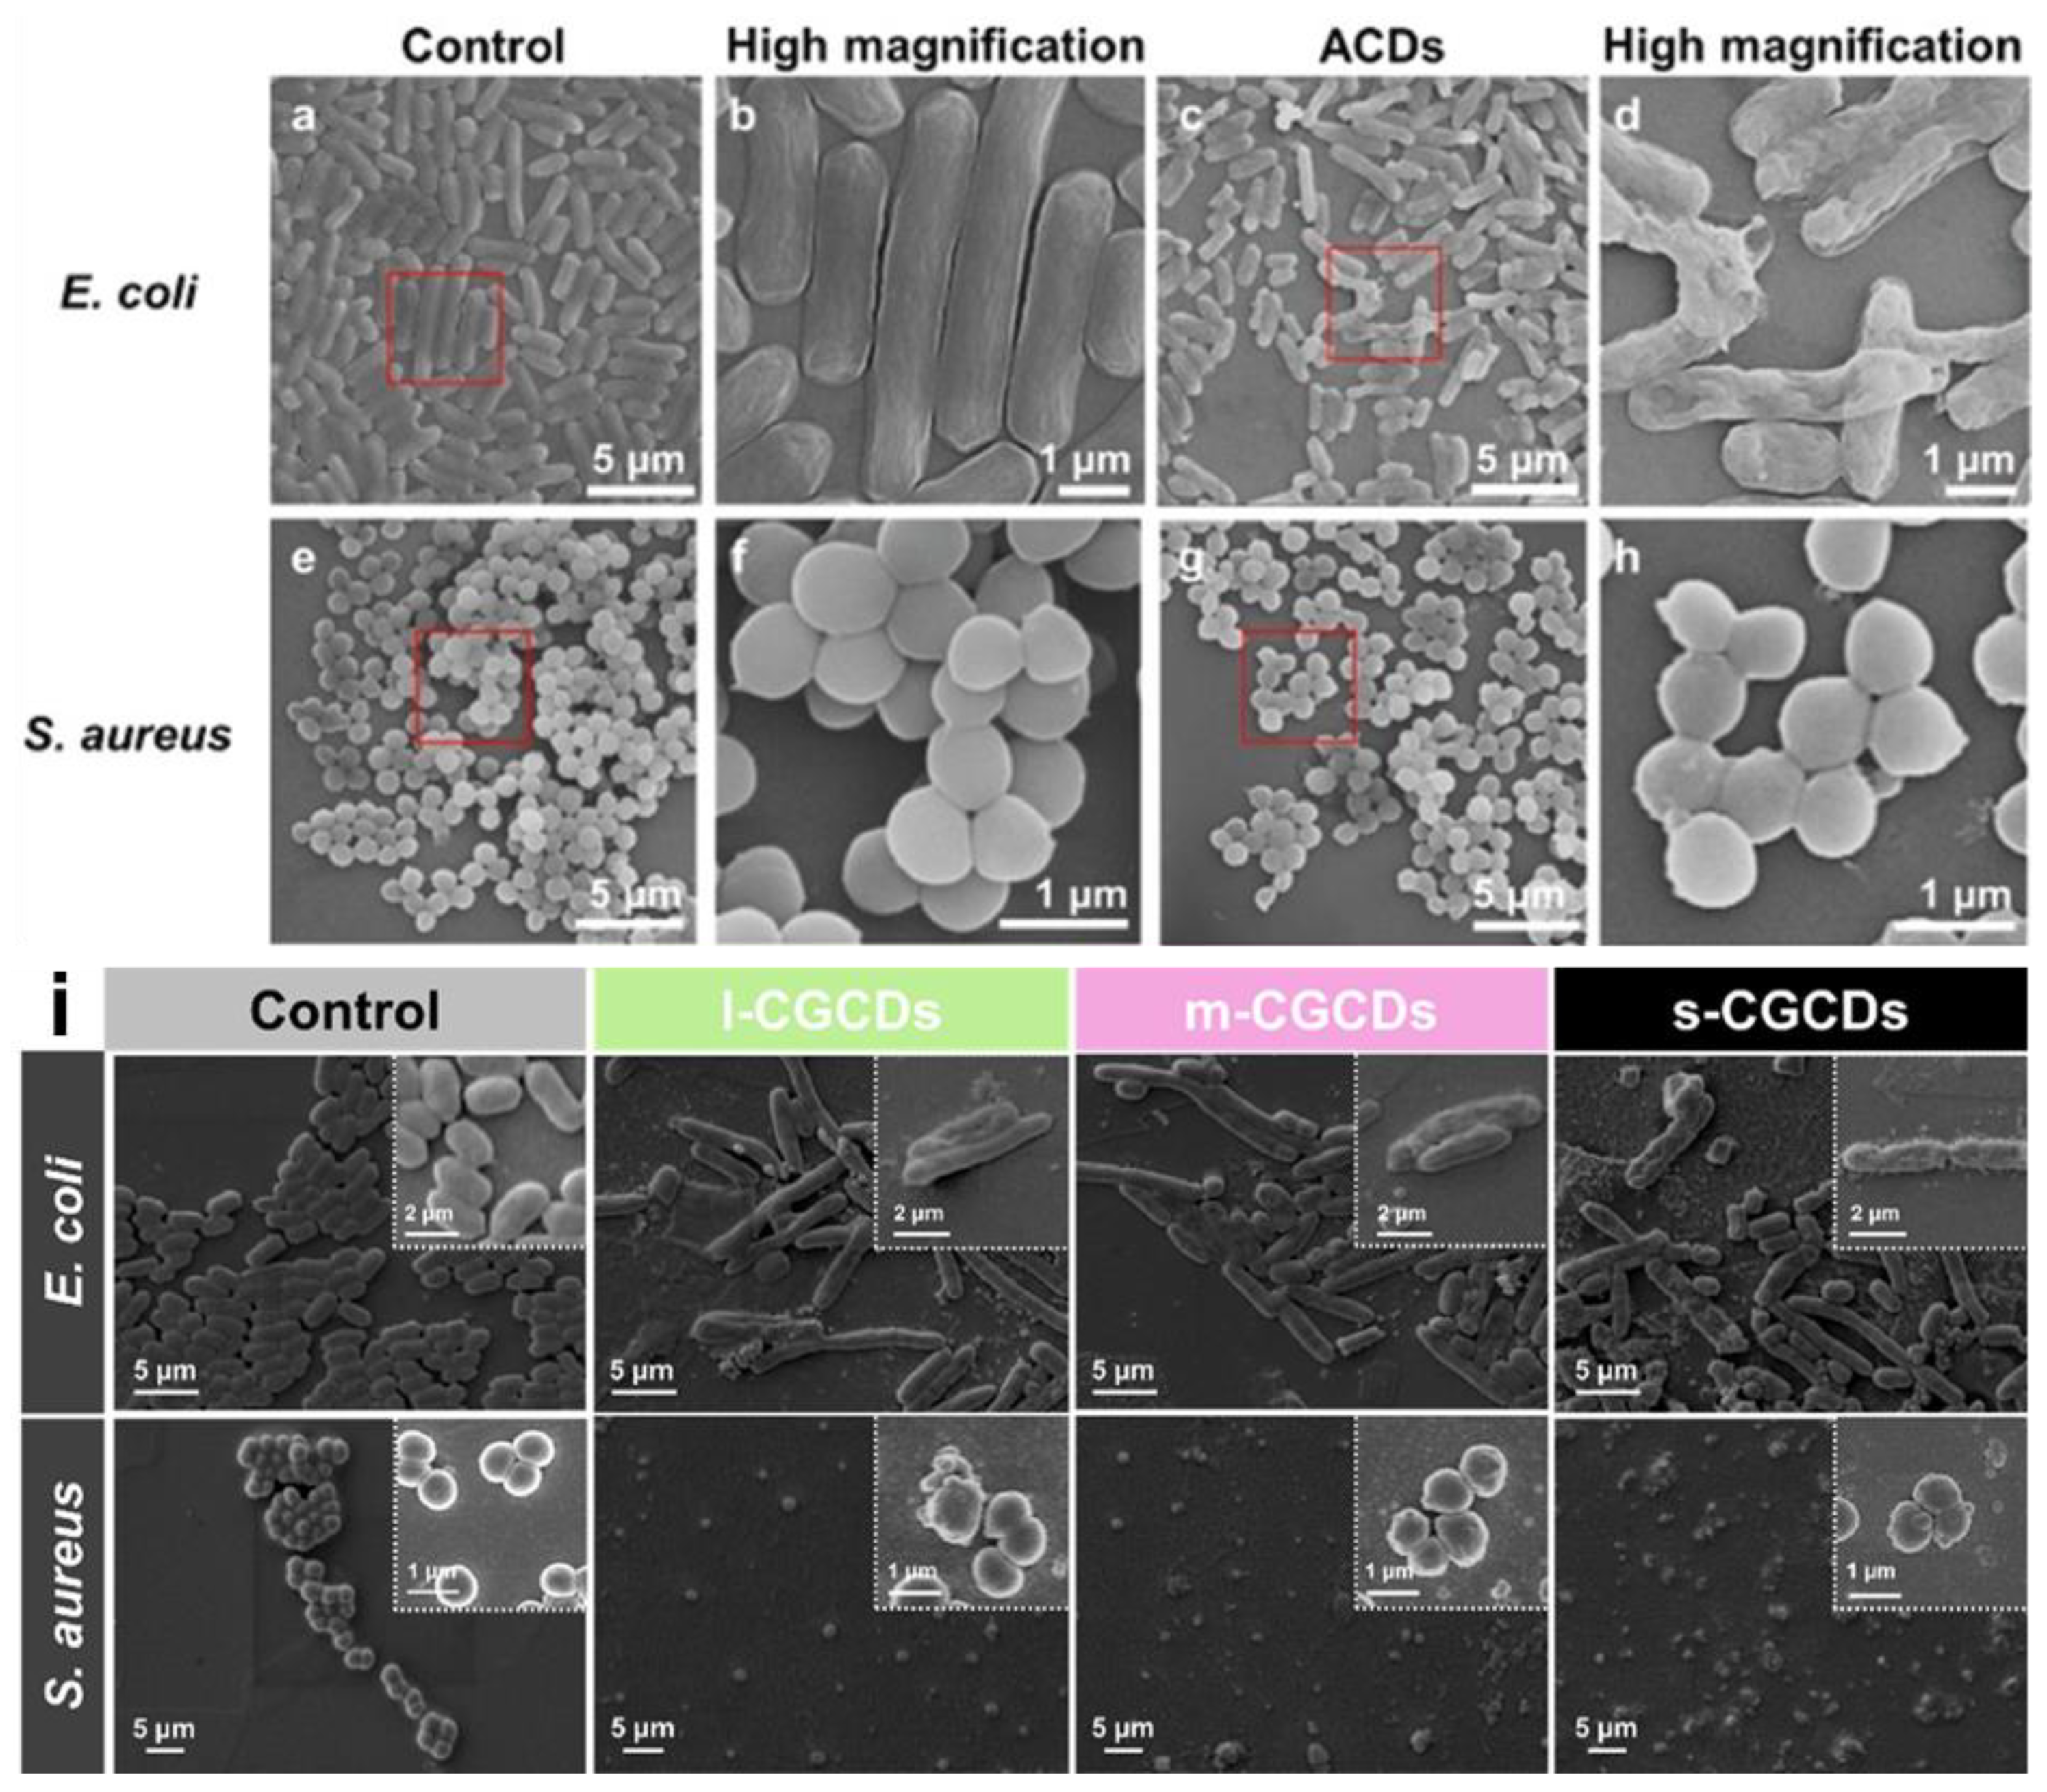
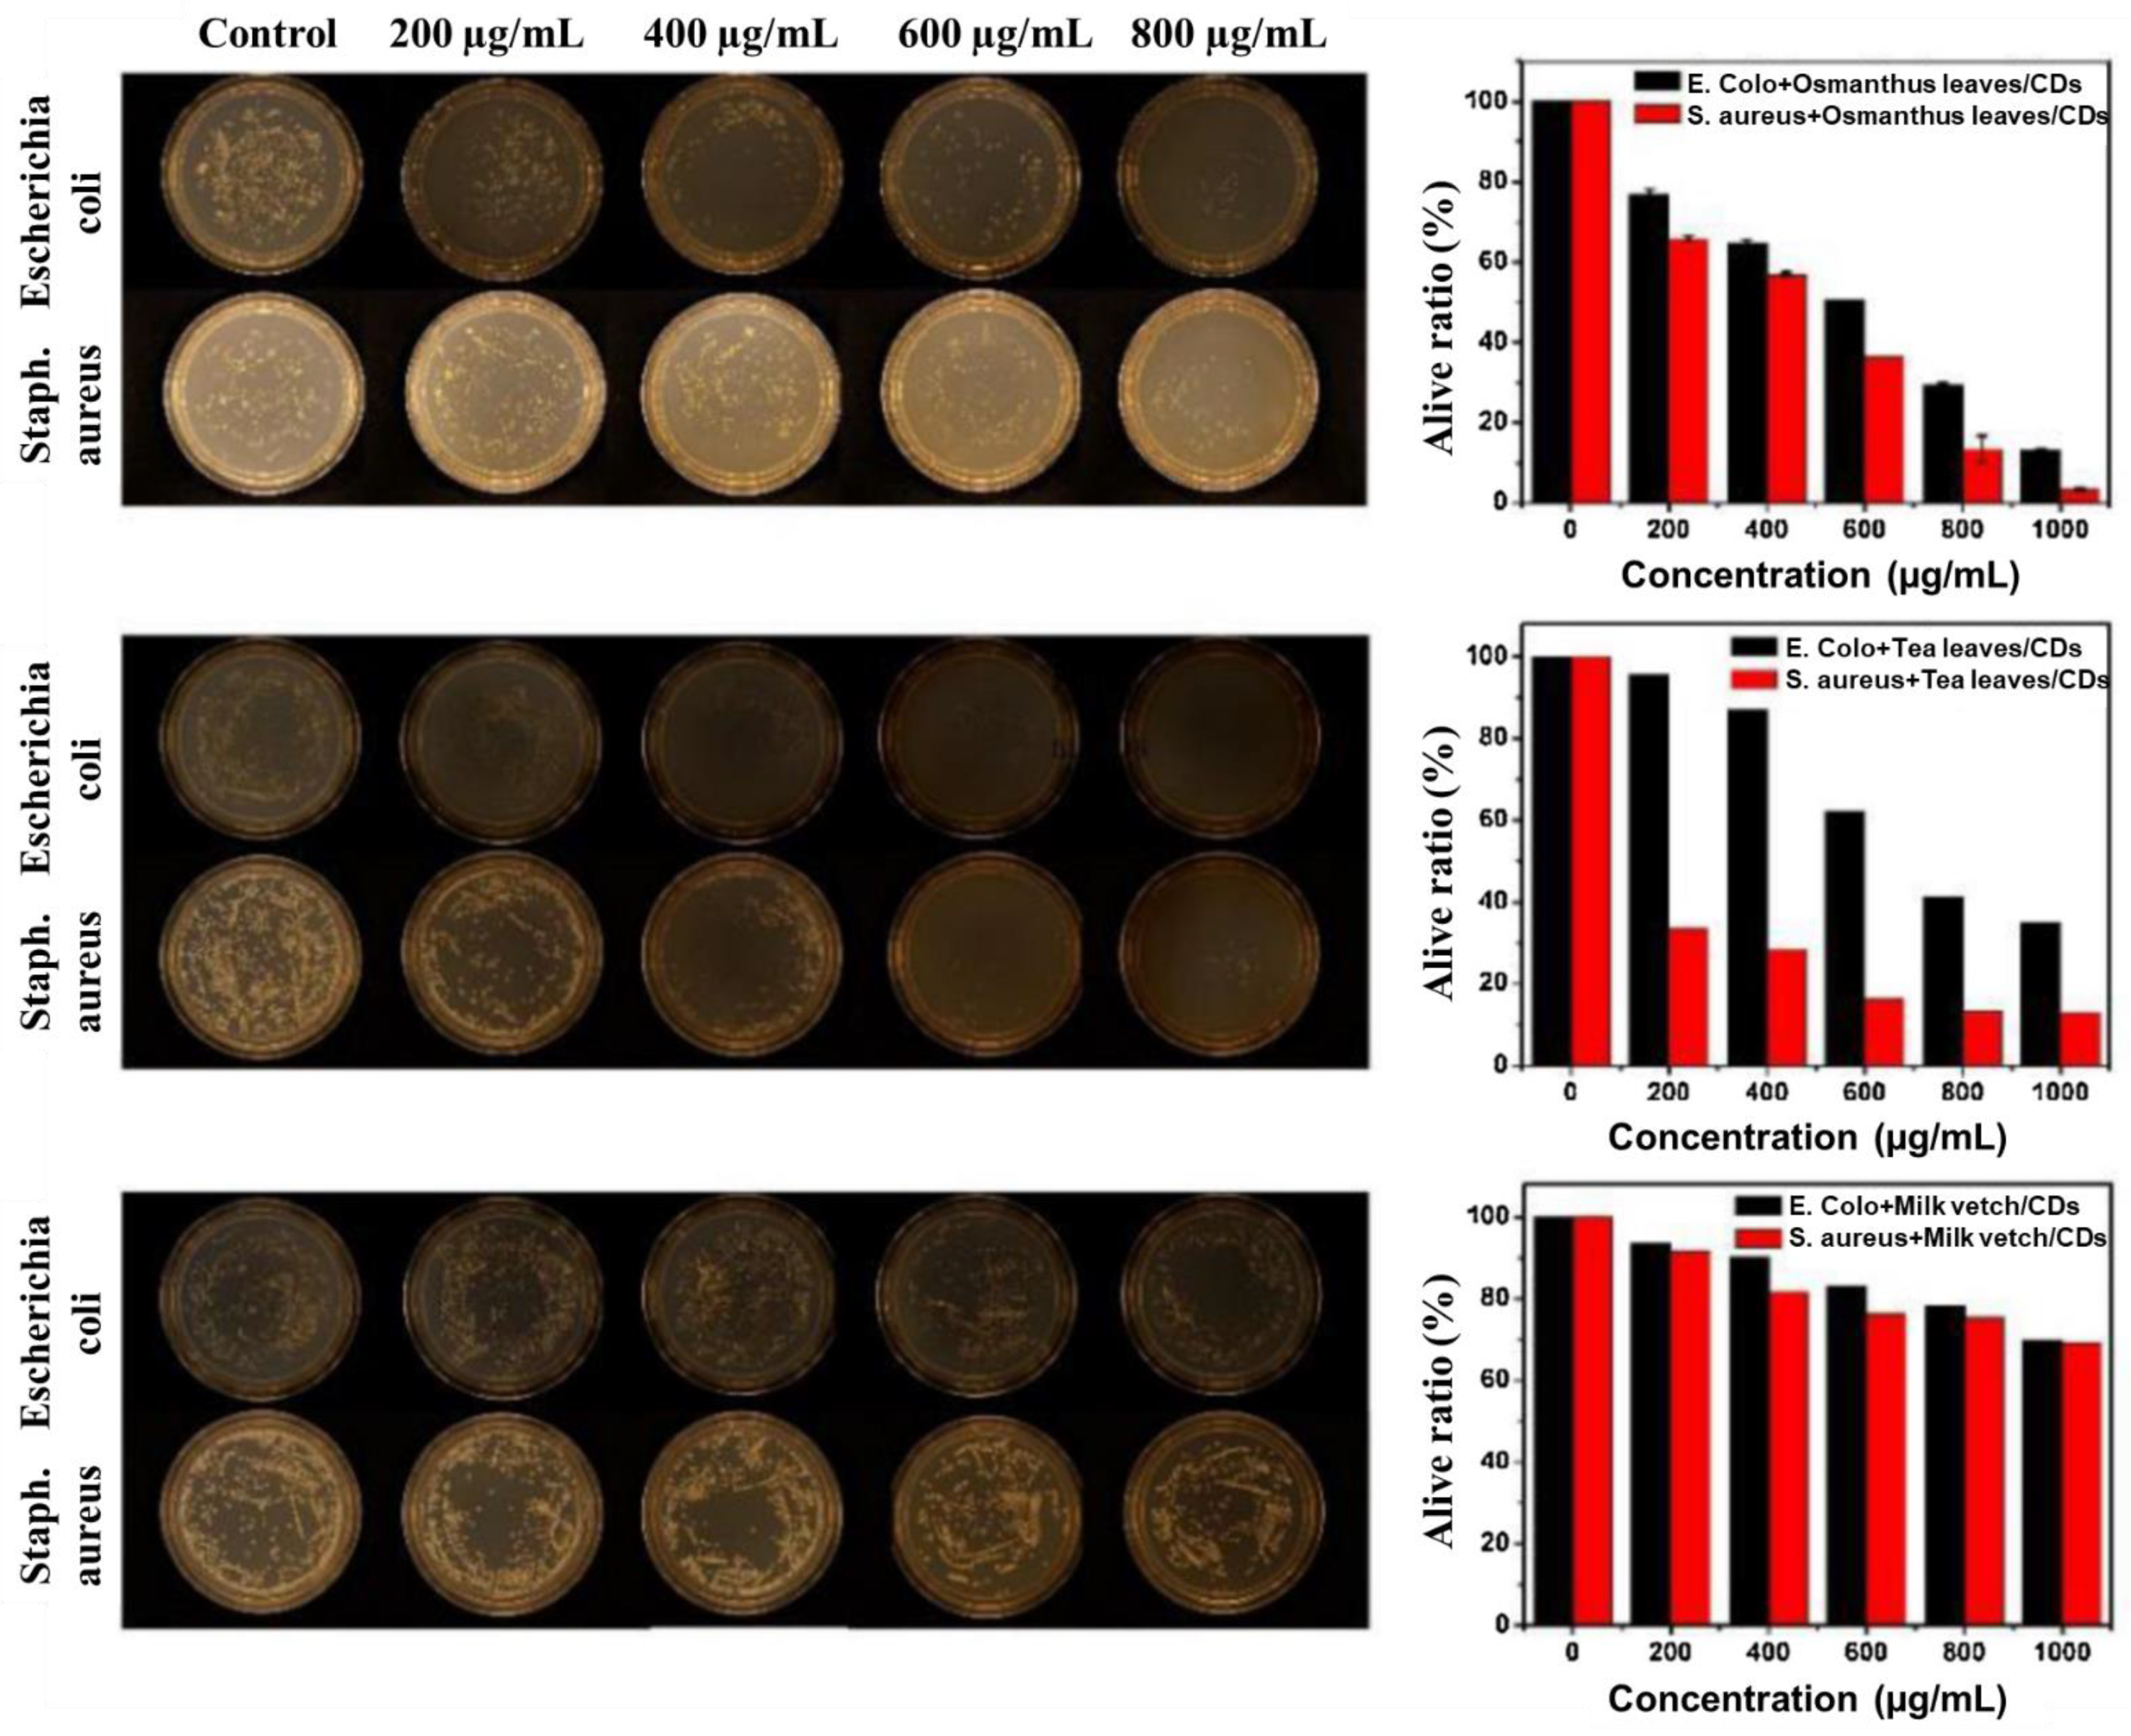
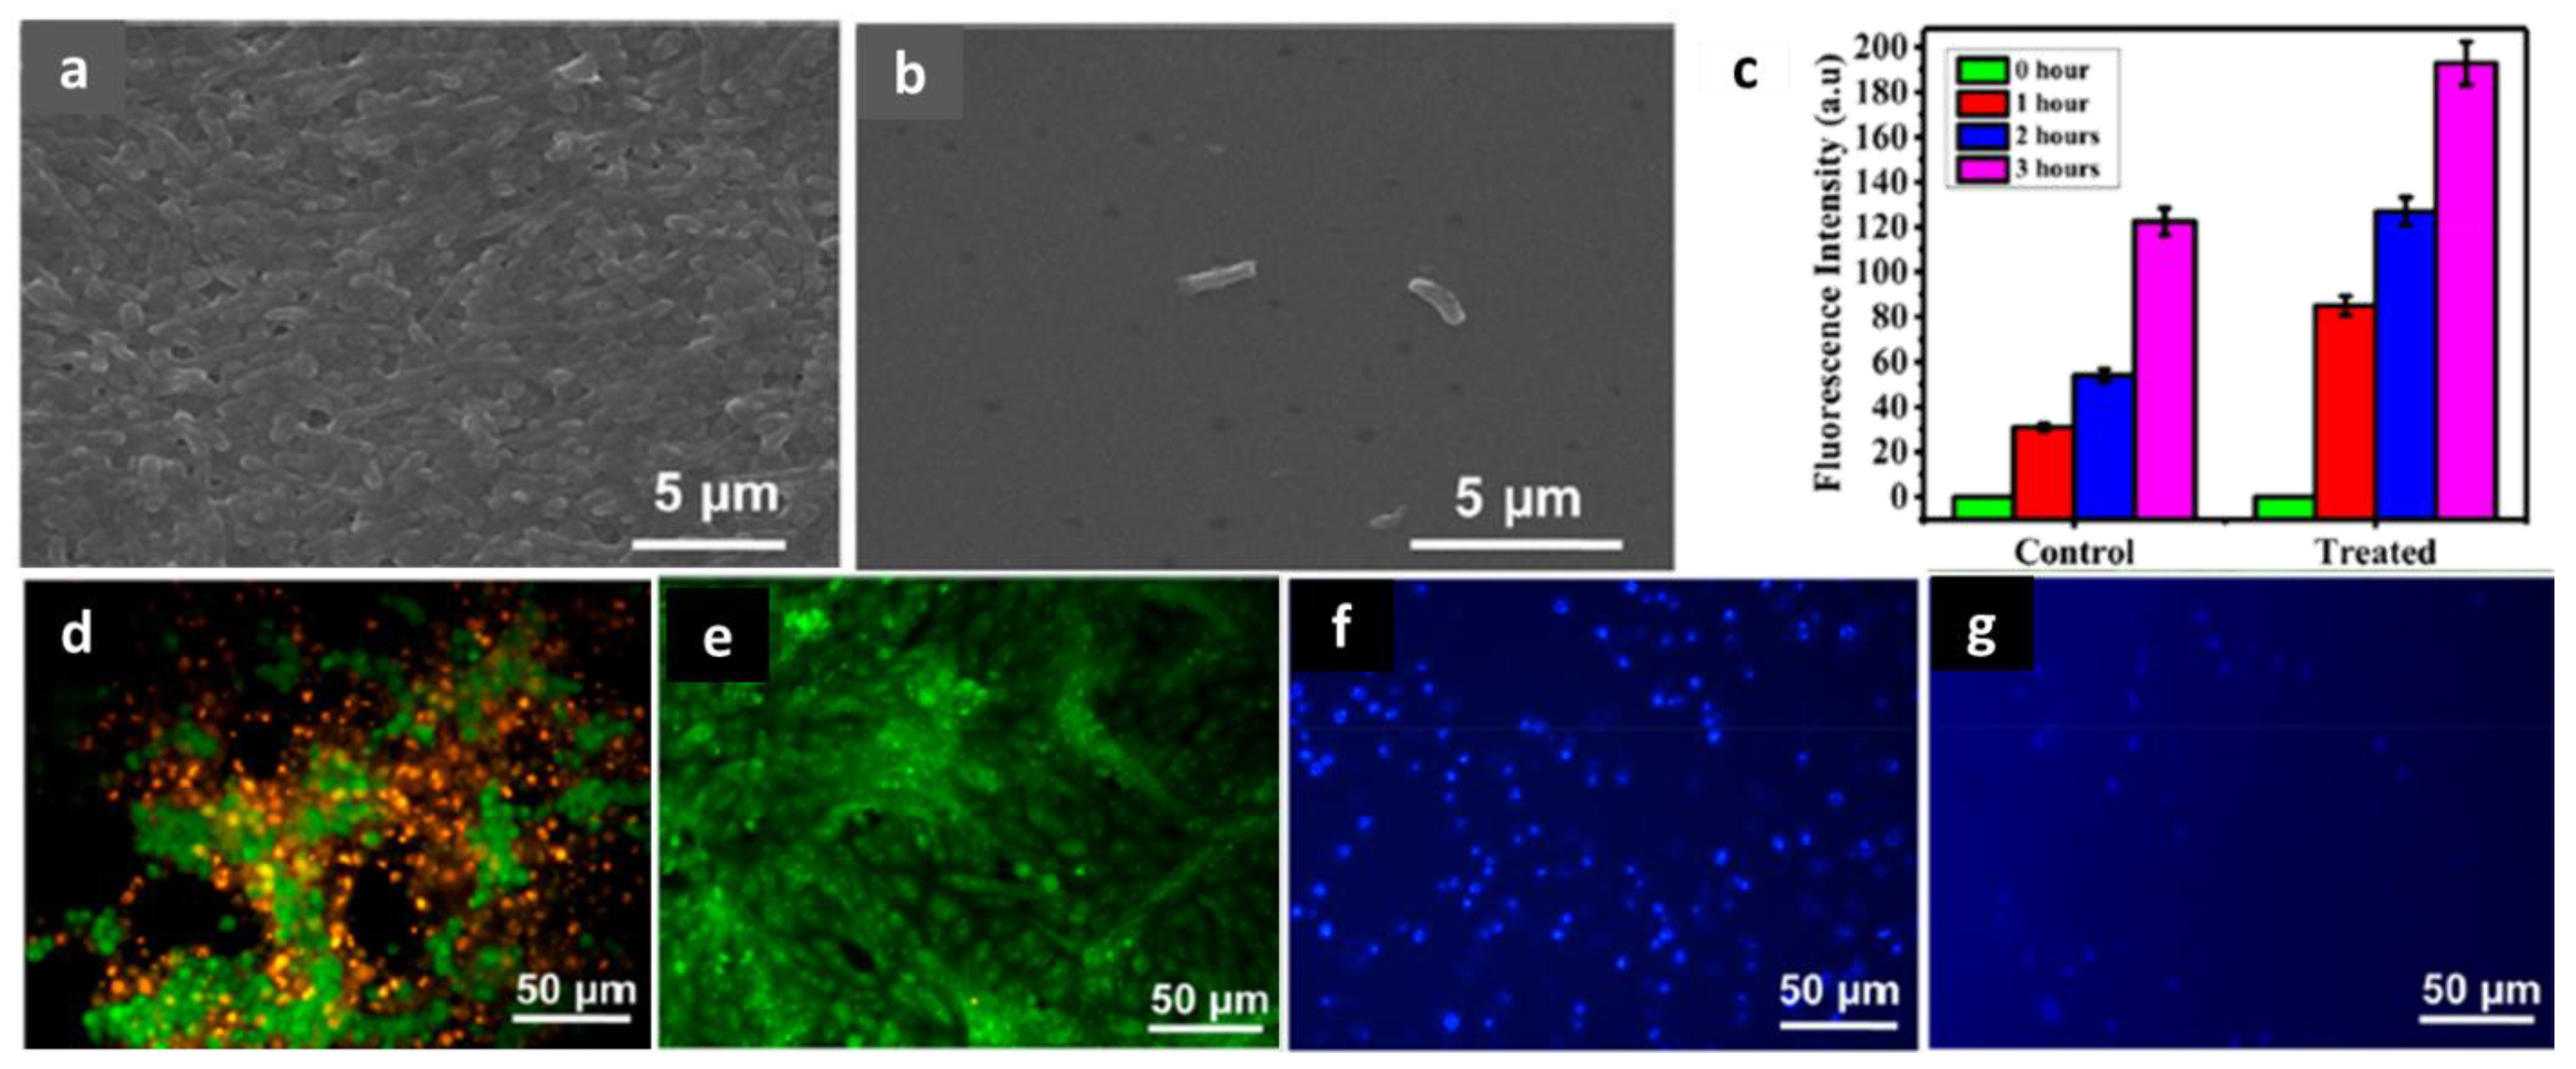
4.3. Antibacterial Activity
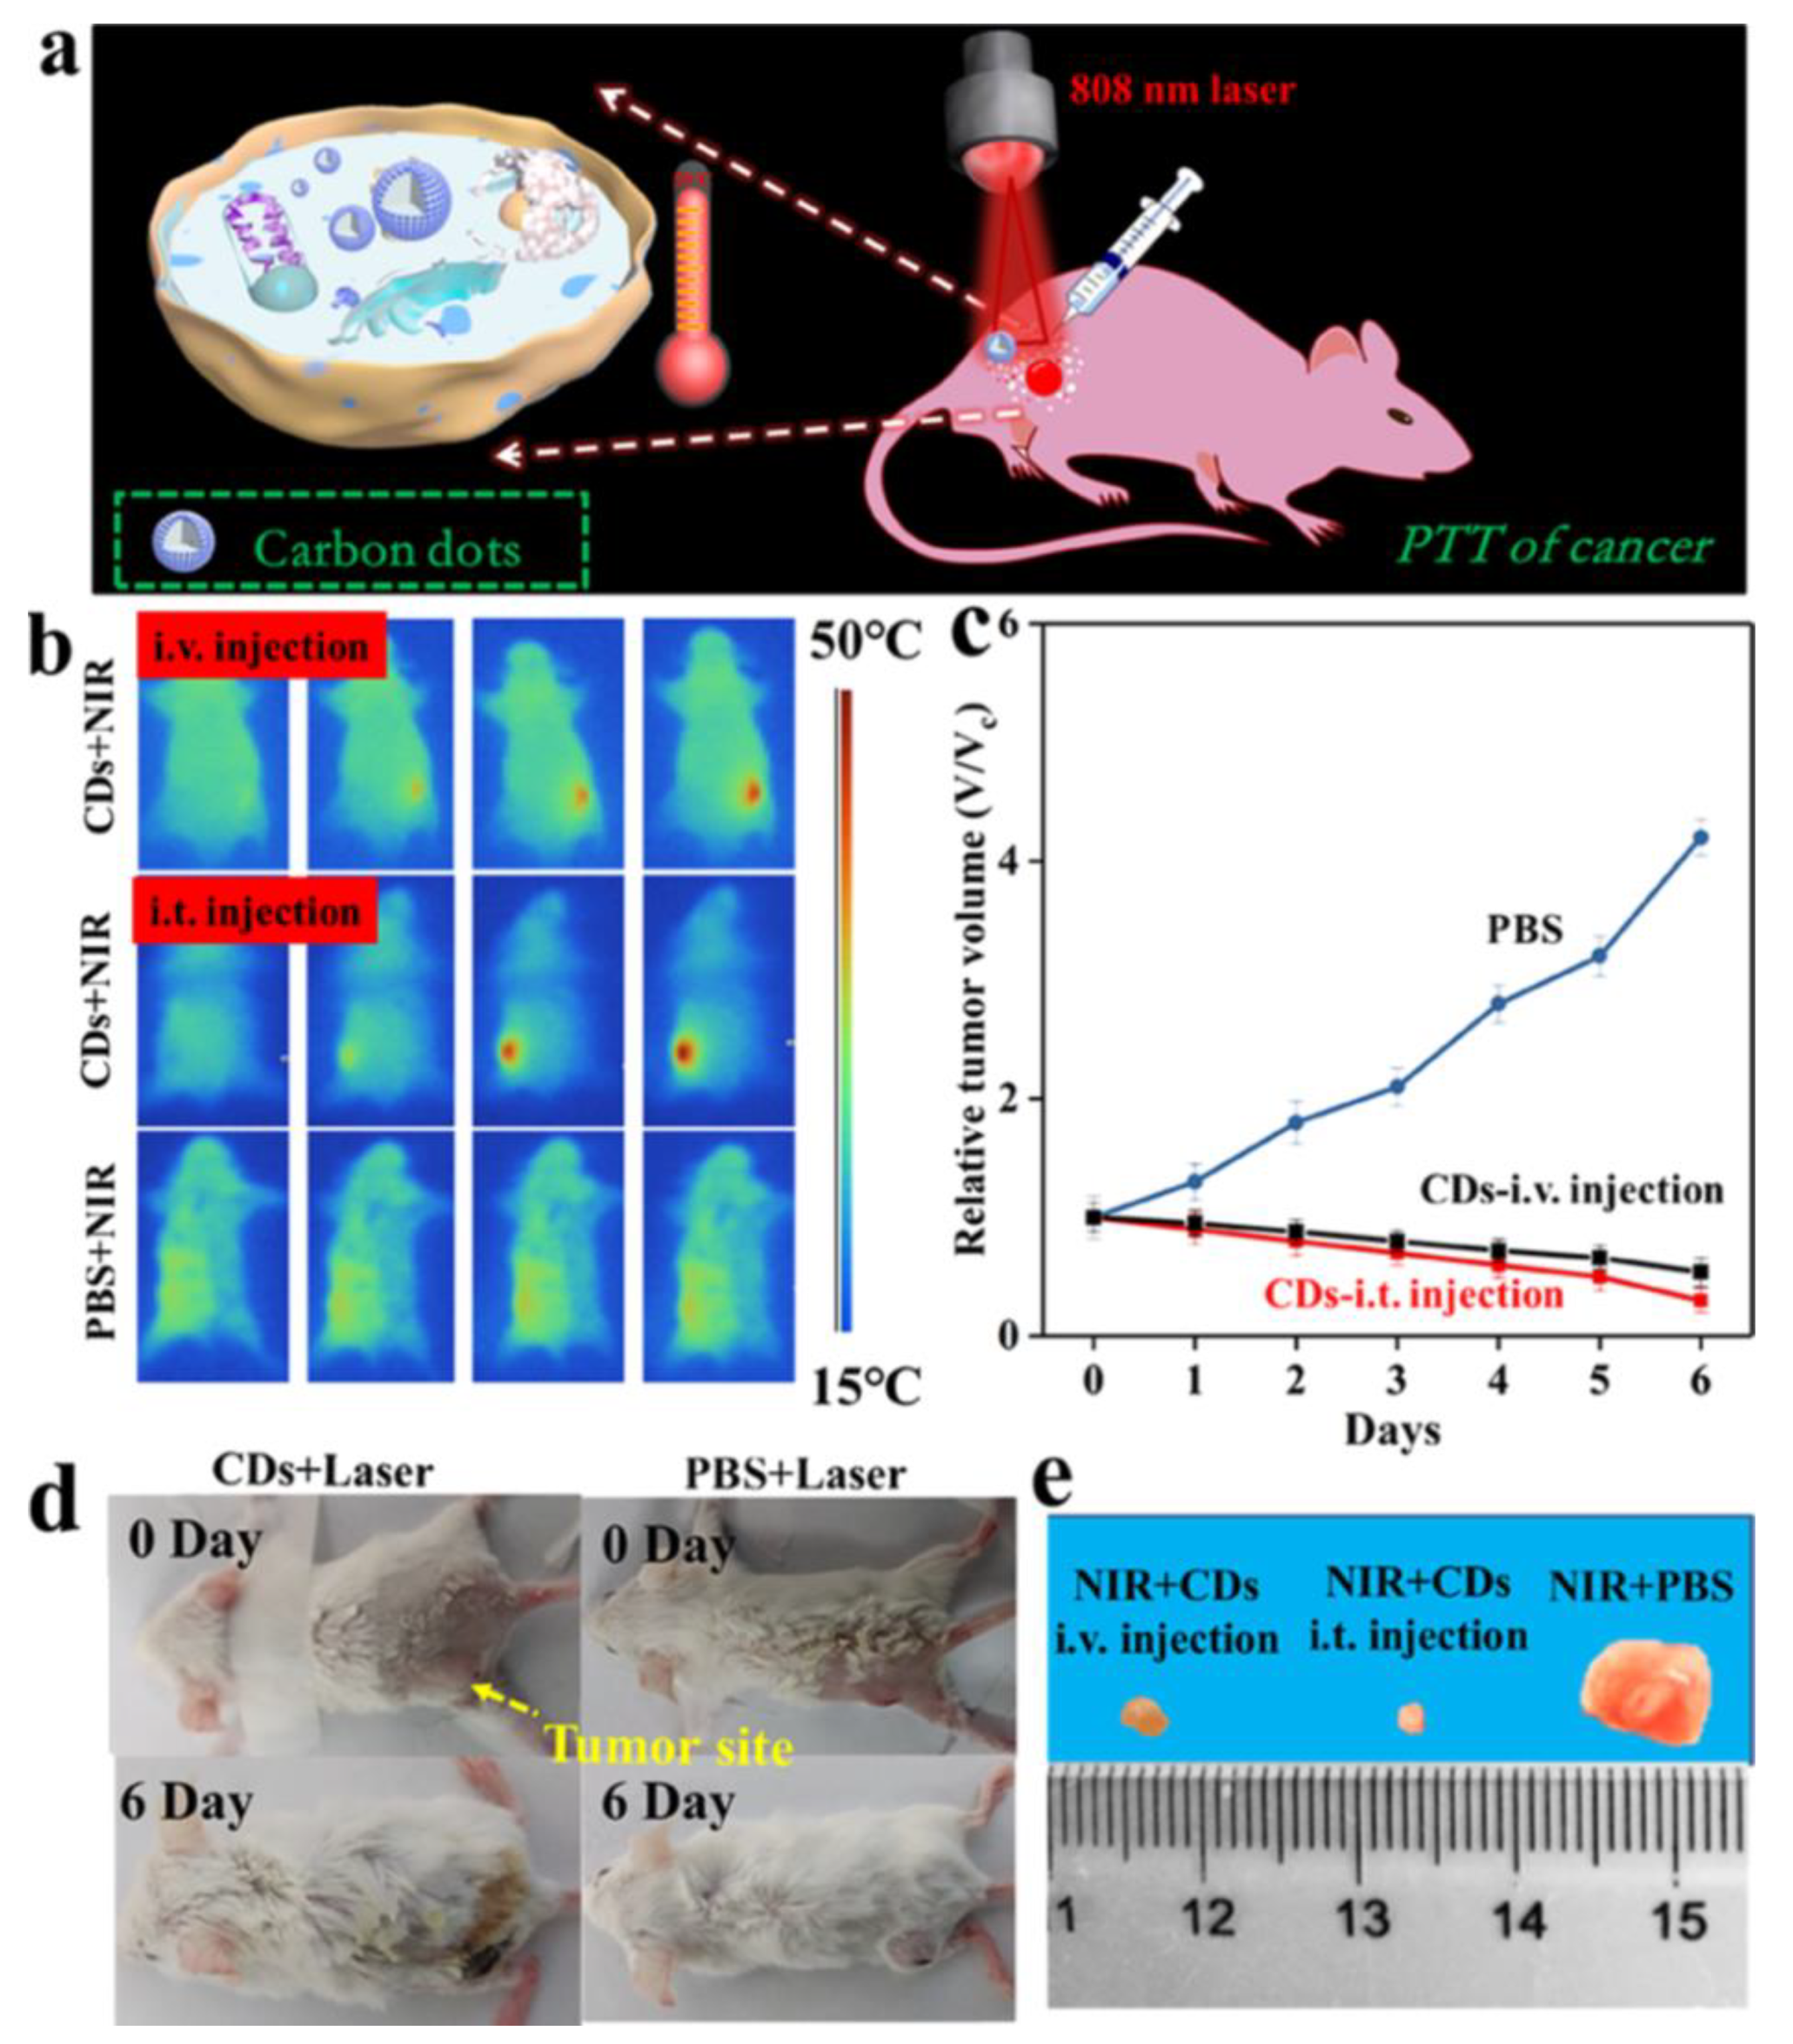
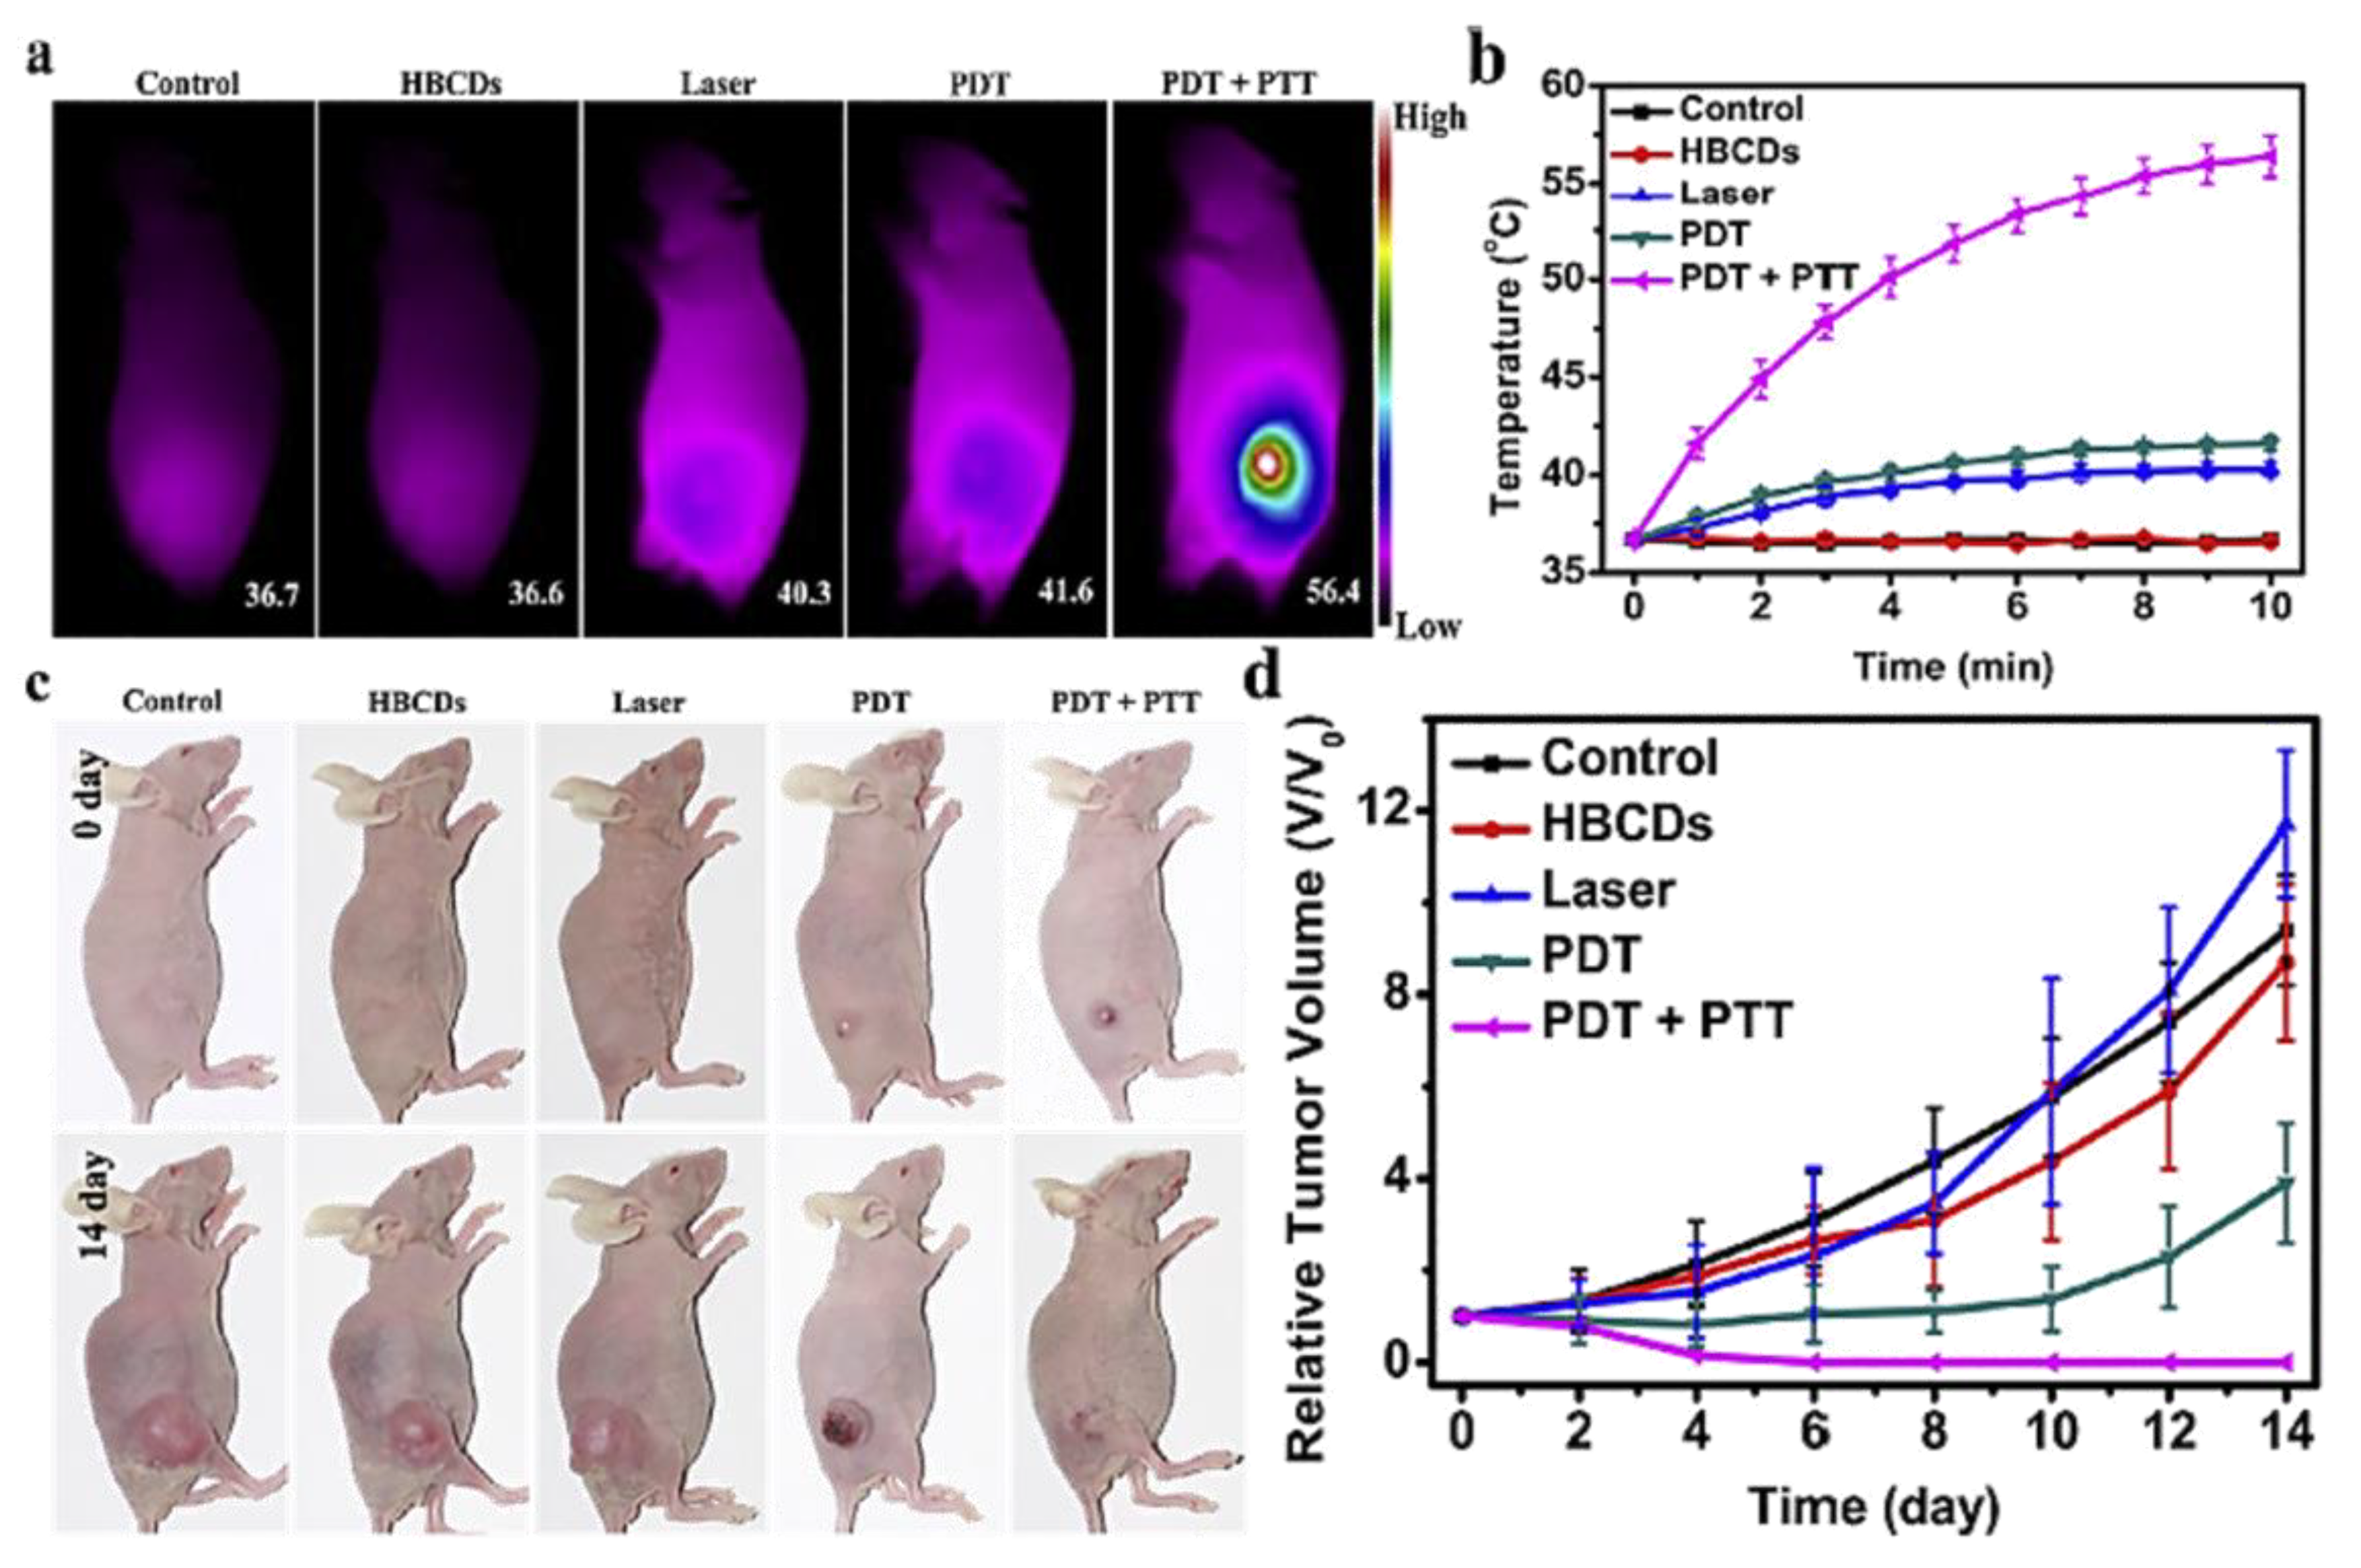
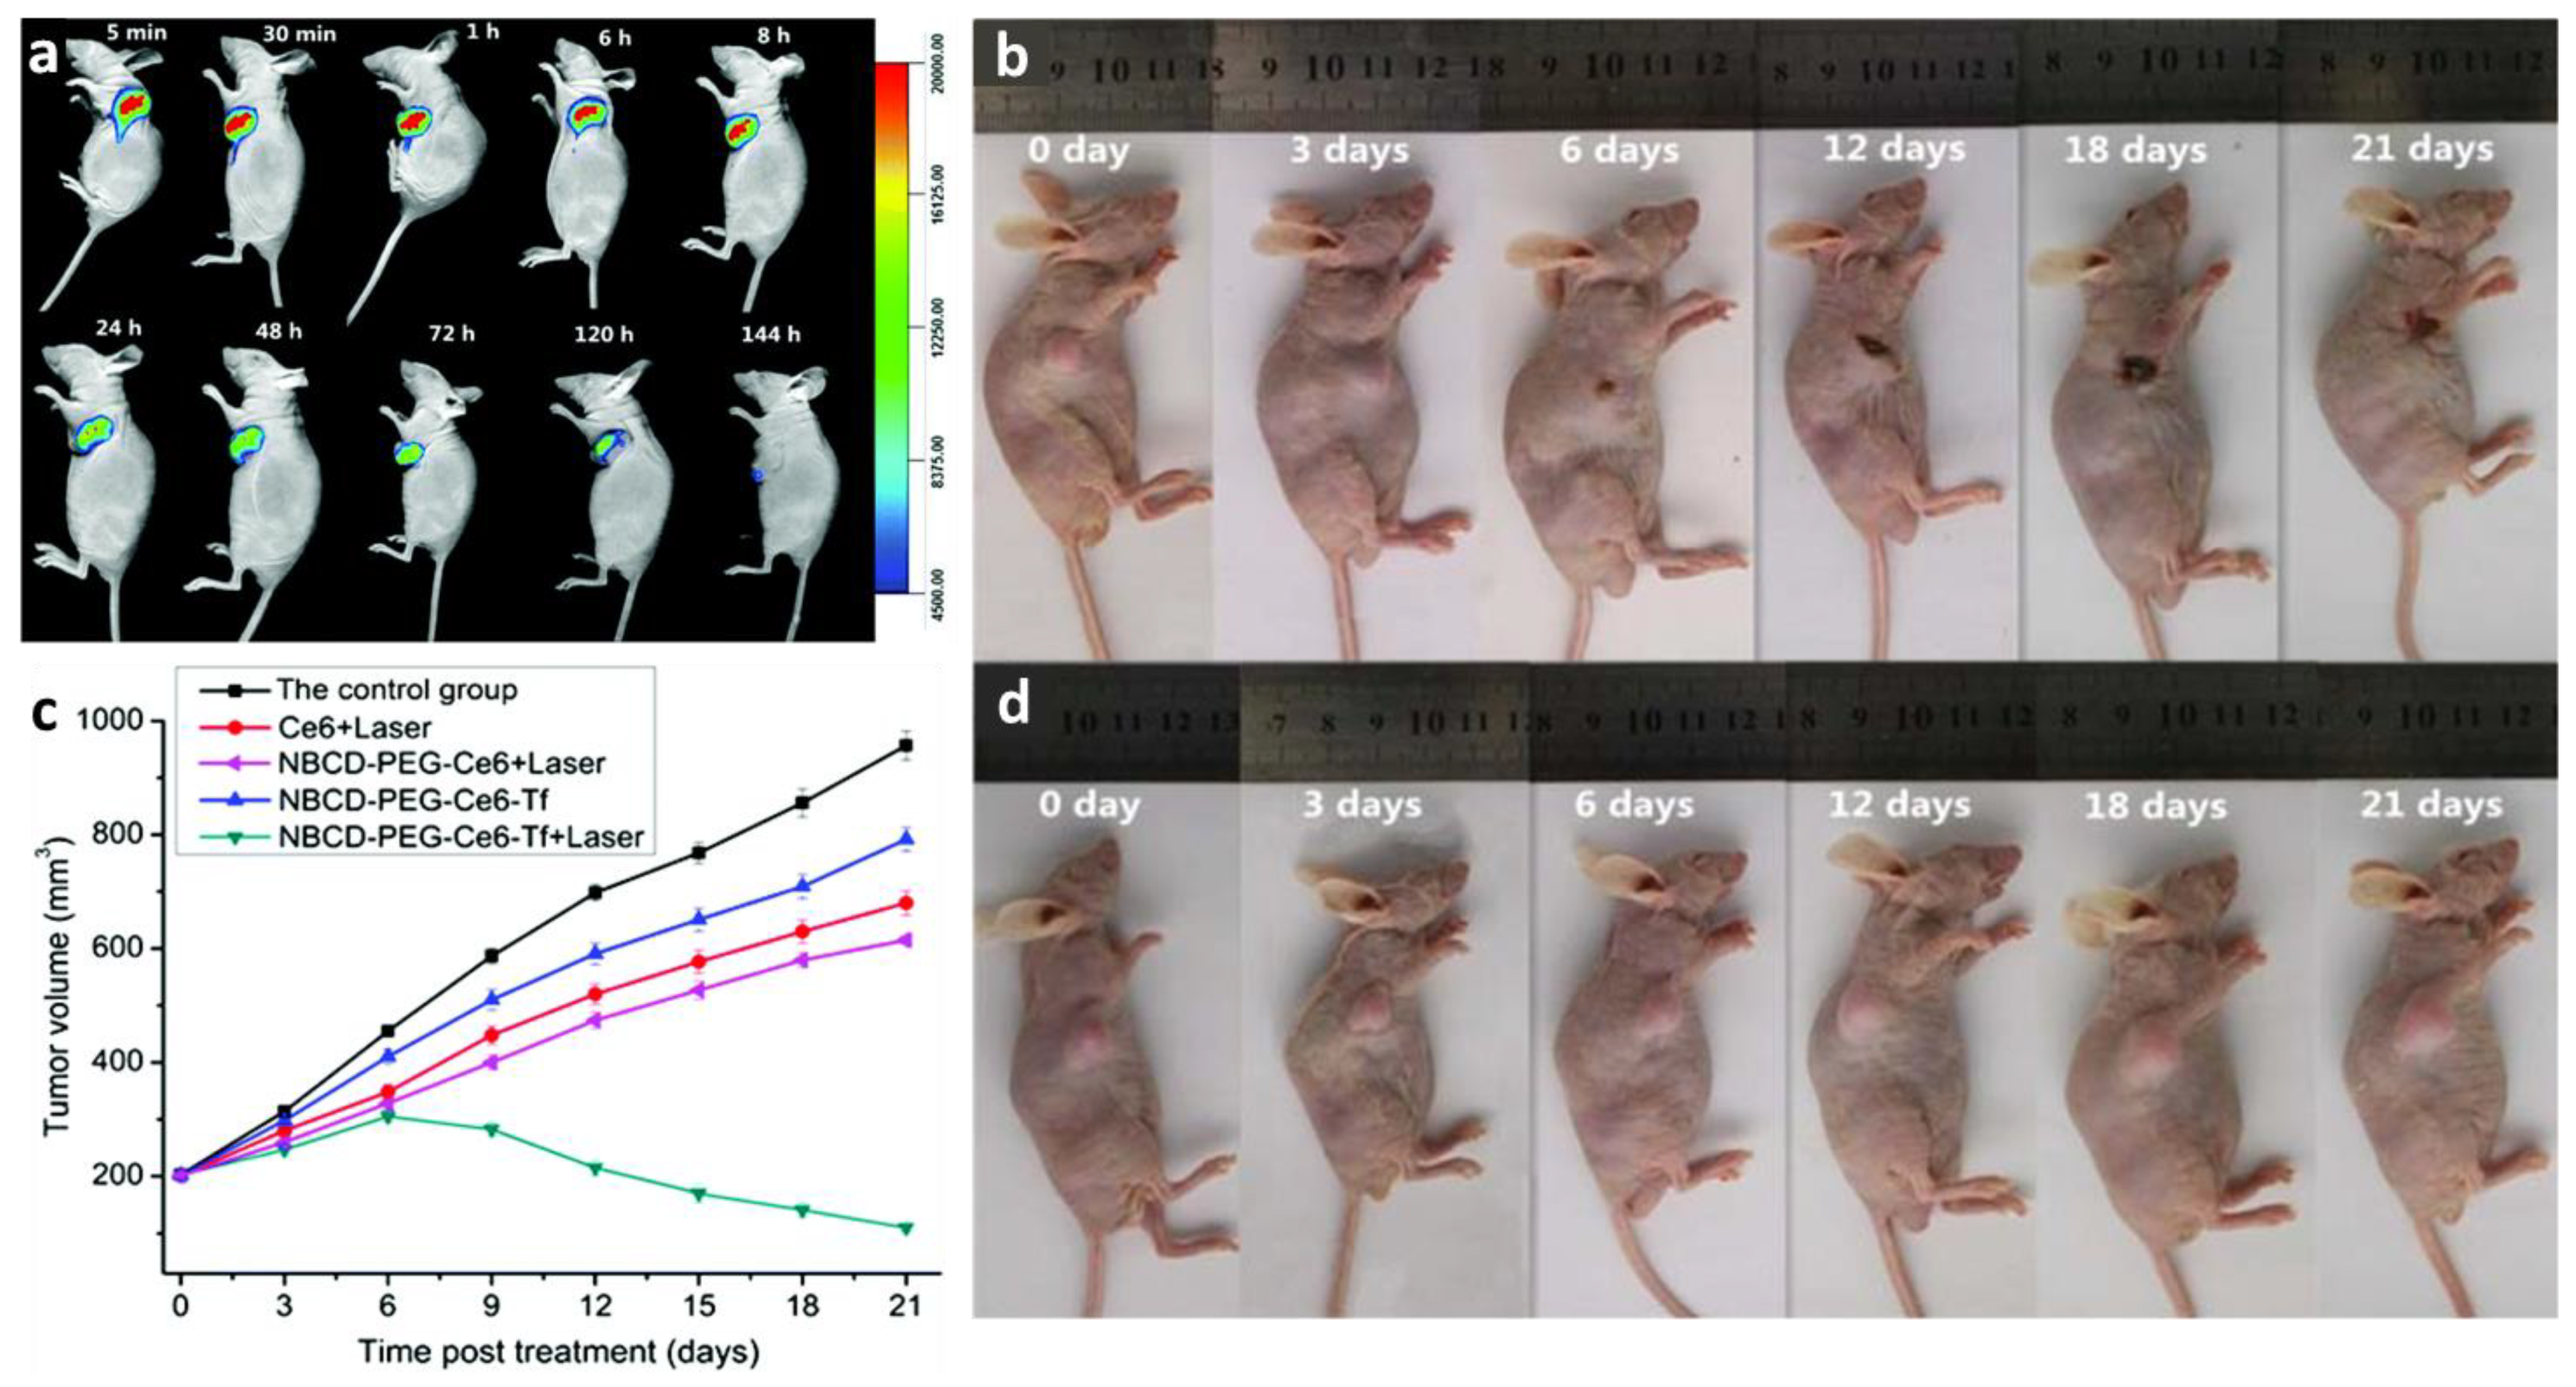
4.4. Anticancer Activity
5. Discussion and Conclusions
Author Contributions
Funding
Acknowledgments
Conflicts of Interest
Abbreviations
| AO/EtBr | Acridine orange and ethidium bromide |
| B-NCdots | Biomass nitrogen co-doped carbon dots |
| c-CDs | Camellia bee pollen carbon dots |
| CDs | Carbon dots |
| CNDs | Carbon Nanodots |
| CPDs | Carbonized polymer dots |
| CQDs | Carbon quantum dots |
| CdSe | Cadmium selenide |
| CdS | Cadmium sulfide |
| ACDs | CDs derived from Artemisia argyi leaves |
| Ce6 | Chlorin e6 |
| l-CGCDs | Large chlorhexidine gluconate carbon dots |
| m-CGCDs | Medium chlorhexidine gluconate carbon dots |
| s-CGCDs | Small chlorhexidine gluconate carbon dots |
| DCFDA | 2′,7′-dichlorofluorescein diacetate |
| DOX | Doxorubicin |
| DCDs | Dual emission carbon dots |
| EtOH | Ethanol |
| Fn-CDs | F. nucleatum-carbon dots |
| HBCUs | Hypocrella Bambusa |
| HBCDs | Hypocrella Bambusa CDs |
| GSH | Glutathione |
| GQDs | Graphene quantum dots |
| l-CDs | Lotus bee pollen carbon dots |
| MCDs | Milk vetch-derived CDs |
| NCDs | Nitrogen-doped CDs |
| NBCDs | Natural biomass CDs |
| NIR-CDs | Near-infrared emissive CDs |
| PDT | Photodynamic therapy |
| PL | Photoluminescence |
| PTT | Photothermal therapy |
| PCQDs | Plum-based carbon quantum dots |
| H2N-PEG-NH2 | Polyethylene glycol diamine |
| OCDs | Osmanthus leaves-derived CDs |
| QY, ϕ | Quantum yield |
| ROS | Reactive oxygen species |
| R-CDs | Red-emitting CDs |
| wCDs | Rose-red fluorescence CDs |
| SCDs | Single-emission carbon dots |
| MCDs | Shiitake mushroom derived CDs |
| TCDs | Tea leaves-derived CDs |
| Tf | Transferrin |
References
- Wu, D.; Zhou, J.J.; Creyer, M.N.; Yim, W.; Chen, Z.; Messersmith, P.B.; Jokerst, J.V. Phenolic-enabled nanotechnology: Versatile particle engineering for biomedicine. Chem. Soc. Rev. 2021, 50, 4432–4483. [Google Scholar] [CrossRef]
- Mauro, N.; Utzeri, M.A.; Drago, S.E.; Buscarino, G.; Cavallaro, G.; Giammona, G. Carbon Nanodots as Functional Excipient to Develop Highly Stable and Smart PLGA Nanoparticles Useful in Cancer Theranostics. Pharmaceutics 2020, 12, 1012. [Google Scholar] [CrossRef] [PubMed]
- Nair, A.; Haponiuk, J.T.; Thomas, S.; Gopi, S. Natural carbon-based quantum dots and their applications in drug delivery: A review. Biomed. Pharmacother. 2020, 132. [Google Scholar] [CrossRef]
- Zhao, X.Q.; Wang, L.; Ren, S.M.; Hu, Z.; Wang, Y.M. One-pot synthesis of Forsythia@carbon quantum dots with natural anti-wood rot fungus activity. Mater. Des. 2021, 206. [Google Scholar] [CrossRef]
- Song, J.Q.; Zhao, N.; Qu, Y.; Zhao, L.S. Natural deep eutectic solvent-assisted preparation of nitrogen-doped carbon dots for ratiometric determination of pirimicarb and pH. Dyes Pigment. 2021, 193. [Google Scholar] [CrossRef]
- Gagic, M.; Kociova, S.; Smerkova, K.; Michalkova, H.; Setka, M.; Svec, P.; Pribyl, J.; Masilko, J.; Balkova, R.; Heger, Z.; et al. One-pot synthesis of natural amine-modified biocompatible carbon quantum dots with antibacterial activity. J. Colloid Interf. Sci. 2020, 580, 30–48. [Google Scholar] [CrossRef]
- Wang, C.X.; Pan, C.W.; Wei, X.R.; Yang, F.; Wu, W.J.; Mao, L.Q. Emissive carbon dots derived from natural liquid fuels and its biological sensing for copper ions. Talanta 2020, 208. [Google Scholar] [CrossRef]
- Kang, L.X.; Hu, Y.; Liu, L.L.; Wu, J.X.; Zhang, S.C.; Zhao, Q.C.; Ding, F.; Li, Q.W.; Zhang, J. Growth of Close-Packed Semiconducting Single-Walled Carbon Nanotube Arrays Using Oxygen-Deficient TiO2 Nanoparticles as Catalysts. Nano Lett. 2015, 15, 403–409. [Google Scholar] [CrossRef] [PubMed]
- Crista, D.M.A.; El Mragui, A.; Algarra, M.; da Silva, J.C.G.E.; Luque, R.; da Silva, L.P. Turning Spent Coffee Grounds into Sustainable Precursors for the Fabrication of Carbon Dots. Nanomaterials 2020, 10, 1209. [Google Scholar] [CrossRef]
- Qu, D.; Zheng, M.; Du, P.; Zhou, Y.; Zhang, L.G.; Li, D.; Tan, H.Q.; Zhao, Z.; Xie, Z.G.; Sun, Z.C. Highly luminescent S, N co-doped graphene quantum dots with broad visible absorption bands for visible light photocatalysts. Nanoscale 2013, 5, 12272–12277. [Google Scholar] [CrossRef]
- Gu, S.Y.; Hsieh, C.T.; Gandomi, Y.A.; Li, J.L.; Yue, X.X.; Chang, J.K. Tailoring fluorescence emissions, quantum yields, and white light emitting from nitrogen-doped graphene and carbon nitride quantum dots. Nanoscale 2019, 11, 16553–16561. [Google Scholar] [CrossRef]
- Han, Y.; Tang, B.J.; Wang, L.; Bao, H.; Lu, Y.H.; Guan, C.T.; Zhang, L.; Le, M.Y.; Liu, Z.; Wu, M.H. Machine-Learning-Driven Synthesis of Carbon Dots with Enhanced Quantum Yields. ACS Nano 2020, 14, 14761–14768. [Google Scholar] [CrossRef]
- Chao, D.Y.; Chen, J.X.; Dong, Q.; Wu, W.W.; Qi, D.S.; Dong, S.J. Ultrastable and ultrasensitive pH-switchable carbon dots with high quantum yield for water quality identification, glucose detection, and two starch-based solid-state fluorescence materials. Nano Res. 2020, 13, 3012–3018. [Google Scholar] [CrossRef]
- Manzur, A.; Oluwasanmi, A.; Moss, D.; Curtis, A.; Hoskins, C. Nanotechnologies in Pancreatic Cancer Therapy. Pharmaceutics 2017, 9, 39. [Google Scholar] [CrossRef] [Green Version]
- Messina, M.M.; Barrionuevo, S.D.; Coustet, M.E.; Kreuzer, M.P.; Saccone, F.D.; Claro, P.C.D.; Ibanez, F.J. Graphene and Carbon Dots for Photoanodes with Enhanced Performance. ACS Appl. Nano Mater. 2021, 4, 7309–7318. [Google Scholar] [CrossRef]
- Akbar, K.; Moretti, E.; Vomiero, A. Carbon Dots for Photocatalytic Degradation of Aqueous Pollutants: Recent Advancements. Adv. Opt. Mater. 2021, 9. [Google Scholar] [CrossRef]
- Shen, J.L.; Chen, W.F.; Yang, Z.H.; Lv, G.; Cao, J.; Li, D.Y.; Liu, X. A Critical Review of Graphene Quantum Dots: Synthesis and Application in Biosensors. Nano 2021, 16. [Google Scholar] [CrossRef]
- De, B.; Karak, N. A green and facile approach for the synthesis of water soluble fluorescent carbon dots from banana juice. RSC Adv. 2013, 3, 8286–8290. [Google Scholar] [CrossRef]
- Michaud, V.; Pracht, J.; Schilfarth, F.; Damm, C.; Platzer, B.; Haines, P.; Harreiss, C.; Guldi, D.M.; Spiecker, E.; Peukert, W. Well-separated water-soluble carbon dots via gradient chromatography. Nanoscale 2021, 13, 13116–13128. [Google Scholar] [CrossRef]
- Kurniawan, D.; Chiang, W.H. Microplasma-enabled colloidal nitrogen-doped graphene quantum dots for broad-range fluorescent pH sensors. Carbon 2020, 167, 675–684. [Google Scholar] [CrossRef]
- Ru, Y.; Ai, L.; Jia, T.T.; Liu, X.J.; Lu, S.Y.; Tang, Z.Y.; Yang, B. Recent advances in chiral carbonized polymer dots: From synthesis and properties to applications. Nano Today 2020, 34. [Google Scholar] [CrossRef]
- Ding, H.; Ji, Y.; Wei, J.-S.; Gao, Q.-Y.; Zhou, Z.-Y.; Xiong, H.-M. Facile synthesis of red-emitting carbon dots from pulp-free lemon juice for bioimaging. J. Mater. Chem. B 2017, 5, 5272–5277. [Google Scholar] [CrossRef] [PubMed]
- Liu, J.; Geng, Y.; Li, D.; Yao, H.; Huo, Z.; Li, Y.; Zhang, K.; Zhu, S.; Wei, H.; Xu, W.; et al. Deep Red Emissive Carbonized Polymer Dots with Unprecedented Narrow Full Width at Half Maximum. Adv. Mater. 2020, 32, 1906641. [Google Scholar] [CrossRef] [PubMed]
- Liang, C.; Xie, X.; Zhang, D.; Feng, J.; Lu, S.; Shi, Q. Biomass carbon dots derived from Wedelia trilobata for the direct detection of glutathione and their imaging application in living cells. J. Mater. Chem. B 2021, 9, 5670–5681. [Google Scholar] [CrossRef]
- Wu, L.; Long, R.; Li, T.; Tang, C.; Tong, X.; Guo, Y.; Shi, S.; Xiang, H.; Tong, C. One-pot fabrication of dual-emission and single-emission biomass carbon dots for Cu2+ and tetracycline sensing and multicolor cellular imaging. Anal. Bioanal. Chem. 2020, 412, 7481–7489. [Google Scholar] [CrossRef] [PubMed]
- Ding, H.; Zhou, X.; Qin, B.; Zhou, Z.; Zhao, Y. Highly fluorescent near-infrared emitting carbon dots derived from lemon juice and its bioimaging application. J. Lumin. 2019, 211, 298–304. [Google Scholar] [CrossRef]
- Zhu, J.; Chu, H.; Shen, J.; Wang, C.; Wei, Y. Green preparation of carbon dots from plum as a ratiometric fluorescent probe for detection of doxorubicin. Opt. Mater. 2021, 114, 110941. [Google Scholar] [CrossRef]
- Liu, L.; Zhang, S.; Zheng, X.; Li, H.; Chen, Q.; Qin, K.; Ding, Y.; Wei, Y. Carbon dots derived from Fusobacterium nucleatum for intracellular determination of Fe3+ and bioimaging both in vitro and in vivo. Anal. Methods 2021, 13, 1121–1131. [Google Scholar] [CrossRef]
- Wang, W.; Chen, J.; Wang, D.; Shen, Y.; Yang, L.; Zhang, T.; Ge, J. Facile synthesis of biomass waste-derived fluorescent N, S, P co-doped carbon dots for detection of Fe3+ ions in solutions and living cells. Anal. Methods 2021, 13, 789–795. [Google Scholar] [CrossRef]
- Wang, N.; Wang, Y.; Guo, T.; Yang, T.; Chen, M.; Wang, J. Green preparation of carbon dots with papaya as carbon source for effective fluorescent sensing of Iron (III) and Escherichia coli. Biosens. Bioelectron. 2016, 85, 68–75. [Google Scholar] [CrossRef]
- Edison, T.N.J.I.; Atchudan, R.; Shim, J.-J.; Kalimuthu, S.; Ahn, B.-C.; Lee, Y.R. Turn-off fluorescence sensor for the detection of ferric ion in water using green synthesized N-doped carbon dots and its bio-imaging. J. Photochem. Photobiol. B Biol. 2016, 158, 235–242. [Google Scholar] [CrossRef]
- Yang, X.; Zhuo, Y.; Zhu, S.; Luo, Y.; Feng, Y.; Dou, Y. Novel and green synthesis of high-fluorescent carbon dots originated from honey for sensing and imaging. Biosens. Bioelectron. 2014, 60, 292–298. [Google Scholar] [CrossRef] [PubMed]
- Shen, J.; Shang, S.; Chen, X.; Wang, D.; Cai, Y. Facile synthesis of fluorescence carbon dots from sweet potato for Fe3+ sensing and cell imaging. Mater. Sci. Eng. C 2017, 76, 856–864. [Google Scholar] [CrossRef]
- Song, P.; Zhang, L.; Long, H.; Meng, M.; Liu, T.; Yin, Y.; Xi, R. A multianalyte fluorescent carbon dots sensing system constructed based on specific recognition of Fe(iii) ions. RSC Adv. 2017, 7, 28637–28646. [Google Scholar] [CrossRef] [Green Version]
- Liu, W.; Zhang, R.; Kang, Y.; Zhang, X.Y.; Wang, H.J.; Li, L.H.; Diao, H.P.; Wei, W.L. Preparation of nitrogen-doped carbon dots with a high fluorescence quantum yield for the highly sensitive detection of Cu2+ ions, drawing anti-counterfeit patterns and imaging live cells. New Carbon Mater. 2019, 34, 390–401. [Google Scholar] [CrossRef]
- Atchudan, R.; Edison, T.N.J.I.; Perumal, S.; Vinodh, R.; Sundramoorthy, A.K.; Babu, R.S.; Lee, Y.R. Leftover Kiwi Fruit Peel-Derived Carbon Dots as a Highly Selective Fluorescent Sensor for Detection of Ferric Ion. Chemosensors 2021, 9, 166. [Google Scholar] [CrossRef]
- Liu, R.; Zhang, J.; Gao, M.; Li, Z.; Chen, J.; Wu, D.; Liu, P. A facile microwave-hydrothermal approach towards highly photoluminescent carbon dots from goose feathers. RSC Adv. 2015, 5, 4428–4433. [Google Scholar] [CrossRef]
- Zulfajri, M.; Gedda, G.; Chang, C.-J.; Chang, Y.-P.; Huang, G.G. Cranberry Beans Derived Carbon Dots as a Potential Fluorescence Sensor for Selective Detection of Fe3+ Ions in Aqueous Solution. ACS Omega 2019, 4, 15382–15392. [Google Scholar] [CrossRef] [Green Version]
- Xu, J.; Zhou, Y.; Liu, S.; Dong, M.; Huang, C. Low-cost synthesis of carbon nanodots from natural products used as a fluorescent probe for the detection of ferrum(iii) ions in lake water. Anal. Methods 2014, 6, 2086. [Google Scholar] [CrossRef]
- Venkatesan, G.; Rajagopalan, V.; Chakravarthula, S.N. Boswellia ovalifoliolata bark extract derived carbon dots for selective fluorescent sensing of Fe3+. J. Environ. Chem. Eng. 2019, 7, 103013. [Google Scholar] [CrossRef]
- Zhou, J.; Ge, M.; Han, Y.; Ni, J.; Huang, X.; Han, S.; Peng, Z.; Li, Y.; Li, S. Preparation of Biomass-Based Carbon Dots with Aggregation Luminescence Enhancement from Hydrogenated Rosin for Biological Imaging and Detection of Fe3+. ACS Omega 2020, 5, 11842–11848. [Google Scholar] [CrossRef] [PubMed]
- Sachdev, A.; Gopinath, P. Green synthesis of multifunctional carbon dots from coriander leaves and their potential application as antioxidants, sensors and bioimaging agents. Analyst 2015, 140, 4260–4269. [Google Scholar] [PubMed]
- Raveendran, V.; Suresh Babu, A.R.; Renuka, N.K. Mint leaf derived carbon dots for dual analyte detection of Fe(iii) and ascorbic acid. RSC Adv. 2019, 9, 12070–12077. [Google Scholar] [CrossRef] [Green Version]
- Hu, Y.; Li, J.; Li, X. Leek-derived co-doped carbon dots as efficient fluorescent probes for dichlorvos sensitive detection and cell multicolor imaging. Anal. Bioanal. Chem. 2019, 411, 7879–7887. [Google Scholar] [CrossRef] [PubMed]
- Liao, J.; Cheng, Z.; Zhou, L. Nitrogen-Doping Enhanced Fluorescent Carbon Dots: Green Synthesis and Their Applications for Bioimaging and Label-Free Detection of Au3+ Ions. ACS Sustain. Chem. Eng. 2016, 4, 3053–3061. [Google Scholar] [CrossRef]
- Miao, H.; Wang, L.; Zhuo, Y.; Zhou, Z.; Yang, X. Label-free fluorimetric detection of CEA using carbon dots derived from tomato juice. Biosens. Bioelectron. 2016, 86, 83–89. [Google Scholar] [CrossRef]
- Lu, H.; Li, C.; Wang, H.; Wang, X.; Xu, S. Biomass-Derived Sulfur, Nitrogen Co-Doped Carbon Dots for Colorimetric and Fluorescent Dual Mode Detection of Silver (I) and Cell Imaging. ACS Omega 2019, 4, 21500–21508. [Google Scholar] [CrossRef] [Green Version]
- Singh, A.K.; Singh, V.K.; Singh, M.; Singh, P.; Khadim, S.R.; Singh, U.; Koch, B.; Hasan, S.H.; Asthana, R.K. One pot hydrothermal synthesis of fluorescent NP-carbon dots derived from Dunaliella salina biomass and its application in on-off sensing of Hg (II), Cr (VI) and live cell imaging. J. Photochem. Photobiol. A 2019, 376, 63–72. [Google Scholar] [CrossRef]
- Tsai, S.R.; Yin, R.; Huang, Y.Y.; Sheu, B.C.; Lee, S.C.; Hamblin, M.R. Low-level light therapy potentiates NPe6-mediated photodynamic therapy in a human osteosarcoma cell line via increased ATP. Photodiagn. Photodyn. 2015, 12, 123–130. [Google Scholar] [CrossRef] [PubMed] [Green Version]
- Lu, W.; Qin, X.; Liu, S.; Chang, G.; Zhang, Y.; Luo, Y.; Asiri, A.M.; Al-Youbi, A.O.; Sun, X. Economical, Green Synthesis of Fluorescent Carbon Nanoparticles and Their Use as Probes for Sensitive and Selective Detection of Mercury(II) Ions. Anal. Chem. 2012, 84, 5351–5357. [Google Scholar] [CrossRef]
- Huang, H.; Lv, J.-J.; Zhou, D.-L.; Bao, N.; Xu, Y.; Wang, A.-J.; Feng, J.-J. One-pot green synthesis of nitrogen-doped carbon nanoparticles as fluorescent probes for mercury ions. RSC Adv. 2013, 3, 21691. [Google Scholar] [CrossRef]
- Wang, C.; Sun, D.; Zhuo, K.; Zhang, H.; Wang, J. Simple and green synthesis of nitrogen-, sulfur-, and phosphorus-co-doped carbon dots with tunable luminescence properties and sensing application. RSC Adv. 2014, 4, 54060–54065. [Google Scholar] [CrossRef]
- Xie, Y.; Cheng, D.; Liu, X.; Han, A. Green Hydrothermal Synthesis of N-doped Carbon Dots from Biomass Highland Barley for the Detection of Hg2+. Sensors 2019, 19, 3169. [Google Scholar] [CrossRef] [Green Version]
- Tyagi, A.; Tripathi, K.M.; Singh, N.; Choudhary, S.; Gupta, R.K. Green synthesis of carbon quantum dots from lemon peel waste: Applications in sensing and photocatalysis. RSC Adv. 2016, 6, 72423–72432. [Google Scholar] [CrossRef]
- Ghereghlou, M.; Esmaeili, A.A.; Darroudi, M. Green Synthesis of Fluorescent Carbon Dots from Elaeagnus angustifolia and its Application as Tartrazine Sensor. J. Fluoresc. 2021, 31, 185–193. [Google Scholar] [CrossRef] [PubMed]
- Xu, H.; Yang, X.; Li, G.; Zhao, C.; Liao, X. Green Synthesis of Fluorescent Carbon Dots for Selective Detection of Tartrazine in Food Samples. J. Agric. Food Chem. 2015, 63, 6707–6714. [Google Scholar] [CrossRef]
- Purbia, R.; Paria, S. A simple turn on fluorescent sensor for the selective detection of thiamine using coconut water derived luminescent carbon dots. Biosens. Bioelectron. 2016, 79, 467–475. [Google Scholar] [CrossRef]
- Amjadi, M.; Hallaj, T.; Mayan, M.A. Green synthesis of nitrogen-doped carbon dots from lentil and its application for colorimetric determination of thioridazine hydrochloride. RSC Adv. 2016, 6, 104467–104473. [Google Scholar] [CrossRef]
- Akhgari, F.; Samadi, N.; Farhadi, K.; Akhgari, M. A green one-pot synthesis of nitrogen and sulfur co-doped carbon quantum dots for sensitive and selective detection of cephalexin. Can. J. Chem. 2017, 95, 641–648. [Google Scholar] [CrossRef]
- Liu, Y.; Zhao, Y.; Zhang, Y. One-step green synthesized fluorescent carbon nanodots from bamboo leaves for copper(II) ion detection. Sens. Actuators B Chem. 2014, 196, 647–652. [Google Scholar] [CrossRef]
- Sha, Y.; Lou, J.; Bai, S.; Wu, D.; Liu, B.; Ling, Y. Hydrothermal synthesis of nitrogen-containing carbon nanodots as the high-efficient sensor for copper(II) ions. Mater. Res. Bull. 2013, 48, 1728–1731. [Google Scholar] [CrossRef]
- Mehta, V.N.; Jha, S.; Basu, H.; Singhal, R.K.; Kailasa, S.K. One-step hydrothermal approach to fabricate carbon dots from apple juice for imaging of mycobacterium and fungal cells. Sens. Actuators B Chem. 2015, 213, 434–443. [Google Scholar] [CrossRef]
- Arul, V.; Edison, T.N.J.I.; Lee, Y.R.; Sethuraman, M.G. Biological and catalytic applications of green synthesized fluorescent N-doped carbon dots using Hylocereus undatus. J. Photochem. Photobiol. B Biol. 2017, 168, 142–148. [Google Scholar]
- Mehta, V.N.; Jha, S.; Kailasa, S.K. One-pot green synthesis of carbon dots by using Saccharum officinarum juice for fluorescent imaging of bacteria (Escherichia coli) and yeast (Saccharomyces cerevisiae) cells. Mater. Sci. Eng. C 2014, 38, 20–27. [Google Scholar] [CrossRef] [PubMed]
- Song, Y.; Yan, X.; Li, Z.; Qu, L.; Zhu, C.; Ye, R.; Li, S.; Du, D.; Lin, Y. Highly photoluminescent carbon dots derived from linseed and their applications in cellular imaging and sensing. J. Mater. Chem. B 2018, 6, 3181–3187. [Google Scholar] [CrossRef]
- Wang, W.-J.; Xia, J.-M.; Feng, J.; He, M.-Q.; Chen, M.-L.; Wang, J.-H. Green preparation of carbon dots for intracellular pH sensing and multicolor live cell imaging. J. Mater. Chem. B 2016, 4, 7130–7137. [Google Scholar] [CrossRef] [PubMed]
- Zhao, X.J.; Zhang, W.L.; Zhou, Z.Q. Sodium hydroxide-mediated hydrogel of citrus pectin for preparation of fluorescent carbon dots for bioimaging. Colloids Surf. B Biointerfaces 2014, 123, 493–497. [Google Scholar] [CrossRef]
- Liu, Y.; Liu, Y.; Park, M.; Park, S.-J.; Zhang, Y.; Akanda, M.R.; Park, B.-Y.; Kim, H.Y. Green synthesis of fluorescent carbon dots from carrot juice for in vitro cellular imaging. Carbon Lett. 2017, 21, 61–67. [Google Scholar]
- Atchudan, R.; Edison, T.N.J.I.; Perumal, S.; Muthuchamy, N.; Lee, Y.R. Hydrophilic nitrogen-doped carbon dots from biowaste using dwarf banana peel for environmental and biological applications. Fuel 2020, 275, 117821. [Google Scholar] [CrossRef]
- Du, F.; Zhang, M.; Li, X.; Li, J.; Jiang, X.; Li, Z.; Hua, Y.; Shao, G.; Jin, J.; Shao, Q. Economical and green synthesis of bagasse-derived fluorescent carbon dots for biomedical applications. Nanotechnology 2014, 25, 315702. [Google Scholar] [CrossRef]
- Alam, A.-M.; Park, B.-Y.; Ghouri, Z.K.; Park, M.; Kim, H.-Y. Synthesis of carbon quantum dots from cabbage with down- and up-conversion photoluminescence properties: Excellent imaging agent for biomedical applications. Green Chem. 2015, 17, 3791–3797. [Google Scholar] [CrossRef]
- Ding, Z.; Li, F.; Wen, J.; Wang, X.; Sun, R. Gram-scale synthesis of single-crystalline graphene quantum dots derived from lignin biomass. Green Chem. 2018, 20, 1383–1390. [Google Scholar] [CrossRef]
- D’Souza, S.L.; Deshmukh, B.; Bhamore, J.R.; Rawat, K.A.; Lenka, N.; Kailasa, S.K. Synthesis of fluorescent nitrogen-doped carbon dots from dried shrimps for cell imaging and boldine drug delivery system. RSC Adv. 2016, 6, 12169–12179. [Google Scholar] [CrossRef]
- John, T.S.; Yadav, P.K.; Kumar, D.; Singh, S.K.; Hasan, S.H. Highly fluorescent carbon dots from wheat bran as a novel drug delivery system for bacterial inhibition. Luminescence 2020, 35, 913–923. [Google Scholar] [CrossRef] [PubMed]
- Yuan, Y.; Guo, B.; Hao, L.; Liu, N.; Lin, Y.; Guo, W.; Li, X.; Gu, B. Doxorubicin-loaded environmentally friendly carbon dots as a novel drug delivery system for nucleus targeted cancer therapy. Colloids Surf. B Biointerfaces 2017, 159, 349–359. [Google Scholar] [CrossRef] [PubMed]
- Sun, B.; Wu, F.; Zhang, Q.; Chu, X.; Wang, Z.; Huang, X.; Li, J.; Yao, C.; Zhou, N.; Shen, J. Insight into the effect of particle size distribution differences on the antibacterial activity of carbon dots. J. Colloid Interface Sci. 2021, 584, 505–519. [Google Scholar] [CrossRef]
- Saravanan, A.; Maruthapandi, M.; Das, P.; Luong, J.H.T.; Gedanken, A. Green Synthesis of Multifunctional Carbon Dots with Antibacterial Activities. Nanomaterials 2021, 11, 369. [Google Scholar] [CrossRef]
- Eskalen, H.; Çeşme, M.; Kerli, S.; Özğan, Ş. Green synthesis of water-soluble fluorescent carbon dots from rosemary leaves: Applications in food storage capacity, fingerprint detection, and antibacterial activity. J. Chem. Res. 2021, 45, 428–435. [Google Scholar] [CrossRef]
- Ma, Y.; Zhang, M.; Wang, H.; Wang, B.; Huang, H.; Liu, Y.; Kang, Z. N-doped carbon dots derived from leaves with low toxicity via damaging cytomembrane for broad-spectrum antibacterial activity. Mater. Today Commun. 2020, 24, 101222. [Google Scholar] [CrossRef]
- Boobalan, T.; Sethupathi, M.; Sengottuvelan, N.; Kumar, P.; Balaji, P.; Gulyás, B.; Padmanabhan, P.; Selvan, S.T.; Arun, A. Mushroom-Derived Carbon Dots for Toxic Metal Ion Detection and as Antibacterial and Anticancer Agents. ACS Appl. Nano Mater. 2020, 3, 5910–5919. [Google Scholar] [CrossRef]
- Castaing, V.; Sontakke, A.D.; Xu, J.; Fernandez-Carrion, A.J.; Genevois, C.; Tanabe, S.; Allix, M.; Viana, B. Persistent energy transfer in ZGO:Cr3+,Yb3+: A new strategy to design nano glass-ceramics featuring deep red and near infrared persistent luminescence. Phys. Chem. Chem. Phys. 2019, 21, 19458–19468. [Google Scholar] [CrossRef]
- Jia, Q.; Zheng, X.; Ge, J.; Liu, W.; Ren, H.; Chen, S.; Wen, Y.; Zhang, H.; Wu, J.; Wang, P. Synthesis of carbon dots from Hypocrella bambusae for bimodel fluorescence/photoacoustic imaging-guided synergistic photodynamic/photothermal therapy of cancer. J. Colloid Interface Sci. 2018, 526, 302–311. [Google Scholar] [CrossRef] [PubMed]
- Kim, D.; Jo, G.; Chae, Y.; Subramani, S.; Lee, B.Y.; Kim, E.J.; Ji, M.-K.; Sim, U.; Hyun, H. Bioinspired Camellia japonica carbon dots with high near-infrared absorbance for efficient photothermal cancer therapy. Nanoscale 2021, 13, 14426–14434. [Google Scholar] [CrossRef] [PubMed]
- Li, C.-L.; Ou, C.-M.; Huang, C.-C.; Wu, W.-C.; Chen, Y.-P.; Lin, T.-E.; Ho, L.-C.; Wang, C.-W.; Shih, C.-C.; Zhou, H.-C.; et al. Carbon dots prepared from ginger exhibiting efficient inhibition of human hepatocellular carcinoma cells. J. Mater. Chem. B 2014, 2, 4564. [Google Scholar] [CrossRef] [PubMed]
- Zhao, S.; Lan, M.; Zhu, X.; Xue, H.; Ng, T.-W.; Meng, X.; Lee, C.-S.; Wang, P.; Zhang, W. Green Synthesis of Bifunctional Fluorescent Carbon Dots from Garlic for Cellular Imaging and Free Radical Scavenging. ACS Appl. Mater. Inter. 2015, 7, 17054–17060. [Google Scholar] [CrossRef]
- Chen, W.; Li, D.; Tian, L.; Xiang, W.; Wang, T.; Hu, W.; Hu, Y.; Chen, S.; Chen, J.; Dai, Z. Synthesis of graphene quantum dots from natural polymer starch for cell imaging. Green Chem. 2018, 20, 4438–4442. [Google Scholar] [CrossRef]
- Sahu, S.; Behera, B.; Maiti, T.K.; Mohapatra, S. Simple one-step synthesis of highly luminescent carbon dots from orange juice: Application as excellent bio-imaging agents. Chem. Commun. 2012, 48, 8835. [Google Scholar] [CrossRef] [PubMed]
- Zhang, J.; Yuan, Y.; Liang, G.; Yu, S.-H. Scale-Up Synthesis of Fragrant Nitrogen-Doped Carbon Dots from Bee Pollens for Bioimaging and Catalysis. Adv. Sci. 2015, 2, 1500002. [Google Scholar] [CrossRef]
- Liang, Q.; Ma, W.; Shi, Y.; Li, Z.; Yang, X. Easy synthesis of highly fluorescent carbon quantum dots from gelatin and their luminescent properties and applications. Carbon 2013, 60, 421–428. [Google Scholar] [CrossRef]
- Kasibabu, B.S.B.; D’Souza, S.L.; Jha, S.; Kailasa, S.K. Imaging of Bacterial and Fungal Cells Using Fluorescent Carbon Dots Prepared from Carica papaya Juice. J. Fluoresc. 2015, 25, 803–810. [Google Scholar] [CrossRef]
- Yu, C.; Xuan, T.; Chen, Y.; Zhao, Z.; Sun, Z.; Li, H. A facile, green synthesis of highly fluorescent carbon nanoparticles from oatmeal for cell imaging. J. Mater. Chem. C 2015, 3, 9514–9518. [Google Scholar] [CrossRef]
- Zhang, Z.; Sun, W.; Wu, P. Highly Photoluminescent Carbon Dots Derived from Egg White: Facile and Green Synthesis, Photoluminescence Properties, and Multiple Applications. ACS Sustain. Chem. Eng. 2015, 3, 1412–1418. [Google Scholar] [CrossRef]
- Wei, J.; Zhang, X.; Sheng, Y.; Shen, J.; Huang, P.; Guo, S.; Pan, J.; Feng, B. Dual functional carbon dots derived from cornflour via a simple one-pot hydrothermal route. Mater. Lett. 2014, 123, 107–111. [Google Scholar] [CrossRef]
- Shi, W.; Fan, H.; Ai, S.; Zhu, L. Preparation of fluorescent graphene quantum dots from humic acid for bioimaging application. New J. Chem. 2015, 39, 7054–7059. [Google Scholar] [CrossRef]
- Wang, G.; Guo, Q.; Chen, D.; Liu, Z.; Zheng, X.; Xu, A.; Yang, S.; Ding, G. Facile and Highly Effective Synthesis of Controllable Lattice Sulfur-Doped Graphene Quantum Dots via Hydrothermal Treatment of Durian. ACS Appl. Mater. Inter. 2018, 10, 5750–5759. [Google Scholar] [CrossRef]
- Atchudan, R.; Jebakumar Immanuel Edison, T.N.; Perumal, S.; Lee, Y.R. Indian Gooseberry-Derived Tunable Fluorescent Carbon Dots as a Promise for In Vitro/In Vivo Multicolor Bioimaging and Fluorescent Ink. ACS Omega 2018, 3, 17590–17601. [Google Scholar] [CrossRef]
- Hou, J.; Wang, W.; Zhou, T.Y.; Wang, B.; Li, H.Y.; Ding, L. Synthesis and formation mechanistic investigation of nitrogen-doped carbon dots with high quantum yields and yellowish-green fluorescence. Nanoscale 2016, 8, 11185–11193. [Google Scholar] [CrossRef]
- Meena, R.; Singh, R.; Marappan, G.; Kushwaha, G.; Gupta, N.; Meena, R.; Gupta, J.P.; Agarwal, R.R.; Fahmi, N.; Kushwaha, O.S. Fluorescent carbon dots driven from ayurvedic medicinal plants for cancer cell imaging and phototherapy. Heliyon 2019, 5, e02483. [Google Scholar] [CrossRef] [Green Version]
- Zhang, X.; Wang, H.; Ma, C.; Niu, N.; Chen, Z.; Liu, S.; Li, J.; Li, S. Seeking value from biomass materials: Preparation of coffee bean shell-derived fluorescent carbon dots via molecular aggregation for antioxidation and bioimaging applications. Mater. Chem. Front. 2018, 2, 1269–1275. [Google Scholar] [CrossRef]
- Desai, M.L.; Jha, S.; Basu, H.; Singhal, R.K.; Park, T.-J.; Kailasa, S.K. Acid Oxidation of Muskmelon Fruit for the Fabrication of Carbon Dots with Specific Emission Colors for Recognition of Hg2+ Ions and Cell Imaging. ACS Omega 2019, 4, 19332–19340. [Google Scholar] [CrossRef] [Green Version]
- D’Angelis do ES Barbosa, C.; Corrêa, J.R.; Medeiros, G.A.; Barreto, G.; Magalhães, K.G.; De Oliveira, A.L.; Spencer, J.; Rodrigues, M.O.; Neto, B.A.D. Carbon Dots (C-dots) from Cow Manure with Impressive Subcellular Selectivity Tuned by Simple Chemical Modification. Chem. Eur. J. 2015, 21, 5055–5060. [Google Scholar] [CrossRef] [PubMed]
- Park, S.Y.; Lee, H.U.; Park, E.S.; Lee, S.C.; Lee, J.-W.; Jeong, S.W.; Kim, C.H.; Lee, Y.-C.; Huh, Y.S.; Lee, J. Photoluminescent Green Carbon Nanodots from Food-Waste-Derived Sources: Large-Scale Synthesis, Properties, and Biomedical Applications. ACS Appl. Mater. Inter. 2014, 6, 3365–3370. [Google Scholar] [CrossRef]
- Oza, G.; Oza, K.; Pandey, S.; Shinde, S.; Mewada, A.; Thakur, M.; Sharon, M.; Sharon, M. A Green Route Towards Highly Photoluminescent and Cytocompatible Carbon dot Synthesis and its Separation Using Sucrose Density Gradient Centrifugation. J. Fluoresc. 2015, 25, 9–14. [Google Scholar] [CrossRef] [PubMed]
- Dehvari, K.; Liu, K.Y.; Tseng, P.-J.; Gedda, G.; Girma, W.M.; Chang, J.-Y. Sonochemical-assisted green synthesis of nitrogen-doped carbon dots from crab shell as targeted nanoprobes for cell imaging. J. Taiwan Inst. Chem. Eng. 2019, 95, 495–503. [Google Scholar] [CrossRef]
- Feng, J.; Wang, W.-J.; Hai, X.; Yu, Y.-L.; Wang, J.-H. Green preparation of nitrogen-doped carbon dots derived from silkworm chrysalis for cell imaging. J. Mater. Chem. B 2016, 4, 387–393. [Google Scholar] [CrossRef] [PubMed]
- Ramanan, V.; Thiyagarajan, S.K.; Raji, K.; Suresh, R.; Sekar, R.; Ramamurthy, P. Outright Green Synthesis of Fluorescent Carbon Dots from Eutrophic Algal Blooms for In Vitro Imaging. ACS Sustain. Chem. Eng. 2016, 4, 4724–4731. [Google Scholar] [CrossRef]
- Wang, Q.; Liu, X.; Zhang, L.; Lv, Y. Microwave-assisted synthesis of carbon nanodots through an eggshell membrane and their fluorescent application. Analyst 2012, 137, 5392. [Google Scholar] [CrossRef] [PubMed]
- Qin, X.; Lu, W.; Asiri, A.M.; Al-Youbi, A.O.; Sun, X. Microwave-assisted rapid green synthesis of photoluminescent carbon nanodots from flour and their applications for sensitive and selective detection of mercury(II) ions. Sens. Actuators B Chem. 2013, 184, 156–162. [Google Scholar] [CrossRef]
- Liu, X.; Li, T.; Hou, Y.; Wu, Q.; Yi, J.; Zhang, G. Microwave synthesis of carbon dots with multi-response using denatured proteins as carbon source. RSC Adv. 2016, 6, 11711–11718. [Google Scholar] [CrossRef]
- Feng, Y.; Zhong, D.; Miao, H.; Yang, X. Carbon dots derived from rose flowers for tetracycline sensing. Talanta 2015, 140, 128–133. [Google Scholar] [CrossRef] [PubMed]
- Bankoti, K.; Rameshbabu, A.P.; Datta, S.; Das, B.; Mitra, A.; Dhara, S. Onion derived carbon nanodots for live cell imaging and accelerated skin wound healing. J. Mater. Chem. B 2017, 5, 6579–6592. [Google Scholar] [CrossRef]
- Xue, M.; Zou, M.; Zhao, J.; Zhan, Z.; Zhao, S. Green preparation of fluorescent carbon dots from lychee seeds and their application for the selective detection of methylene blue and imaging in living cells. J. Mater. Chem. B 2015, 3, 6783–6789. [Google Scholar] [CrossRef]
- Hsu, P.-C.; Shih, Z.-Y.; Lee, C.-H.; Chang, H.-T. Synthesis and analytical applications of photoluminescent carbon nanodots. Green Chem. 2012, 14, 917. [Google Scholar] [CrossRef]
- Essner, J.B.; Laber, C.H.; Ravula, S.; Polo-Parada, L.; Baker, G.A. Pee-dots: Biocompatible fluorescent carbon dots derived from the upcycling of urine. Green Chem. 2016, 18, 243–250. [Google Scholar] [CrossRef] [Green Version]
- Zhou, J.; Sheng, Z.; Han, H.; Zou, M.; Li, C. Facile synthesis of fluorescent carbon dots using watermelon peel as a carbon source. Mater. Lett. 2012, 66, 222–224. [Google Scholar] [CrossRef]
- Teng, X.; Ma, C.; Ge, C.; Yan, M.; Yang, J.; Zhang, Y.; Morais, P.C.; Bi, H. Green synthesis of nitrogen-doped carbon dots from konjac flour with “off–on” fluorescence by Fe3+ and l-lysine for bioimaging. J. Mater. Chem. B 2014, 2, 4631. [Google Scholar] [CrossRef] [PubMed]
- Hu, Y.; Chen, Z.; Lai, F.; Li, J. Biomass-codoped carbon dots: Efficient fluorescent probes for isocarbophos ultrasensitive detection and for living cells dual-color imaging. J. Mater. Sci. 2019, 54, 8627–8639. [Google Scholar] [CrossRef]
- Murugan, N.; Sundramoorthy, A.K. Green synthesis of fluorescent carbon dots from Borassus flabellifer flowers for label-free highly selective and sensitive detection of Fe3+ ions. New J. Chem. 2018, 42, 13297–13307. [Google Scholar] [CrossRef]
- Ma, X.; Dong, Y.; Sun, H.; Chen, N. Highly fluorescent carbon dots from peanut shells as potential probes for copper ion: The optimization and analysis of the synthetic process. Mater. Today Chem. 2017, 5, 1–10. [Google Scholar] [CrossRef]
- Baruah, U.; Gogoi, N.; Konwar, A.; Jyoti Deka, M.; Chowdhury, D.; Majumdar, G. Carbon Dot Based Sensing of Dopamine and Ascorbic Acid. J. Nanoparticles 2014, 2014, 1–8. [Google Scholar] [CrossRef]
- Xue, M.; Zhan, Z.; Zou, M.; Zhang, L.; Zhao, S. Green synthesis of stable and biocompatible fluorescent carbon dots from peanut shells for multicolor living cell imaging. New J. Chem. 2016, 40, 1698–1703. [Google Scholar] [CrossRef]
- Cong, S.; Liu, K.; Qiao, F.; Song, Y.; Tan, M. Biocompatible fluorescent carbon dots derived from roast duck for in vitro cellular and in vivo C. elegans bio-imaging. Methods 2019, 168, 76–83. [Google Scholar] [CrossRef]
- Wang, H.; Zhang, M.; Ma, Y.; Wang, B.; Shao, M.; Huang, H.; Liu, Y.; Kang, Z. Selective inactivation of Gram-negative bacteria by carbon dots derived from natural biomass: Artemisia argyi leaves. J. Mater. Chem. B 2020, 8, 2666–2672. [Google Scholar] [CrossRef]
- Chung, H.K.; Wongso, V.; Sambudi, N.S.; Isnaeni. Biowaste-derived carbon dots/hydroxyapatite nanocomposite as drug delivery vehicle for acetaminophen. J. Sol-Gel Sci. Technol. 2020, 93, 214–223. [Google Scholar] [CrossRef]
- Wang, X.; Zhang, Y.; Kong, H.; Cheng, J.; Zhang, M.; Sun, Z.; Wang, S.; Liu, J.; Qu, H.; Zhao, Y. Novel mulberry silkworm cocoon-derived carbon dots and their anti-inflammatory properties. Artif. Cells Nanomed. Biotechnol. 2020, 48, 68–76. [Google Scholar] [CrossRef] [PubMed]
- Xue, M.; Zhao, J.; Zhan, Z.; Zhao, S.; Lan, C.; Ye, F.; Liang, H. Dual functionalized natural biomass carbon dots from lychee exocarp for cancer cell targetable near-infrared fluorescence imaging and photodynamic therapy. Nanoscale 2018, 10, 18124–18130. [Google Scholar] [CrossRef] [PubMed]
- Fahmi, M.Z.; Haris, A.; Permana, A.J.; Nor Wibowo, D.L.; Purwanto, B.; Nikmah, Y.L.; Idris, A. Bamboo leaf-based carbon dots for efficient tumor imaging and therapy. RSC Adv. 2018, 8, 38376–38383. [Google Scholar] [CrossRef] [Green Version]
- Cheng, C.; Shi, Y.; Li, M.; Xing, M.; Wu, Q. Carbon quantum dots from carbonized walnut shells: Structural evolution, fluorescence characteristics, and intracellular bioimaging. Mater. Sci. Eng. C 2017, 79, 473–480. [Google Scholar] [CrossRef]
- Janus, Ł.; Piątkowski, M.; Radwan-Pragłowska, J.; Bogdał, D.; Matysek, D. Chitosan-based carbon quantum dots for biomedical applications: Synthesis and characterization. Nanomaterials 2019, 9, 274. [Google Scholar] [CrossRef] [Green Version]
- Qu, D.; Zheng, M.; Zhang, L.; Zhao, H.; Xie, Z.; Jing, X.; Haddad, R.E.; Fan, H.; Sun, Z. Formation mechanism and optimization of highly luminescent N-doped graphene quantum dots. Sci. Rep. 2014, 4, 1–11. [Google Scholar] [CrossRef]
- Zhang, R.; Chen, W. Nitrogen-doped carbon quantum dots: Facile synthesis and application as a “turn-off” fluorescent probe for detection of Hg2+ ions. Biosens. Bioelectron. 2014, 55, 83–90. [Google Scholar] [CrossRef] [PubMed]
- Kurian, M.; Paul, A. Recent trends in the use of green sources for carbon dot synthesis-A short review. Carbon Trends 2021, 100032. [Google Scholar] [CrossRef]
- Lai, Z.; Guo, X.; Cheng, Z.; Ruan, G.; Du, F. Green synthesis of fluorescent carbon dots from cherry tomatoes for highly effective detection of trifluralin herbicide in soil samples. ChemistrySelect 2020, 5, 1956–1960. [Google Scholar]
- Jiao, X.-Y.; Li, L.-s.; Qin, S.; Zhang, Y.; Huang, K.; Xu, L. The synthesis of fluorescent carbon dots from mango peel and their multiple applications. Colloids Surfaces A Physicochem. Eng. Asp. 2019, 577, 306–314. [Google Scholar] [CrossRef]
- Lu, M.; Duan, Y.; Song, Y.; Tan, J.; Zhou, L. Green preparation of versatile nitrogen-doped carbon quantum dots from watermelon juice for cell imaging, detection of Fe3+ ions and cysteine, and optical thermometry. J. Mol. Liq. 2018, 269, 766–774. [Google Scholar] [CrossRef]
- Shi, Y.; Liu, X.; Wang, M.; Huang, J.; Jiang, X.; Pang, J.; Xu, F.; Zhang, X. Synthesis of N-doped carbon quantum dots from bio-waste lignin for selective irons detection and cellular imaging. Int. J. Biol. Macromol. 2019, 128, 537–545. [Google Scholar] [CrossRef]
- Atchudan, R.; Edison, T.N.J.I.; Perumal, S.; Selvam, N.C.S.; Lee, Y.R. Green synthesized multiple fluorescent nitrogen-doped carbon quantum dots as an efficient label-free optical nanoprobe for in vivo live-cell imaging. J. Photochem. Photobiol. A 2019, 372, 99–107. [Google Scholar] [CrossRef]
- Marouzi, S.; Darroudi, M.; Hekmat, A.; Sadri, K.; Oskuee, R.K. One-pot hydrothermal synthesis of carbon quantum dots from Salvia hispanica L. seeds and investigation of their biodistribution, and cytotoxicity effects. J. Environ. Chem. Eng. 2021, 9, 105461. [Google Scholar] [CrossRef]
- Liu, S.; Liu, Z.; Li, Q.; Xia, H.; Yang, W.; Wang, R.; Li, Y.; Zhao, H.; Tian, B. Facile synthesis of carbon dots from wheat straw for colorimetric and fluorescent detection of fluoride and cellular imaging. Spectrochim. Acta A Mol. Biomol. Spectrosc. 2021, 246, 118964. [Google Scholar]
- Atchudan, R.; Edison, T.N.J.I.; Perumal, S.; Vinodh, R.; Lee, Y.R. Multicolor-emitting carbon dots from Malus floribunda and their interaction with Caenorhabditis elegans. Mater. Lett. 2020, 261, 127153. [Google Scholar] [CrossRef]
- Atchudan, R.; Edison, T.N.J.I.; Shanmugam, M.; Perumal, S.; Somanathan, T.; Lee, Y.R. Sustainable synthesis of carbon quantum dots from banana peel waste using hydrothermal process for in vivo bioimaging. Phys. E Low-Dimens. Syst. Nanostruct. 2021, 126, 114417. [Google Scholar] [CrossRef]
- Shi, C.; Qi, H.; Ma, R.; Sun, Z.; Xiao, L.; Wei, G.; Huang, Z.; Liu, S.; Li, J.; Dong, M. N, S-self-doped carbon quantum dots from fungus fibers for sensing tetracyclines and for bioimaging cancer cells. Mater. Sci. Eng. C 2019, 105, 110132. [Google Scholar] [CrossRef] [PubMed]
- Ghosh, S.; Ghosal, K.; Mohammad, S.A.; Sarkar, K. Dendrimer functionalized carbon quantum dot for selective detection of breast cancer and gene therapy. Chem. Eng. J. 2019, 373, 468–484. [Google Scholar] [CrossRef]
- Sahoo, N.K.; Jana, G.C.; Aktara, M.N.; Das, S.; Nayim, S.; Patra, A.; Bhattacharjee, P.; Bhadra, K.; Hossain, M. Carbon dots derived from lychee waste: Application for Fe3+ ions sensing in real water and multicolor cell imaging of skin melanoma cells. Mater. Sci. Eng. C 2020, 108, 110429. [Google Scholar] [CrossRef] [PubMed]
- Tadesse, A.; Hagos, M.; RamaDevi, D.; Basavaiah, K.; Belachew, N. Fluorescent-nitrogen-doped carbon quantum dots derived from citrus lemon juice: Green synthesis, mercury (II) ion sensing, and live cell imaging. ACS omega 2020, 5, 3889–3898. [Google Scholar]
- D’souza, S.L.; Chettiar, S.S.; Koduru, J.R.; Kailasa, S.K. Synthesis of fluorescent carbon dots using Daucus carota subsp. sativus roots for mitomycin drug delivery. Optik 2018, 158, 893–900. [Google Scholar] [CrossRef]
- Babu, P.J.; Saranya, S.; Singh, Y.D.; Venkataswamy, M.; Raichur, A.M.; Doble, M. Photoluminescence carbon nano dots for the conductivity based optical sensing of dopamine and bioimaging applications. Opt. Mater. 2021, 117, 111120. [Google Scholar] [CrossRef]
- Vandarkuzhali, S.A.A.; Natarajan, S.; Jeyabalan, S.; Sivaraman, G.; Singaravadivel, S.; Muthusubramanian, S.; Viswanathan, B. Pineapple peel-derived carbon dots: Applications as sensor, molecular keypad lock, and memory device. ACS Omega 2018, 3, 12584–12592. [Google Scholar]
- Raji, K.; Ramanan, V.; Ramamurthy, P. Facile and green synthesis of highly fluorescent nitrogen-doped carbon dots from jackfruit seeds and its applications towards the fluorimetric detection of Au3+ ions in aqueous medium and in in vitro multicolor cell imaging. New J. Chem. 2019, 43, 11710–11719. [Google Scholar] [CrossRef]
- Kumari, S.; Sharma, N.; Sahi, S.V. Advances in Cancer Therapeutics: Conventional Thermal Therapy to Nanotechnology-Based Photothermal Therapy. Pharmaceutics 2021, 13, 1174. [Google Scholar] [CrossRef]
- Molaei, M.J. Principles, mechanisms, and application of carbon quantum dots in sensors: A review. Anal. Methods 2020, 12, 1266–1287. [Google Scholar] [CrossRef]
- Xu, Q.; Zhou, Q.; Hua, Z.; Xue, Q.; Zhang, C.; Wang, X.; Pan, D.; Xiao, M. Single-Particle Spectroscopic Measurements of Fluorescent Graphene Quantum Dots. ACS Nano 2013, 7, 10654–10661. [Google Scholar] [CrossRef] [PubMed] [Green Version]
- Wang, L.L.; Hu, C.; Shao, L.Q. The antimicrobial activity of nanoparticles: Present situation and prospects for the future. Int. J. Nanomed. 2017, 12, 1227–1249. [Google Scholar] [CrossRef] [PubMed] [Green Version]
- Dong, X.L.; Liang, W.X.; Meziani, M.J.; Sun, Y.P.; Yang, L.J. Carbon Dots as Potent Antimicrobial Agents. Theranostics 2020, 10, 671–686. [Google Scholar] [CrossRef] [PubMed]
- Ghirardello, M.; Ramos-Soriano, J.; Galan, M.C. Carbon Dots as an Emergent Class of Antimicrobial Agents. Nanomaterials 2021, 11, 1877. [Google Scholar] [CrossRef] [PubMed]
- Li, Y.B.; Bai, G.X.; Zeng, S.J.; Hao, J.H. Theranostic Carbon Dots with Innovative NIR-II Emission for in Vivo Renal-Excreted Optical Imaging and Photothermal Therapy. ACS Appl. Mater. Inter. 2019, 11, 4737–4744. [Google Scholar] [CrossRef] [PubMed]


| Source | Methods | Applied Ex./Emit. (nm) | QY(%) | Application | Applied Concentration | Ref. |
|---|---|---|---|---|---|---|
| Lemon juice | Solvothermal | 440–600/575–650 | 28% | In vivo bioimaging | 100 μL (20 μg/mL) | [22] |
| Taxus leaf | Solvothermal | 380–580/673 | 59% | In vivo bioimaging | 20 mg/kg | [23] |
| Wedelia trilobata | Solvothermal | 370–470/483–520, 654 | H2O: 10.52% EtOH: 18.16% | Glutathione sensing and cell imaging | 50–400 μg/mL | [24] |
| Leek | Solvothermal | 390–450; 325–385/440–500, 676; 440 | DCD: 1.7% SCD: 1.14% | Cell imaging, Cu2+ and tetracycline sensing | 0.5 mg/ mL | [25] |
| Lemon juice | Solvothermal | 237, 279, 570–670/704 | 31% | In vivo bioimaging | 50 μL (30 μg/mL) | [26] |
| Plum | Solvothermal | 328–418/450–550 | 0.54% | Doxorubicin sensing | 200 μL (1.0 mg/mL) | [27] |
| F. nucleatum | Hydrothermal | 300–400/450–470 | 9.9% | In vivo bioimaging and Fe3+ sensing | 10 μL/ g (0.7 mg/mL) | [28] |
| Green pepper | Hydrothermal | 310–380/400–460 | 8.7% | Fe3+ sensing and cell imaging | 50 mg/mL | [29] |
| Papaya | Hydrothermal | 350–490/445–530 | H2O: 18.98% EtOH: 18.39% | Fe3+ sensing and cell imaging | 100, 175 μL (0.94 mg/mL) 100, 175 μL (1.17 mg/mL) | [30] |
| P. avium | Hydrothermal | 280–360/411–430 | 13% | Fe3+ sensing and cell imaging | 0–40 μL | [31] |
| Honey | Hydrothermal | 320–410/410–475 | 19.8% | Fe3+ sensing and cell imaging | 40 μL (1 mg/mL) | [32] |
| Sweet potato | Hydrothermal | 300–410/406–486 | 8.64% | Fe3+ sensing and cell imaging | 0–100 μg/mL | [33] |
| Black tea | Hydrothermal | 290–420/398–490 | n/a | Fe3+ sensing | 990 μL (8 μg/mL) | [34] |
| Fish-scale | Hydrothermal | 220–390/425–455 | 6.9% | Fe3+ sensing | 5 mg/mL | [35] |
| Kiwi | Hydrothermal | 300–450/432–500 | 14%/19% | Fe3+ sensing | 0.5 mL | [36] |
| Goose feather | Hydrothermal | 300–500/410–560 | 17.1% | Fe3+ sensing | 1 mL | [37] |
| Cranberry | Hydrothermal | 300–500/410–540 | 10.85% | Fe3+ sensing | n/a | [38] |
| Potato | Hydrothermal | 323/405 | 15% | Fe3+ sensing | n/a | [39] |
| Boswellia ovalifoliolata bark | Hydrothermal | 275–440/400–535 | 10.2% | Fe3+ sensing | 20 μg/mL | [40] |
| Rosin | Hydrothermal | 290–370/425–475 | 1.22% | Fe3+ sensing and cell imaging | 1.25–160 μg/mL | [41] |
| Coriander leaf | Hydrothermal | 320–480/400–510 | 6.48% | Fe3+ sensing, cell imaging, and antioxidant | 0–1.0 mg/mL | [42] |
| Mint leaf | Hydrothermal | 330–420/410–500 | 7.64% | Fe3+ and ascorbic acid sensing | n/a | [43] |
| Leek | Hydrothermal | 300–460/449–534 | n/a | DDVP sensing and cell imaging | 0–300 mg/mL | [44] |
| Peach gum | Hydrothermal | 330–450/327–505 | 28.46% | Au3+ sensing and cell imaging | 0.5 mL (20 mg/mL) | [45] |
| Tomato | Hydrothermal | 367/440 | n/a | Carcinoembryonic antigen and aptamer sensing | 1 μg/mL | [46] |
| Bean pod and onion | Hydrothermal | 310–380/410–450 | 5.55% | Ag1+ sensing and cell imaging | 200 μg/mL | [47] |
| D. Salina | Hydrothermal | 310–400/400–475 | 8% | Hg2+ and Cr4+ sensing and cell imaging | 0–75 μg/mL | [48] |
| Chinese yam | Hydrothermal | 280–440/400–525 | 9.3% | 6-mercaptopurine and Hg2+ sensing | n/a | [49] |
| Pomelo peel | Hydrothermal | 365/444 | 6.9% | Hg2+ sensing | n/a | [50] |
| Strawberry | Hydrothermal | 344–440/427–500 | 6.3% | Hg2+ sensing | 75 μL | [51] |
| Cucumber | Hydrothermal | 418–518/514–571 | 3.25% | Hg2+ sensing | n/a | [52] |
| Highland barley | Hydrothermal | 340–480/450–525 | 14.4% | Hg2+ sensing | 0.05 mg/mL | [53] |
| Lemon peel | Hydrothermal | 300–540/441–605 | 14% | Cr6+ sensing | n/a | [54] |
| Elaeagnus angustifolia | Hydrothermal | 310–410/290–450 | 16.8% | Tartrazine sensing | n/a | [55] |
| Aloe | Hydrothermal | 370–480/443–525 | 10.37% | Tartrazine sensing | n/a | [56] |
| Coconut water | Hydrothermal | 340–450/430–500 | 2.8% | Thiamine sensing and cell imaging | n/a | [57] |
| Lentil | Hydrothermal | 310–390/400–460 | 10% | Thioridazine hydrochloride sensing | 200 μL | [58] |
| Pomegranate juice | Hydrothermal | 280–350/350–600 | 4.8% | Cephalexin sensing | 30 μL (1.0 mg/mL) | [59] |
| Bamboo leaf | Hydrothermal | 365–525/440–540 | 7.1% | Cu2+ sensing | n/a | [60] |
| Pipe tobacco | Hydrothermal | 310–430/425–515 | 3.2% | Cu2+ sensing | n/a | [61] |
| Apple juice | Hydrothermal | 300–540/465–565 | 4.27% | Cell imaging | 10 μg/mL | [62] |
| Hylocereus undatus | Hydrothermal | 275–380/400–450 | n/a | Cell imaging | 0–50 μL/mL | [63] |
| Saccharum officinarum | Hydrothermal | 300–540/450–550 | 5.76% | Cell imaging | 0–400 mg/mL | [64] |
| Linseed | Hydrothermal | 350–450/503 | 61% | Cell imaging | 0.04 mg/mL | [65] |
| Shiitake mushroom | Hydrothermal | 330–450/410–500 | 5.5% | Cell imaging and pH sensing | 2 mg/mL | [66] |
| Citrus | Hydrothermal | 360–500/460–554 | 1.1% | Cell imaging | 30 μL (1.0 mg/mL) | [67] |
| Carrot | Hydrothermal | 360–520/442–565 | 5.16% | Cell imaging | 700 μg/mL | [68] |
| Dwarf banana | Hydrothermal | 310–460/395–505 | 23% | Cell imaging | 0–200 μg/mL | [69] |
| Bagasse | Hydrothermal | 330–510/450–550 | 12.3% | Cell imaging and biolabeling | 100 μg/mL | [70] |
| Cabbage | Hydrothermal | 276, 320/432–584 | 16.5% | Cell imaging | 100 μL (20–1000 μg/mL) | [71] |
| Alkali lignin | Hydrothermal | 280–450/410–510 | 21% | Cell imaging | 0–100 μg/mL | [72] |
| Shrimp | Hydrothermal | 360–530/430–550 | 54% | Cell imaging and drug delivery | 10–500 μg/mL | [73] |
| Wheat bran | Hydrothermal | 360–540/460–600 | 33.23% | Cell imaging and drug delivery | 2 mg/mL | [74] |
| Milk | Hydrothermal | 360/450 | n/a | Cell imaging and anticancer drug delivery | 100–600 μg/mL | [75] |
| Chlorhexidine gluconate | Hydrothermal | 360–560/480–600 | s-CGCDs: 2.6% m-CGCDs: 11.3% l-CGCDs: 8.0% | Antibacterial and cell imaging | 0–150 μg/mL | [76] |
| Turmeric leaf | Hydrothermal | 310–470/429–520 | n/a | Anti-bacterial | 0–1.0 mg/mL | [77] |
| Rosemary | Hydrothermal | 332–422/424–500 | n/a | Anti-bacterial | 12 μg/mL | [78] |
| Osmanthus leaf, tea leaf, and milk vetch | Hydrothermal | 450/530 | n/a | Antibacterial and cell imaging | 0–1000 μg/mL | [79] |
| Mushroom | Hydrothermal | 300–500/372–545 | n/a | Anti-bacterial, anti-cancer, and Pb2+ sensing | 0–25 μg/mL | [80] |
| Watermelon | Hydrothermal | 808/900–1200 | 0.4% | Photothermal therapy and cell imaging | 0–20 mg/mL | [81] |
| Hypocrella Bambusa | Hydrothermal | 540–590/600–650 | n/a | Photodynamic and photothermal therapy | 0–200 μg/mL | [82] |
| Camellia japonica | Hydrothermal | 360/400–700 | n/a | Photodynamic and photothermal therapy | 45 μg/mL | [83] |
| Ginger | Hydrothermal | 325–445/400–500 | 13.4% | Cancer inhibition and cell imaging | 440 μg | [84] |
| Garlic | Hydrothermal | 320–580/380–600 | 17.5% | Cell imaging | 0–1 mg/mL | [85] |
| Starch | Hydrothermal | 340–500/452–545 | 21.7% | Cell imaging | 0.078–1.250 mg/mL | [86] |
| Orange juice | Hydrothermal | 360–450/441–510 | 26% | Cell imaging | 0–200 μg/mL | [87] |
| Bee pollen | Hydrothermal | 340–450/425–505 | c-CDs: 8.9% l-CDs: 6.1% | Cell imaging | 0.5 mg/mL | [88] |
| Gelatin | Hydrothermal | 300–500/430–580 | 31.6% | Cell imaging | 5.o mL (0.8 mg/mL) | [89] |
| Papaya | Hydrothermal | 300–500/450–550 | 7.0% | Cell imaging | 16.2–500 μg/mL | [90] |
| Oatmeal | Hydrothermal | 280–460/410–504 | 37.4% | Cell imaging | 1 mg/mL | [91] |
| Egg white | Hydrothermal | 290–450/415–540 | 61% | Cell imaging | 0.04 mg/mL | [92] |
| Corn flour | Hydrothermal | 320–500/401–553 | 7.7% | Cell imaging and Cu2+ sensing | 0–640 μg/mL | [93] |
| Humic acid | Hydrothermal | 320–520/440–540 | 5.7% | Cell imaging | 0.2 mg/mL | [94] |
| Durian | Hydrothermal | 400–560/605 | 79% | Cell imaging | 0–500 μg/mL | [95] |
| Gooseberry | Hydrothermal | 300–500/406–545 | 13.5% | C. elegans bioimaging | 50 μg/mL | [96] |
| Rice husk | Hydrothermal | 310–340/360–440 | 8.1% | Cell imaging | 50 μg/mL | [97] |
| Ayurvedic | Chemical ablation | 430/518 | n/a | Cell imaging and phototherapy | 0.5 mg/mL | [98] |
| Coffee bean shell | Chemical ablation | 280–520/368–557 | n/a | In vivo bioimaging and antioxidant | 0–400 μg/mL | [99] |
| Muskmelon | Chemical ablation | 342, 415, 425/432, 515, 554 | 7.07%/26.9%/14.3% | Hg2+ sensing and Cell imaging | 0.25–1.00 mg/mL | [100] |
| Cow manure | Chemical ablation | 320–450/400–530 | 0.65 | Cell imaging | 2.5 mg/mL | [101] |
| Food waste | Ultrasound irradiation | 330–405/400–470 | 2.85% | Cell imaging | 0–4 mg/mL | [102] |
| Citrus limone juice | Ultrasound irradiation | 230–450/325–538 | 12.1%/15% | Cell imaging | 2–100 mM | [103] |
| Crab shell | Ultrasound irradiation | 330–390/410–450 | 14.5% | Cell imaging | 0–1000 μg/mL | [104] |
| Silkworm | Microwave | 300–400/350–550 | 46% | Cell imaging | 0–15 mg/mL | [105] |
| Algal bloom | Microwave | 300–500/400–550 | 13% | Cell imaging | 10–1000 μg/mL | [106] |
| Eggshell | Microwave | 275/450 | 14% | Glutathione sensing | n/a | [107] |
| Flour | Microwave | 360–500/438–550 | 5.4% | Hg2+ sensing | 4 μg/mL | [108] |
| Protein | Microwave | 300–420/380–480 | 14% | Ag+ sensing | n/a | [109] |
| Rose flower | Microwave | 330–410/390–435 | 13.45% | Tetracycline sensing | n/a | [110] |
| Onion peel | Microwave | 300–470/520 | n/a | Skin wound healing | 1.5 mg/mL | [111] |
| Lychee | Pyrolysis | 365/440 | 10.6% | Cell imaging | 0–1000 μg/mL | [112] |
| Coffee | Pyrolysis | 350–500/400–600 | 3.8% | Cell imaging | 1.2 mg/mL | [113] |
| Urine | Pyrolysis | 275–625/450–650 | 14% | Cell imaging | 0.05–1.5 mg/mL | [114] |
| Watermelon peel | Pyrolysis | 310–550/490–580 | 7.1% | Cell imaging | n/a | [115] |
| Konjac flour | Pyrolysis | 400–700/575–760 | 13% | Fe3+ and L-lysine sensing and cell imaging | 200 μg/mL | [116] |
| Soybean and broccoli | Pyrolysis | 300–460/425–500 | 12.8% | Cu2+ sensing and cell imaging | 0–300 μg/mL | [117] |
| Borassus flabellifer | Pyrolysis | 300–400/350–403 | 11.73%/13.97%/10.83% | Fe3+ sensing | n/a | [118] |
| Peanut shell | Pyrolysis | 262–402/413–500 | 10.58% | Cu2+sensing | n/a | [119] |
| Assam tea | Pyrolysis | 340/446 | n/a | Dopamine and ascorbic acid sensing | n/a | [120] |
| Peanut shell | Pyrolysis | 320–480/441–524 | 9.91% | Cell imaging | 0–1.2 mg/mL | [121] |
| Roast duck | Pyrolysis | 300–400/400 | 10.53%/38.05% | C. elegans bioimaging | 15 mg/mL | [122] |
| Artemisia argyi leaf | Pyrolysis | 360–440/450–480 | n/a | Antibacterial and cell imaging | 0–150 μg/mL | [123] |
| Sugarcane bagasse | Pyrolysis | 405/550 | n/a | Drug delivery | n/a | [124] |
| Silkworm cocoon | Pyrolysis | 378/459 | 6.32% | Anti-inflammatory | 1.4 mg/mL; | [125] |
| Lychee exocarp | Pyrolysis | 365/423 | n/a | Drug delivery and cell imaging | 0–15 μg/mL | [126] |
| Bamboo leaf | Pyrolysis | 300–400/425–475 | n/a | Cell imaging and anticancer drug delivery | 0–400 μg/mL | [127] |
| Walnut shell | Pyrolysis | 360–540/500–560 | n/a | Cell imaging | 100 μg/mL | [128] |
| CDs Type | Modification | Goal | Ref. |
|---|---|---|---|
| Carbon quantum dots | Ethylene diamine | Nucleoli selection | [101] |
| Nitrogen-doped carbon dots | Folic acid | Cancer cell targeting | [104] |
| Carbon dots | Polyethylene glycol diamine; chlorin e6; transferrin | Photosensitizing and cancer cell targeting | |
| Carbon dots | 4-carboxy-benzyl boronic acid | Tumor cell targeting | [127] |
Publisher’s Note: MDPI stays neutral with regard to jurisdictional claims in published maps and institutional affiliations. |
© 2021 by the authors. Licensee MDPI, Basel, Switzerland. This article is an open access article distributed under the terms and conditions of the Creative Commons Attribution (CC BY) license (https://creativecommons.org/licenses/by/4.0/).
Share and Cite
Chan, M.-H.; Chen, B.-G.; Ngo, L.T.; Huang, W.-T.; Li, C.-H.; Liu, R.-S.; Hsiao, M. Natural Carbon Nanodots: Toxicity Assessment and Theranostic Biological Application. Pharmaceutics 2021, 13, 1874. https://doi.org/10.3390/pharmaceutics13111874
Chan M-H, Chen B-G, Ngo LT, Huang W-T, Li C-H, Liu R-S, Hsiao M. Natural Carbon Nanodots: Toxicity Assessment and Theranostic Biological Application. Pharmaceutics. 2021; 13(11):1874. https://doi.org/10.3390/pharmaceutics13111874
Chicago/Turabian StyleChan, Ming-Hsien, Bo-Gu Chen, Loan Thi Ngo, Wen-Tse Huang, Chien-Hsiu Li, Ru-Shi Liu, and Michael Hsiao. 2021. "Natural Carbon Nanodots: Toxicity Assessment and Theranostic Biological Application" Pharmaceutics 13, no. 11: 1874. https://doi.org/10.3390/pharmaceutics13111874