
Molecular-Level Release of Coumarin-3-Carboxylic Acid and Warfarin-Derivatives from BSA-Based Hydrogels


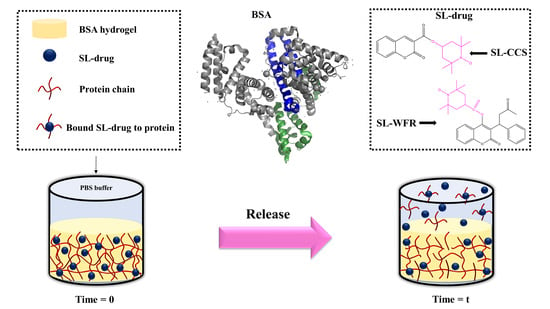
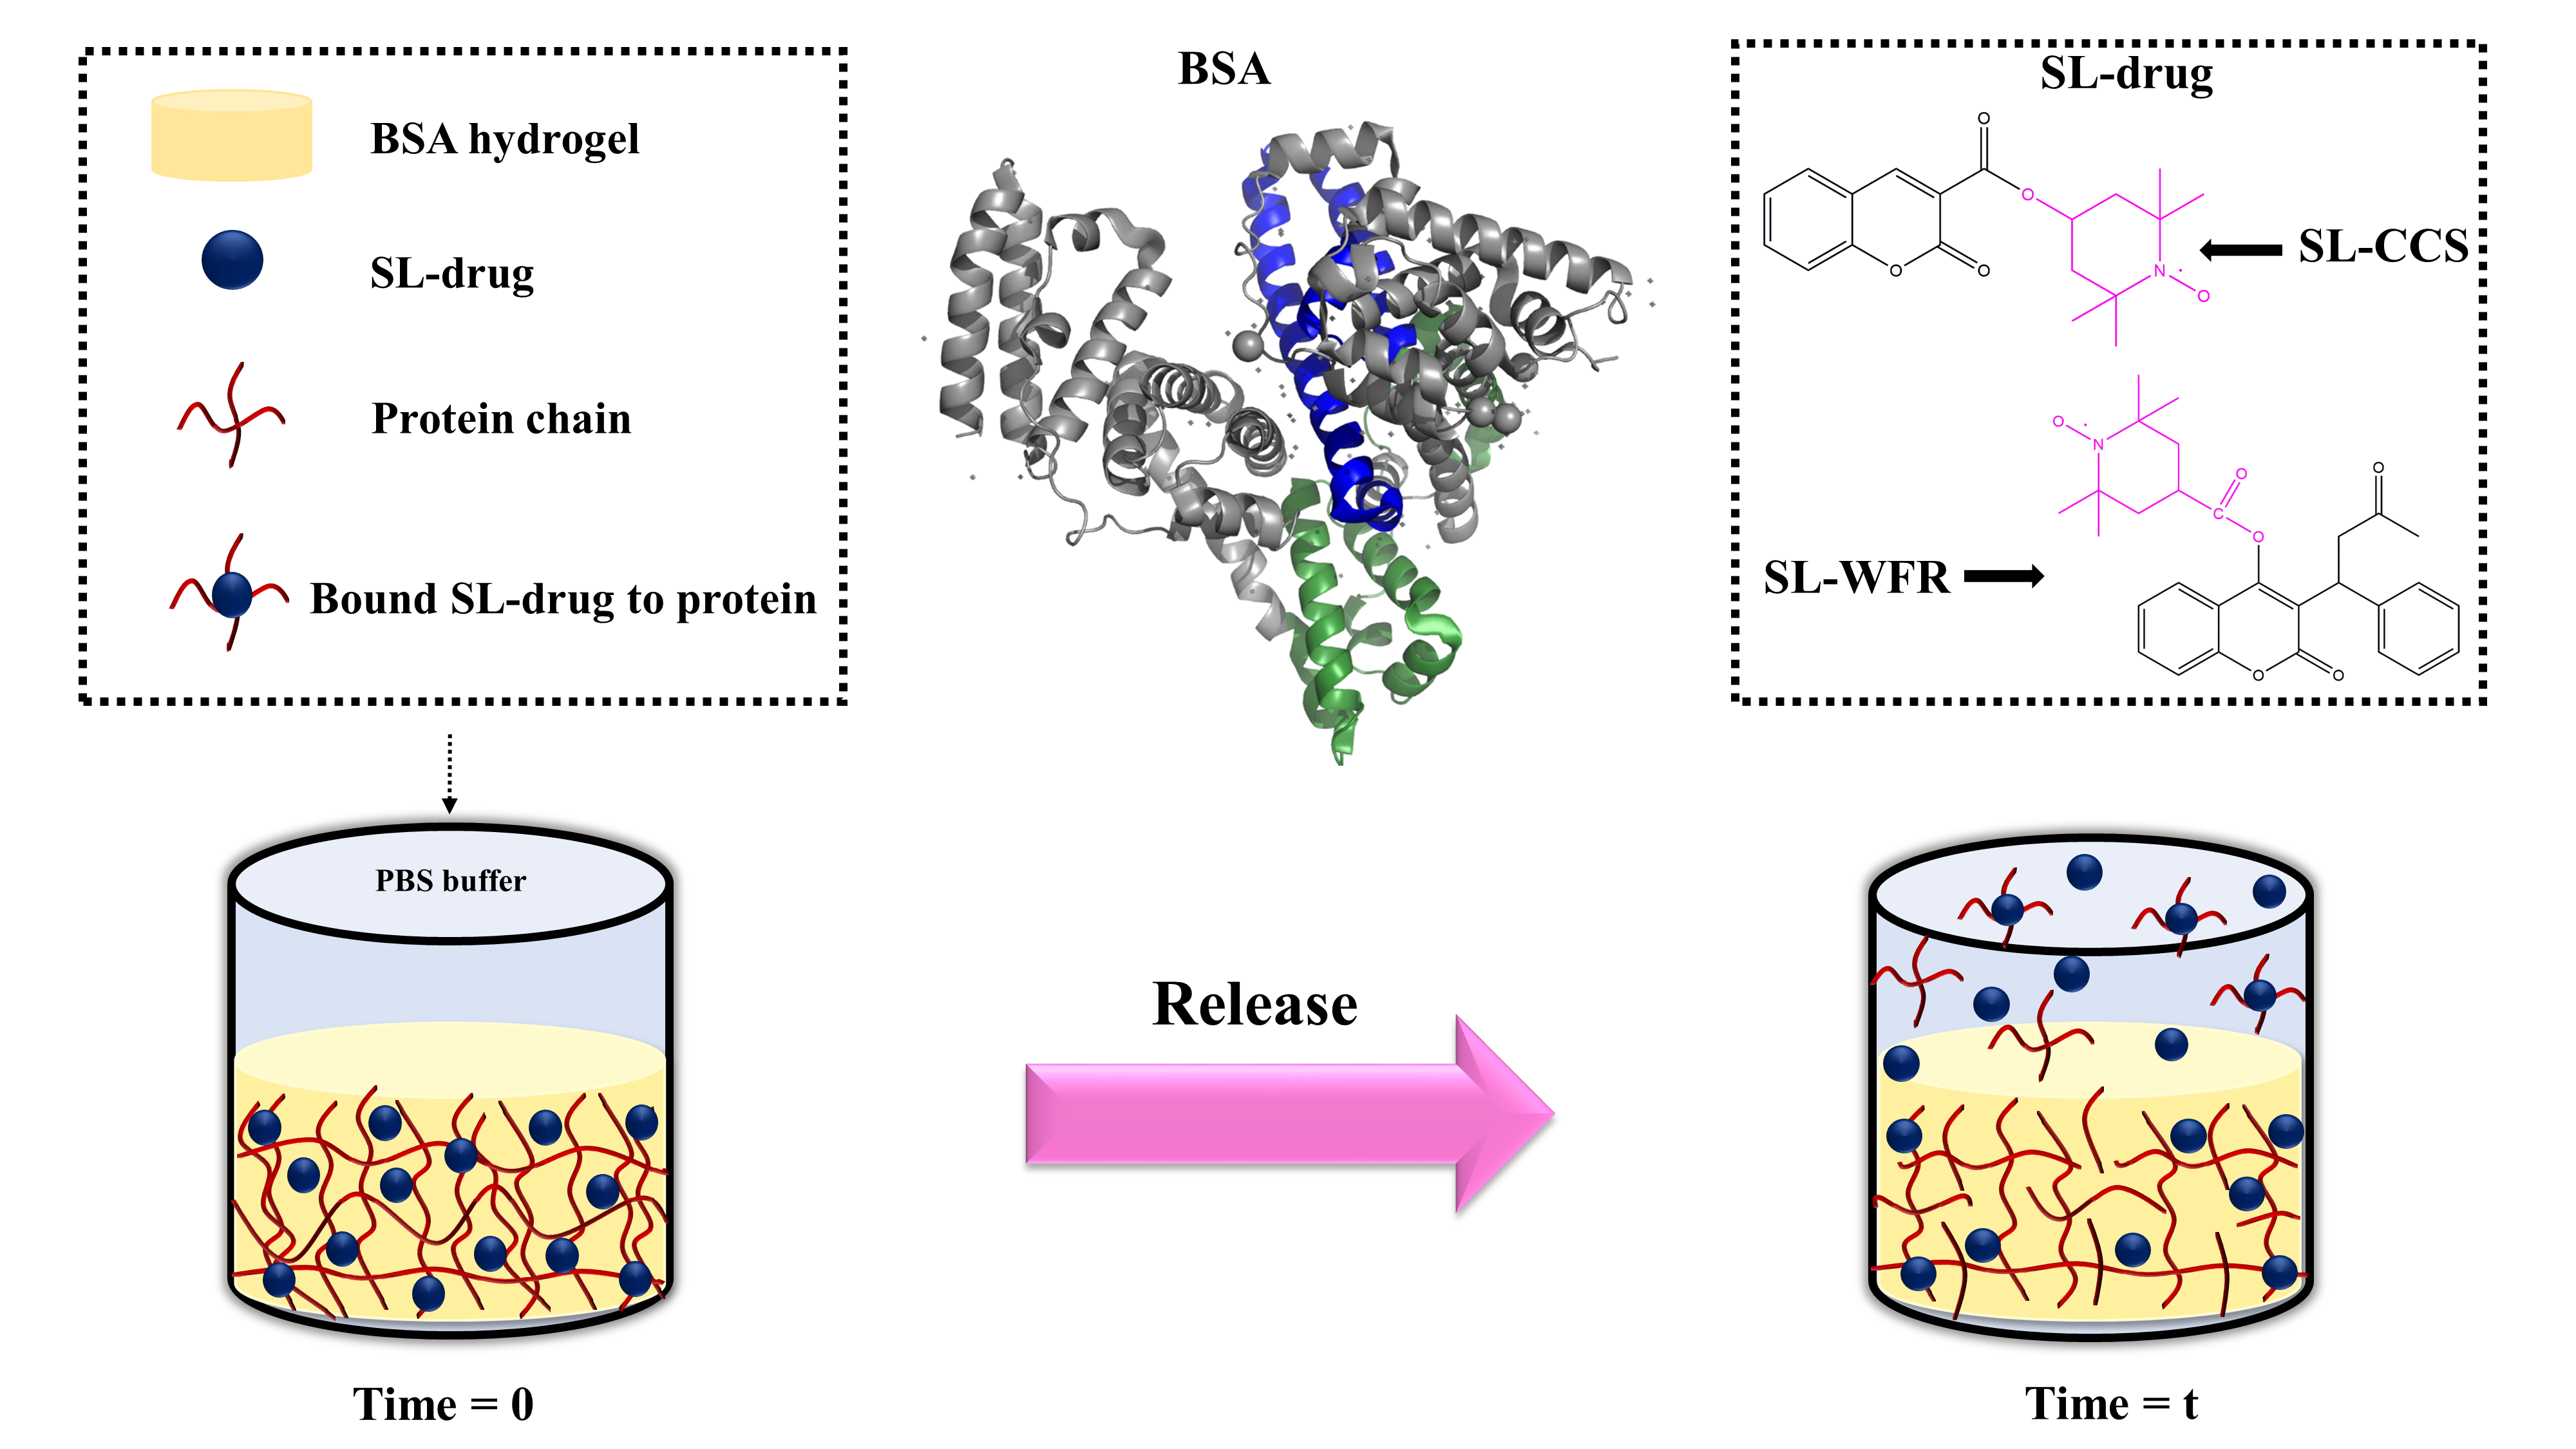
Abstract
:
1. Introduction
2. Experimental Section
2.1. Materials
2.2. Methods
2.3. In Vitro Drug Release
2.4. Rheological Characterization
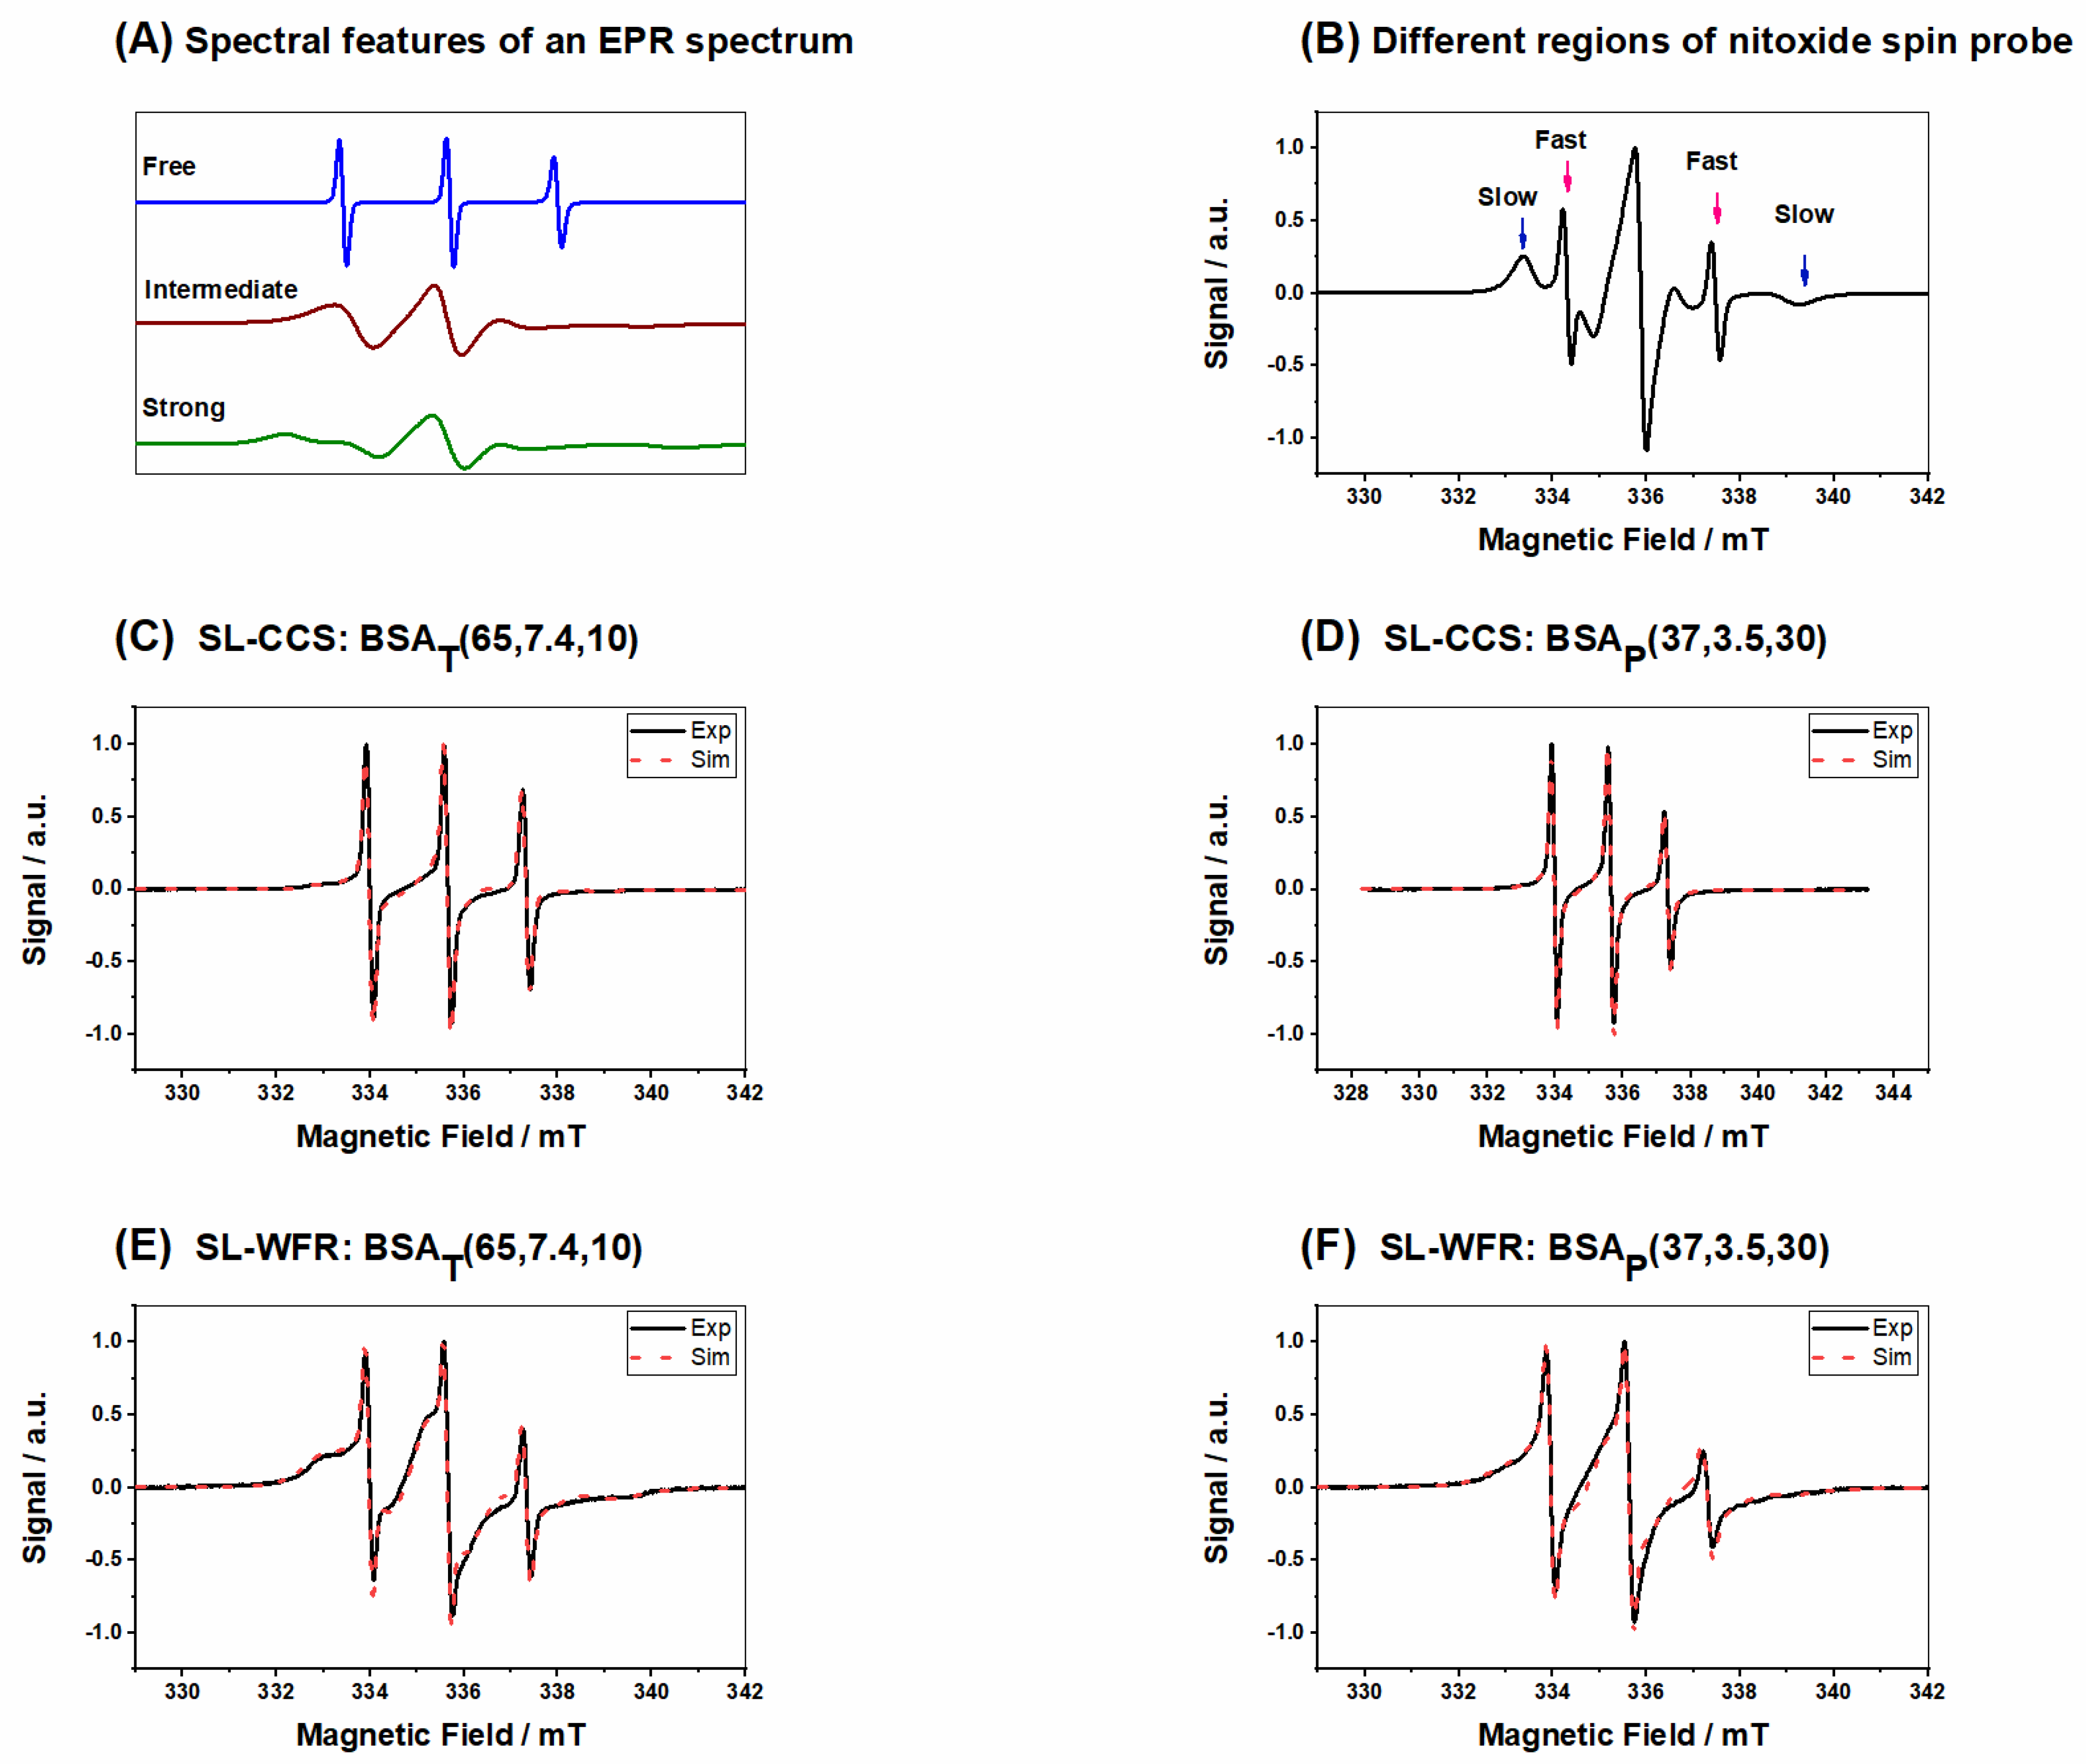
2.5. Continuous Wave Electron Paramagnetic Resonance (CW EPR) Spectroscopy
2.6. Electron Paramagnetic Resonance Imaging
2.7. Dynamic Light Scattering
3. Results and Discussion
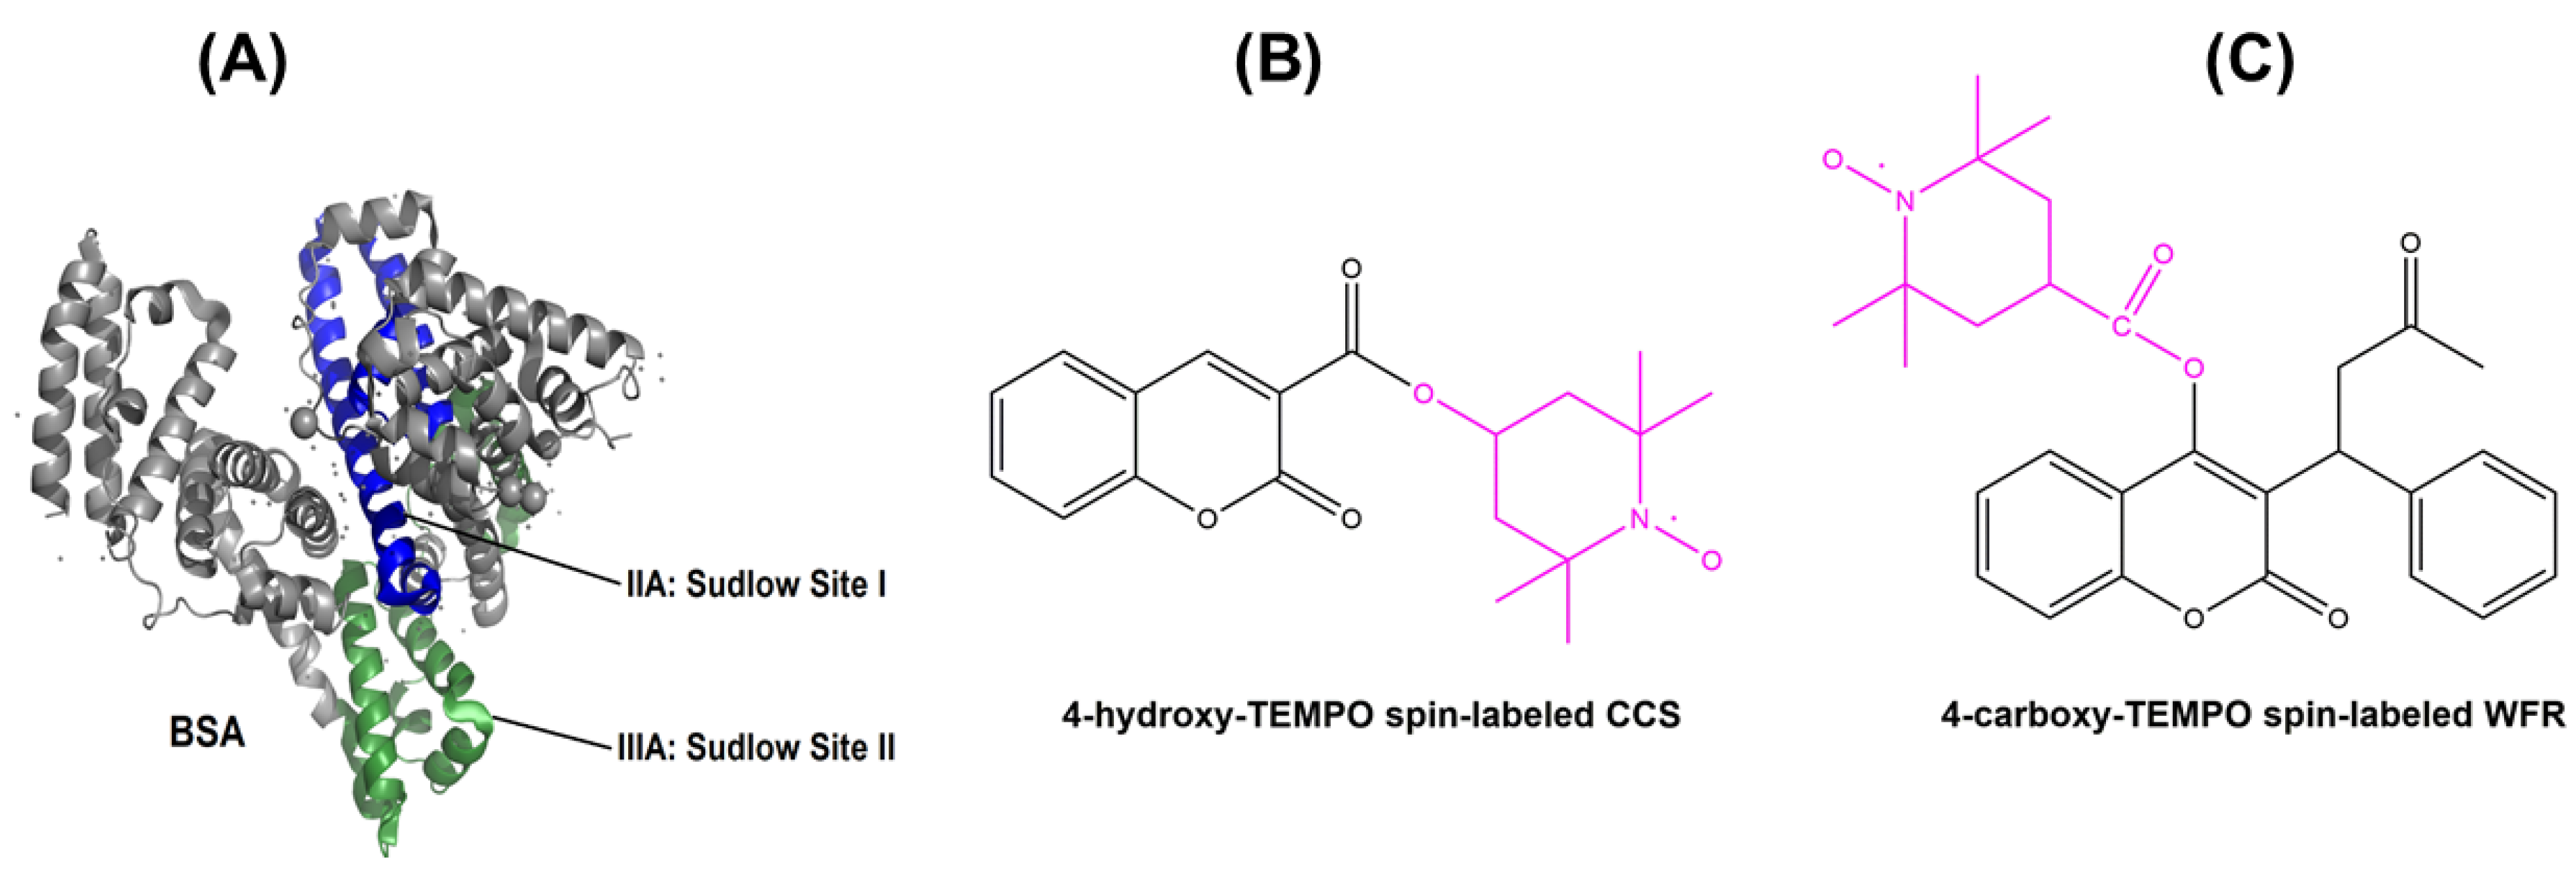
3.1. Rheological Measurement
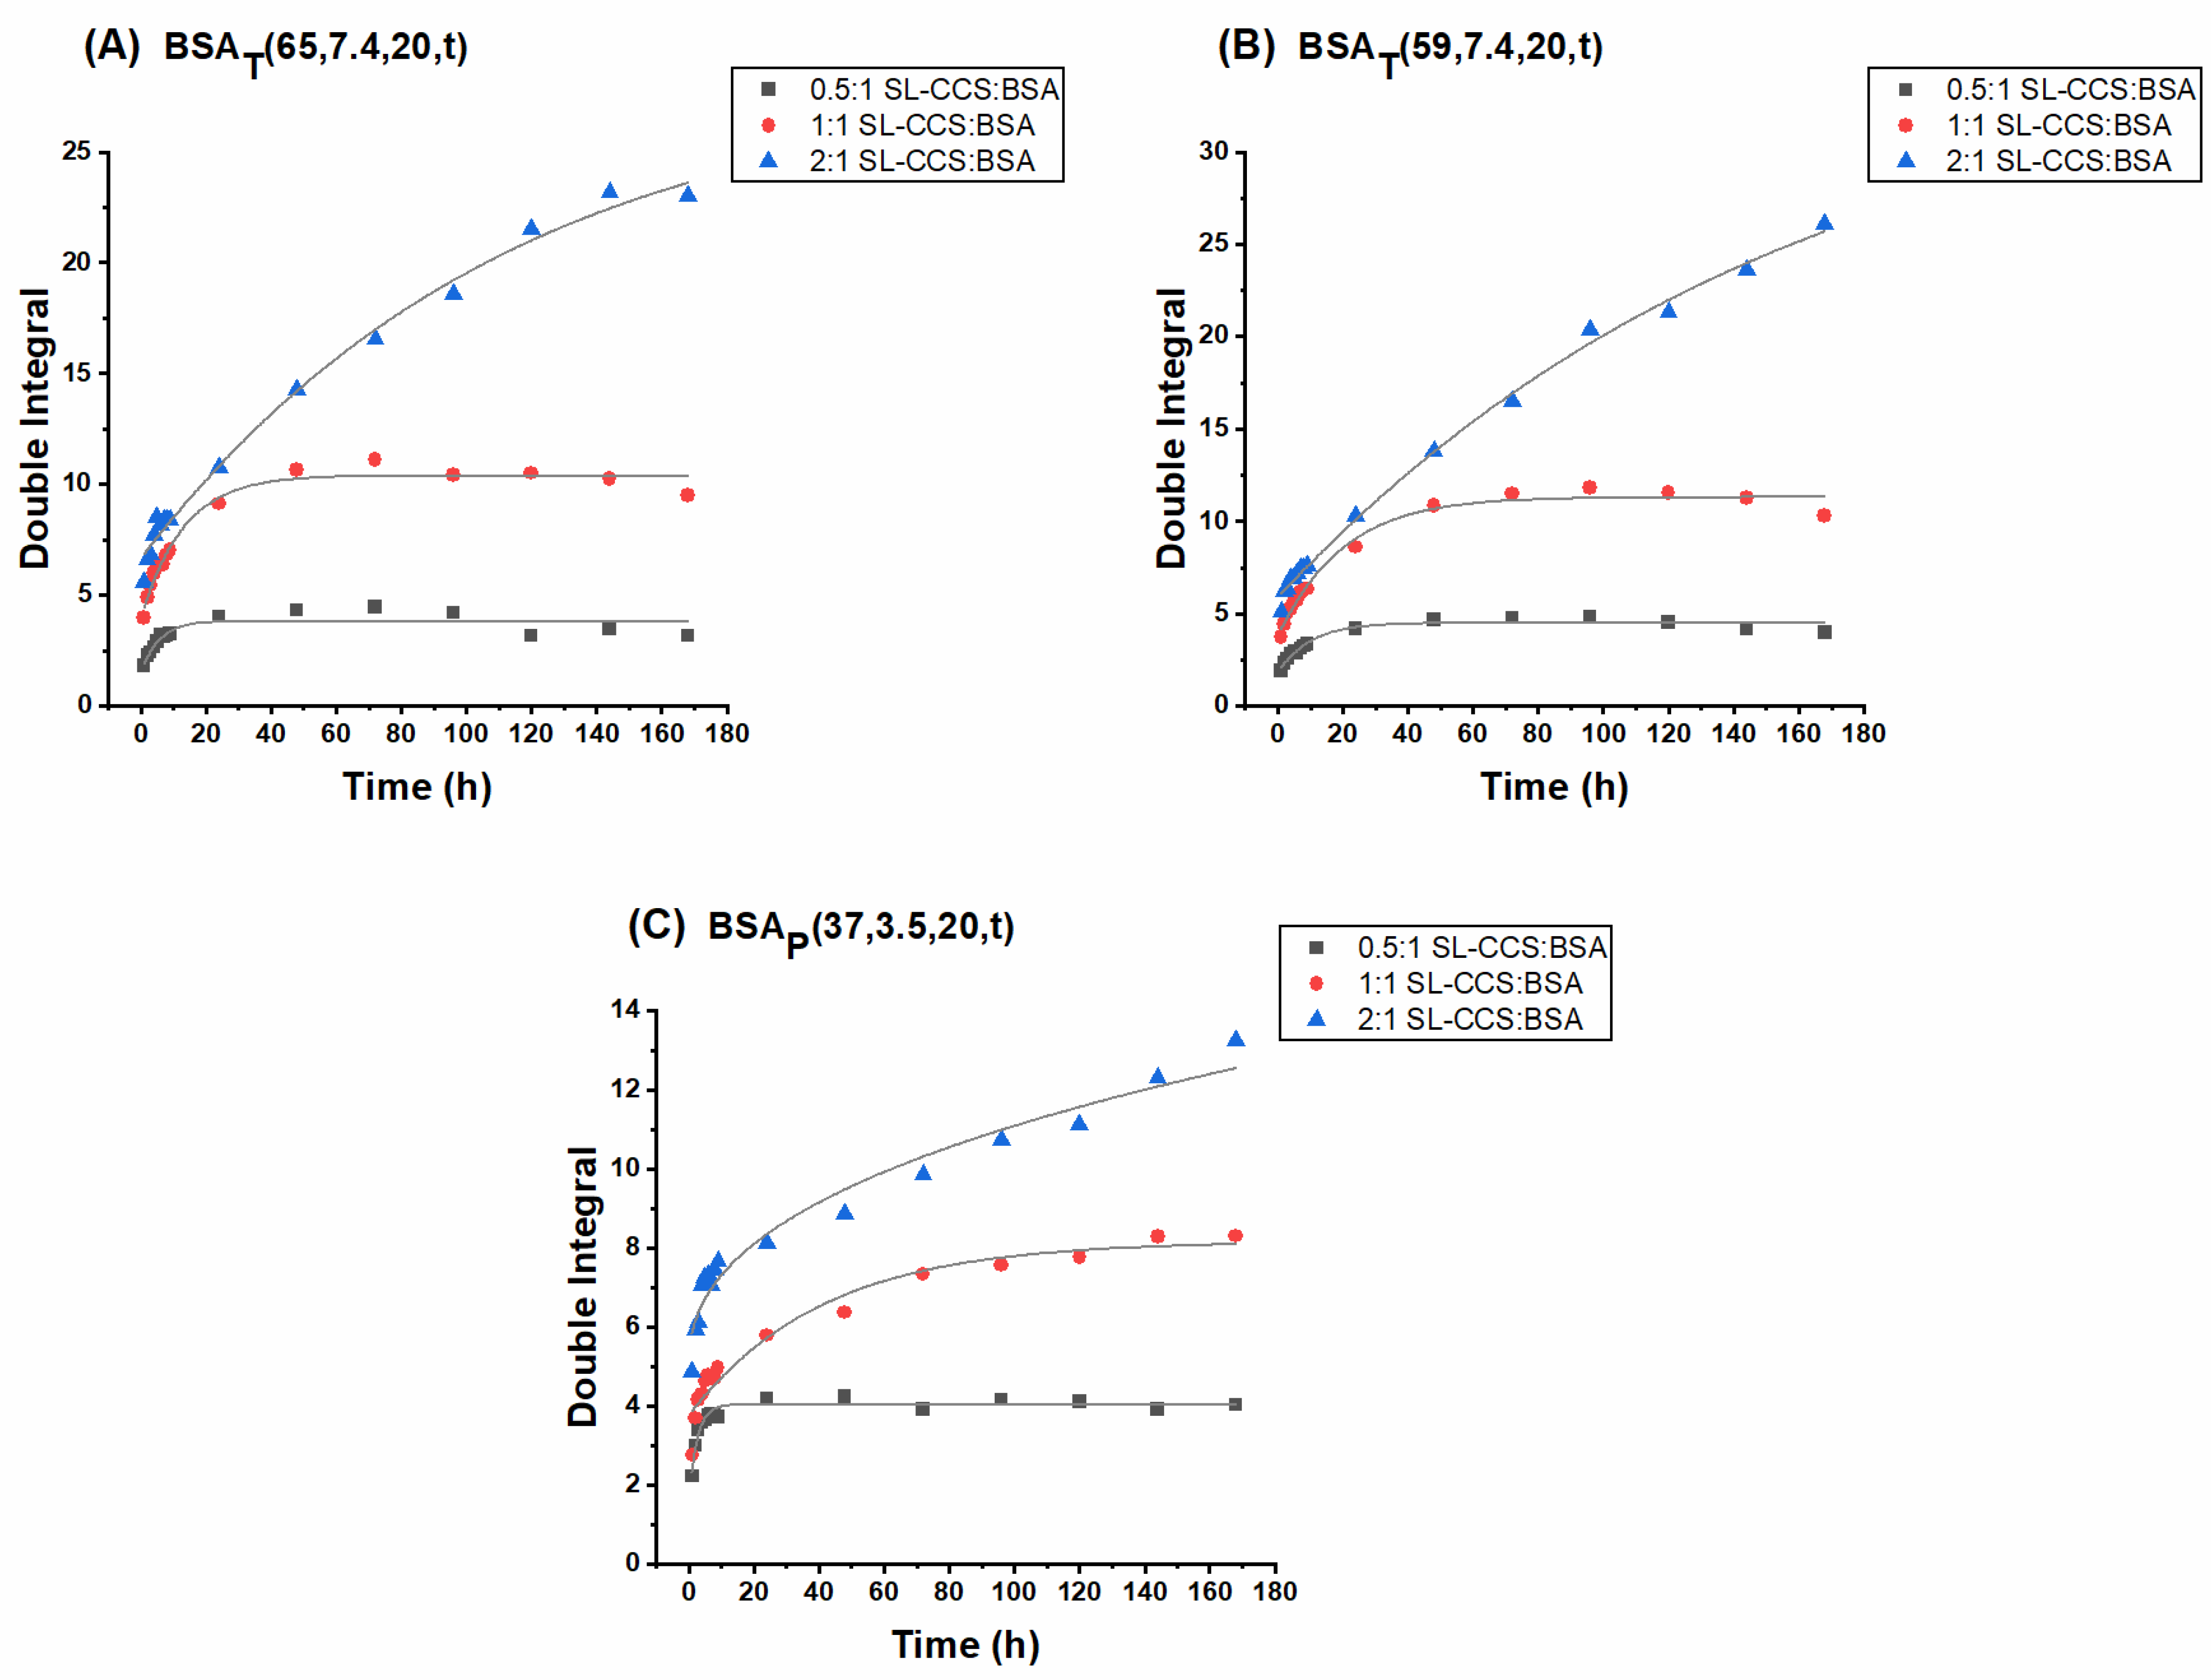
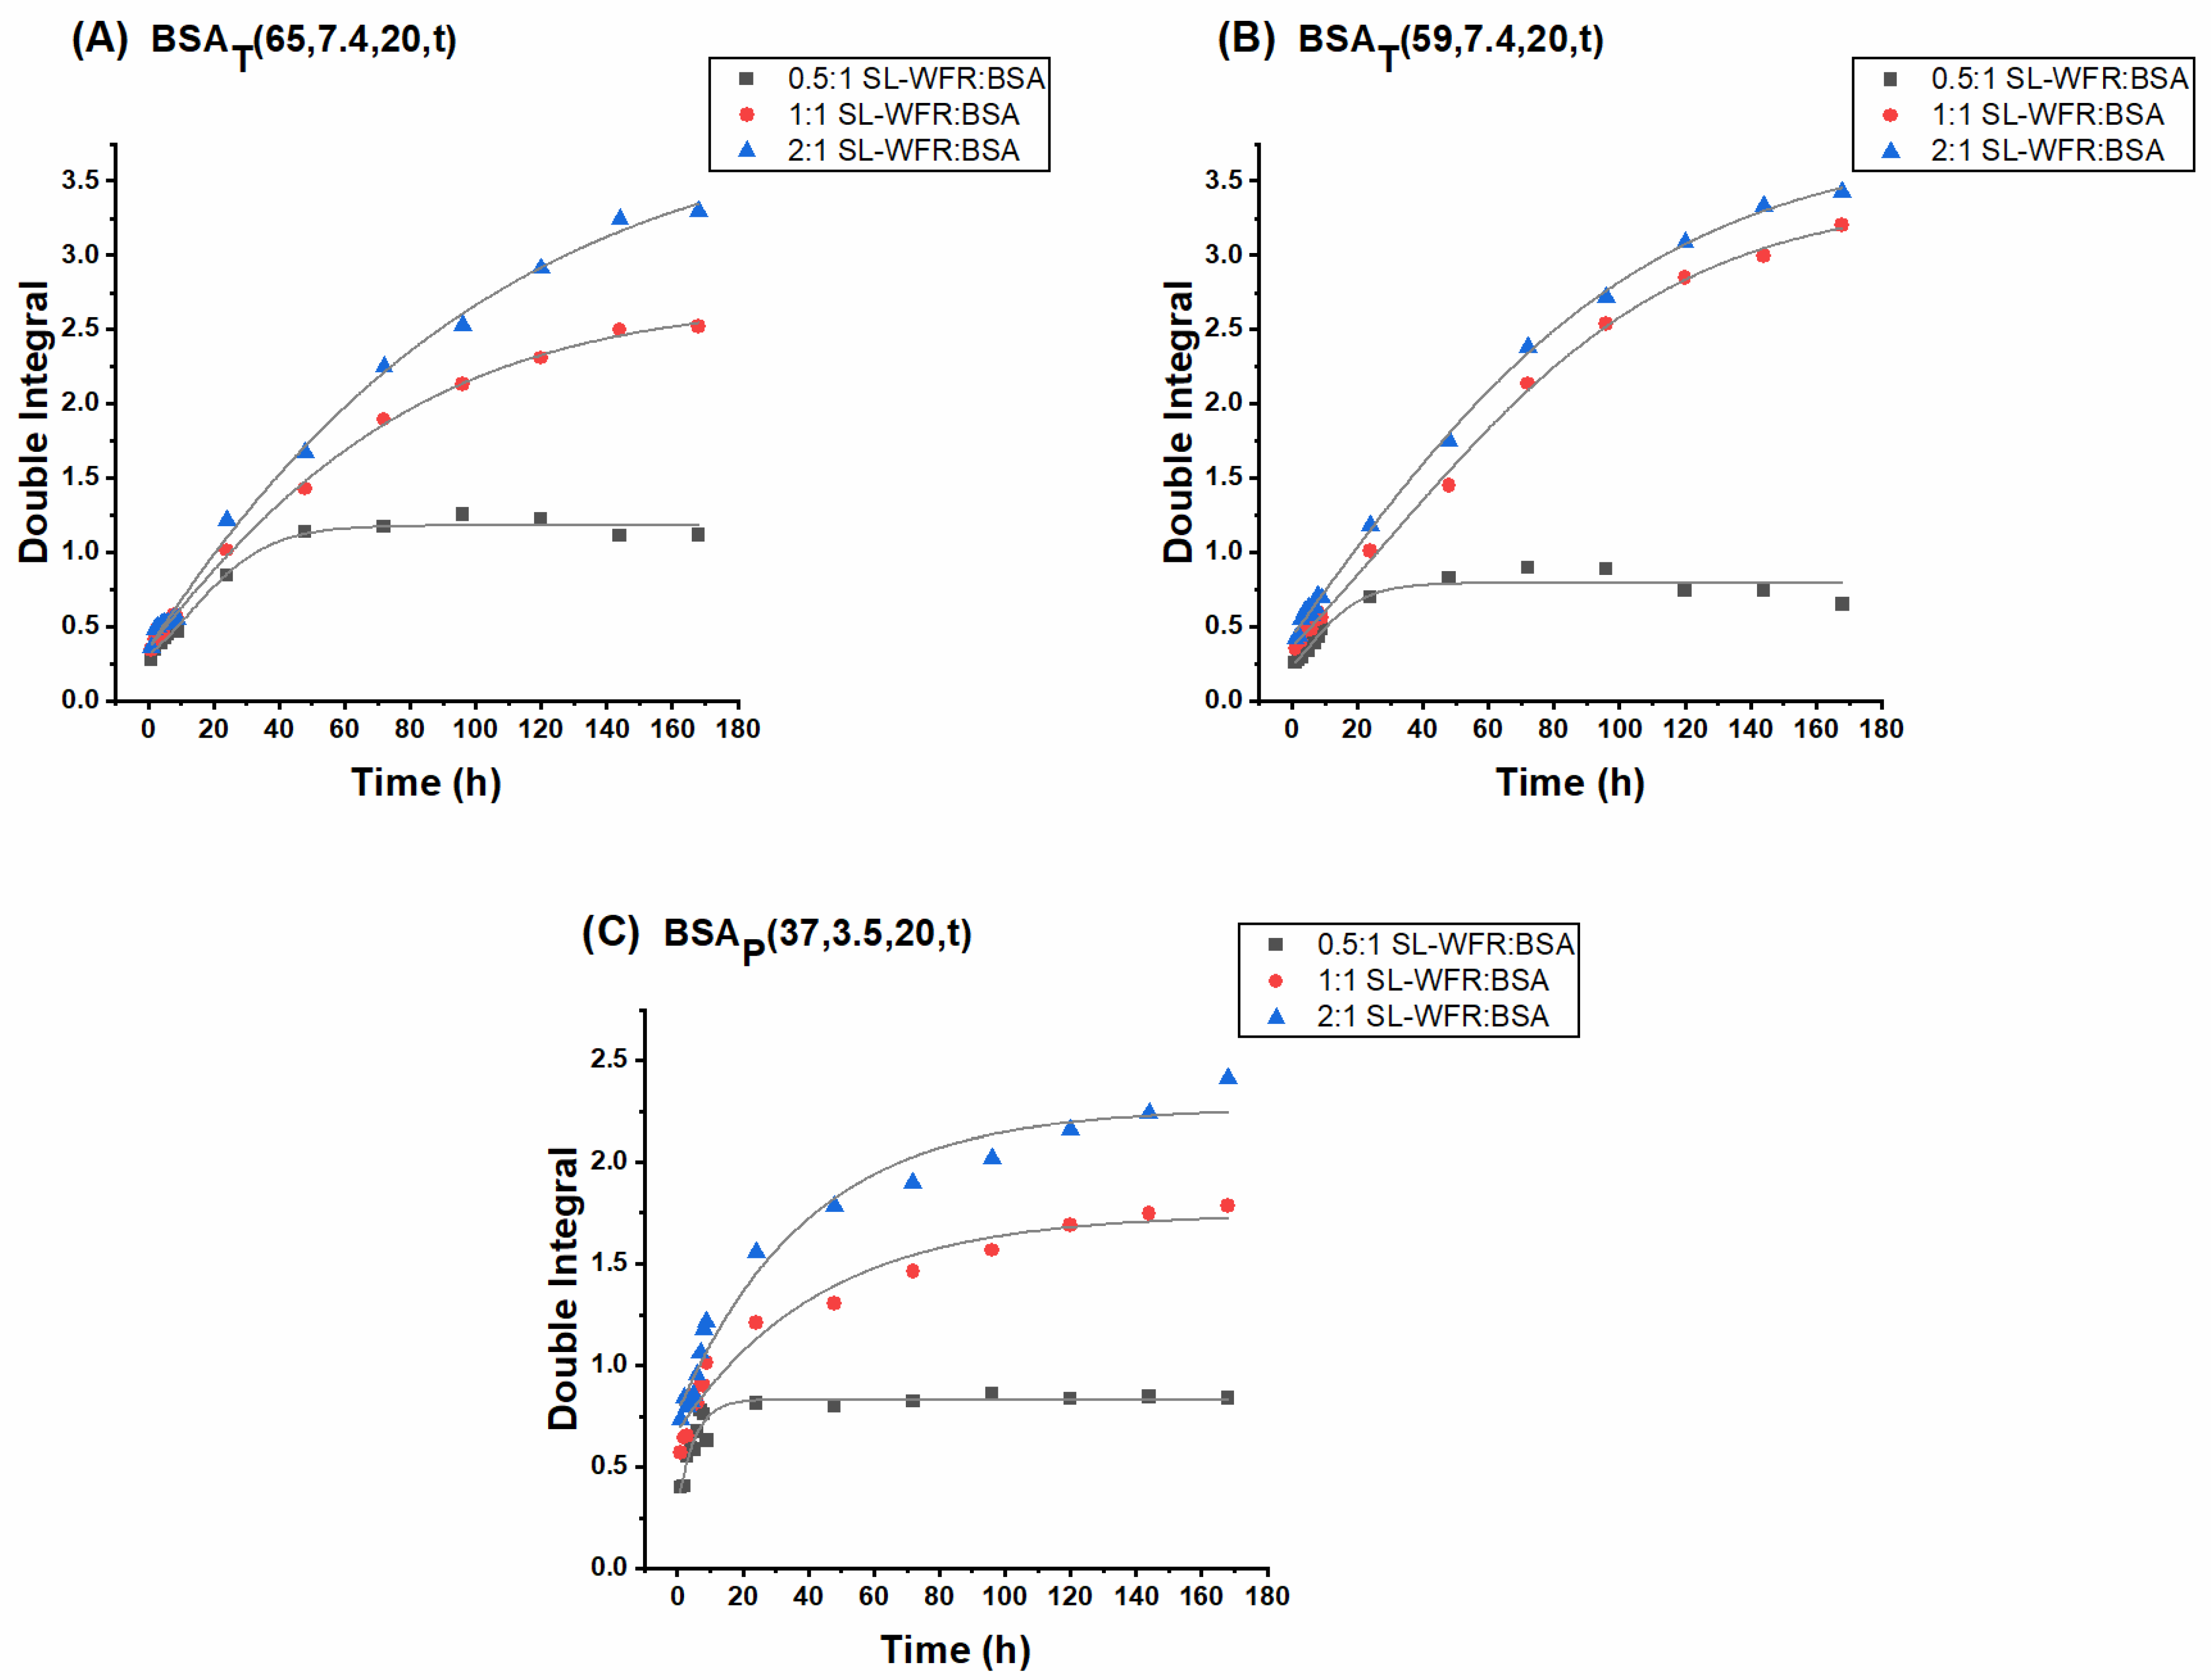
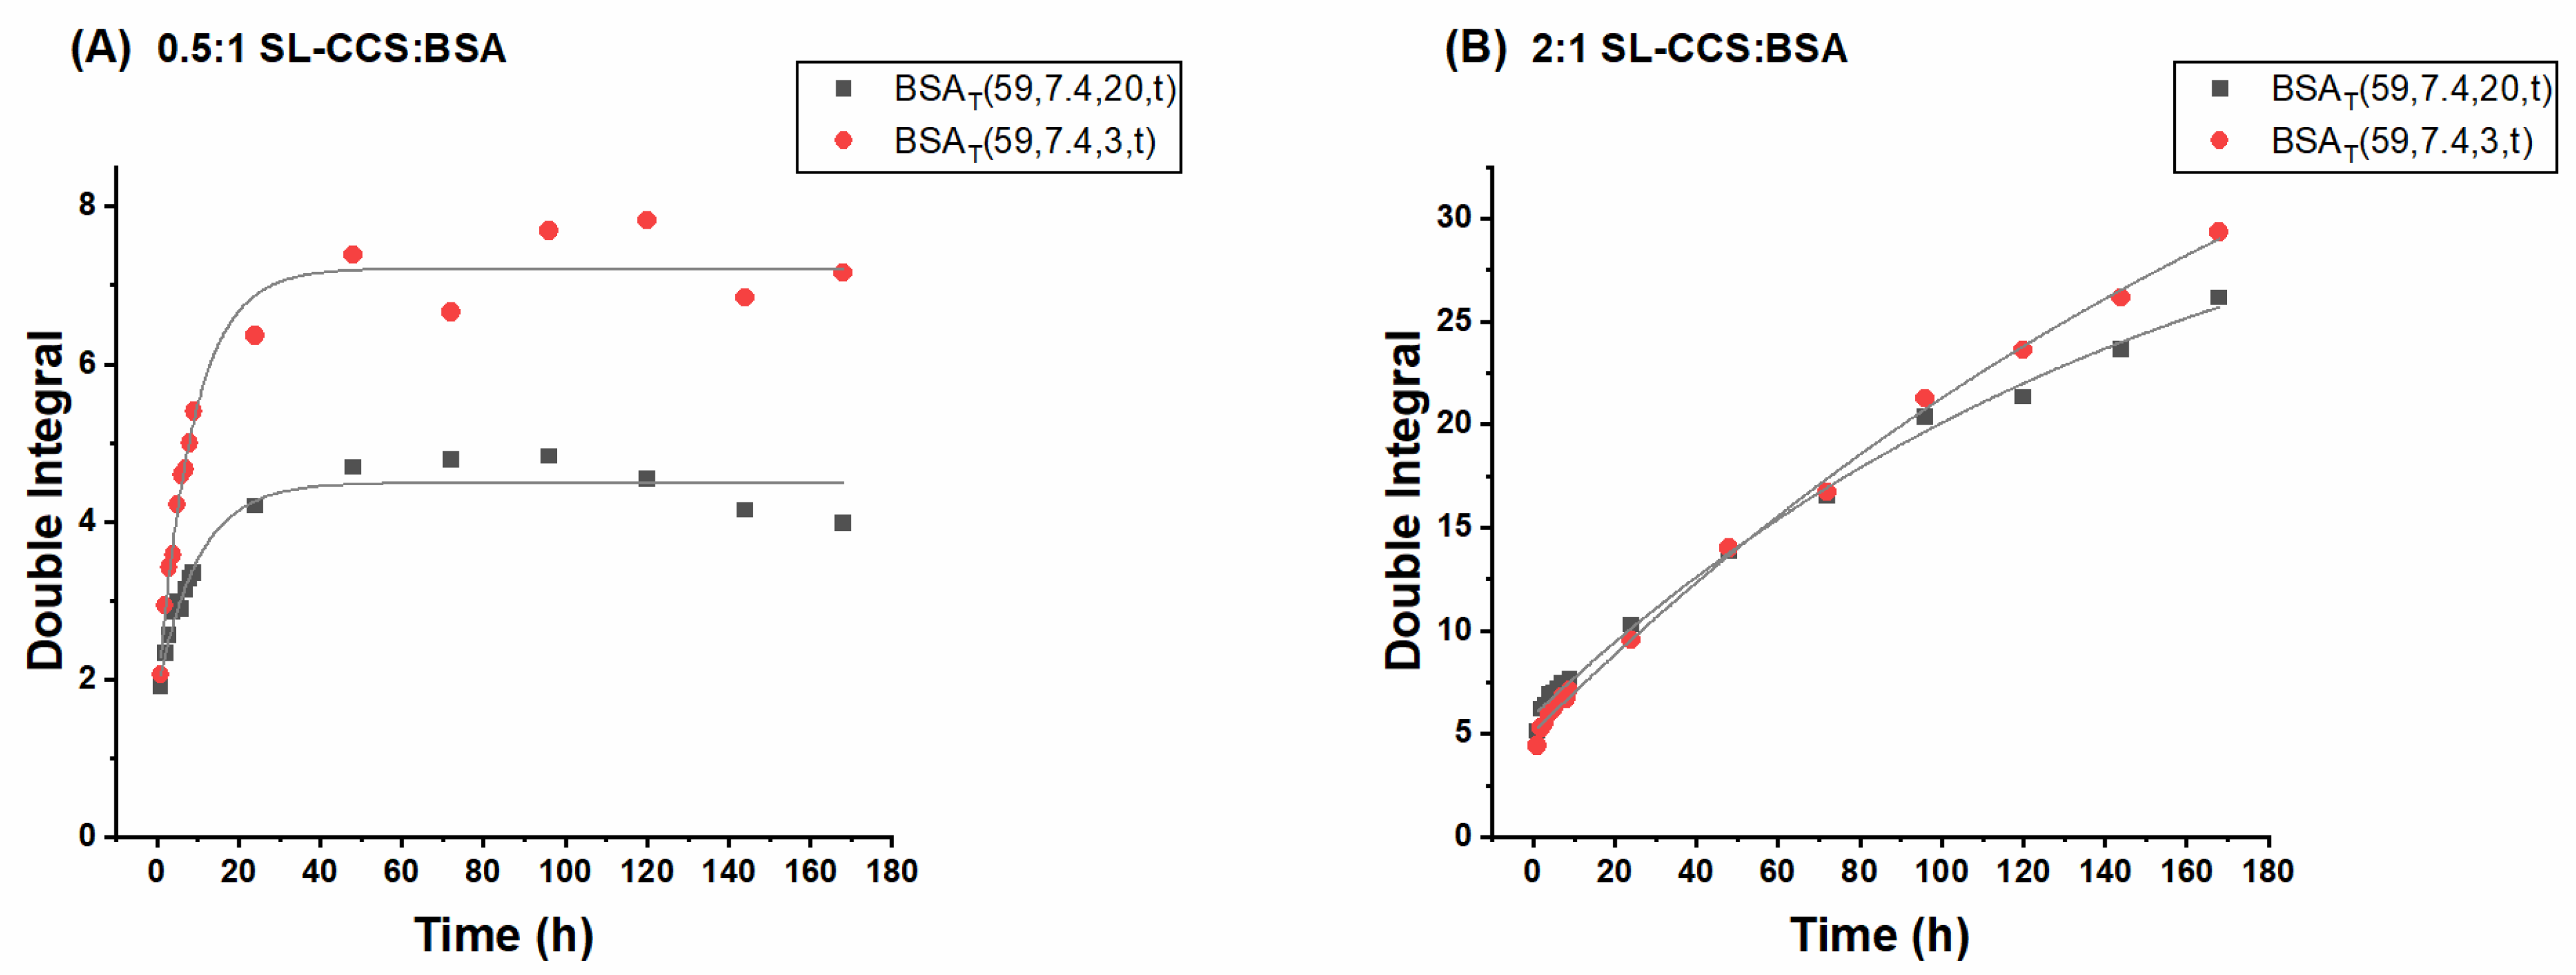
3.2. Release Studies of SL-CCS and SL-WFR Loaded BSA Hydrogels and Gel Characterization
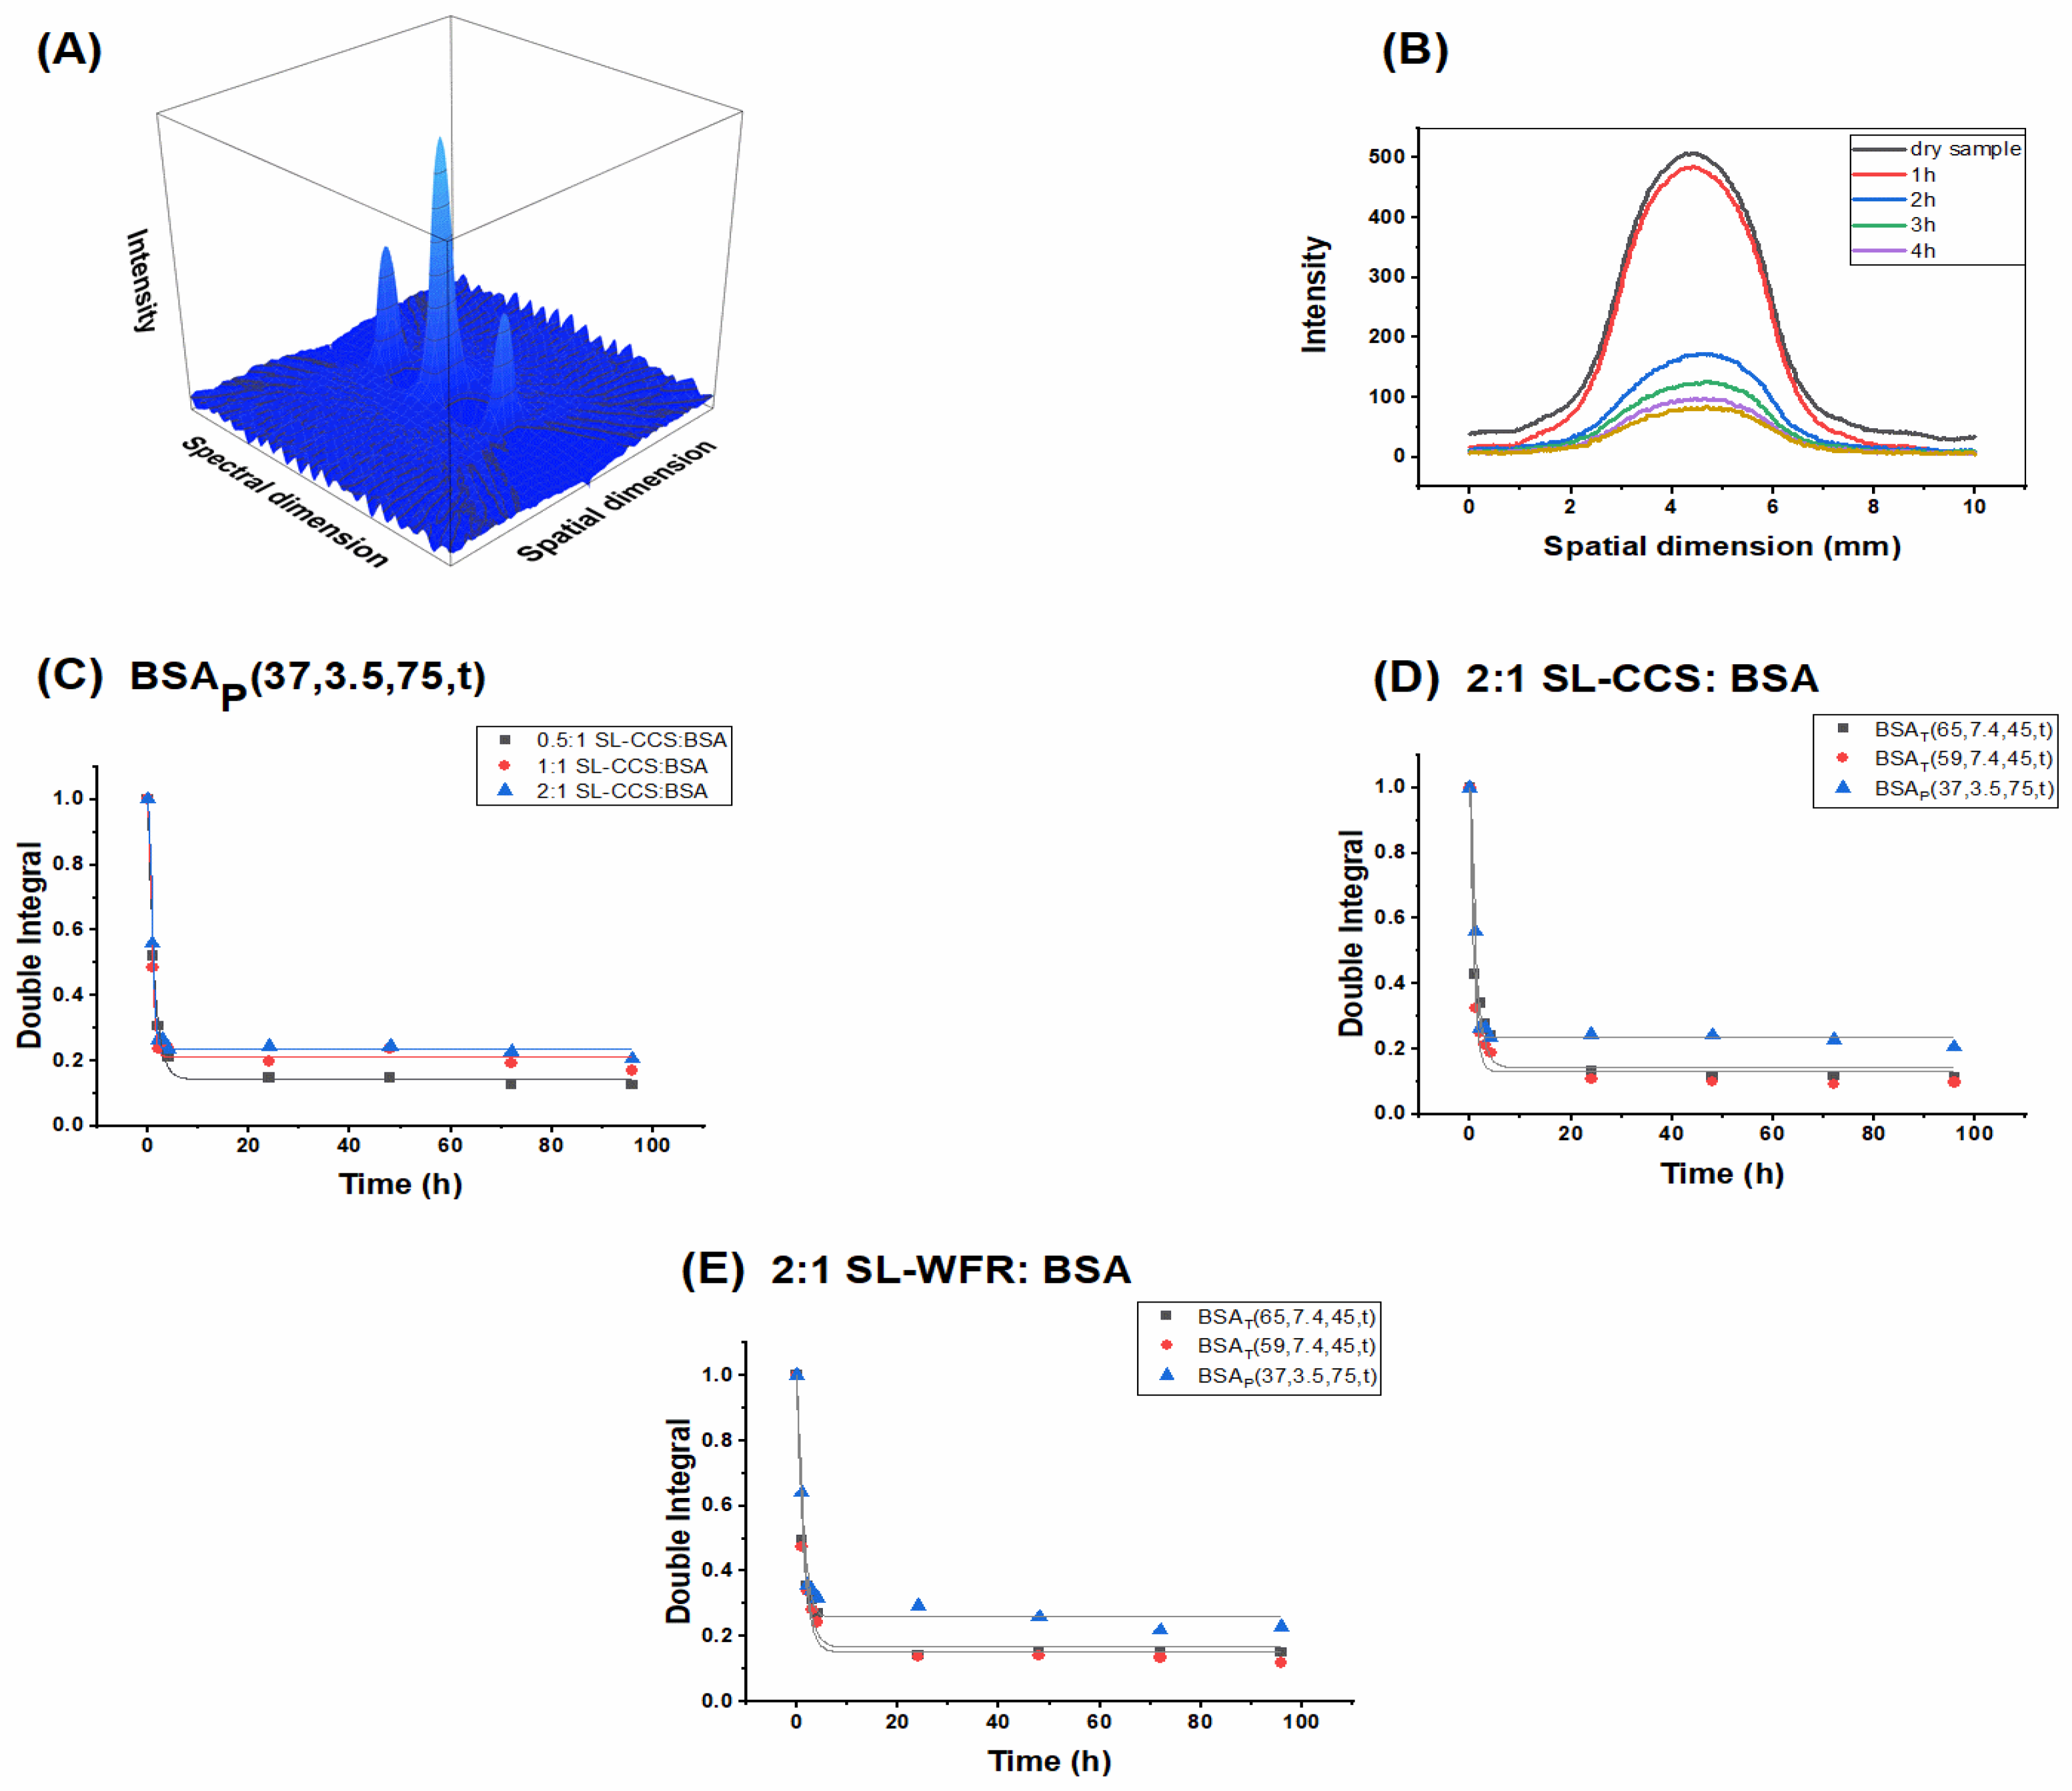
3.3. Monitoring of Release Behavior by Means of EPR Imaging
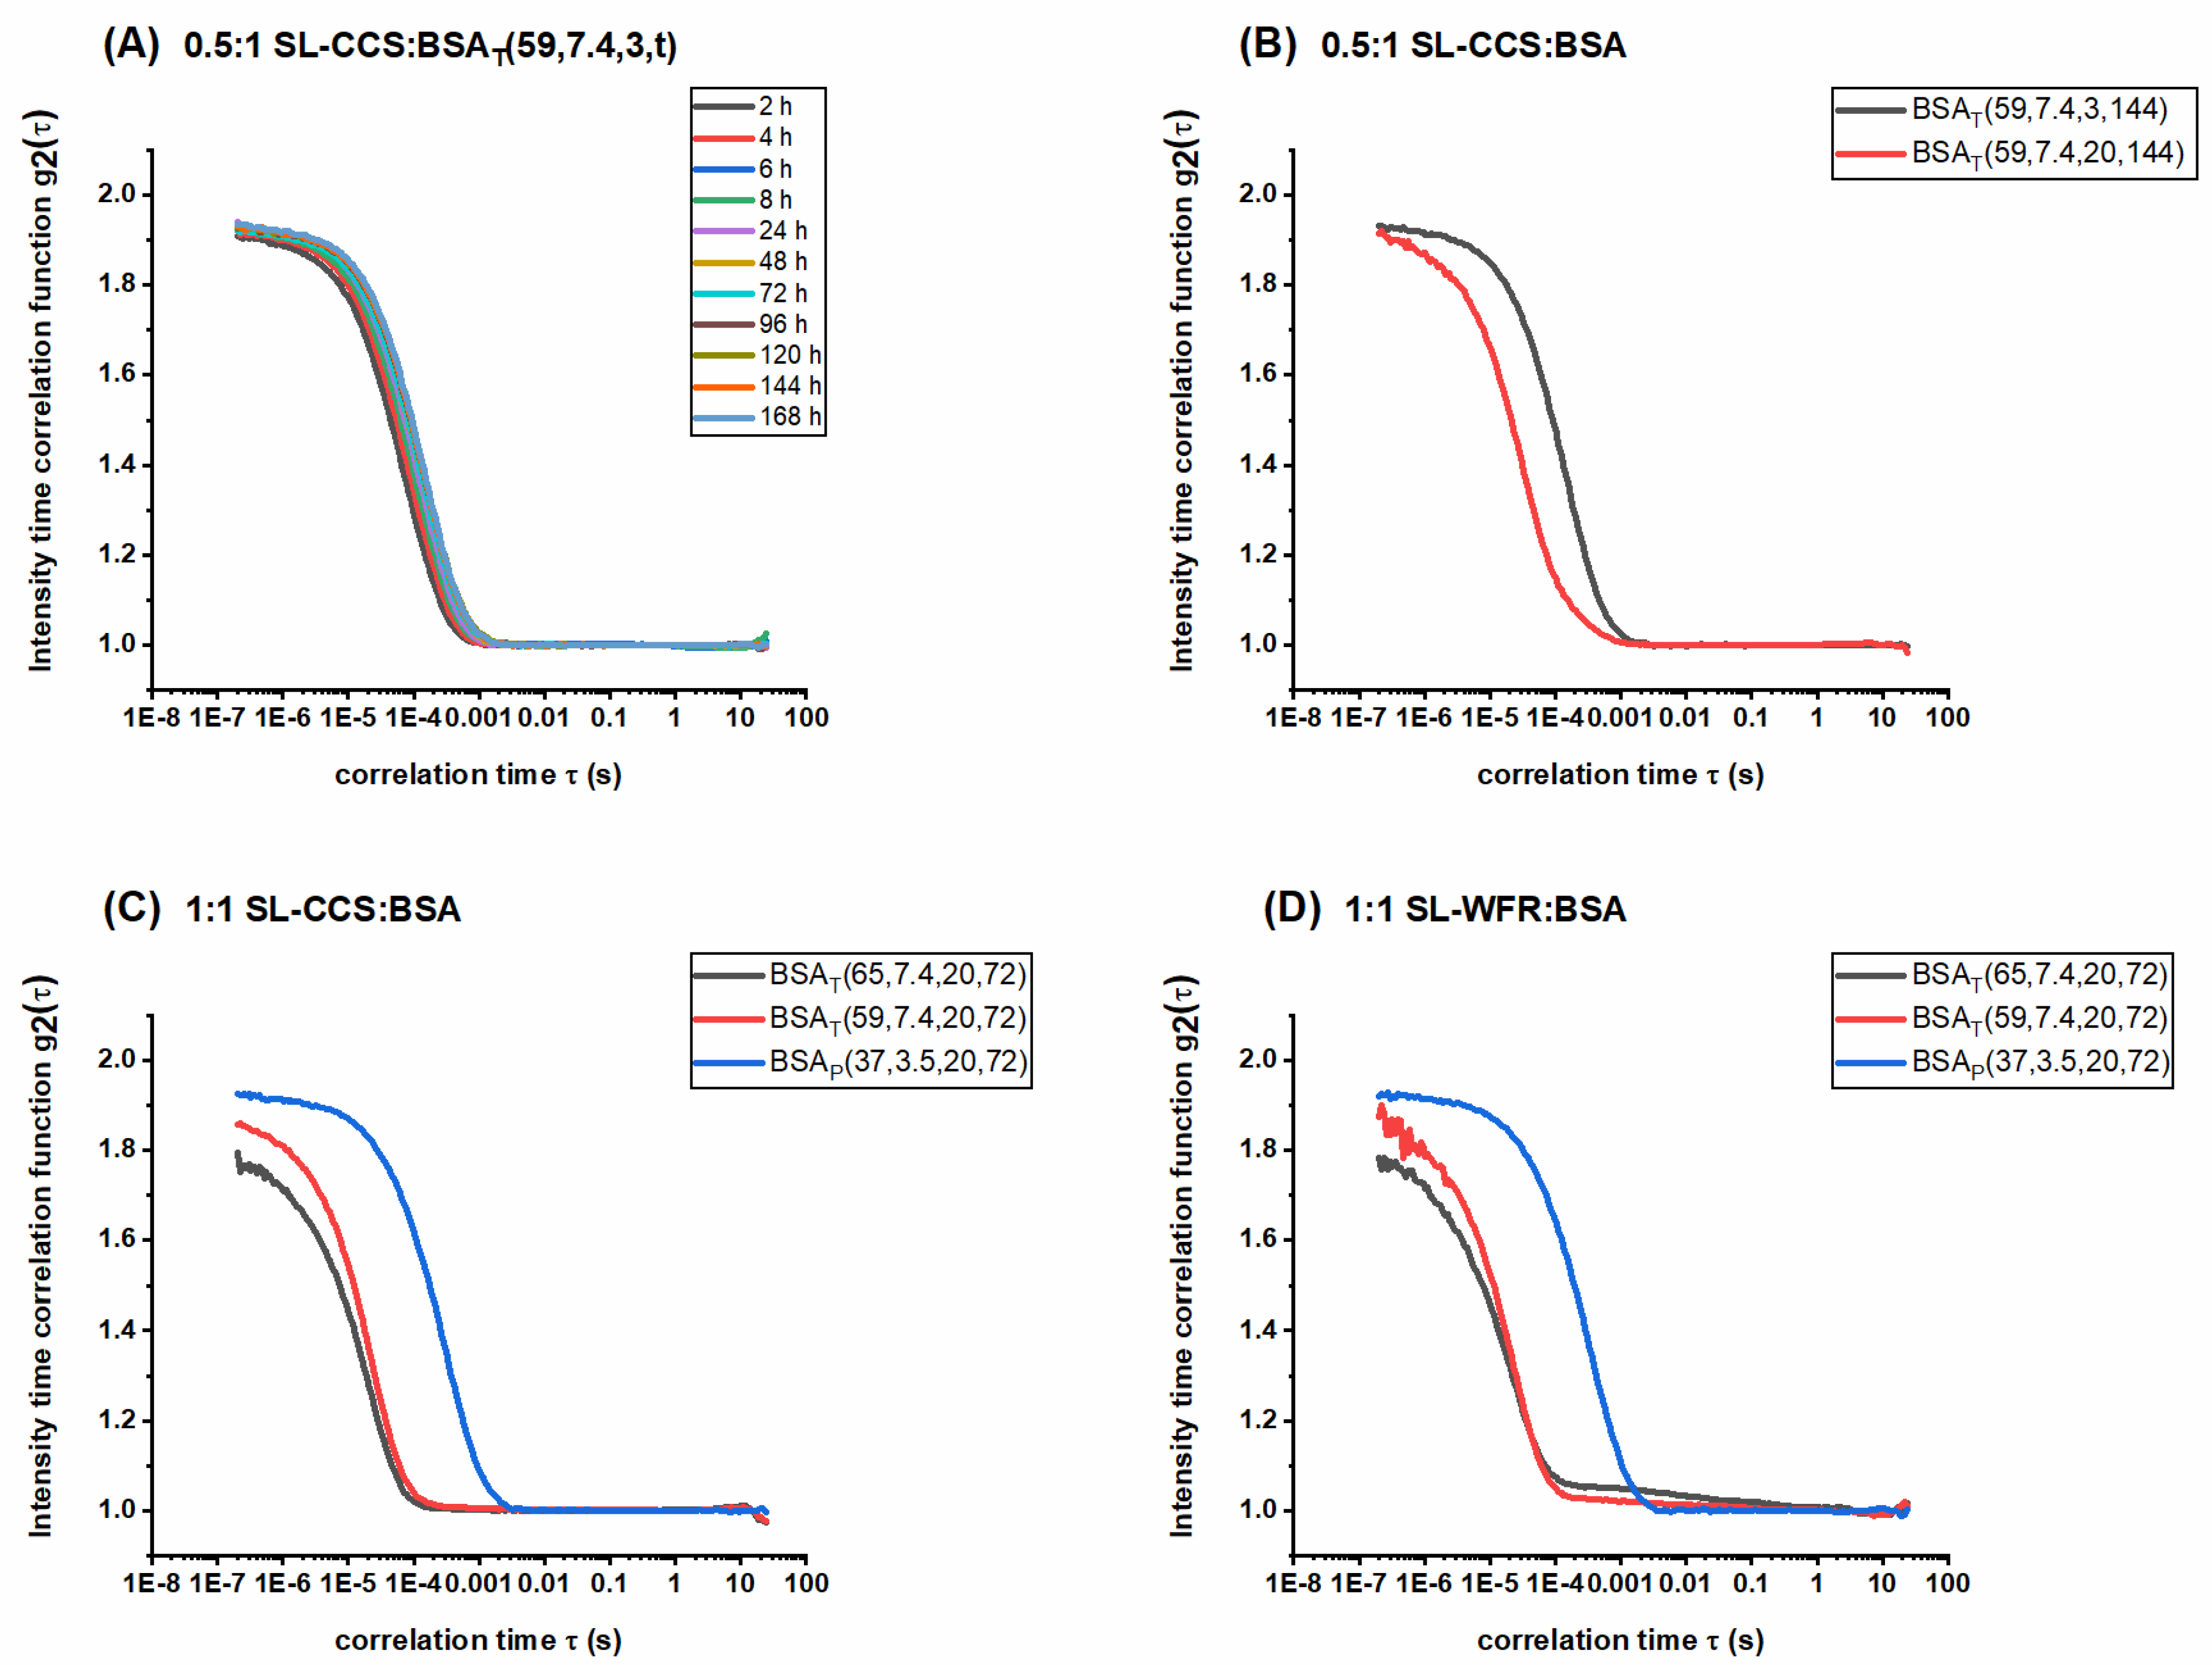
3.4. Analyzing the Released Components with DLS
4. Conclusions
Supplementary Materials
Author Contributions
Funding
Institutional Review Board Statement
Informed Consent Statement
Data Availability Statement
Conflicts of Interest
References
- Bhowmik, D.; Gopinath, H.; Kumar, B.P.; Duraivel, S.; Kumar, K.S. Controlled release drug delivery systems. Pharm. Innov. 2012, 1, 24–32. [Google Scholar]
- Siepmann, J.; Siegel, R.A.; Rathbone, M.J. Fundamentals and Applications of Controlled Release Drug Delivery; Springer: New York, NY, USA, 2012; Volume 3. [Google Scholar]
- Lee, J.H.; Yeo, Y. Controlled drug release from pharmaceutical nanocarriers. Chem. Eng. Sci. 2015, 125, 75–84. [Google Scholar] [CrossRef] [PubMed] [Green Version]
- de Souza, L.E.; Eckenstaler, R.; Syrowatka, F.; Beck-Broichsitter, M.; Benndorf, R.A.; Mäder, K. Has PEG-PLGA advantages for the delivery of hydrophobic drugs? Risperidone as an example. J. Drug Deliv. Sci. Technol. 2021, 61, 102239. [Google Scholar] [CrossRef]
- Janich, C.; Friedmann, A.; Silva, J.M.D.S.E.; De Oliveira, C.S.; De Souza, L.E.; Rujescu, D.; Hildebrandt, C.; Beck-Broichsitter, M.; Schmelzer, C.E.H.; Mäder, K. Risperidone-Loaded PLGA–Lipid Particles with Improved Release Kinetics: Manufacturing and Detailed Characterization by Electron Microscopy and Nano-CT. Pharmceutics 2019, 11, 665. [Google Scholar] [CrossRef] [PubMed] [Green Version]
- Cao, Z.; Ma, Y.; Sun, C.; Lu, Z.; Yao, Z.; Wang, J.; Li, D.; Yuan, Y.; Yang, X. ROS-sensitive polymeric nanocarriers with red light-activated size shrinkage for remotely con-trolled drug release. Chem. Mater. 2018, 30, 517–525. [Google Scholar] [CrossRef]
- Thanh, V.M.; Nguyen, T.H.; Tran, T.V.; Ngoc, U.T.P.; Ho, M.N.; Nguyen, T.T.; Chau, Y.N.T.; Le, V.T.; Tran, N.Q.; Nguyen, C.K.; et al. Low systemic toxicity nanocarriers fabricated from heparin-mPEG and PAMAM dendrimers for controlled drug release. Mater. Sci. Eng. 2018, 82, 291–298. [Google Scholar] [CrossRef]
- Wells, C.M.; Harris, M.; Choi, L.; Murali, V.P.; Guerra, F.D.; Jennings, J.A. Stimuli-responsive drug release from smart polymers. J. Func. Biomater. 2019, 10, 34. [Google Scholar] [CrossRef] [Green Version]
- Xiong, D.; Zhang, X.; Peng, S.; Gu, H.; Zhang, L. Smart pH-sensitive micelles based on redox degradable polymers as DOX/GNPs carriers for controlled drug release and CT imaging. Colloids Surf. B 2018, 163, 29–40. [Google Scholar] [CrossRef]
- Lai, W.; Chen, C.; Ren, X.; Lee, I.S.; Jiang, G.; Kong, X. Hydrothermal fabrication of porous hollow hydroxyapatite microspheres for a drug delivery system. Mater. Sci. Eng. C 2016, 62, 166–172. [Google Scholar] [CrossRef]
- Caccavo, D.; Cascone, S.; Lamberti, G.; Barba, A.A. Controlled drug release from hydrogel-based matrices: Experiments and modeling. Int. J. Pharm. 2015, 486, 144–152. [Google Scholar] [CrossRef]
- Wang, Y.; Wang, J.; Yuan, Z.; Han, H.; Li, T.; Li, L.; Guo, X. Chitosan cross-linked poly (acrylic acid) hydrogels: Drug release control and mechanism. Colloids Surf. B 2017, 152, 252–259. [Google Scholar] [CrossRef] [Green Version]
- Sharma, P.K.; Taneja, S.; Singh, Y. Hydrazone-linkage-based self-healing and injectable xanthan–poly (ethylene glycol) hydrogels for controlled drug release and 3D cell culture. ACS Appl. Mater. Interfaces 2018, 10, 30936–30945. [Google Scholar] [CrossRef]
- Bhattarai, N.; Gunn, J.; Zhang, M. Chitosan-based hydrogels for controlled, localized drug delivery. Adv. Drug Deliv. Rev. 2010, 62, 83–99. [Google Scholar] [CrossRef] [PubMed]
- Langer, R.; Peppas, N.A. Advances in biomaterials, drug delivery, and bionanotechnology. AIChE J. 2003, 49, 2990–3006. [Google Scholar] [CrossRef]
- Haeri, H.H.; Jerschabek, V.; Sadeghi, A.; Hinderberger, D. Copper–Calcium Poly (Acrylic Acid) Composite Hydrogels as Studied by Electron Paramagnetic Resonance (EPR) Spectroscopy. Macromol. Chem. Phys. 2020, 221, 2000262. [Google Scholar] [CrossRef]
- Arabi, S.H.; Aghelnejad, B.; Volmer, J.; Hinderberger, D. Hydrogels from serum albumin in a molten globule-like state. Protein Sci. 2020, 29, 2459–2467. [Google Scholar] [CrossRef]
- Tada, D.; Tanabe, T.; Tachibana, A.; Yamauchi, K. Drug release from hydrogel containing albumin as crosslinker. J. Biosci. Bioeng. 2005, 100, 551–555. [Google Scholar] [CrossRef]
- Arabi, S.H.; Aghelnejad, B.; Schwieger, C.; Meister, A.; Kerth, A.; Hinderberger, D. Serum albumin hydrogels in broad pH and temperature ranges: Characterization of their self-assembled structures and nanoscopic and macroscopic properties. Biomater. Sci. 2018, 6, 478–492. [Google Scholar] [CrossRef] [Green Version]
- Sanaeifar, N.; Mäder, K.; Hinderberger, D. Nanoscopic Characterization of Stearic Acid Release from Bovine Serum Albumin Hydrogels. Macromol. Biosci. 2020, 20, 2000126. [Google Scholar] [CrossRef]
- Junk, M.J.; Li, W.; Schlüter, A.D.; Wegner, G.; Spiess, H.W.; Zhang, A.; Hinderberger, D. EPR spectroscopic characterization of local nanoscopic heterogeneities during the thermal collapse of thermoresponsive dendronized polymers. Angew. Chem. Int. Ed. 2010, 49, 5683–5687. [Google Scholar] [CrossRef]
- Reichenwallner, J.; Hinderberger, D. Using bound fatty acids to disclose the functional structure of serum albumin. Biochim. Biophys. Acta 2013, 1830, 5382–5393. [Google Scholar] [CrossRef] [PubMed]
- Akdogan, Y.; Reichenwallner, J.; Hinderberger, D. Evidence for water-tuned structural differences in proteins: An approach emphasizing variations in local hydrophilicity. PLoS ONE 2012, 7, e45681. [Google Scholar] [CrossRef] [PubMed] [Green Version]
- Elsadek, B.; Kratz, F. Impact of albumin on drug delivery—New applications on the horizon. J. Control. Release 2012, 157, 4–28. [Google Scholar] [CrossRef] [PubMed]
- Haeri, H.H.; Tomaszewski, J.; Phytides, B.; Schimm, H.; Möslein, G.; Niedergethmann, M.; Hinderberger, D.; Gelos, M. Identification of Patients with Pancreatic Cancer by Electron Paramagnetic Resonance Spectroscopy of Fatty Acid Binding to Human Serum Albumin. ACS Pharmacol. Transl. Sci. 2020, 3, 1188–1198. [Google Scholar] [CrossRef]
- Larsen, M.T.; Kuhlmann, M.; Hvam, M.L.; Howard, K.A. Albumin-based drug delivery: Harnessing nature to cure disease. Mol. Cell Ther. 2016, 4, 3. [Google Scholar] [CrossRef] [Green Version]
- Arabi, S.H.; Haselberger, D.; Hinderberger, D. The effect of ethanol on gelation, nanoscopic, and macroscopic properties of serum albumin hydrogels. Molecules 2020, 25, 1927. [Google Scholar] [CrossRef] [Green Version]
- Boye, J.I.; Alli, I.; Ismail, A.A. Interactions involved in the gelation of bovine serum albumin. J. Agric. Food Chem. 1996, 44, 996–1004. [Google Scholar] [CrossRef]
- Baler, K.; Michael, R.; Szleifer, I.; Ameer, G.A. Albumin hydrogels formed by electrostatically triggered self-assembly and their drug delivery capability. Biomacromolecules 2014, 15, 3625–3633. [Google Scholar] [CrossRef] [Green Version]
- Pápay, Z.E.; Kósa, A.; Böddi, B.; Merchant, Z.; Saleem, I.Y.; Zariwala, M.G.; Klebovich, I.; Somavarapu, S.; Antal, I. Study on the pulmonary delivery system of apigenin-loaded albumin nanocarriers with antioxidant activity. J. Aerosol Med. Pulm. Drug Deliv. 2017, 30, 274–288. [Google Scholar] [CrossRef] [PubMed] [Green Version]
- Gharbavi, M.; Danafar, H.; Sharafi, A. Microemulsion and bovine serum albumin nanoparticles as a novel hybrid nanocarrier system for efficient multifunctional drug delivery. J. Biomed. Mater. Res. A 2020, 108, 1688–1702. [Google Scholar] [CrossRef]
- de Redín, I.L.; Boiero, C.; Martínez-Ohárriz, M.C.; Agüeros, M.; Ramos, R.; Peñuelas, I.; Allemandi, D.; Llabot, J.M.; Irache, J.M. Human serum albumin nanoparticles for ocular delivery of bevacizumab. Int. J. Pharm. 2018, 541, 214–223. [Google Scholar] [CrossRef]
- Golubeva, E.; Chumakova, N.A.; Kuzin, S.V.; Grigoriev, I.A.; Kalai, T.; Korotkevich, A.A.; Bogorodsky, S.E.; Krotova, L.I.; Popov, V.K.; Lunin, V.V. Paramagnetic bioactives encapsulated in poly (d, l-lactide) microparticules: Spatial distribution and in vitro release kinetics. J. Supercrit. Fluids 2020, 158, 104748. [Google Scholar] [CrossRef]
- Eisenächer, F.; Schädlich, A.; Mäder, K. Monitoring of internal pH gradients within multi-layer tablets by optical methods and EPR imaging. Int. J. Pharm. 2011, 417, 204–215. [Google Scholar] [CrossRef]
- Kroll, C.; Hermann, W.; Stösser, R.; Borchert, H.H.; Mäder, K. Influence of drug treatment on the microacidity in rat and human skin—an in vitro electron spin resonance imaging study. Pharm. Res. 2001, 18, 525–530. [Google Scholar] [CrossRef] [PubMed]
- Khalil, S.K.H.; El-Feky, G.S.; El-Banna, S.T.; Khalil, W.A. Preparation and evaluation of warfarin-β-cyclodextrin loaded chitosan nanoparticles for transdermal delivery. Carbohydr. Polym. 2012, 90, 1244–1253. [Google Scholar] [CrossRef] [PubMed]
- Mekaj, Y.H.; Mekaj, A.Y.; Duci, S.B.; Miftari, E.I. New oral anticoagulants: Their advantages and disadvantages compared with vitamin K antagonists in the prevention and treatment of patients with thromboembolic events. Ther. Clin. Risk Manag. 2015, 11, 967. [Google Scholar] [CrossRef] [Green Version]
- Verhoef, T.I.; Redekop, W.K.; Daly, A.K.; Van Schie, R.M.; De Boer, A.; Maitland-van der Zee, A.H. Pharmacogenetic-guided dosing of coumarin anticoagulants: Algorithms for warfarin, acenocoumarol and phenprocoumon. Br. J. Clin. Pharmacol. 2014, 77, 626–641. [Google Scholar] [CrossRef] [PubMed] [Green Version]
- Hauenschild, T.; Reichenwallner, J.; Enkelmann, V.; Hinderberger, D. Characterizing Active Pharmaceutical Ingredient Binding to Human Serum Albumin by Spin-Labeling and EPR Spectroscopy. Chem. Eur. J. 2016, 22, 12825–12838. [Google Scholar] [CrossRef]
- Widder, K.; MacEwan, S.R.; Garanger, E.; Núñez, V.; Lecommandoux, S.; Chilkoti, A.; Hinderberger, D. Characterisation of hydration and nanophase separation during the temperature response in hydrophobic/hydrophilic elastin-like polypeptide (ELP) diblock copolymers. Soft Matter 2017, 13, 1816–1822. [Google Scholar] [CrossRef] [PubMed] [Green Version]
- Herrling, T.; Fuchs, J.; Groth, N. Kinetic measurements using EPR imaging with a modulated field gradient. J. Magn. Reson. 2002, 154, 6–14. [Google Scholar] [CrossRef] [PubMed]
- Kaszuba, M.; McKnight, D.; Connah, M.T.; McNeil-Watson, F.K.; Nobbmann, U. Measuring sub nanometre sizes using dynamic light scattering. J. Nanopart. Res. 2008, 10, 823–829. [Google Scholar] [CrossRef] [Green Version]
- Nobbmann, U.; Connah, M.; Fish, B.; Varley, P.; Gee, C.; Mulot, S.; Chen, J.; Zhou, L.; Lu, Y.; Sheng, F.; et al. Dynamic light scattering as a relative tool for assessing the molecular integrity and stability of monoclonal antibodies. Biotechnol. Genet. Eng. Rev. 2007, 24, 117–128. [Google Scholar] [CrossRef] [PubMed] [Green Version]
- Peppas, N.A.; Bures, P.; Leobandung, W.S.; Ichikawa, H. Hydrogels in pharmaceutical formulations. Eur. J. Pharm. Biopharm. 2000, 50, 27–46. [Google Scholar] [CrossRef]
- Yan, C.; Pochan, D.J. Rheological properties of peptide-based hydrogels for biomedical and other applications. Chem. Soc. Rev. 2010, 39, 3528–3540. [Google Scholar] [CrossRef] [Green Version]
- Hao, J.; Weiss, R. Viscoelastic and mechanical behavior of hydrophobically modified hydrogels. Macromolecules 2011, 44, 9390–9398. [Google Scholar] [CrossRef]
- Yamasaki, K.; Maruyama, T.; Kragh-Hansen, U.; Otagiri, M. Characterization of site I on human serum albumin: Concept about the structure of a drug binding site. Biochim. Biophys. Acta -Protein Struct. Mol. Enzymol. 1996, 1295, 147–157. [Google Scholar] [CrossRef]
- Lee, P.; Wu, X. Modifications of human serum albumin and their binding effect. Curr. Pharm. Design 2015, 21, 1862–1865. [Google Scholar] [CrossRef] [Green Version]
- Khodarahmi, R.; Karimi, S.A.; Kooshk, M.R.A.; Ghadami, S.A.; Ghobadi, S.; Amani, M. Comparative spectroscopic studies on drug binding characteristics and protein surface hydrophobicity of native and modified forms of bovine serum albumin: Possible relevance to change in protein structure/function upon non-enzymatic glycation. Spectrochim. Acta A Mol. Biomol. Spectrosc. 2012, 89, 177–186. [Google Scholar] [CrossRef]
- Reichenwallner, J.; Oehmichen, M.T.; Schmelzer, C.E.; Hauenschild, T.; Kerth, A.; Hinderberger, D. Exploring the pH-induced functional phase space of human serum albumin by EPR spectroscopy. Magnetochemistry 2018, 4, 47. [Google Scholar] [CrossRef] [Green Version]
- Akdogan, Y.; Wu, Y.; Eisele, K.; Schaz, M.; Weil, T.; Hinderberger, D. Host–guest interactions in polycationic human serum albumin bioconjugates. Soft Matter 2012, 8, 11106–11114. [Google Scholar] [CrossRef]
- Kempe, S.; Metz, H.; Mäder, K. Application of electron paramagnetic resonance (EPR) spectroscopy and imaging in drug delivery research–chances and challenges. Eur. J. Pharm. Biopharm. 2010, 74, 55–66. [Google Scholar] [CrossRef]
- Capancioni, S.; Schwach-Abdellaoui, K.; Kloeti, W.; Herrmann, W.; Brosig, H.; Borchert, H.H.; Heller, J.; Gurny, R. In vitro monitoring of poly (ortho ester) degradation by electron paramagnetic resonance imaging. Macromolecules 2003, 36, 6135–6141. [Google Scholar] [CrossRef]


| Figure | Type of Released Components | Percentage | Correlation Time τc (ns) | Hyperfine Coupling Constant aiso (MHz) |
|---|---|---|---|---|
| C | Bound | 29% | 14.6 | 44.53 |
| Intermediate | 44% | 5.4 | 47.53 | |
| Free | 26% | 0.11 | 46.86 | |
| D | Bound | 10% | 14.5 | 44.53 |
| Intermediate | 54% | 4.76 | 47.53 | |
| Free | 35% | 0.16 | 46.86 | |
| E | Bound | 47% | 31 | 42.53 |
| Intermediate | 48% | 3.2 | 46.86 | |
| Free | 3% | 0.061 | 47.13 | |
| F | Bound | 36% | 31 | 42.53 |
| Intermediate | 56% | 3.2 | 46.86 | |
| Free | 6% | 0.85 | 47.20 |
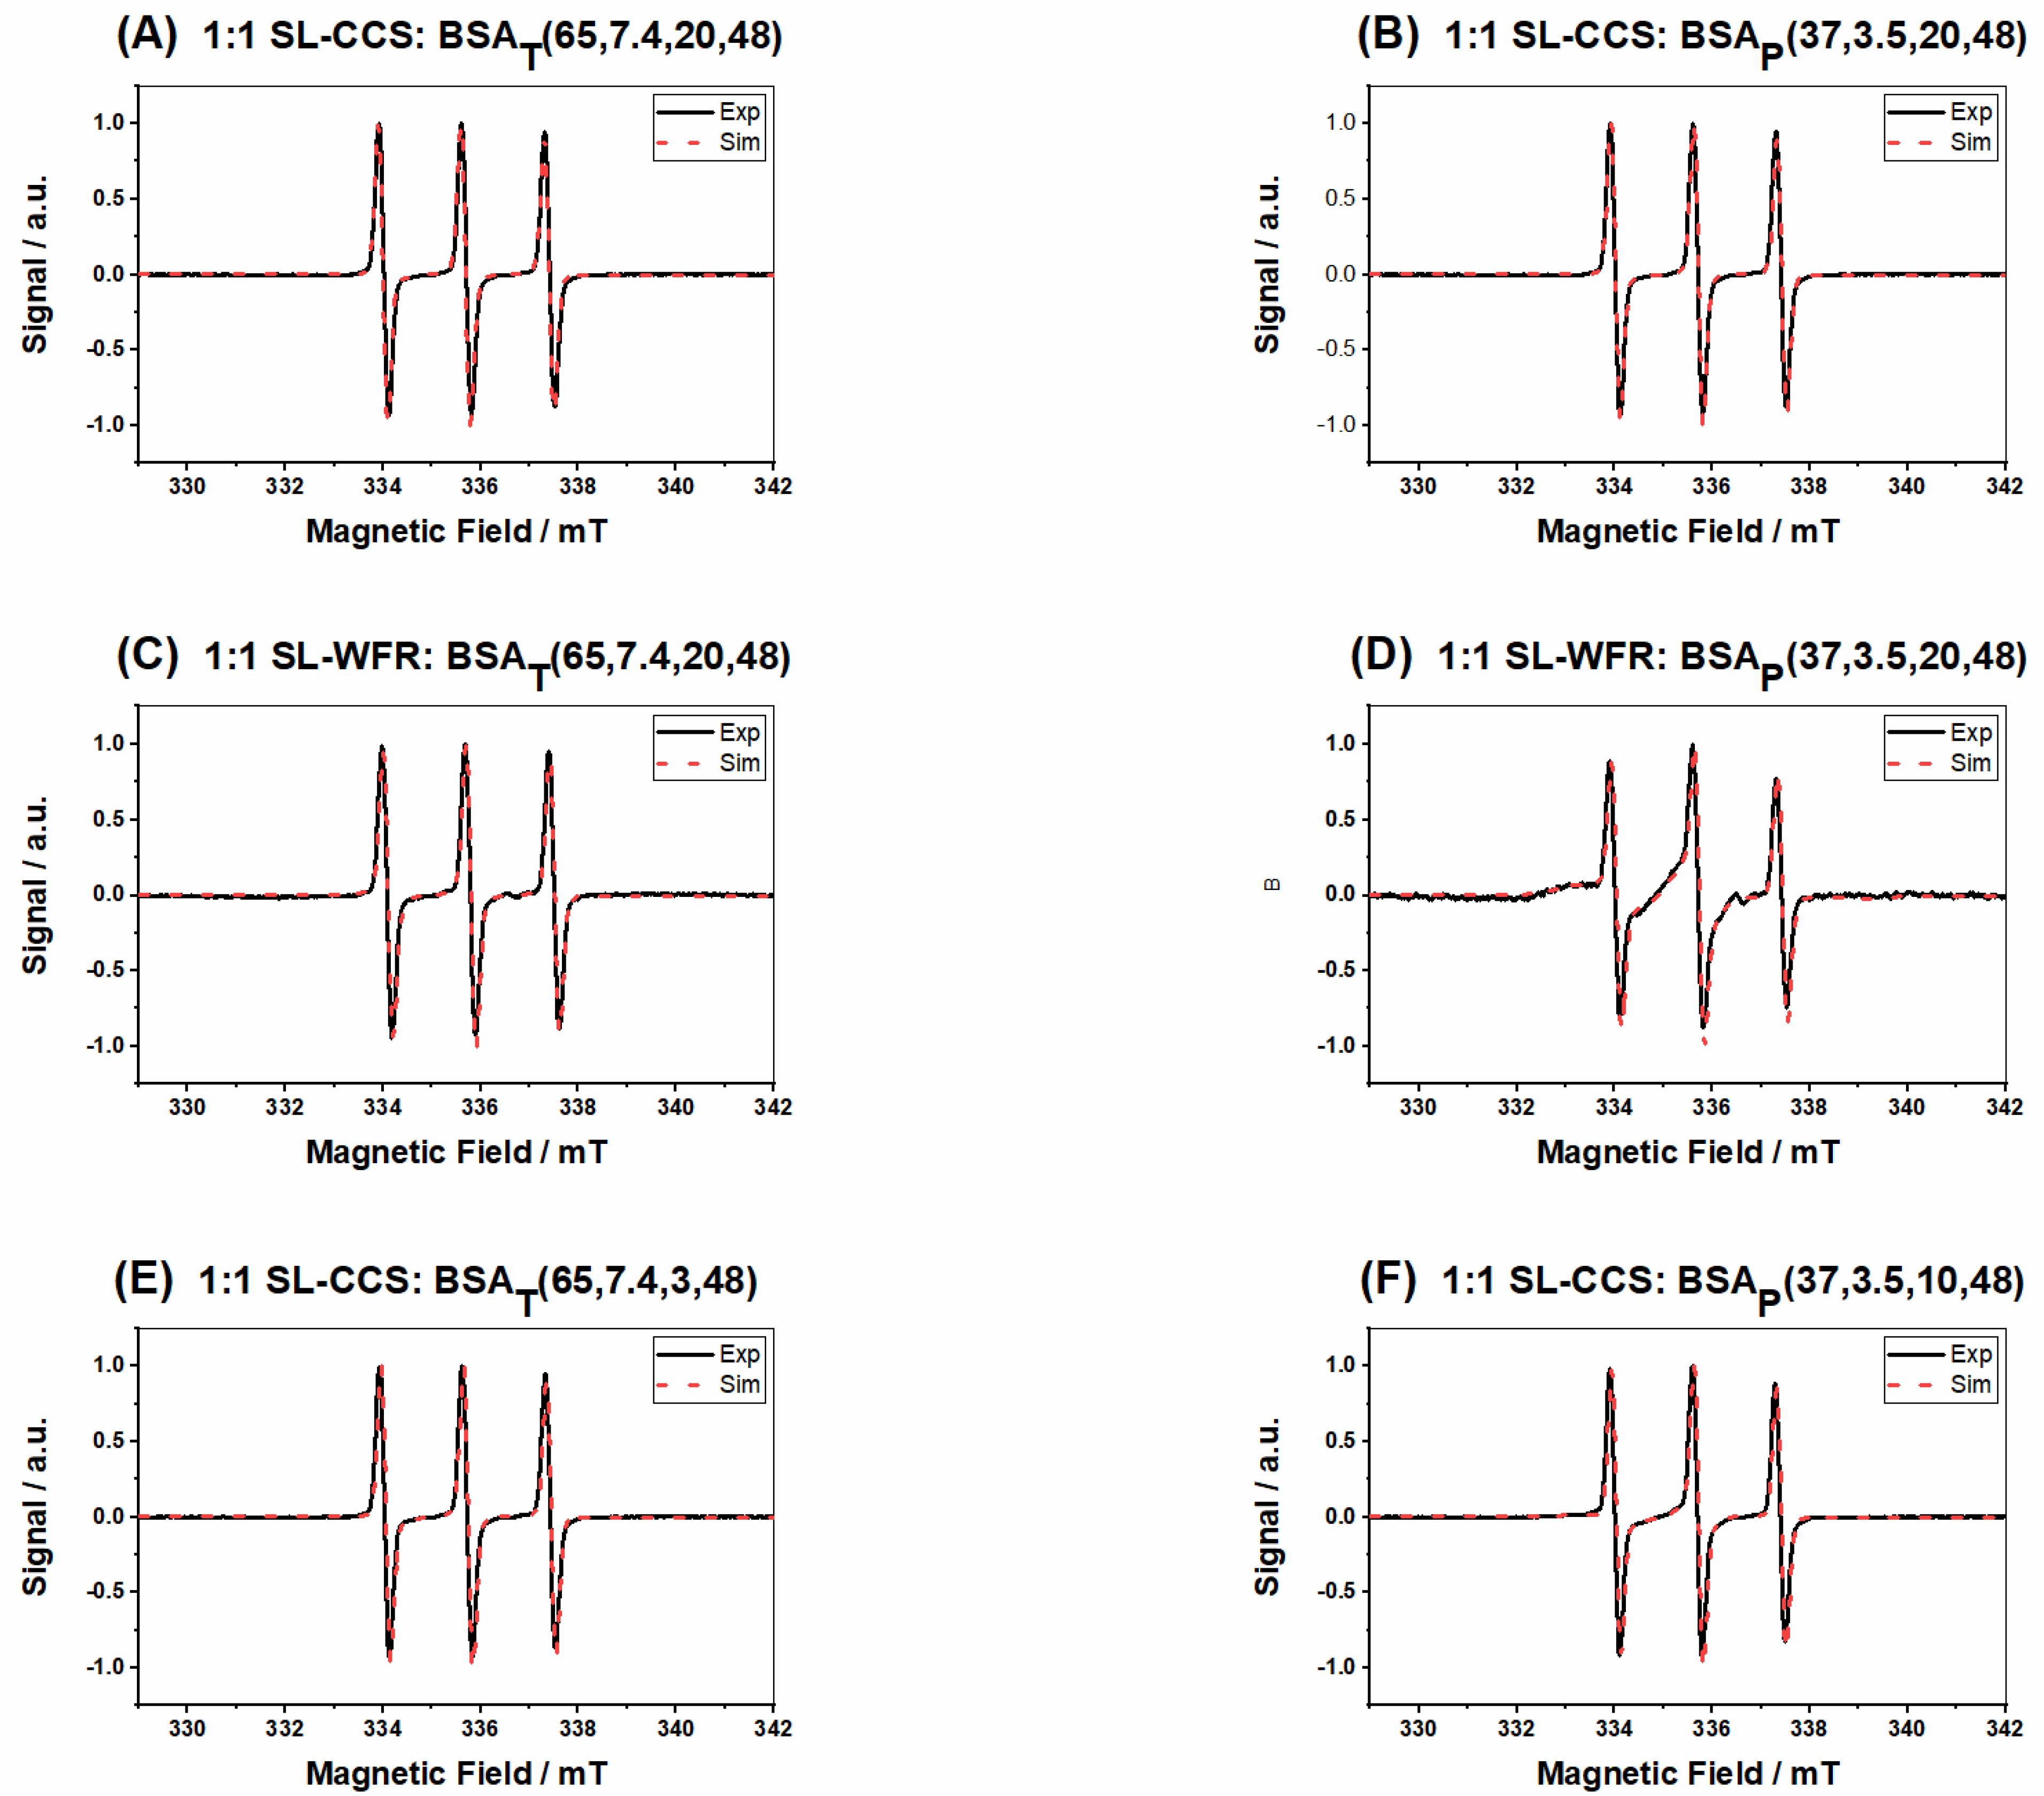
| Figure | Type of Released Components | Percentage (Bound, Intermediate and Free) | Figure | Type of Released Components | Percentage (Bound, Intermediate and Free) |
|---|---|---|---|---|---|
| A | Bound | 0 | D | Bound | 46% |
| Intermediate | 16% | Intermediate | 31% | ||
| Free | 84% | Free | 22% | ||
| B | Bound | 19% | E | Bound | 0 |
| Intermediate | 16% | Intermediate | 20% | ||
| Free | 63% | Free | 80% | ||
| C | Bound | 0 | F | Bound | 24% |
| Intermediate | 26% | Intermediate | 19% | ||
| Free | 73% | Free | 55% |
Publisher’s Note: MDPI stays neutral with regard to jurisdictional claims in published maps and institutional affiliations. |
© 2021 by the authors. Licensee MDPI, Basel, Switzerland. This article is an open access article distributed under the terms and conditions of the Creative Commons Attribution (CC BY) license (https://creativecommons.org/licenses/by/4.0/).
Share and Cite
Sanaeifar, N.; Mäder, K.; Hinderberger, D. Molecular-Level Release of Coumarin-3-Carboxylic Acid and Warfarin-Derivatives from BSA-Based Hydrogels. Pharmaceutics 2021, 13, 1661. https://doi.org/10.3390/pharmaceutics13101661
Sanaeifar N, Mäder K, Hinderberger D. Molecular-Level Release of Coumarin-3-Carboxylic Acid and Warfarin-Derivatives from BSA-Based Hydrogels. Pharmaceutics. 2021; 13(10):1661. https://doi.org/10.3390/pharmaceutics13101661
Chicago/Turabian StyleSanaeifar, Niuosha, Karsten Mäder, and Dariush Hinderberger. 2021. "Molecular-Level Release of Coumarin-3-Carboxylic Acid and Warfarin-Derivatives from BSA-Based Hydrogels" Pharmaceutics 13, no. 10: 1661. https://doi.org/10.3390/pharmaceutics13101661