
Integration of Transcriptomics and Metabolomics to Reveal the Molecular Mechanisms Underlying Rhodium Nanoparticles-Based Photodynamic Cancer Therapy


Abstract
:
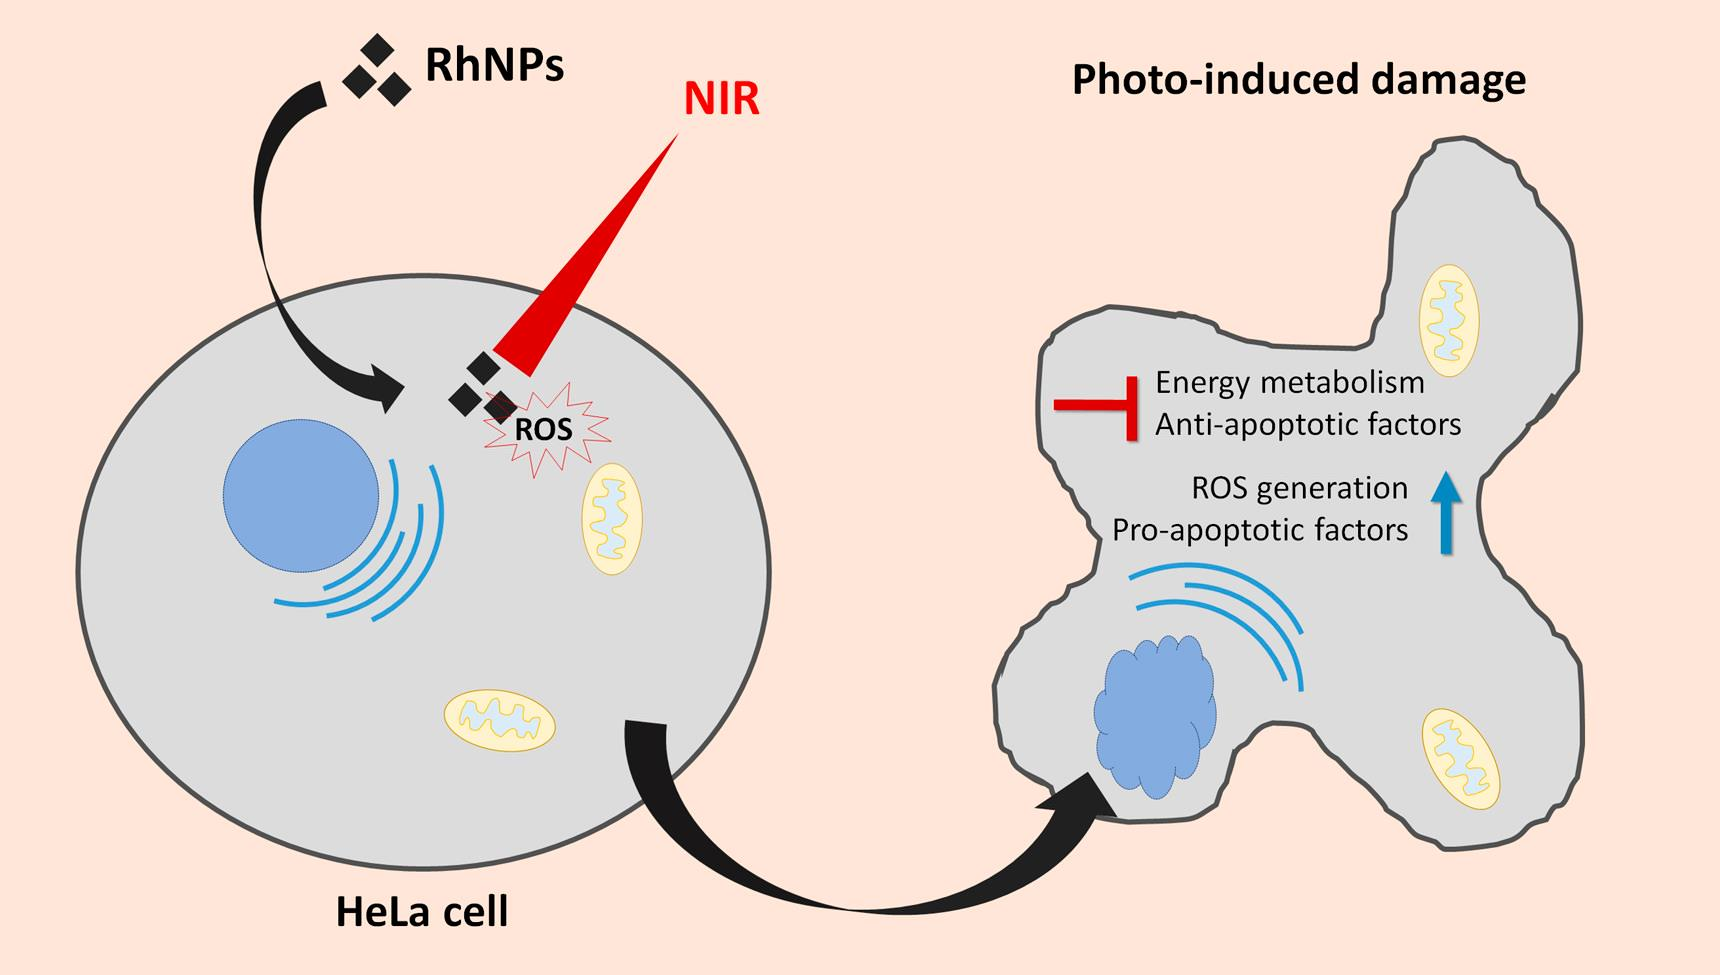
1. Introduction
2. Materials and Methods
2.1. Materials
2.2. Synthesis of RhNPs
2.3. Cell Culture and Exposure Conditions
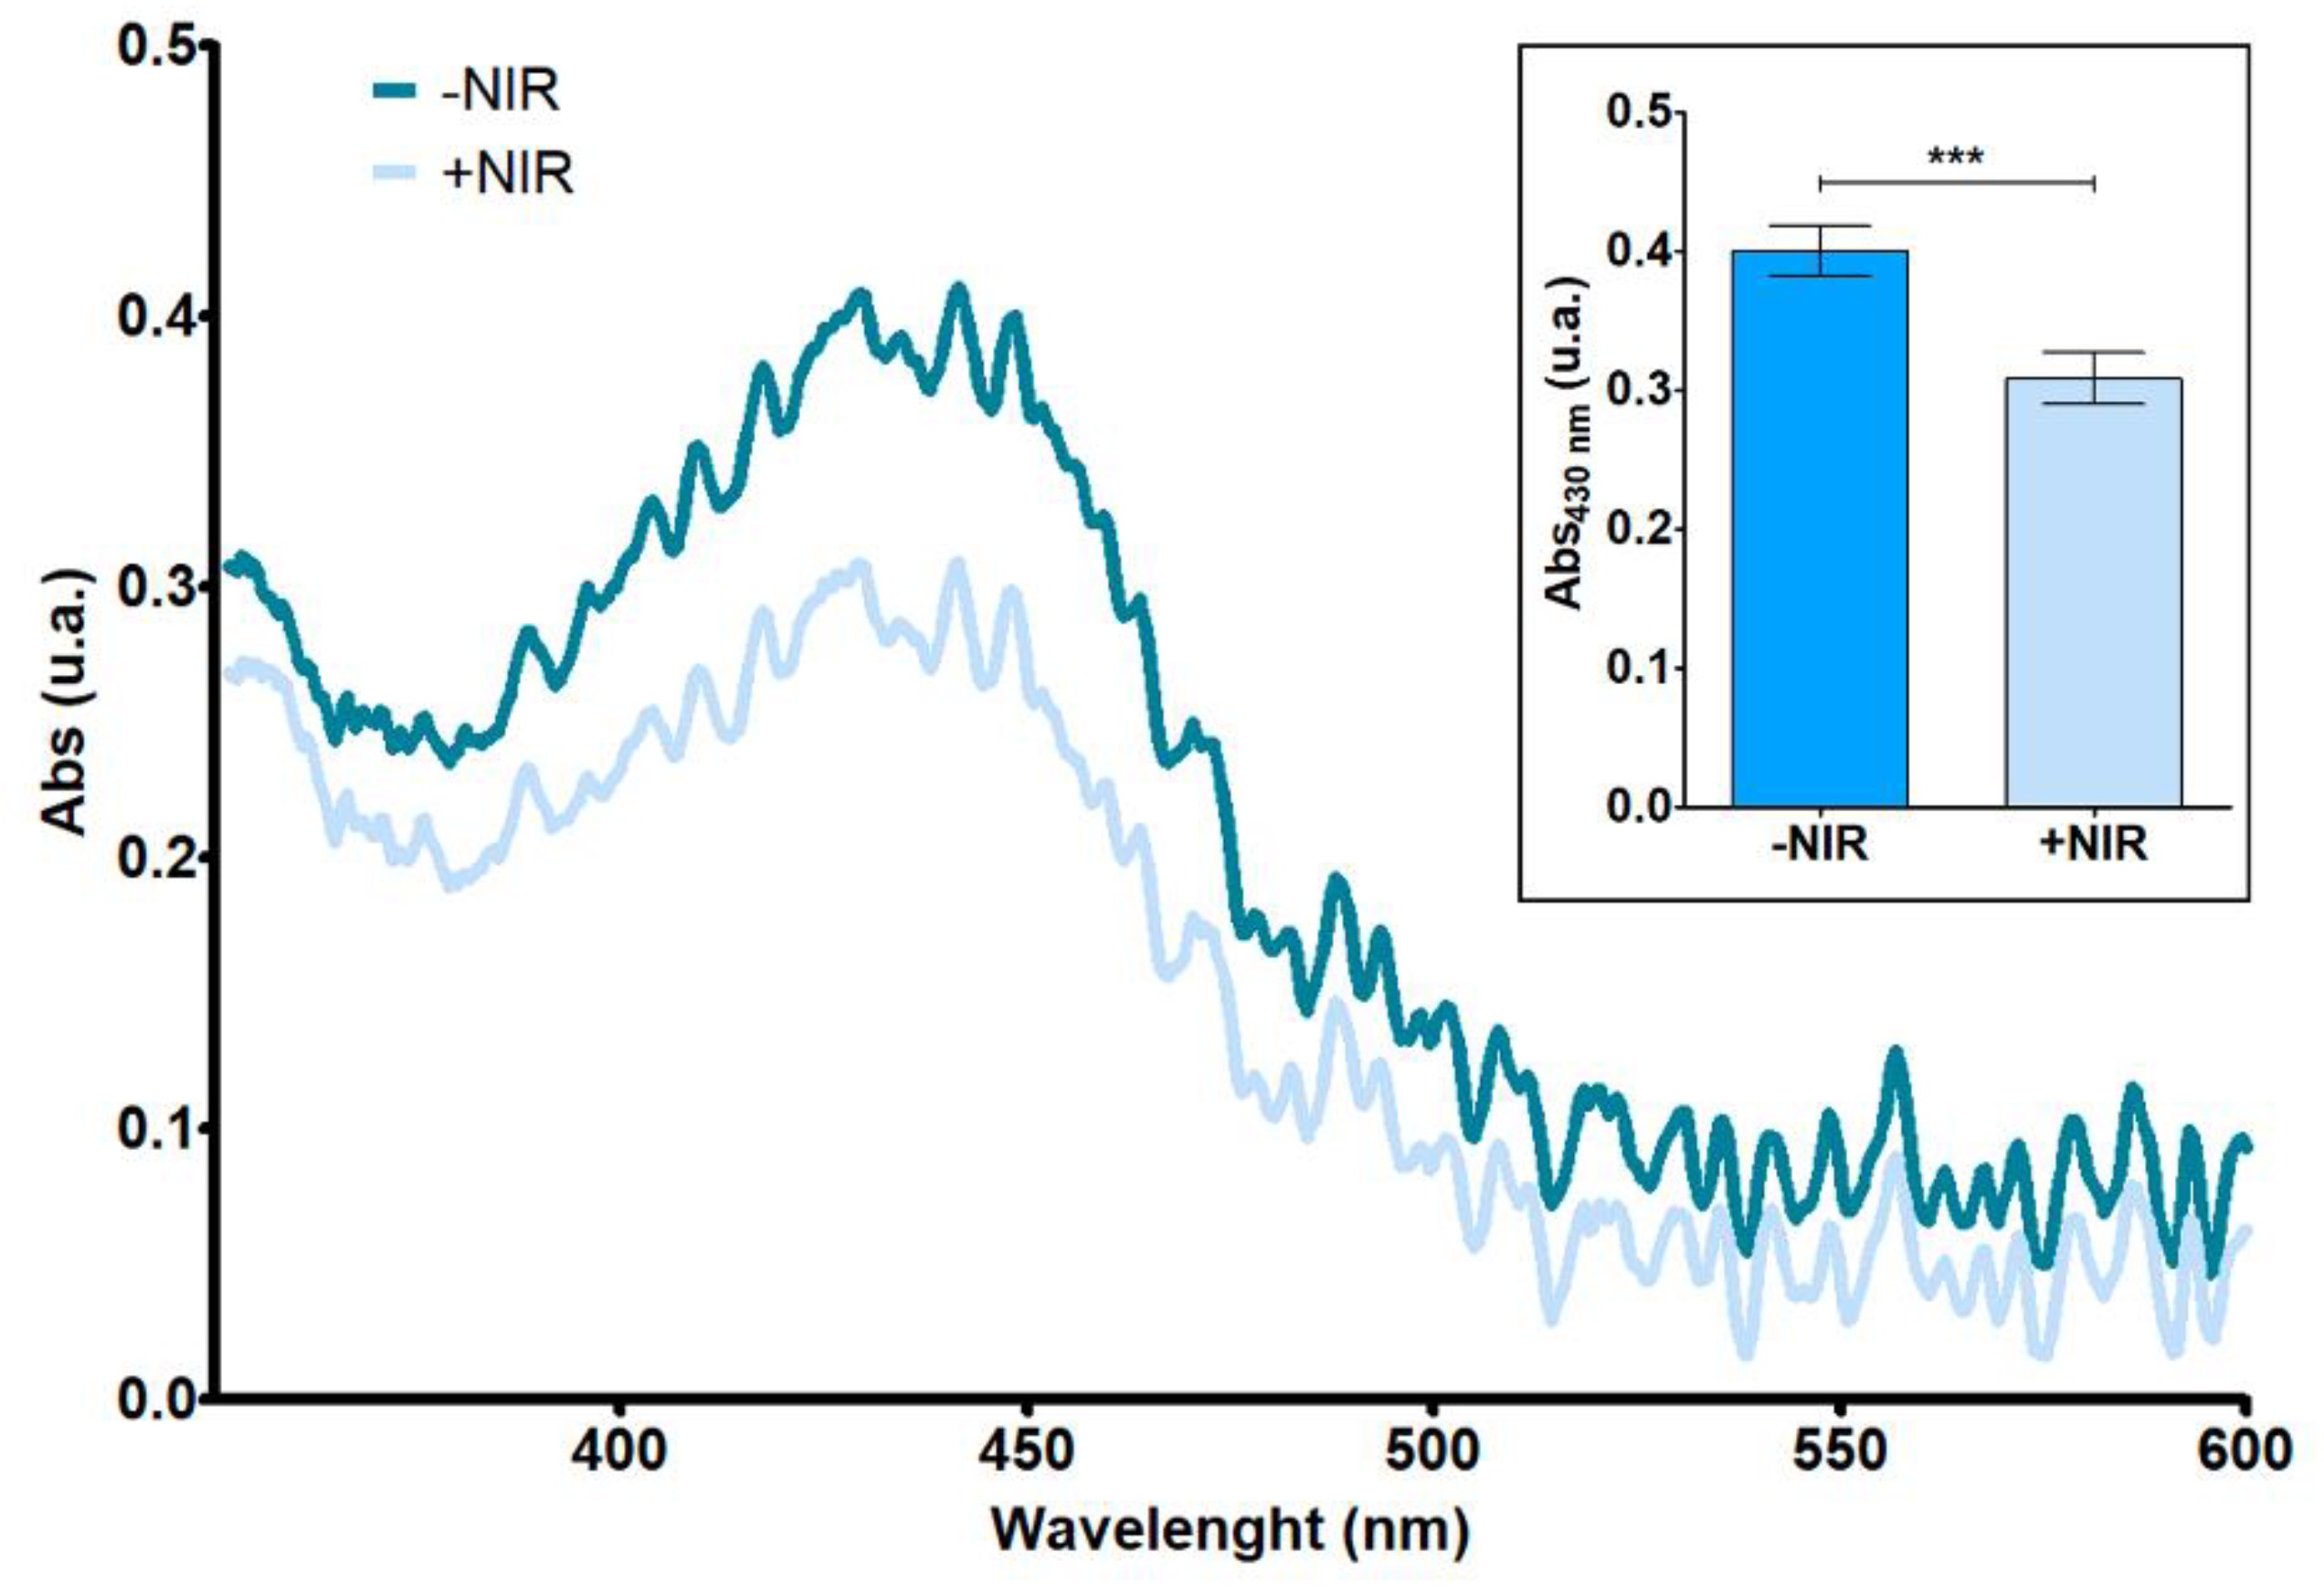
2.4. Singlet Oxygen Generation Assay
2.5. Transcriptome Profiling
2.6. Untargeted Metabolomics Analysis
2.6.1. Extraction of Metabolites
2.6.2. Metabolite Derivatization
2.6.3. GC-MS Analysis Conditions
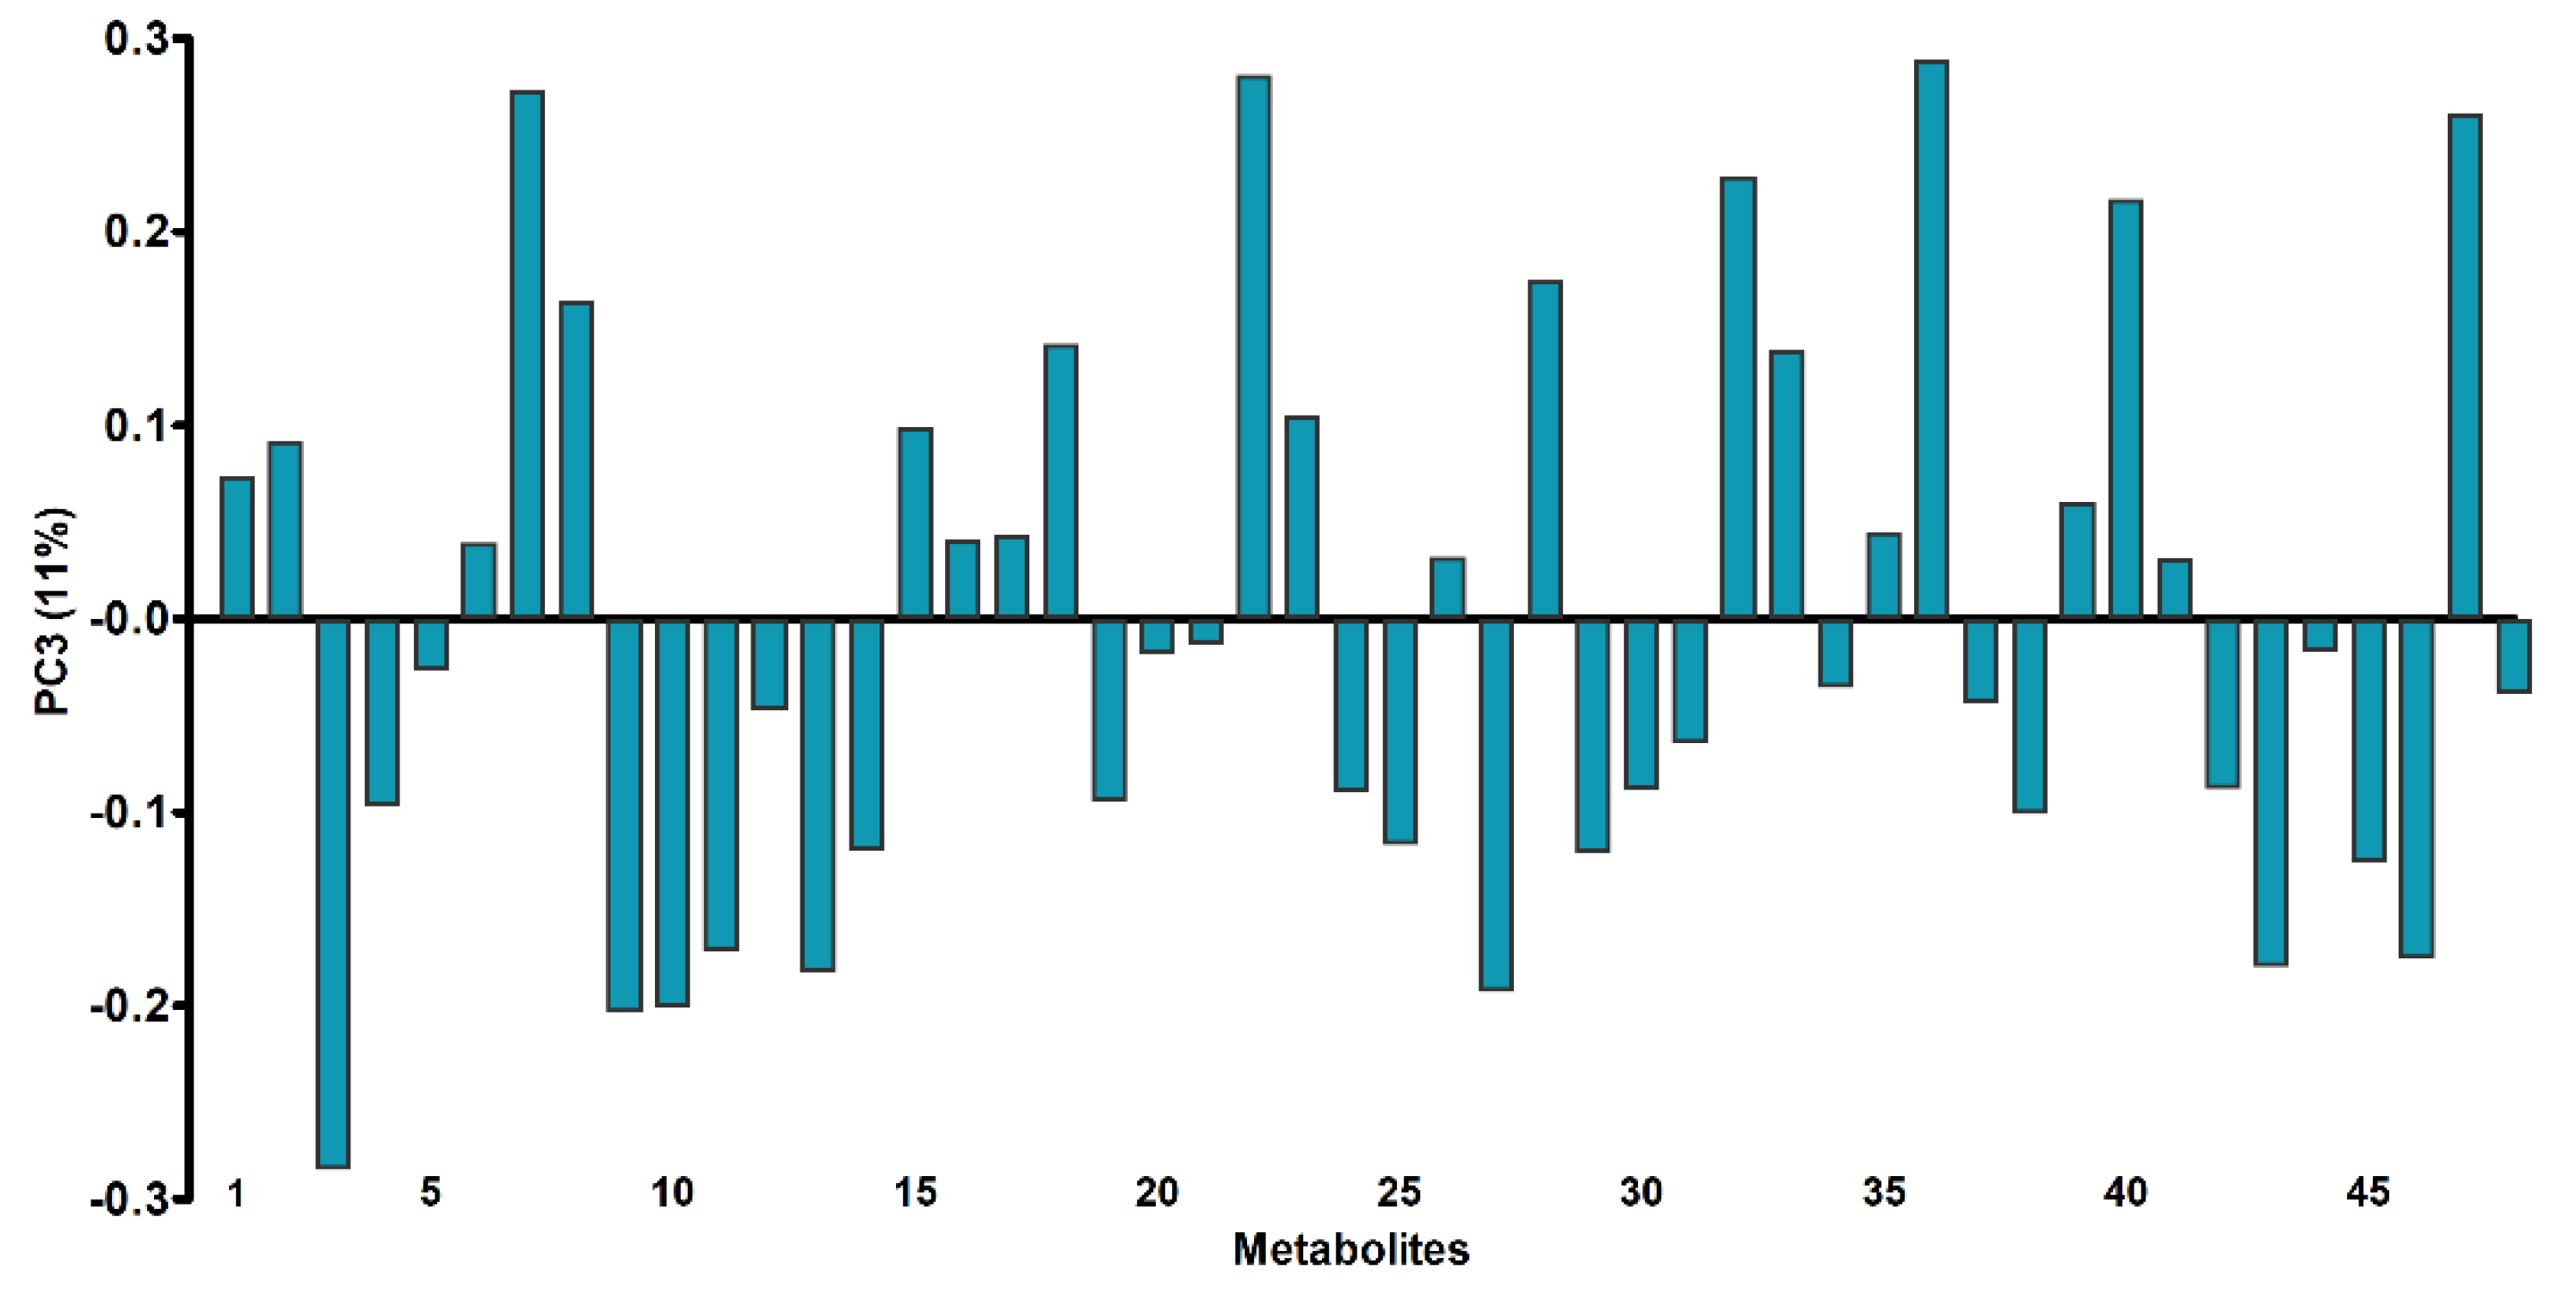
2.6.4. Data Treatment and Statistical Analysis
2.7. Targeted Metabolomics Analysis
2.7.1. Extraction of Energy-Related Metabolites
2.7.2. LC-QqQ-MS Analysis Conditions
2.7.3. Statistical Analysis
3. Results
3.1. Singlet Oxygen Generation Assay
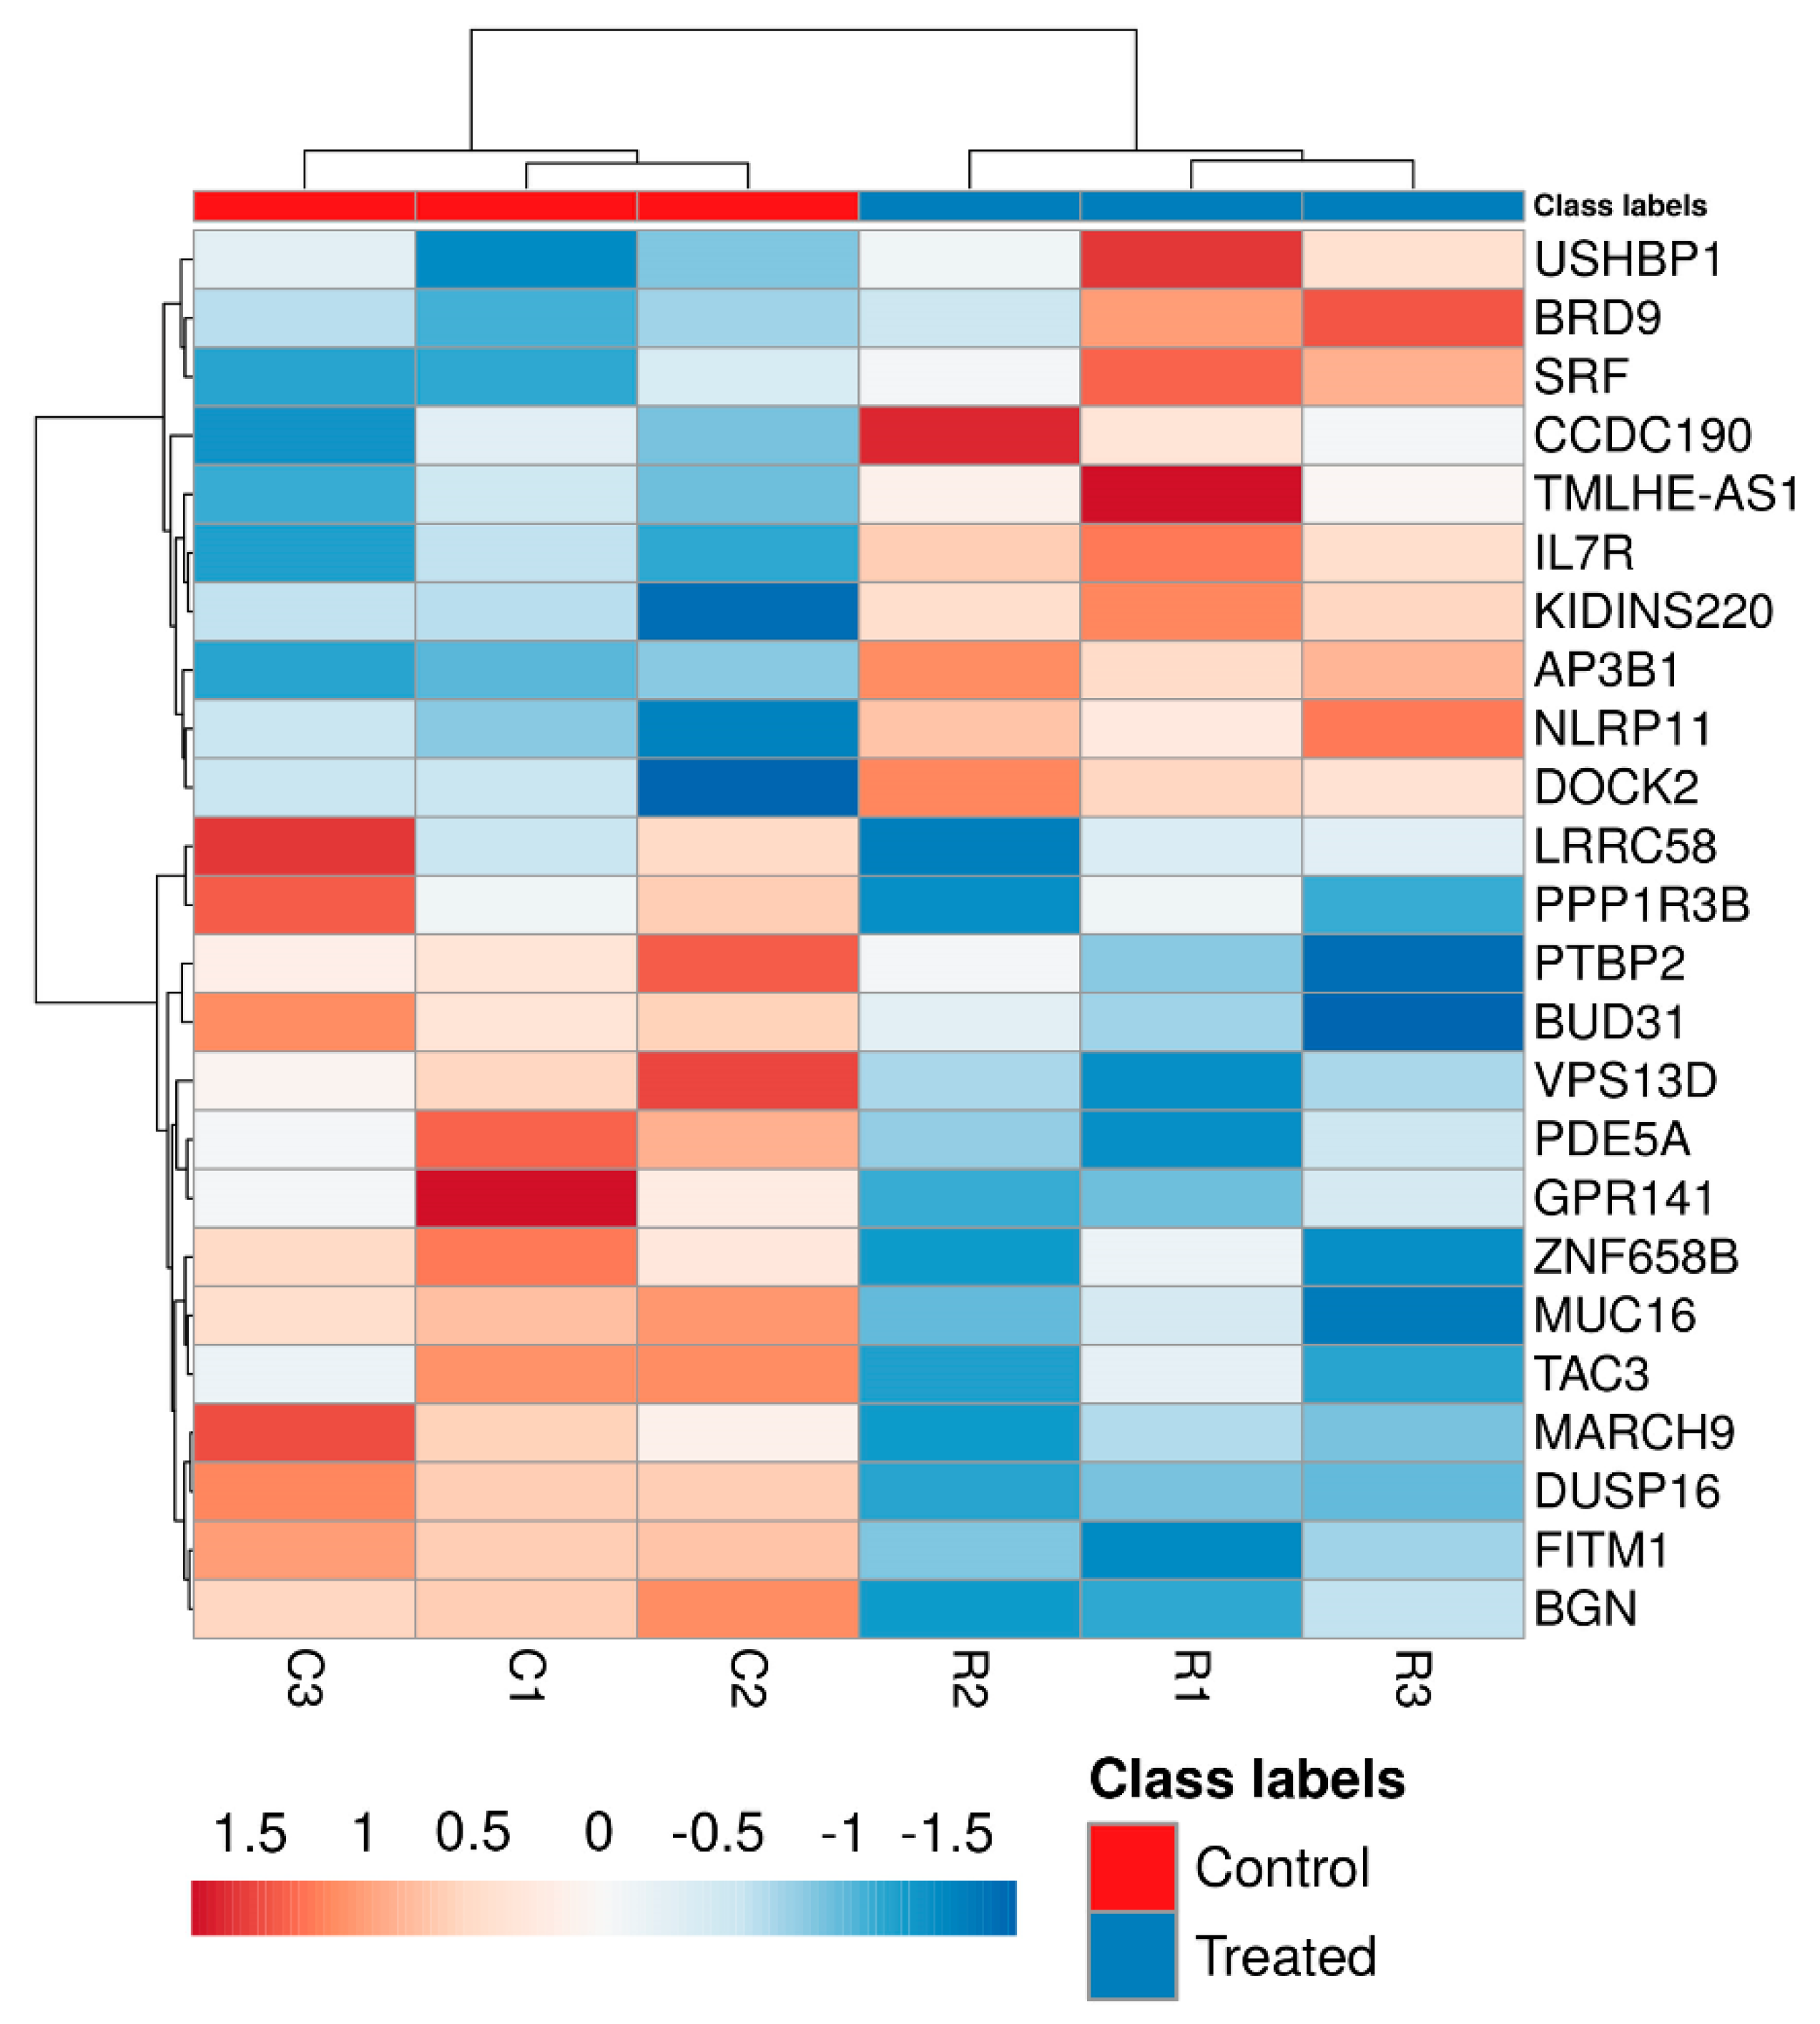
3.2. mRNA Expression Assay
3.3. Untargeted Metabolomics
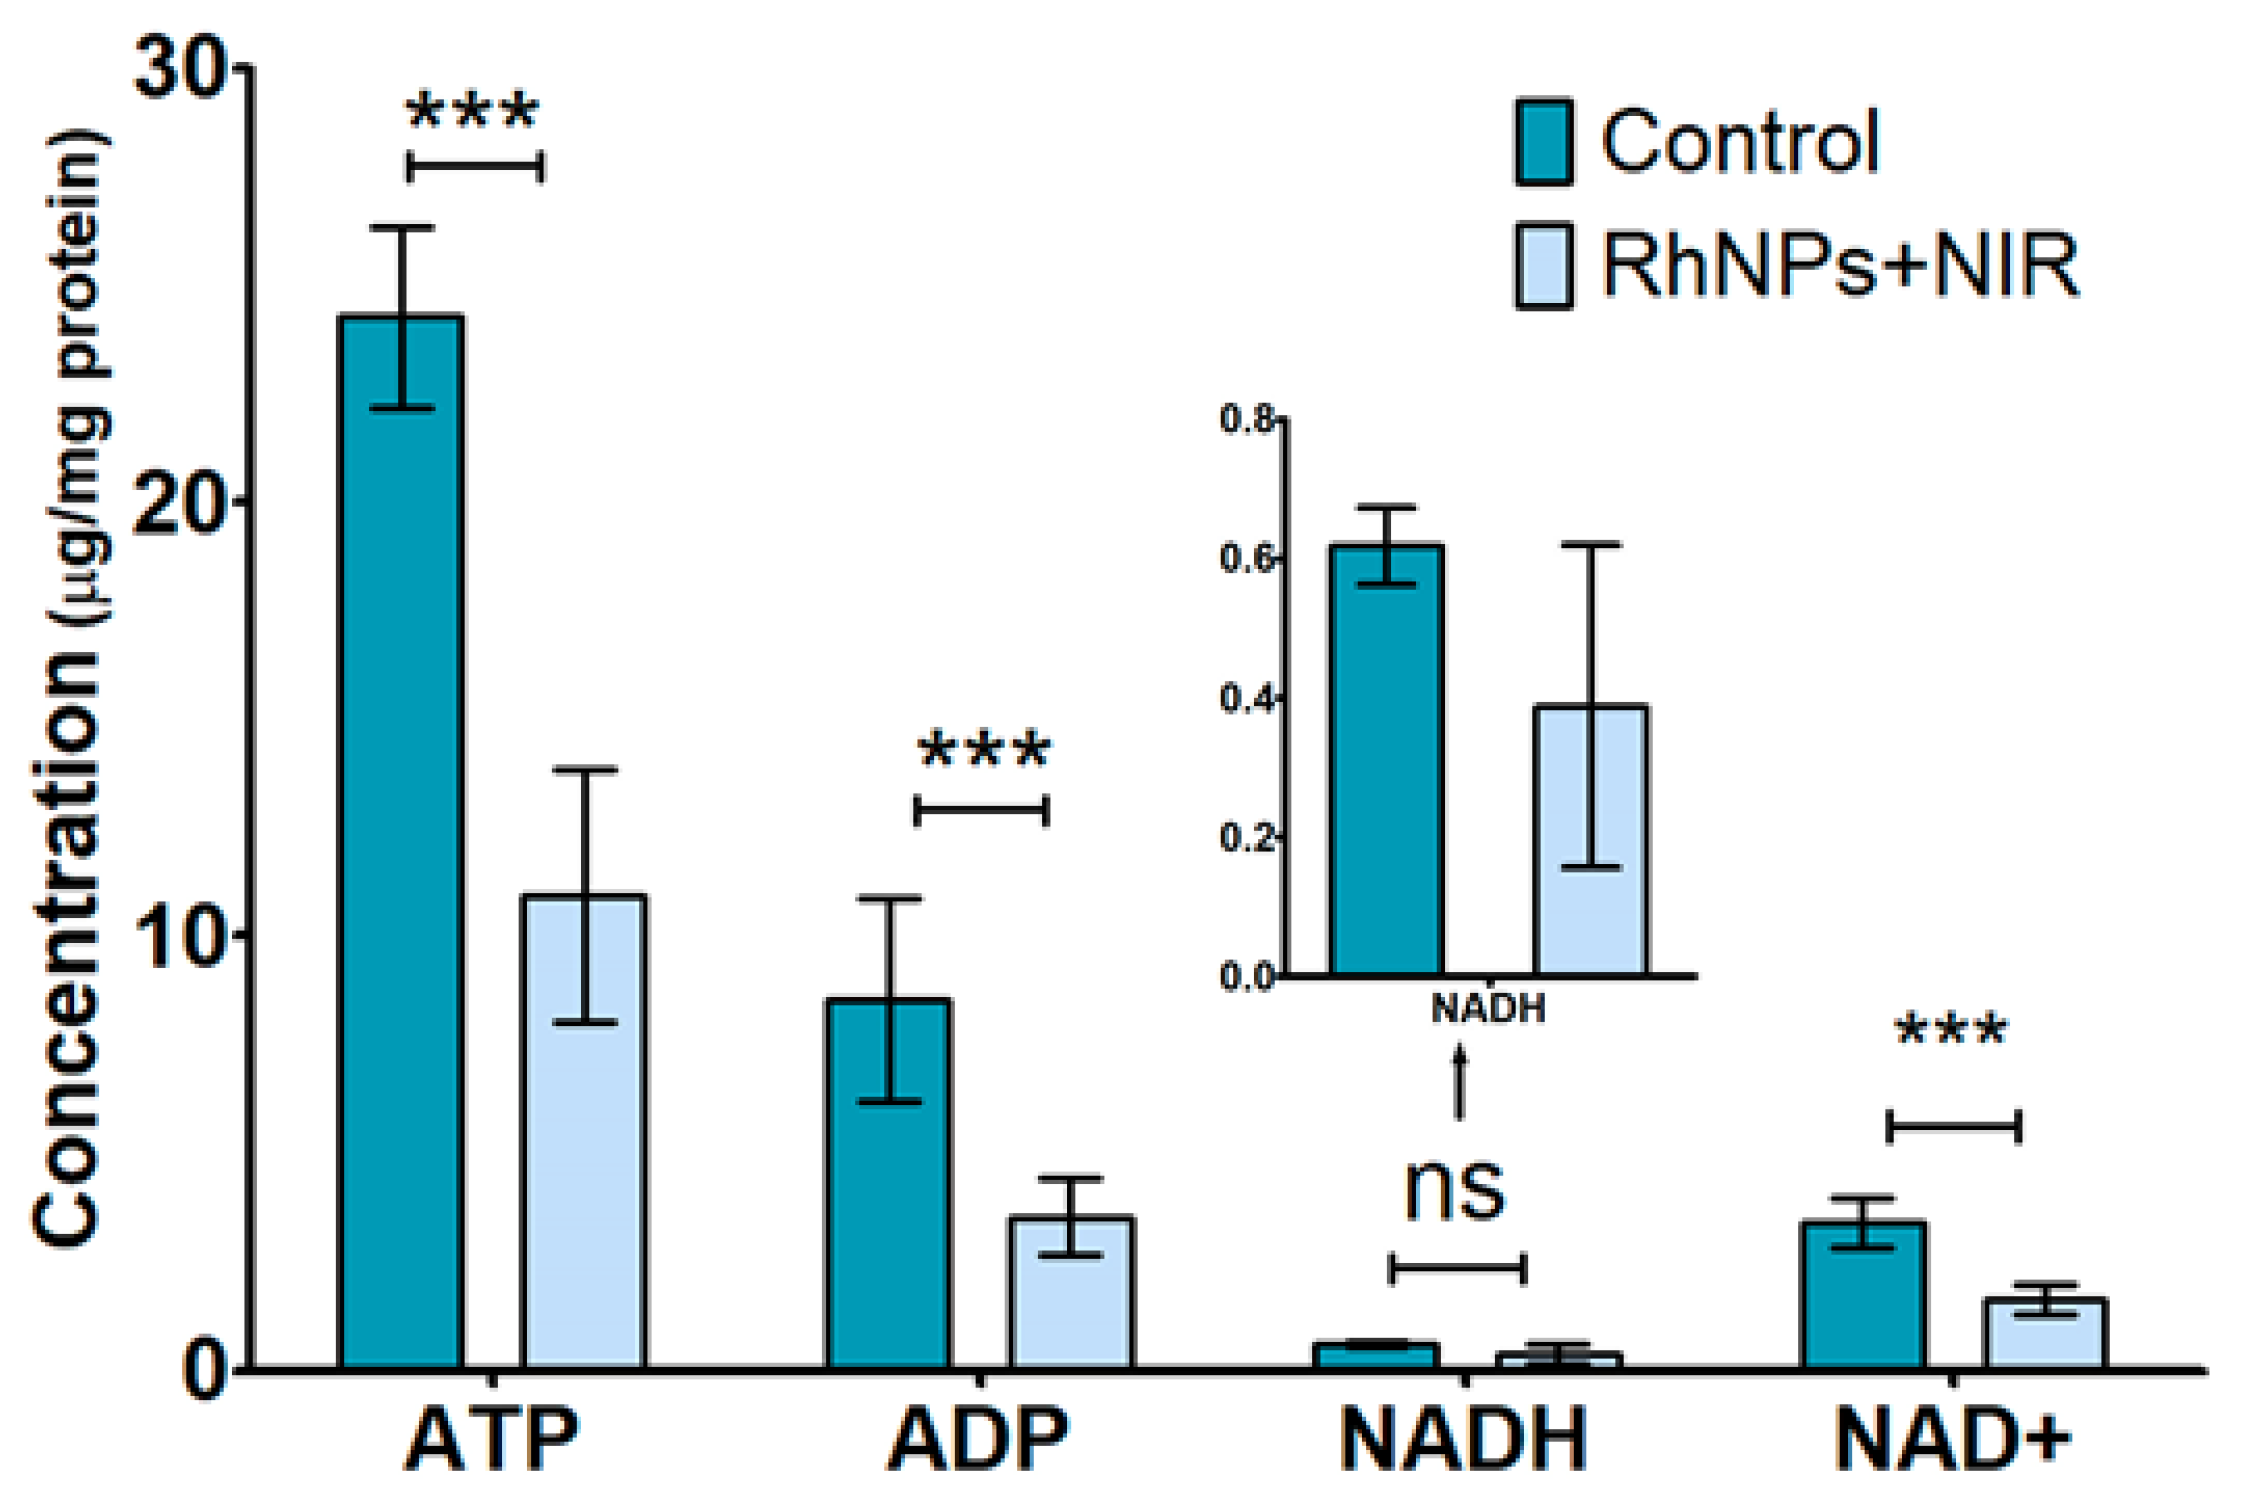
3.4. Targeted Metabolomics
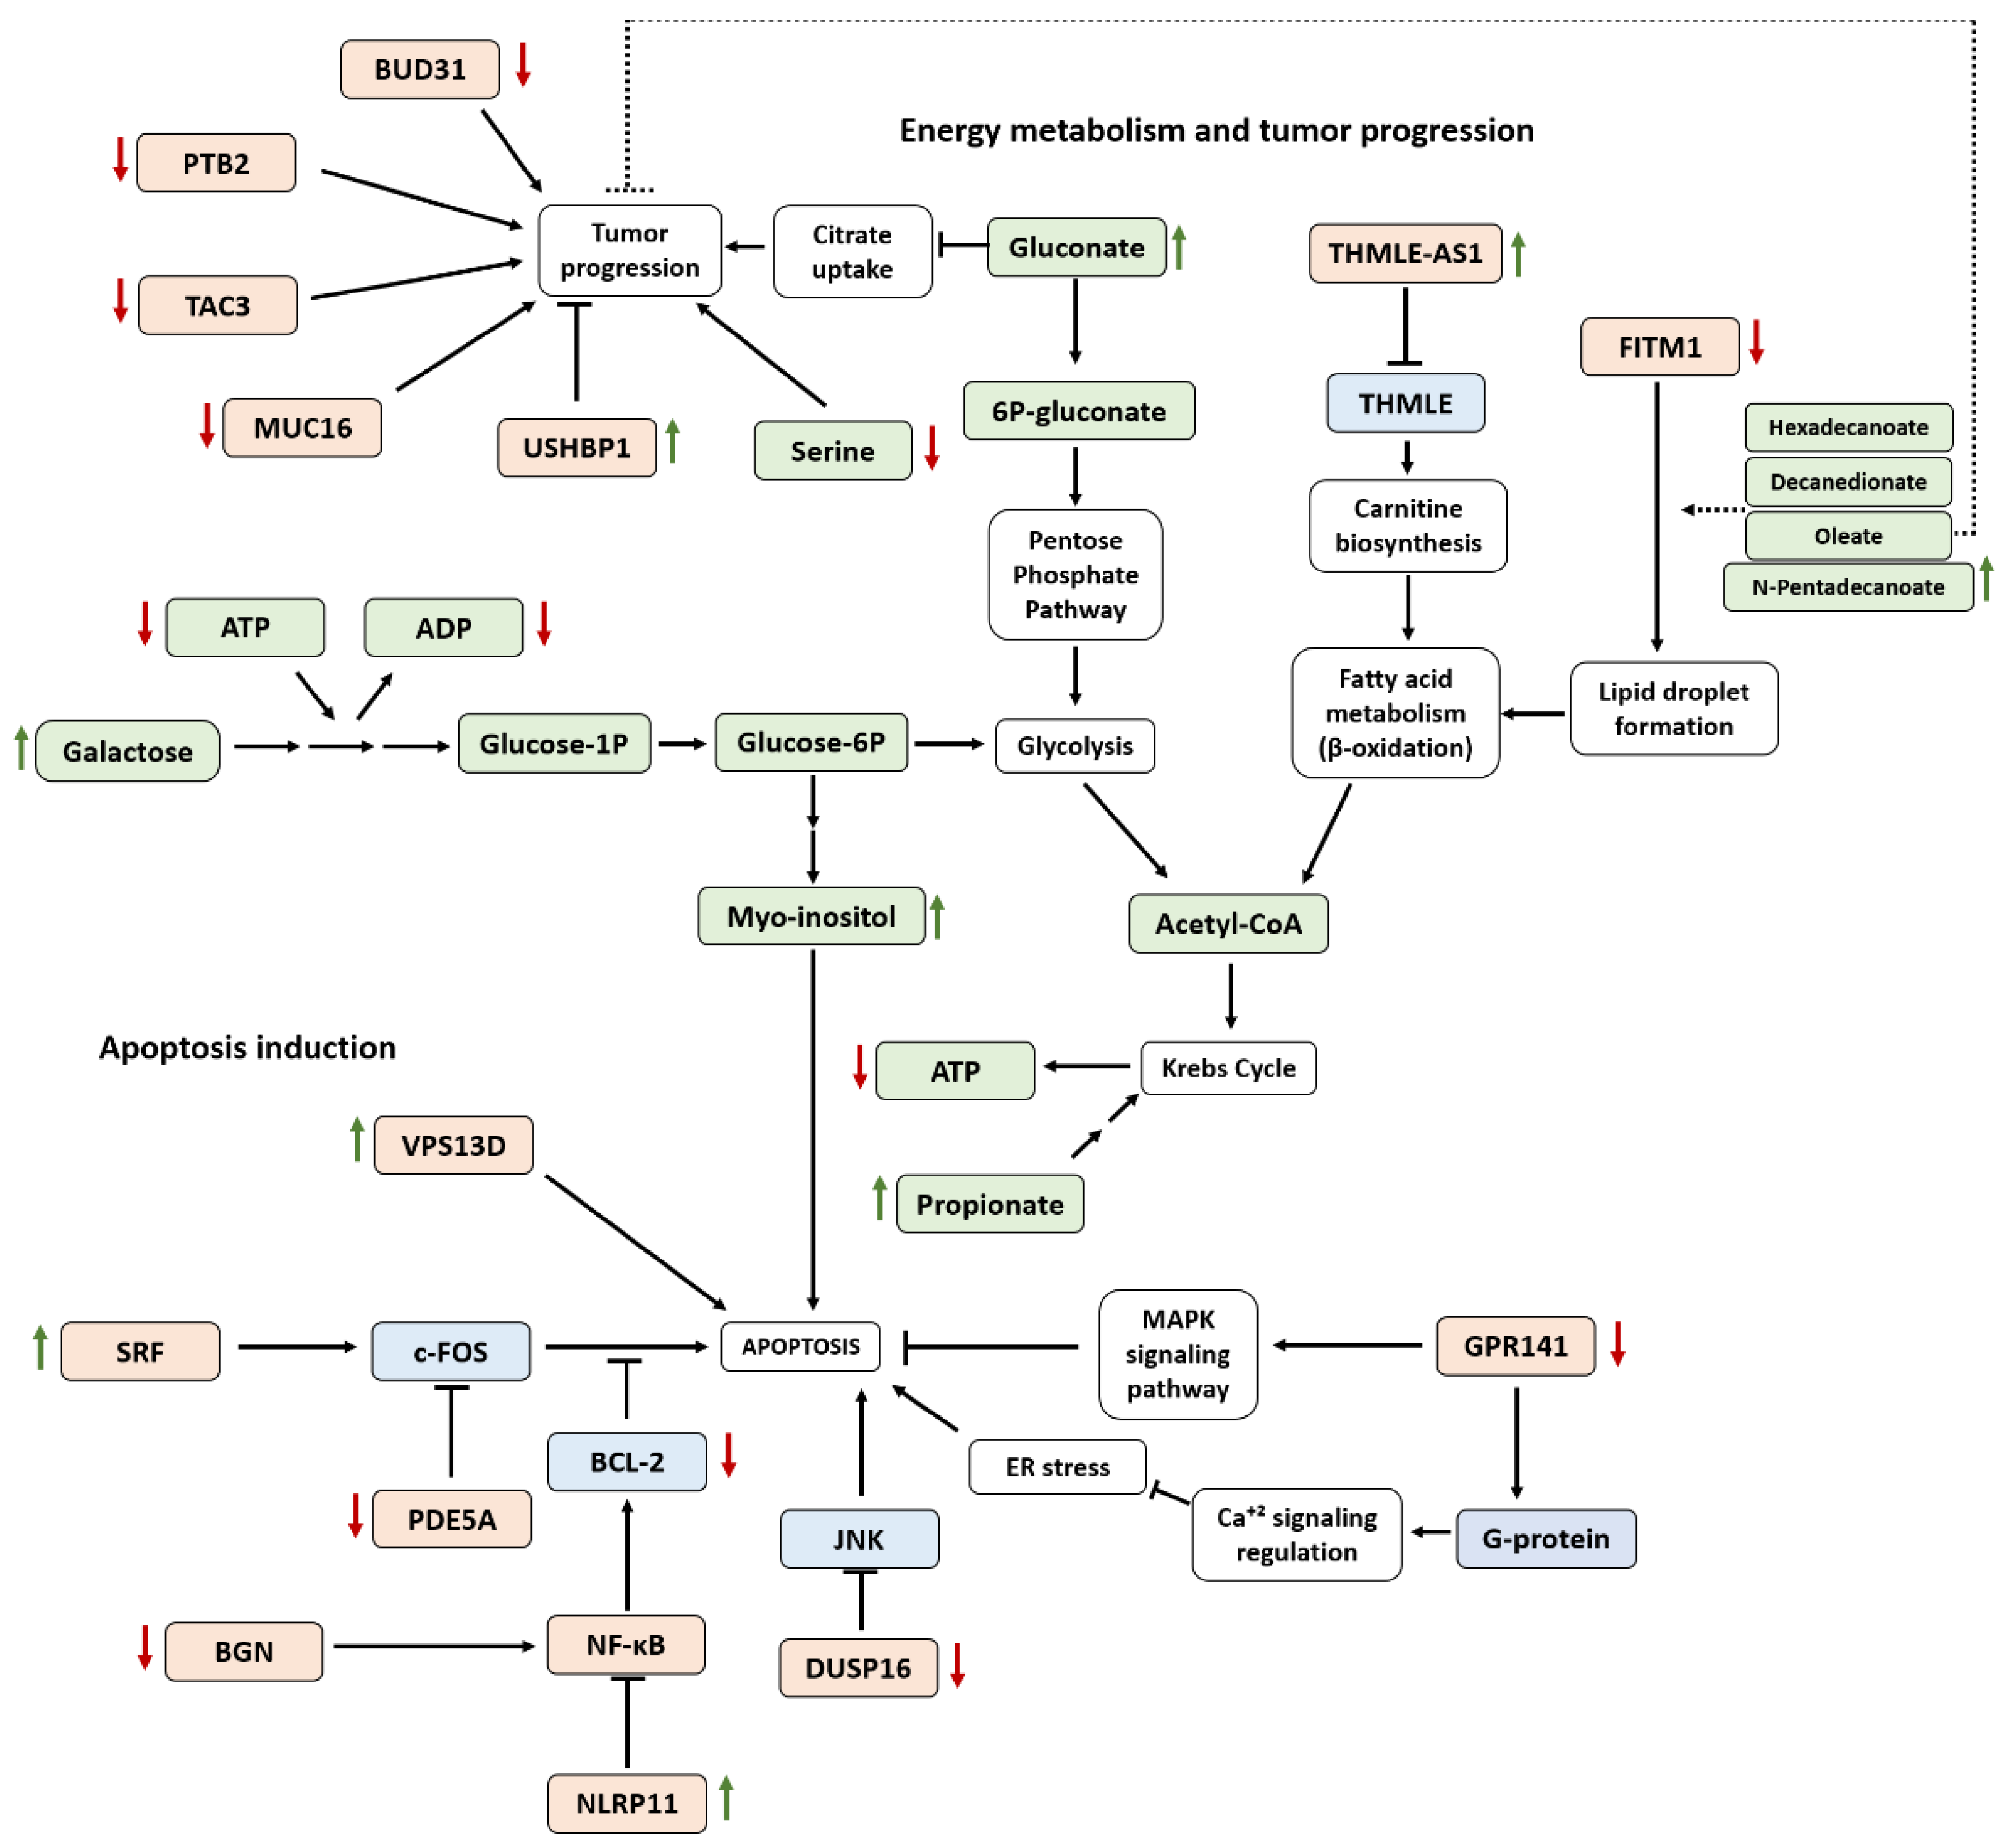
4. Discussion
5. Conclusions
Supplementary Materials
Author Contributions
Funding
Institutional Review Board Statement
Informed Consent Statement
Data Availability Statement
Acknowledgments
Conflicts of Interest
References
- Ng, C.; Baeg, G.H.; Yu, L.; Ong, C.; Bay, B.H. Biomedical applications of nanomaterials as therapeutics. Curr. Med. Chem. 2017, 25, 1409–1419. [Google Scholar] [CrossRef]
- Azharuddin, M.; Zhu, G.H.; Das, D.; Ozgur, E.; Uzun, L.; Turner, A.P.F.; Patra, H.K. A repertoire of biomedical applications of noble metal nanoparticles. Chem. Commun. 2019, 55, 6964–6996. [Google Scholar] [CrossRef]
- Klębowski, B.; Depciuch, J.; Parlińska-Wojtan, M.; Baran, J. Applications of noble metal-based nanoparticles in medicine. Int. J. Mol. Sci. 2018, 19, 4031. [Google Scholar] [CrossRef] [PubMed] [Green Version]
- Montalvo-Quiros, S.; Aragoneses-Cazorla, G.; Garcia-Alcalde, L.; Vallet-Regí, M.; González, B.; Luque-Garcia, J.L. Cancer cell targeting and therapeutic delivery of silver nanoparticles by mesoporous silica nanocarriers: Insights into the action mechanisms using quantitative proteomics. Nanoscale 2019, 11, 4531–4545. [Google Scholar] [CrossRef] [PubMed]
- Sharma, A.; Goyal, A.K.; Rath, G. Recent advances in metal nanoparticles in cancer therapy. J. Drug Target. 2017, 26, 617–632. [Google Scholar] [CrossRef]
- Aragoneses-Cazorla, G.; Serrano-Lopez, J.; Martinez-Alfonzo, I.; Vallet-Regí, M.; González, B.; Luque-Garcia, J.L. A novel hemocompatible core@shell nanosystem for selective targeting and apoptosis induction in cancer cells. Inorg. Chem. Front. 2021, 8, 2697–2712. [Google Scholar] [CrossRef]
- Fernández, M.N.; Muñoz-Olivas, R.; Luque-Garcia, J.L. SILAC-based quantitative proteomics identifies size-dependent molecular mechanisms involved in silver nanoparticles-induced toxicity. Nanotoxicology 2019, 13, 812–826. [Google Scholar] [CrossRef]
- Estevez, H.; Garcia-Calvo, E.; Rivera-Torres, J.; Vallet-Regí, M.; Luque-Garcia, J.L. Transcriptome analysis identifies novel mechanisms associated to the anti-tumoral effect of chitosan-stabilized selenium nanoparticles. Pharmaceutics 2021, 13, 356. [Google Scholar] [CrossRef]
- Ozog, D.M.; Rkein, A.M.; Fabi, S.G.; Gold, M.H.; Goldman, M.P.; Lowe, N.J.; Martin, G.M.; Munavalli, G.S. Photodynamic therapy: A clinical consensus guide. Dermatol. Surg. 2016, 42, 804–827. [Google Scholar] [CrossRef] [PubMed]
- Abrahamse, H.; Kruger, C.A.; Kadanyo, S.; Mishra, A. Nanoparticles for advanced photodynamic therapy of cancer. Photomed. Laser Surg. 2017, 35, 581–588. [Google Scholar] [CrossRef]
- Dolmans, D.; Fukumura, D.; Jain, R.K. Photodynamic therapy for cancer. Nat. Rev. Cancer. 2003, 3, 380–387. [Google Scholar] [CrossRef] [PubMed]
- Machuca, A.; Garcia-Calvo, E.; Anunciação, D.S.; Luque-Garcia, J.L. Rhodium nanoparticles as a novel photosensitizing agent in photodynamic therapy against cancer. Chem. A Eur. J. 2020, 26, 7685–7691. [Google Scholar] [CrossRef]
- Garcia-Calvo, E.; Machuca, A.; Nerín, C.; Rosales-Conrado, N.; Luque-Garcia, J.L. Integration of untargeted and targeted mass spectrometry-based metabolomics provides novel insights into the potential toxicity associated to surfynol. Food Chem. Toxicol. 2020, 146, 111849. [Google Scholar] [CrossRef] [PubMed]
- Hasin, Y.; Seldin, M.; Lusis, A. Multi-omics approaches to disease. Genome Biol. 2017, 18, 1–15. [Google Scholar] [CrossRef] [PubMed]
- Chakraborty, S.; Hosen, M.I.; Ahmed, M.; Shekhar, H.U. Onco-Multi-OMICS approach: A new frontier in cancer research. Biomed Res. Int. 2018, 2018, 9836256. [Google Scholar] [CrossRef] [Green Version]
- Wang, L.X.; Li, J.W.; Huang, J.Y.; Li, J.H.; Zhang, L.J.; O´Shea, D.; Chen, Z.L. Antitumor activity of photodynamic therapy with a chlorin derivative in vitro and in vivo. Tumor Biol. 2015, 36, 6839–6847. [Google Scholar] [CrossRef]
- Tang, W.; Xu, H.; Kopelman, R.; Philbert, M.A. Photodynamic characterization and in vitro application of methylene blue-containing nanoparticle platforms. Photochem. Photobiol. 2005, 81, 242–249. [Google Scholar] [CrossRef] [Green Version]
- Ouyang, X.; Wang, X.; Kraatz, H.B.; Ahmadi, S.; Gao, J.; Lv, Y.; Sun, X.; Huang, Y. A Trojan horse biomimetic delivery strategy using mesenchymal stem cells for PDT/PTT therapy against lung melanoma metastasis. Biomater. Sci. 2020, 8, 1160–1170. [Google Scholar] [CrossRef]
- Metsalu, T.; Vilo, J. ClustVis: A web tool for visualizing clustering of multivariate data using Principal Component Analysis and heatmap. Nucleic Acids Res. 2015, 43, 566–570. [Google Scholar] [CrossRef]
- Papadimitropoulos, M.E.P.; Vasilopoulou, C.G.; Maga-Nteve, C.; Klapa, M.I. Untargeted GC-MS metabolomics. Methods Mol. Biol. 2018, 1738, 133–147. [Google Scholar]
- Farber, B.; Larson, R. Elementary Statistics: Picturing the World, 3rd ed.; Pearson Education, Inc.: Boston, MA, USA, 2012; pp. 289–298. [Google Scholar]
- Chanana, S.; Thomas, C.S.; Zhang, F.; Rajski, S.R.; Bugni, T.S. HCAPCA: Automated hierarchical clustering and principal component analysis of large metabolomic datasets in R. Metabolites 2020, 10, 297. [Google Scholar] [CrossRef]
- Ghobrial, I.M.; Witzig, T.E.; Adjei, A.A. Targeting apoptosis signaling pathways in cancer therapy. CA Cancer J. Clin. 2005, 55, 178–194. [Google Scholar] [CrossRef]
- Evan, G.I.; Vousden, K.H. Proliferation, cell cycle and apoptosis in cancer. Nature 2011, 411, 342–348. [Google Scholar] [CrossRef]
- Liu, B.; Xu, T.; Xu, X.; Cui, Y.; Xing, X. Biglycan promotes the chemotherapy resistance of colon cancer by activating NF-κB signal transduction. Mol. Cell. Biochem. 2018, 449, 285–294. [Google Scholar] [CrossRef]
- Bharti, A.C.; Aggarwal, B.B. Nuclear factor-kappa B and cancer: Its role in prevention and therapy. Biochem. Pharmacol. 2002, 64, 883–888. [Google Scholar] [CrossRef]
- Preston, G.A.; Lyon, T.T.; Yin, Y.; Lang, J.E.; Solomon, G.; Annab, L.; Srinivasan, D.G.; Alcorta, D.A.; Barrett, J.C. Induction of apoptosis by c-Fos protein. Mol. Cell. Biol. 1996, 16, 211–218. [Google Scholar] [CrossRef] [PubMed] [Green Version]
- Ely, H.A.; Mellon, P.L.; Coss, D. GnRH induces the c-Fos gene via phosphorylation of SRF by the calcium/calmodulin kinase II pathway. Mol. Endocrinol. 2011, 25, 669–680. [Google Scholar] [CrossRef] [PubMed] [Green Version]
- Das, A.; Durrant, D.; Salloum, F.N.; Xi, L.; Kukreja, R.C. PDE5 inhibitors as therapeutics for heart disease, diabetes and cancer. Pharmacol. Ther. 2014, 147, 12–21. [Google Scholar] [CrossRef] [PubMed] [Green Version]
- Klutzny, S.; Anurin, A.; Nicke, B.; Regan, J.L.; Lange, M.; Schulze, L.; Parczyk, K.; Steigemann, P. PDE5 inhibition eliminates cancer stem cells via induction of PKA signaling. Cell Death Dis. 2018, 9, 192. [Google Scholar] [CrossRef] [Green Version]
- Dorsam, R.T.; Gutkind, J.S. G-protein-coupled receptors and cancer. Nat. Rev. Cancer. 2007, 7, 79–94. [Google Scholar] [CrossRef]
- Gudermann, T.; Bader, M. Receptors, G proteins, and integration of calcium signaling. J. Mol. Med. 2015, 93, 937–940. [Google Scholar] [CrossRef] [Green Version]
- Kim, E.K.; Choi, E.J. Pathological roles of MAPK signaling pathways in human diseases. Biochim. Biophys. 2010, 1802, 396–405. [Google Scholar] [CrossRef] [Green Version]
- Ha, J.; Kang, E.; Seo, J.; Cho, S. Phosphorylation dynamics of JNK signaling: Effects of dual-specificity phosphatases (DUSPs) on the JNK pathway. Int. J. Mol. Sci. 2019, 20, 6157. [Google Scholar] [CrossRef] [Green Version]
- Dhanasekaran, D.N.; Reddy, E.P. JNK signaling in apoptosis. Oncogene 2008, 27, 6245–6251. [Google Scholar] [CrossRef] [Green Version]
- Wagner, E.F.; Behrens, A.; Sibilia, M. Amino-terminal phosphorylation of c-Jun regulates stress-induced apoptosis and cellular proliferation. Nat. Genet. 1999, 21, 326–329. [Google Scholar]
- Hsu, T.Y.T.; Simon, L.M.; Neill, N.J.; Marcotte, R.; Sayad, A.; Bland, C.S.; Echeverria, G.V.; Sun, T.; Kurley, S.J.; Tyagi, S.; et al. The spliceosome is a therapeutic vulnerability in MYC-driven cancer. Nature 2015, 525, 384–388. [Google Scholar] [CrossRef] [PubMed]
- Reinartz, S.; Failer, S.; Schuell, T.; Wagner, U. CA125 (MUC16) gene silencing suppresses growth properties of ovarian and breast cancer cells. Eur. J. Cancer. 2012, 48, 1558–1569. [Google Scholar] [CrossRef] [PubMed]
- Muniyan, S.; Haridas, D.; Chugh, S.; Rachagani, S.; Lakshmanan, I.; Gupta, S.; Seshacharyulu, P.; Smith, L.M.; Ponnusamy, M.P.; Batra, S.K. MUC16 contributes to the metastasis of pancreatic ductal adenocarcinoma through focal adhesion mediated signaling mechanism. Genes Cancer. 2016, 7, 110–124. [Google Scholar] [CrossRef] [PubMed] [Green Version]
- Guo, J.; Jia, J.; Jia, R. PTBP1 and PTBP2 impaired autoregulation of SRSF3 in cancer cells. Sci. Rep. 2015, 5, 1–11. [Google Scholar] [CrossRef] [Green Version]
- Obata, K.; Shimo, T.; Okui, T.; Matsumoto, K.; Takada, H.; Takabatake, K.; Kunisada, Y.; Ibaragi, S.; Nagatsuka, H.; Sasaki, A. Tachykinin receptor 3 distribution in human oral squamous cell carcinoma. Anticancer Res. 2016, 36, 6335–6341. [Google Scholar] [CrossRef] [Green Version]
- Ishikawa, S.; Kobayashi, I.; Hamada, J.; Tada, M.; Hirai, A.; Furuuchi, K.; Takahashi, Y.; Ba, Y.; Moriuchi, T. Interaction of MCC2, a novel homologue of MCC tumor suppressor, with PDZ-domain Protein AIE-75. Gene 2001, 267, 101–110. [Google Scholar] [CrossRef]
- Mycielska, M.E.; Mohr, M.T.J.; Schmidt, K.; Drexler, K.; Rümmele, P.; Haferkamp, S.; Schlitt, H.J.; Gaumann, A.; Adamski, J.; Geissler, E.K. Potential use of gluconate in cancer therapy. Front. Oncol. 2019, 9, 1–7. [Google Scholar] [CrossRef] [PubMed]
- Agarwal, R.; Mumtaz, H.; Ali, N. Role of inositol polyphosphates in programmed cell death. Mol. Cell. Biochem. 2009, 328, 155–165. [Google Scholar] [CrossRef] [PubMed]
- Kassie, F.; Kalscheuer, S.; Matise, I.; Ma, K.; Melkamu, T.; Upadhyaya, P.; Hechct, S.S. Inhibition of vinyl carbamate-induced pulmonary adenocarcinoma by indole-3-carbinol and myo-inositol in A/J mice. Carcinogenesis 2010, 31, 239–245. [Google Scholar] [CrossRef] [PubMed] [Green Version]
- Lam, S.; McWilliams, A.; LeRiche, J.; MacAulay, C.; Wattenberg, L.; Szabo, E. A phase I study of myo-inositol for lung cancer chemoprevention. Cancer Epidemiol. Biomark. Prev. 2006, 15, 1526–1531. [Google Scholar] [CrossRef] [Green Version]
- Mar, M.; Montero, S.; Sevilla, E.; Escrich, E.; Mene, J.A. Effects of gamma-linolenic acid and oleic acid on paclitaxel cytotoxicity in human breast cancer cells. Eur. J. Cancer. 2001, 37, 402–413. [Google Scholar]
- Labuschagne, C.F.; van den Broek, N.J.F.; Mackay, G.M.; Vousden, K.H.; Maddocks, O.D.K. Serine, but not glycine, supports one-carbon metabolism and proliferation of cancer cells. Cell Rep. 2014, 7, 1248–1258. [Google Scholar] [CrossRef] [PubMed] [Green Version]
- Maddocks, O.D.K.; Berkers, C.R.; Mason, S.M.; Zheng, L.; Blyth, K.; Gottlieb, E.; Vousden, K.H. Serine starvation induces stress and p53-dependent metabolic remodelling in cancer cells. Nature 2013, 493, 542–546. [Google Scholar] [CrossRef]
- Mattaini, K.R.; Sullivan, M.R.; Vander Heiden, M.G. The importance of serine metabolism in cancer. J. Cell Biol. 2016, 214, 249–257. [Google Scholar] [CrossRef] [Green Version]
- Kim, S.Y. Cancer energy metabolism: Shutting power off cancer factory. Biomol. Ther. 2018, 26, 39–44. [Google Scholar] [CrossRef] [Green Version]
- Weinberg, S.E.; Chandel, N.S. Targeting mitochondria metabolism for cancer therapy. Nat. Chem. Biol. 2015, 11, 9–15. [Google Scholar] [CrossRef] [PubMed] [Green Version]
- Xu, J.Z.; Zhang, J.L.; Zhang, W.L. Antisense RNA: The new favorite in genetic research. J. Zhejiang Univ. Sci. B. 2018, 19, 739–749. [Google Scholar] [CrossRef]
- Koundouros, N.; Poulogiannis, G. Reprogramming of fatty acid metabolism in cancer. Br. J. Cancer. 2020, 122, 4–22. [Google Scholar] [CrossRef] [PubMed] [Green Version]
- Gumucio, J.P.; Qasawa, A.H.; Ferrera, P.J.; Malik, A.N.; Funai, K.; McDonagh, B.; Mendias, C.L. Reduced mitochondrial lipid oxidation leads to fat accumulation in myosteatosis. FASEB J. 2019, 33, 7863–7881. [Google Scholar] [CrossRef]
- Wang, C.; Liu, F.; Yuan, Y.; Wu, J.; Wang, H.; Zhang, L.; Hu, P.; Li, Z.; Li, Q.; Ye, J. Metformin suppresses lipid accumulation in skeletal muscle by promoting fatty acid oxidation. Clin. Lab. 2014, 60, 887–896. [Google Scholar] [CrossRef]
- Ying, W. NAD+/NADH and NADP+/NADPH in cellular functions and cell death: Regulation and biological consequences. Antioxid. Redox Signal. 2008, 10, 179–206. [Google Scholar] [CrossRef] [Green Version]
- Al-Lahham, S.H.; Peppelenbosch, M.P.; Roelofsen, H.; Vonk, R.J.; Venema, K. Biological effects of propionic acid in humans; metabolism, potential applications and underlying mechanisms. Biochim. Biophys. Acta 2010, 1801, 1175–1183. [Google Scholar] [CrossRef] [PubMed]
- Koren, D.; Palladino, A. Chapter 3: Hypoglycemia. In Genetic Diagnosis of Endocrine Disorders, 2nd ed.; Weiss, R.E., Refetoff, S., Eds.; Academic Press: Cambridge, MA, USA, 2016; pp. 31–75. [Google Scholar]
- Williams, C.A. Galactose. In Encyclopedia of Food Sciences and Nutrition, 2nd ed.; Caballero, B., Finglas, P., Toldra, F., Eds.; Academic Press: Cambridge, MA, USA, 2003; pp. 2843–2846. [Google Scholar]
- Vats, D.; Packman, S. Galactosemia. In Encyclopedia of Neurolical Sciences, 2nd ed.; Daroff, R., Aminoff, M., Eds.; Academic Press: Cambridge, MA, USA, 2014; pp. 389–391. [Google Scholar]
- Lai, K.; Elsas, L.J.; Wierenga, K.J. Galactose toxicity in animals. IUBMB Life 2009, 61, 1063–1074. [Google Scholar] [CrossRef] [Green Version]
- Rohatgi, N.; Gudmundsson, S.; Rolfsson, O. Kinetic analysis of gluconate phosphorylation by human gluconokinase using isothermal titration calorimetry. FEBS Lett. 2015, 589, 3548–3555. [Google Scholar] [CrossRef]
- Anding, A.L.; Wang, C.; Chang, T.K.; Sliter, D.A.; Powers, C.M.; Hofmann, K.; Youle, R.J.; Baehrecke, E.H. Vps13D encodes a ubiquitin-binding protein that is required for the regulation of mitochondrial size and clearance. Curr. Biol. 2018, 28, 287–295. [Google Scholar] [CrossRef] [Green Version]
- Seong, E.; Insolera, R.; Dulovic, M.; Kamsteeg, E.J.; Trinh, J.; Brüggermann, N.; Sandford, E.; Li, S.; Ozel, A.B.; Li, J.Z.; et al. Mutations in VPS13D lead to a new recessive ataxia with spasticity and mitochondrial defects. Ann. Neurol. 2018, 83, 1075–1088. [Google Scholar] [CrossRef] [PubMed]
- Huang, Y.; Zhu, M.; Li, Z.; Sa, R.; Chu, Q.; Zhang, Q.; Zhang, H.; Tang, W.; Zhang, M.; Yin, H. Mass spectrometry-based metabolomic profiling identifies alterations in salivary redox status and fatty acid metabolism in response to inflammation and oxidative stress in periodontal disease. Free Radic. Biol. Med. 2014, 70, 223–232. [Google Scholar] [CrossRef] [PubMed]
- Chi, L.; Tu, P.; Liu, C.W.; Lai, Y.; Xue, J.; Ru, H.; Lu, K. Chronic arsenic exposure induces oxidative stress and perturbs serum lysolipids and fecal unsaturated fatty acid metabolism. Chem. Res. Toxicol. 2019, 32, 1204–1211. [Google Scholar] [CrossRef]
- Chen, P.; Chen, F.; Zhou, B. Antioxidative, anti-inflammatory and anti-apoptotic effects of ellagic acid in liver and brain of rats treated by D-galactose. Sci. Rep. 2018, 8, 1465. [Google Scholar] [CrossRef] [PubMed] [Green Version]
- Lawler, J.M.; Barnes, W.S.; Wu, G.; Song, W.; Demaree, S. Direct antioxidant properties of creatine. Biochem. Biophys. Res. Commun. 2002, 290, 47–52. [Google Scholar] [CrossRef]


| Gene Symbol | Description | Fold Change |
|---|---|---|
| BRD9 | Bromodomain containing 9 | 1.61 |
| AP3B1 | Adaptor related protein complex 3 subunit beta 1 | 1.58 |
| NLRP11 | NOD-like receptor family, pyrin domain containing 11 | 1.56 |
| IL7R | Interleukin 7 receptor | 1.56 |
| CCDC190 | Coiled-coil domain containing 190 | 1.56 |
| KIDINS220 | Kinase D interacting substrate 220 | 1.52 |
| TMLHE-AS1 | Homo sapiens TMLHE antisense RNA 1 | 1.52 |
| DOCK2 | Dedicator of cytokinesis 2 | 1.51 |
| SRF | Serum response factor | 1.51 |
| USHBP1 | Usher syndrome 1C binding protein 1 | 1.50 |
| MARCH9 | Membrane-associated ring finger 9 | 0.66 |
| PDE5A | Phosphodiesterase 5A | 0.65 |
| DUSP16 | Dual specificity phosphatase 16 | 0.65 |
| PTBP2 | Polypyrimidine tract binding protein 2 | 0.65 |
| MUC16 | Mucin 16, cell surface associated | 0.65 |
| VPS13D | Vacuolar protein sorting 13 homolog D | 0.65 |
| LRRC58 | Leucine rich repeat containing 58 | 0.64 |
| FITM1 | Fat storage-inducing transmembrane protein 1 | 0.64 |
| TAC3 | Tachykinin 3 | 0.62 |
| BGN | Biglycan | 0.61 |
| ZNF658B | Zinc finger protein 658B | 0.61 |
| BUD31 | BUD31 | 0.60 |
| PPP1R3B | Protein phosphatase 1, regulatory subunit 3B | 0.59 |
| GPR141 | G-protein-coupled receptor 141 | 0.57 |
| Compound | Retention Time (min) | NIST Rmatch | RM a |
|---|---|---|---|
| Galactose | 25.430 | 857 | 14.13 |
| Hexadecanoate | 27.885 | 826 | 3.86 |
| Decanedionate | 38.081 | 844 | 3.66 |
| Pyrimidine | 21.766 | 733 | 3.57 |
| Propionate | 14.872 | 835 | 3.26 |
| Myo-inositol | 28.438 | 814 | 2.93 |
| Gluconate | 26.562 | 778 | 2.66 |
| Oleate | 30.671 | 791 | 2.65 |
| N-Pentadecanoate | 26.324 | 823 | 1.92 |
| Creatinine | 19.198 | 735 | 1.58 |
| Malate | 18.056 | 865 | 1.54 |
| 11-trans octadecenoate | 30.546 | 864 | 0.69 |
| Tetradecanoate | 24.696 | 865 | 0.58 |
| Fructose | 25.022 | 837 | 0.40 |
| Serine | 13.446 | 769 | 0.14 |
| Nonanoate | 15.425 | 778 | 0.04 |
Publisher’s Note: MDPI stays neutral with regard to jurisdictional claims in published maps and institutional affiliations. |
© 2021 by the authors. Licensee MDPI, Basel, Switzerland. This article is an open access article distributed under the terms and conditions of the Creative Commons Attribution (CC BY) license (https://creativecommons.org/licenses/by/4.0/).
Share and Cite
Machuca, A.; Garcia-Calvo, E.; Anunciação, D.S.; Luque-Garcia, J.L. Integration of Transcriptomics and Metabolomics to Reveal the Molecular Mechanisms Underlying Rhodium Nanoparticles-Based Photodynamic Cancer Therapy. Pharmaceutics 2021, 13, 1629. https://doi.org/10.3390/pharmaceutics13101629
Machuca A, Garcia-Calvo E, Anunciação DS, Luque-Garcia JL. Integration of Transcriptomics and Metabolomics to Reveal the Molecular Mechanisms Underlying Rhodium Nanoparticles-Based Photodynamic Cancer Therapy. Pharmaceutics. 2021; 13(10):1629. https://doi.org/10.3390/pharmaceutics13101629
Chicago/Turabian StyleMachuca, Andres, Estefania Garcia-Calvo, Daniela S. Anunciação, and Jose L. Luque-Garcia. 2021. "Integration of Transcriptomics and Metabolomics to Reveal the Molecular Mechanisms Underlying Rhodium Nanoparticles-Based Photodynamic Cancer Therapy" Pharmaceutics 13, no. 10: 1629. https://doi.org/10.3390/pharmaceutics13101629