
Proving Nanoscale Chiral Interactions of Cyclodextrins and Propranolol Enantiomers by Means of SERS Measurements Performed on a Solid Plasmonic Substrate


 , and
, and 
Abstract
:1. Introduction
2. Materials and Methods
2.1. Materials
2.2. Synthetic Procedures
2.2.1. Hydroxylamine-Reduced Silver Colloid Synthesis
2.2.2. Synthesis of the Plasmonic Solid Substrates
2.3. Methods
3. Results and Discussion
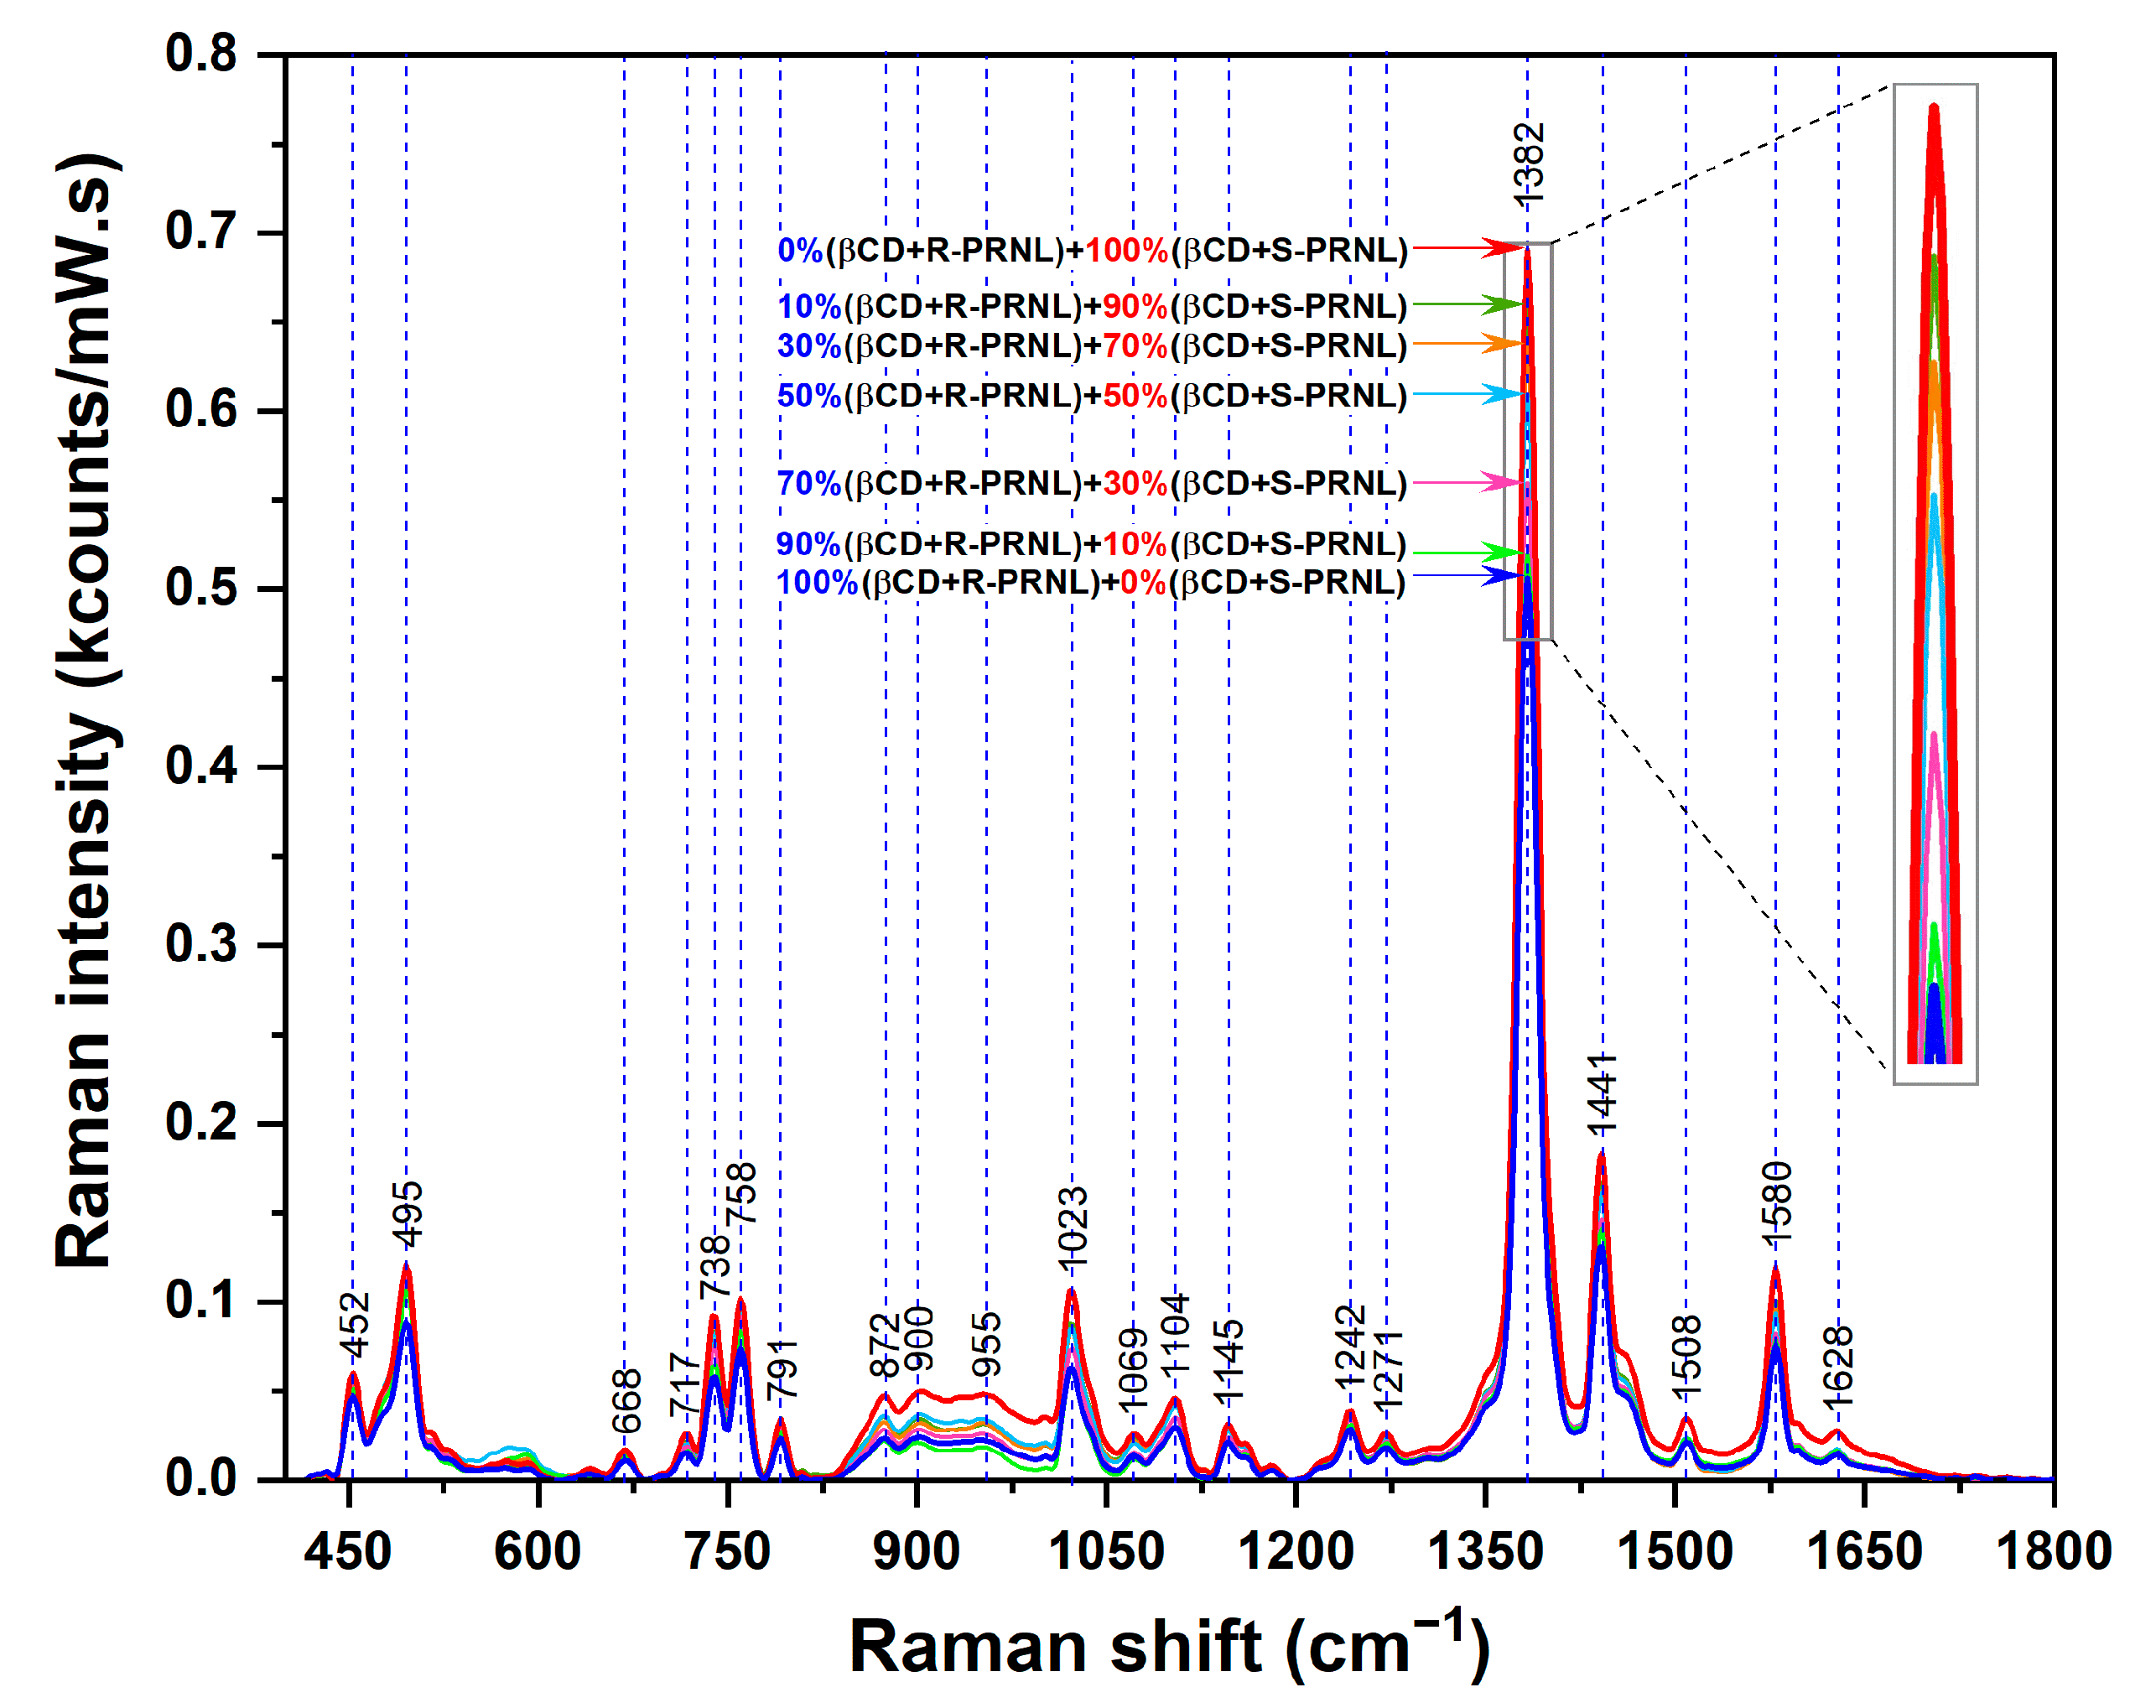
3.1. Raman Analysis
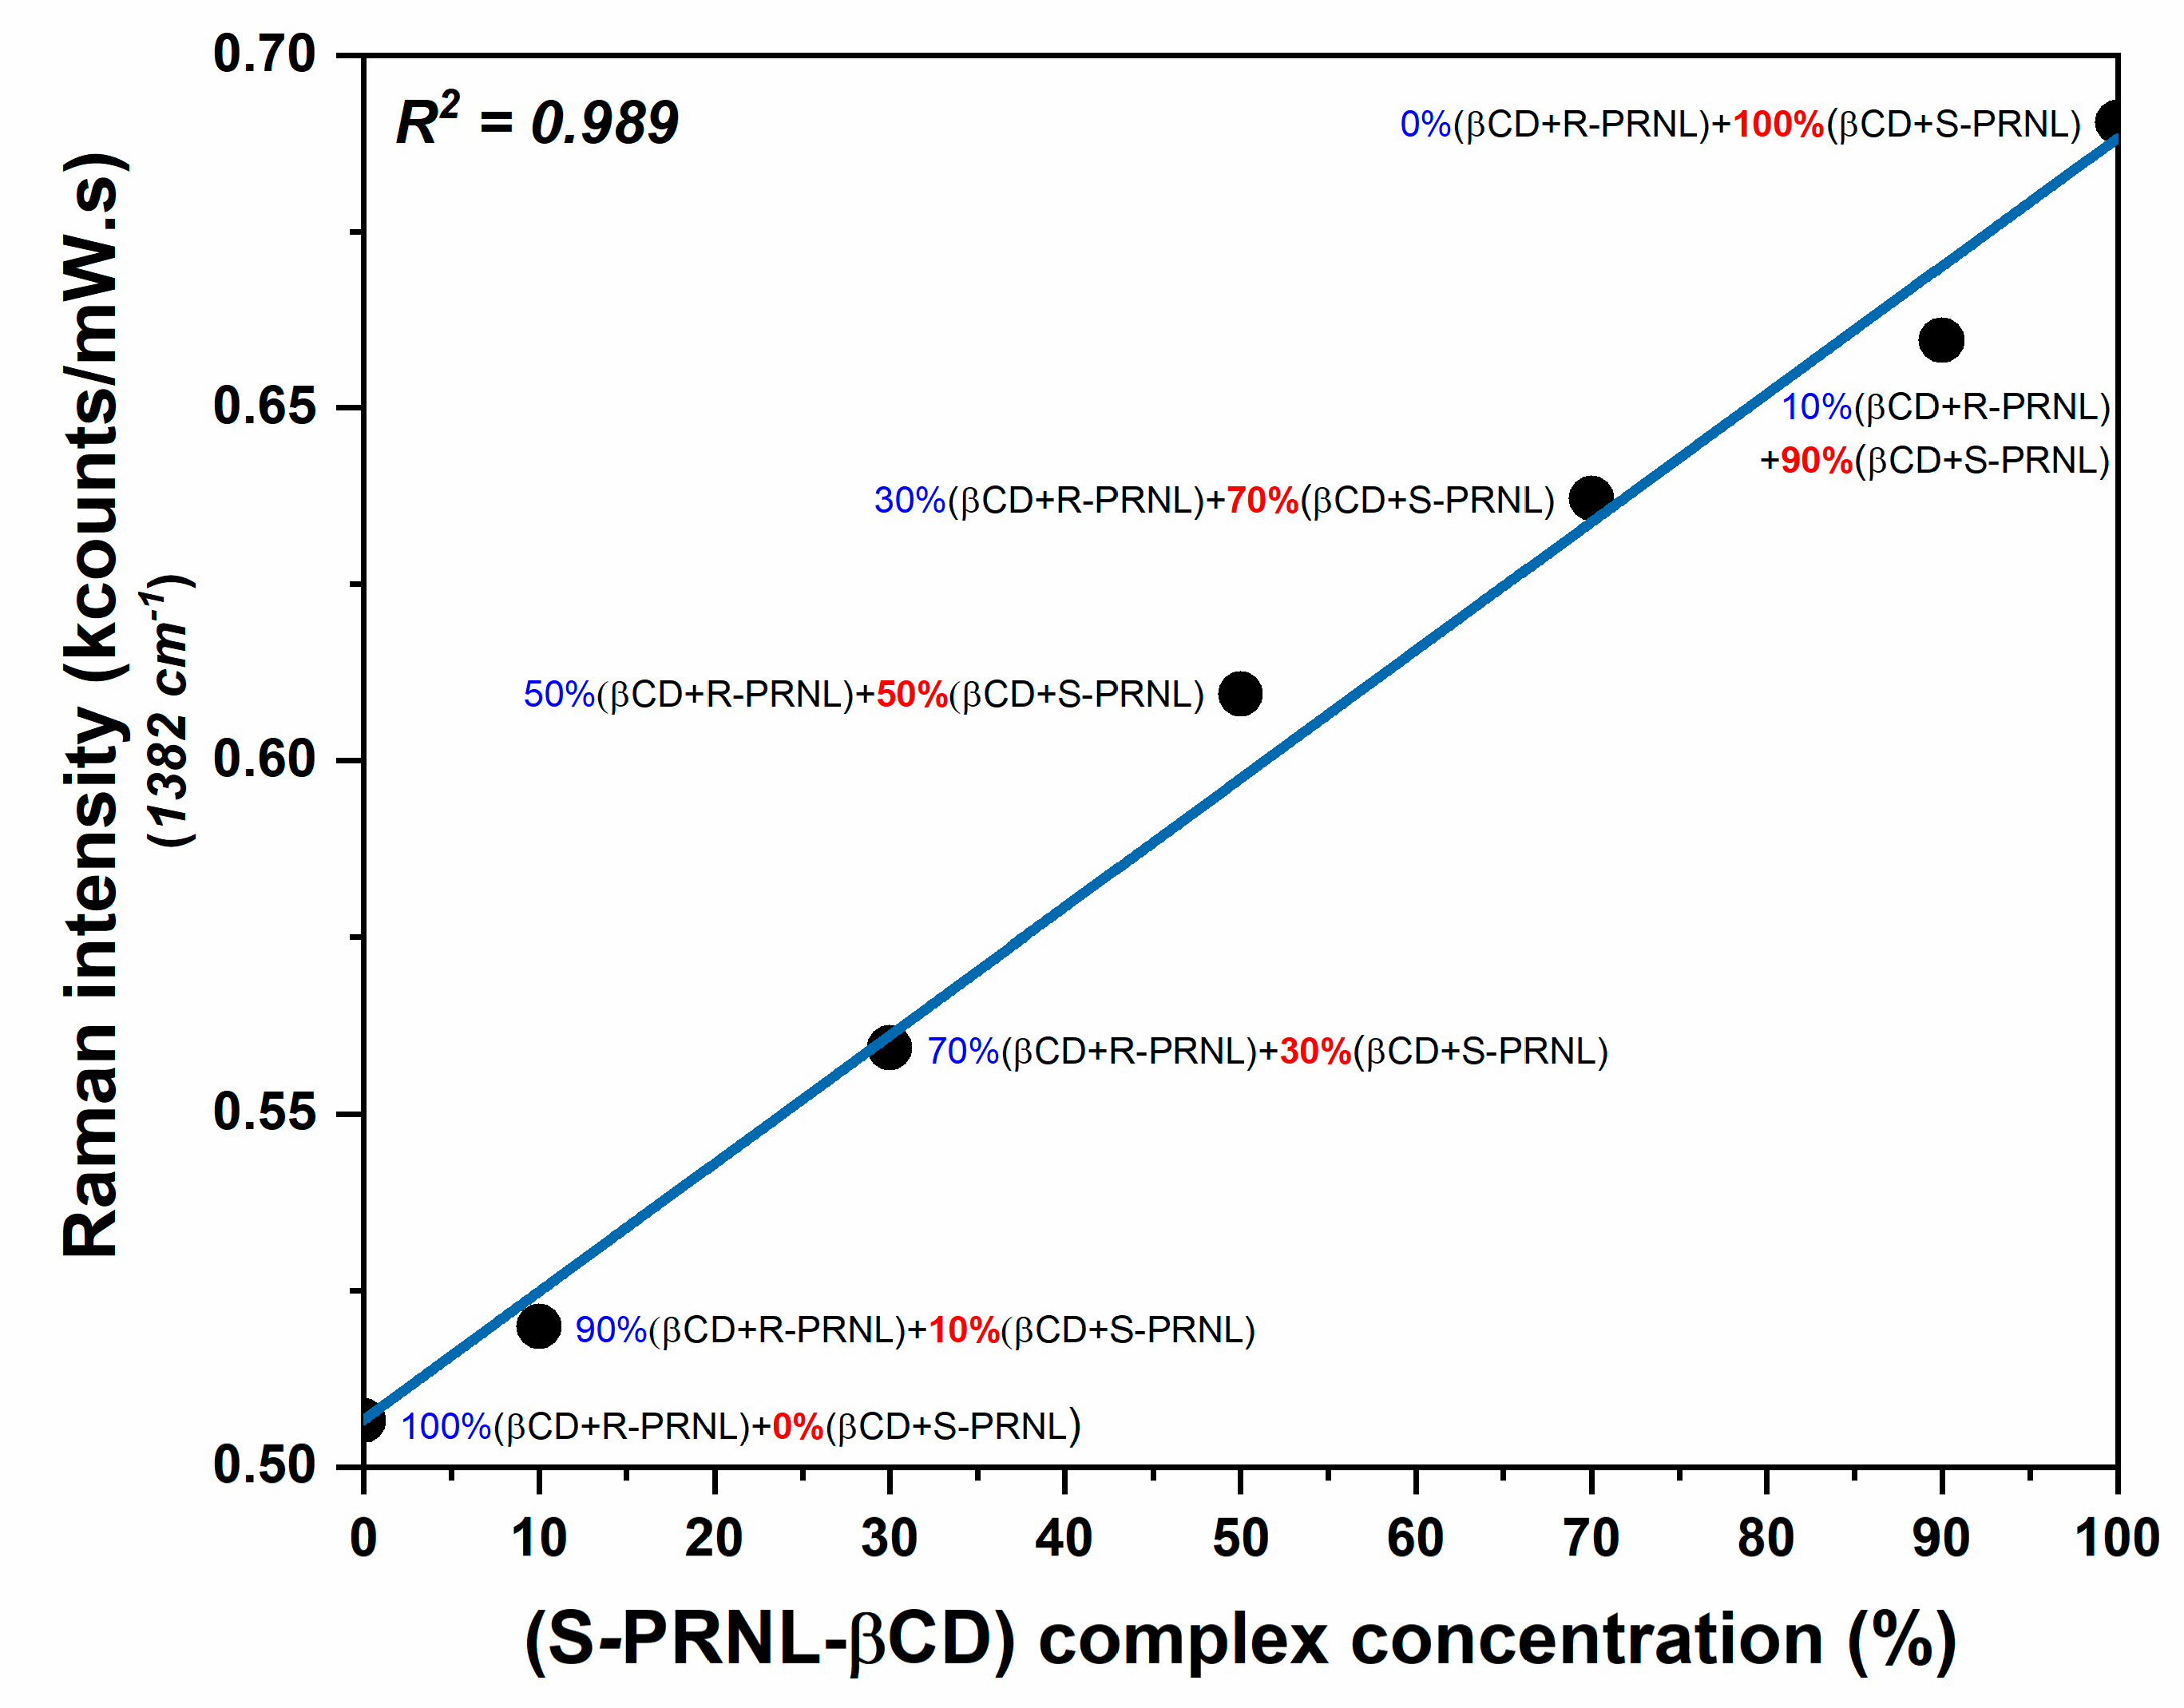
3.2. SERS Analysis
4. Conclusions
Supplementary Materials
Author Contributions
Funding
Institutional Review Board Statement
Informed Consent Statement
Data Availability Statement
Conflicts of Interest
References
- Scriba, G.K.E. Chiral recognition in separation science—An update. J. Chromatogr. A 2016, 1467, 56–78. [Google Scholar] [CrossRef]
- Blaschke, G.; Chankvetadze, B. Enantiomer separation of drugs by capillary electromigration techniques. J. Chromatogr. A 2000, 875, 3–25. [Google Scholar] [CrossRef]
- Scriba, G.K. Selected fundamental aspects of chiral electromigration techniques and their application to pharmaceutical and biomedical analysis. J. Pharm. Biomed. Anal. 2002, 27, 373–399. [Google Scholar] [CrossRef]
- Stiufiuc, R.; Iacovita, C.; Lucaciu, C.M.; Stiufiuc, G.; Nicoara, R.; Oltean, M.; Chis, V.; Bodoki, E. Adsorption geometry of propranolol enantiomers on silver nanoparticles. J. Mol. Struct. 2013, 1031, 201–206. [Google Scholar] [CrossRef]
- Casian, T.; Borbás, E.; Ilyés, K.; Démuth, B.; Farkas, A.; Rapi, Z.; Bogdan, C.; Iurian, S.; Toma, V.; Știufiuc, R.; et al. Electrospun amorphous solid dispersions of meloxicam: Influence of polymer type and downstream processing to orodispersible dosage forms. Int. J. Pharm. 2019, 569, 118593. [Google Scholar] [CrossRef] [PubMed]
- Le Ru, E.C.; Meyer, M.; Etchegoin, P.G. Proof of single-molecule sensitivity in Surface Enhanced Raman Scattering (SERS) by means of a two-analyte technique. J. Phys. Chem. B 2006, 110, 1944–1948. [Google Scholar] [CrossRef] [PubMed]
- Tian, Z.Q.; Ren, B.; Wu, D.Y. Surface-enhanced Raman scattering: From noble to transition metals and from rough surfaces to ordered nanostructures. J. Phys. Chem. B 2002, 106, 9463–9483. [Google Scholar] [CrossRef]
- Camden, J.P.; Dieringer, J.A.; Zhao, J.; Van Duyne, R.P. Controlled plasmonic nanostructures for surface-enhanced spectroscopy and sensing. Acc. Chem. Res. 2008, 41, 1653–1661. [Google Scholar] [CrossRef] [PubMed] [Green Version]
- Stiufiuc, R.; Iacovita, C.; Nicoara, R.; Stiufiuc, G.; Florea, A.; Achim, M.; Lucaciu, C.M. One-Step Synthesis of PEGylated Gold Nanoparticles with Tunable Surface Charge. J. Nanomater. 2013, 2013, 88. [Google Scholar] [CrossRef]
- Abalde-Cela, S.; Hermida-Ramón, J.M.; Contreras-Carballada, P.; De Cola, L.; Guerrero-Martínez, A.; Alvarez-Puebla, R.A.; Liz-Marzán, L.M. SERS Chiral Recognition and Quantification of Enantiomers through Cyclodextrin Supramolecular Complexation. ChemPhysChem 2011, 12, 1529–1535. [Google Scholar] [CrossRef] [PubMed]
- Bodoki, E.; Oltean, M.; Bodoki, A.; Ştiufiuc, R. Chiral recognition and quantification of propranolol enantiomers by surface enhanced Raman scattering through supramolecular interaction with β-cyclodextrin. Talanta 2012, 101, 53–58. [Google Scholar] [CrossRef]
- Stiufiuc, R.; Iacovita, C.; Stiufiuc, G.; Bodoki, E.; Chis, V.; Lucaciu, C.M. Surface mediated chiral interactions between cyclodextrins and propranolol enantiomers: A SERS and DFT study. Phys. Chem. Chem. Phys. 2015, 17, 1281–1289. [Google Scholar] [CrossRef]
- Știufiuc, G.F.; Toma, V.; Buse, M.; Mărginean, R.; Morar-Bolba, G.; Culic, B.; Tetean, R.; Leopold, N.; Pavel, I.; Lucaciu, C.M.; et al. Solid Plasmonic Substrates for Breast Cancer Detection by Means of SERS Analysis of Blood Plasma. Nanomaterials 2020, 10, 1212. [Google Scholar] [CrossRef] [PubMed]
- Leopold, N.; Lendl, B. A new method for fast preparation of highly surface-enhanced raman scattering (SERS) active silver colloids at room temperature by reduction of silver nitrate with hydroxylamine hydrochloride. J. Phys. Chem. B 2003, 107, 5723–5727. [Google Scholar] [CrossRef]
- Trefry, J.C.; Monahan, J.L.; Weaver, K.M.; Meyerhoefer, A.J.; Markopolous, M.M.; Arnold, Z.S.; Wooley, D.P.; Pavel, I.E. Size Selection and Concentration of Silver Nanoparticles by Tangential Flow Ultrafiltration for SERS-Based Biosensors. J. Am. Chem. Soc. 2010, 132, 10970–10972. [Google Scholar] [CrossRef] [PubMed]
- Dorney, K.M.; Baker, J.D.; Edwards, M.L.; Kanel, S.R.; O’Malley, M.; Pavel Sizemore, I.E. Tangential Flow Filtration of Colloidal Silver Nanoparticles: A “Green” Laboratory Experiment for Chemistry and Engineering Students. J. Chem. Educ. 2014, 91, 1044–1049. [Google Scholar] [CrossRef]
- Schindelin, J.; Arganda-Carreras, I.; Frise, E.; Kaynig, V.; Longair, M.; Pietzsch, T.; Preibisch, S.; Rueden, C.; Saalfeld, S.; Schmid, B.; et al. Fiji: An open-source platform for biological-image analysis. Nat. Methods 2012, 9, 676–682. [Google Scholar] [CrossRef] [PubMed] [Green Version]
- Frisch, M.J.; Trucks, G.W.; Schlegel, H.B.; Scuseria, G.E.; Robb, M.A.; Cheeseman, J.R.; Scalmani, G.; Barone, V.; Petersson, G.A.; Nakatsuji, H.; et al. Gaussian 09, Revision A.02; Gaussian Inc.: Wallingford, CT, USA, 2009. [Google Scholar]
- Becke, A.D. Density-functional thermochemistry. III. The role of exact exchange. J. Chem. Phys. 1993, 98, 5648–5652. [Google Scholar] [CrossRef] [Green Version]
- Lee, C.; Yang, W.; Parr, R.G. Development of the Colle-Salvetti correlation-energy formula into a functional of the electron density. Phys. Rev. B 1988, 37, 785–789. [Google Scholar] [CrossRef] [Green Version]
- Polavarapu, P.L. Ab initio vibrational Raman and Raman optical activity spectra. J. Phys. Chem. 1990, 94, 8106–8112. [Google Scholar] [CrossRef]
- Guirgis, G.A.; Nashed, Y.E.; Durig, J.R. Raman and infrared spectra, conformational stability, ab initio calculations and vibrational assignments for 2-chloroethyl silane. J. Mol. Struct. 1999, 510, 13–34. [Google Scholar] [CrossRef]
- Scott, A.P.; Radom, L. Harmonic Vibrational Frequencies: An Evaluation of Hartree−Fock, Møller−Plesset, Quadratic Configuration Interaction, Density Functional Theory, and Semiempirical Scale Factors. J. Phys. Chem. 1996, 100, 16502–16513. [Google Scholar] [CrossRef]
- Servais, A.-C.; Rousseau, A.; Fillet, M.; Lomsadze, K.; Salgado, A.; Crommen, J.; Chankvetadze, B. Capillary electrophoretic and nuclear magnetic resonance studies on the opposite affinity pattern of propranolol enantiomers towards various cyclodextrins. J. Sep. Sci. 2010, 33, 1617–1624. [Google Scholar] [CrossRef] [PubMed]
- Banerjee-Ghosh, K.; Dor, O.B.; Tassinari, F.; Capua, E.; Yochelis, S.; Capua, A.; Yang, S.H.; Parkin, S.S.P.; Sarkar, S.; Kronik, L.; et al. Separation of enantiomers by their enantiospecific interaction with achiral magnetic substrates. Science 2018, 360, 1331–1334. [Google Scholar] [CrossRef] [PubMed] [Green Version]
- Farcas, A.; Iacovita, C.; Vinteler, E.; Chis, V.; Stiufiuc, R.; Lucaciu, M. The Influence of Molecular Structure Modifications on Vibrational Properties of Some Beta Blockers: A Combined Raman and DFT Study. J. Spectrosc. 2016, 2016, 3137140. [Google Scholar] [CrossRef]
- de Oliveira, V.E.; Almeida, E.W.C.; Castro, H.V.; Edwards, H.G.M.; Dos Santos, H.F.; de Oliveira, L.F.C. Carotenoids and β-Cyclodextrin Inclusion Complexes: Raman Spectroscopy and Theoretical Investigation. J. Phys. Chem. A 2011, 115, 8511–8519. [Google Scholar] [CrossRef] [PubMed]
- Barrow, S.J.; Kasera, S.; Rowland, M.J.; Del Barrio, J.; Scherman, O.A. Cucurbituril-Based Molecular Recognition. Chem. Rev. 2015, 115, 12320–12406. [Google Scholar] [CrossRef] [PubMed] [Green Version]
- Moskovits, M. Surface selection rules. J. Chem. Phys. 1982, 77, 4408–4416. [Google Scholar] [CrossRef]
- Fanali, S. Use of cyclodextrins in capillary zone electrophoresis. J. Chromatogr. A 1991, 545, 437–444. [Google Scholar] [CrossRef]


Publisher’s Note: MDPI stays neutral with regard to jurisdictional claims in published maps and institutional affiliations. |
© 2021 by the authors. Licensee MDPI, Basel, Switzerland. This article is an open access article distributed under the terms and conditions of the Creative Commons Attribution (CC BY) license (https://creativecommons.org/licenses/by/4.0/).
Share and Cite
Știufiuc, G.F.; Toma, V.; Onaciu, A.; Chiș, V.; Lucaciu, C.M.; Știufiuc, R.I. Proving Nanoscale Chiral Interactions of Cyclodextrins and Propranolol Enantiomers by Means of SERS Measurements Performed on a Solid Plasmonic Substrate. Pharmaceutics 2021, 13, 1594. https://doi.org/10.3390/pharmaceutics13101594
Știufiuc GF, Toma V, Onaciu A, Chiș V, Lucaciu CM, Știufiuc RI. Proving Nanoscale Chiral Interactions of Cyclodextrins and Propranolol Enantiomers by Means of SERS Measurements Performed on a Solid Plasmonic Substrate. Pharmaceutics. 2021; 13(10):1594. https://doi.org/10.3390/pharmaceutics13101594
Chicago/Turabian StyleȘtiufiuc, Gabriela Fabiola, Valentin Toma, Anca Onaciu, Vasile Chiș, Constantin Mihai Lucaciu, and Rareș Ionuț Știufiuc. 2021. "Proving Nanoscale Chiral Interactions of Cyclodextrins and Propranolol Enantiomers by Means of SERS Measurements Performed on a Solid Plasmonic Substrate" Pharmaceutics 13, no. 10: 1594. https://doi.org/10.3390/pharmaceutics13101594