Article

Redox-Responsive Nanocarrier for Controlled Release of Drugs in Inflammatory Skin Diseases

1
Institute of Chemistry and Biochemistry, Freie Universität Berlin, Takustr. 3, 14195 Berlin, Germany
2
Clinical Research Center for Hair and Skin Science, Department of Dermatology and Allergy, Charité-Universitaetsmedizin Berlin, Corporate Member of Freie Universität Berlin, Humboldt Universität zu Berlin, and Berlin Institute of Health, 10117 Berlin, Germany
*
Authors to whom correspondence should be addressed.
Pharmaceutics 2021, 13(1), 37; https://doi.org/10.3390/pharmaceutics13010037
Submission received: 30 October 2020 / Revised: 18 December 2020 / Accepted: 23 December 2020 / Published: 29 December 2020

Abstract

:
A synthetic route for redox-sensitive and non-sensitive core multi-shell (CMS) carriers with sizes below 20 nm and narrow molecular weight distributions was established. Cyclic voltammetric measurements were conducted characterizing the redox potentials of reduction-sensitive CMS while showcasing its reducibility through glutathione and tris(2-carboxyethyl)-phosphine as a proof of concept. Measurements of reduction-initiated release of the model dye Nile red by time-dependent fluorescence spectroscopy showed a pronounced release for the redox-sensitive CMS nanocarrier (up to 90% within 24 h) while the non-sensitive nanocarriers showed no release in PBS. Penetration experiments using ex vivo human skin showed that the redox-sensitive CMS nanocarrier could deliver higher percentages of the loaded macrocyclic dye meso-tetra (m-hydroxyphenyl) porphyrin (mTHPP) to the skin as compared to the non-sensitive CMS nanocarrier. Encapsulation experiments showed that these CMS nanocarriers can encapsulate dyes or drugs with different molecular weights and hydrophobicity. A drug content of 1 to 6 wt% was achieved for the anti-inflammatory drugs dexamethasone and rapamycin as well as fluorescent dyes such as Nile red and porphyrins. These results show that redox-initiated drug release is a promising strategy to improve the topical drug delivery of macrolide drugs.

1. Introduction

Immunosuppressive drugs are broadly used to treat immune-mediated and autoimmune diseases [1]. Such drugs are also widely used in dermatology for the systemic as well as topical treatment of inflammatory skin diseases. Among macrolide immunosuppressants, rapamycin (also known as sirolimus) is an immunosuppressor that functions through inhibiting T cell proliferation and activation and is an alternative for previously used anti-inflammatory drugs in inflamed skin [2]. However, low skin permeability and high molecular weights limit its dermal accessibility.
Various carrier systems have been developed for drug delivery in the past as they harbor various advantages: they increase the drug solubility through encapsulation, their synthesis is less costly and time consuming than improving the drugs themselves, they decrease the required drug doses, as well as side effects, and can also protect drugs from degradation [3].
Skin harbors various redox-active compounds such as thiols, disulfides, enzymes and reactive oxygen species that help maintaining a redox balance [4]. The reductive and oxidative environment of the skin varies within the different skin layers, which is also known as its redox gradient. The skin barrier, i.e., the stratum corneum (SC), is rich in thiol groups [5]. Its representative redox-active moieties are glutathione (GSH) and reactive oxygen species such as hydrogen peroxide.
Tackling the reductive environment in skin, disulfide-incorporated polymer systems have already been investigated for drug delivery systems (DDSs), resulting in mostly polymeric micelles [6,7,8,9,10,11,12]. Micellar structures are based on self-assembly and their stability is therefore limited by the critical micelle concentration (CMC). Once the concentration becomes lower than the CMC, the micelles can disintegrate and release their cargo, thus leading to unspecific drug delivery despite aiming a specific target site. This can be avoided by using core multi-shell (CMS) structures. In contrast to micelles, CMS nanocarriers are made of a dendritic core molecule, which is covalently attached to various amphiphilic linear molecules that form a double shell structure around it with chemically defined hydrophilic or hydrophobic regions. Thus, they do not rely on the weak intermolecular interactions involved in self-assembled micelles. CMS carriers have broadly modifiable structures that allow the encapsulation of a wide range of hydrophobic and hydrophilic drugs due to their amphiphilic nature [13]. The modification ranges from changes in internal cavities to size increment, leaving a lot of room for drug-specific fine-tuning and target-specific controlled drug release [14].
Targeting the redox-sensitive moieties, a redox-sensitive CMS (rsCMS) nanocarrier, capable of releasing encapsulated drugs at highly reductive sites in a triggered fashion, was designed. A disulfide unit was implemented into the hydrophobic inner shell of the nanocarrier as disulfide has been reported to be an efficient functional group for reduction-sensitive drug delivery systems [15,16,17]. This work focuses on the synthesis and characterization of the CMS carriers and their redox responsiveness. Therefore, their redox potentials were measured to compare with common reducing agents. Controlled in vitro drug release experiments were performed. Tris(2-carboxyethyl)-phosphine (TCEP) and GSH were chosen as reducing agents to probe the reductive behavior of the rsCMS nanocarrier. TCEP is a commonly used reducing agent known for its moderate reducing properties. GSH is known to cleave disulfide bonds by attaching to one cleaved thiol, forming a disulfide bond, liberating the other half of the disulfide as a thiol, thus being a slight reducing agent in comparison to TCEP. It is hypothesized that the rsCMS nanocarrier can release encapsulated drugs upon reduction in a controlled fashion at the site of inflammation. To investigate its efficacy, a comparative non-redox sensitive nanocarrier (ccCMS) omitting the disulfide moiety was synthesized.
Skin penetration experiments were conducted as a proof of concept. Finally, the drug loading capacity was also tested. The chosen hydrophobic drugs rapamycin and dexamethasone are anti-inflammatory agents. Previous studies with CMS systems show for hydrophobic drugs high drug densities in the inner shell or between the hydrophobic inner shell building blocks [3]. Locating the redox-sensitive moieties at the middle of the inner shell close to the encapsulated drug will allow a direct effect of the reductive environment on the encapsulated drugs.

2. Materials and Methods

2.1. Chemical Reagents

mPEG-OH, anhydrous CH2Cl2, docosanedioic acid 6b, KI, dexamethasone and streptomycin were purchased from Sigma-Aldrich (Merck KGaA, Darmstadt, Germany). Triethyl amine and anhydrous DMSO were purchased from Acros Organics. Mesyl chloride, I2, 11-mercaptoundecanoic acid 5a and N-hydroxysuccinimide (NHS) were purchased from Aldrich. NH3 25% solution, NaSO4, MeOH, Na2SO3 and 1-ethyl-3-(3-dimethylaminopropyl) carbodiimide (EDCI) were purchased from Carl Roth (Carl Roth GmbH + Co. KG, Karlsruhe, Germany). NaOH and HCl were bought from Fisher Scientific (Fisher Scientific GmbH, Schwerte, Germany). 2-Morpholinoethanesulfonic acid (MES), GSH, oxidized glutathione (GSSG), TCEP and fluorescein isothiocyanate (FITC) were purchased from TCI (TCI Deutschland GmbH, Eschborn, Germany). Hydroxyethyl cellulose (HEC) gel was purchased from Ashland (Düsseldorf, Germany). Diethyl ether, acetone and acetonitrile were purchased from VWR Chemicals (Avantor, Darmstadt, Germany). Meso-tetra (m-hydroxyphenyl) porphyrin (mTHPP) was purchased from Biolitec (Jena, Germany). Pheophorbide A (PhA) was purchased from Frontier scientific (Logan, UT, USA). Rapamycin was bought from LC Laboratories (Woburn, MA, USA). Aminated hyperbranched polyglycerol (hPG-NH2, 10 kDa, 70% functionalized, 20 mg/mL in MeOH) was synthesized according to Roller et al. [18].

2.2. Instrumentation and Methods

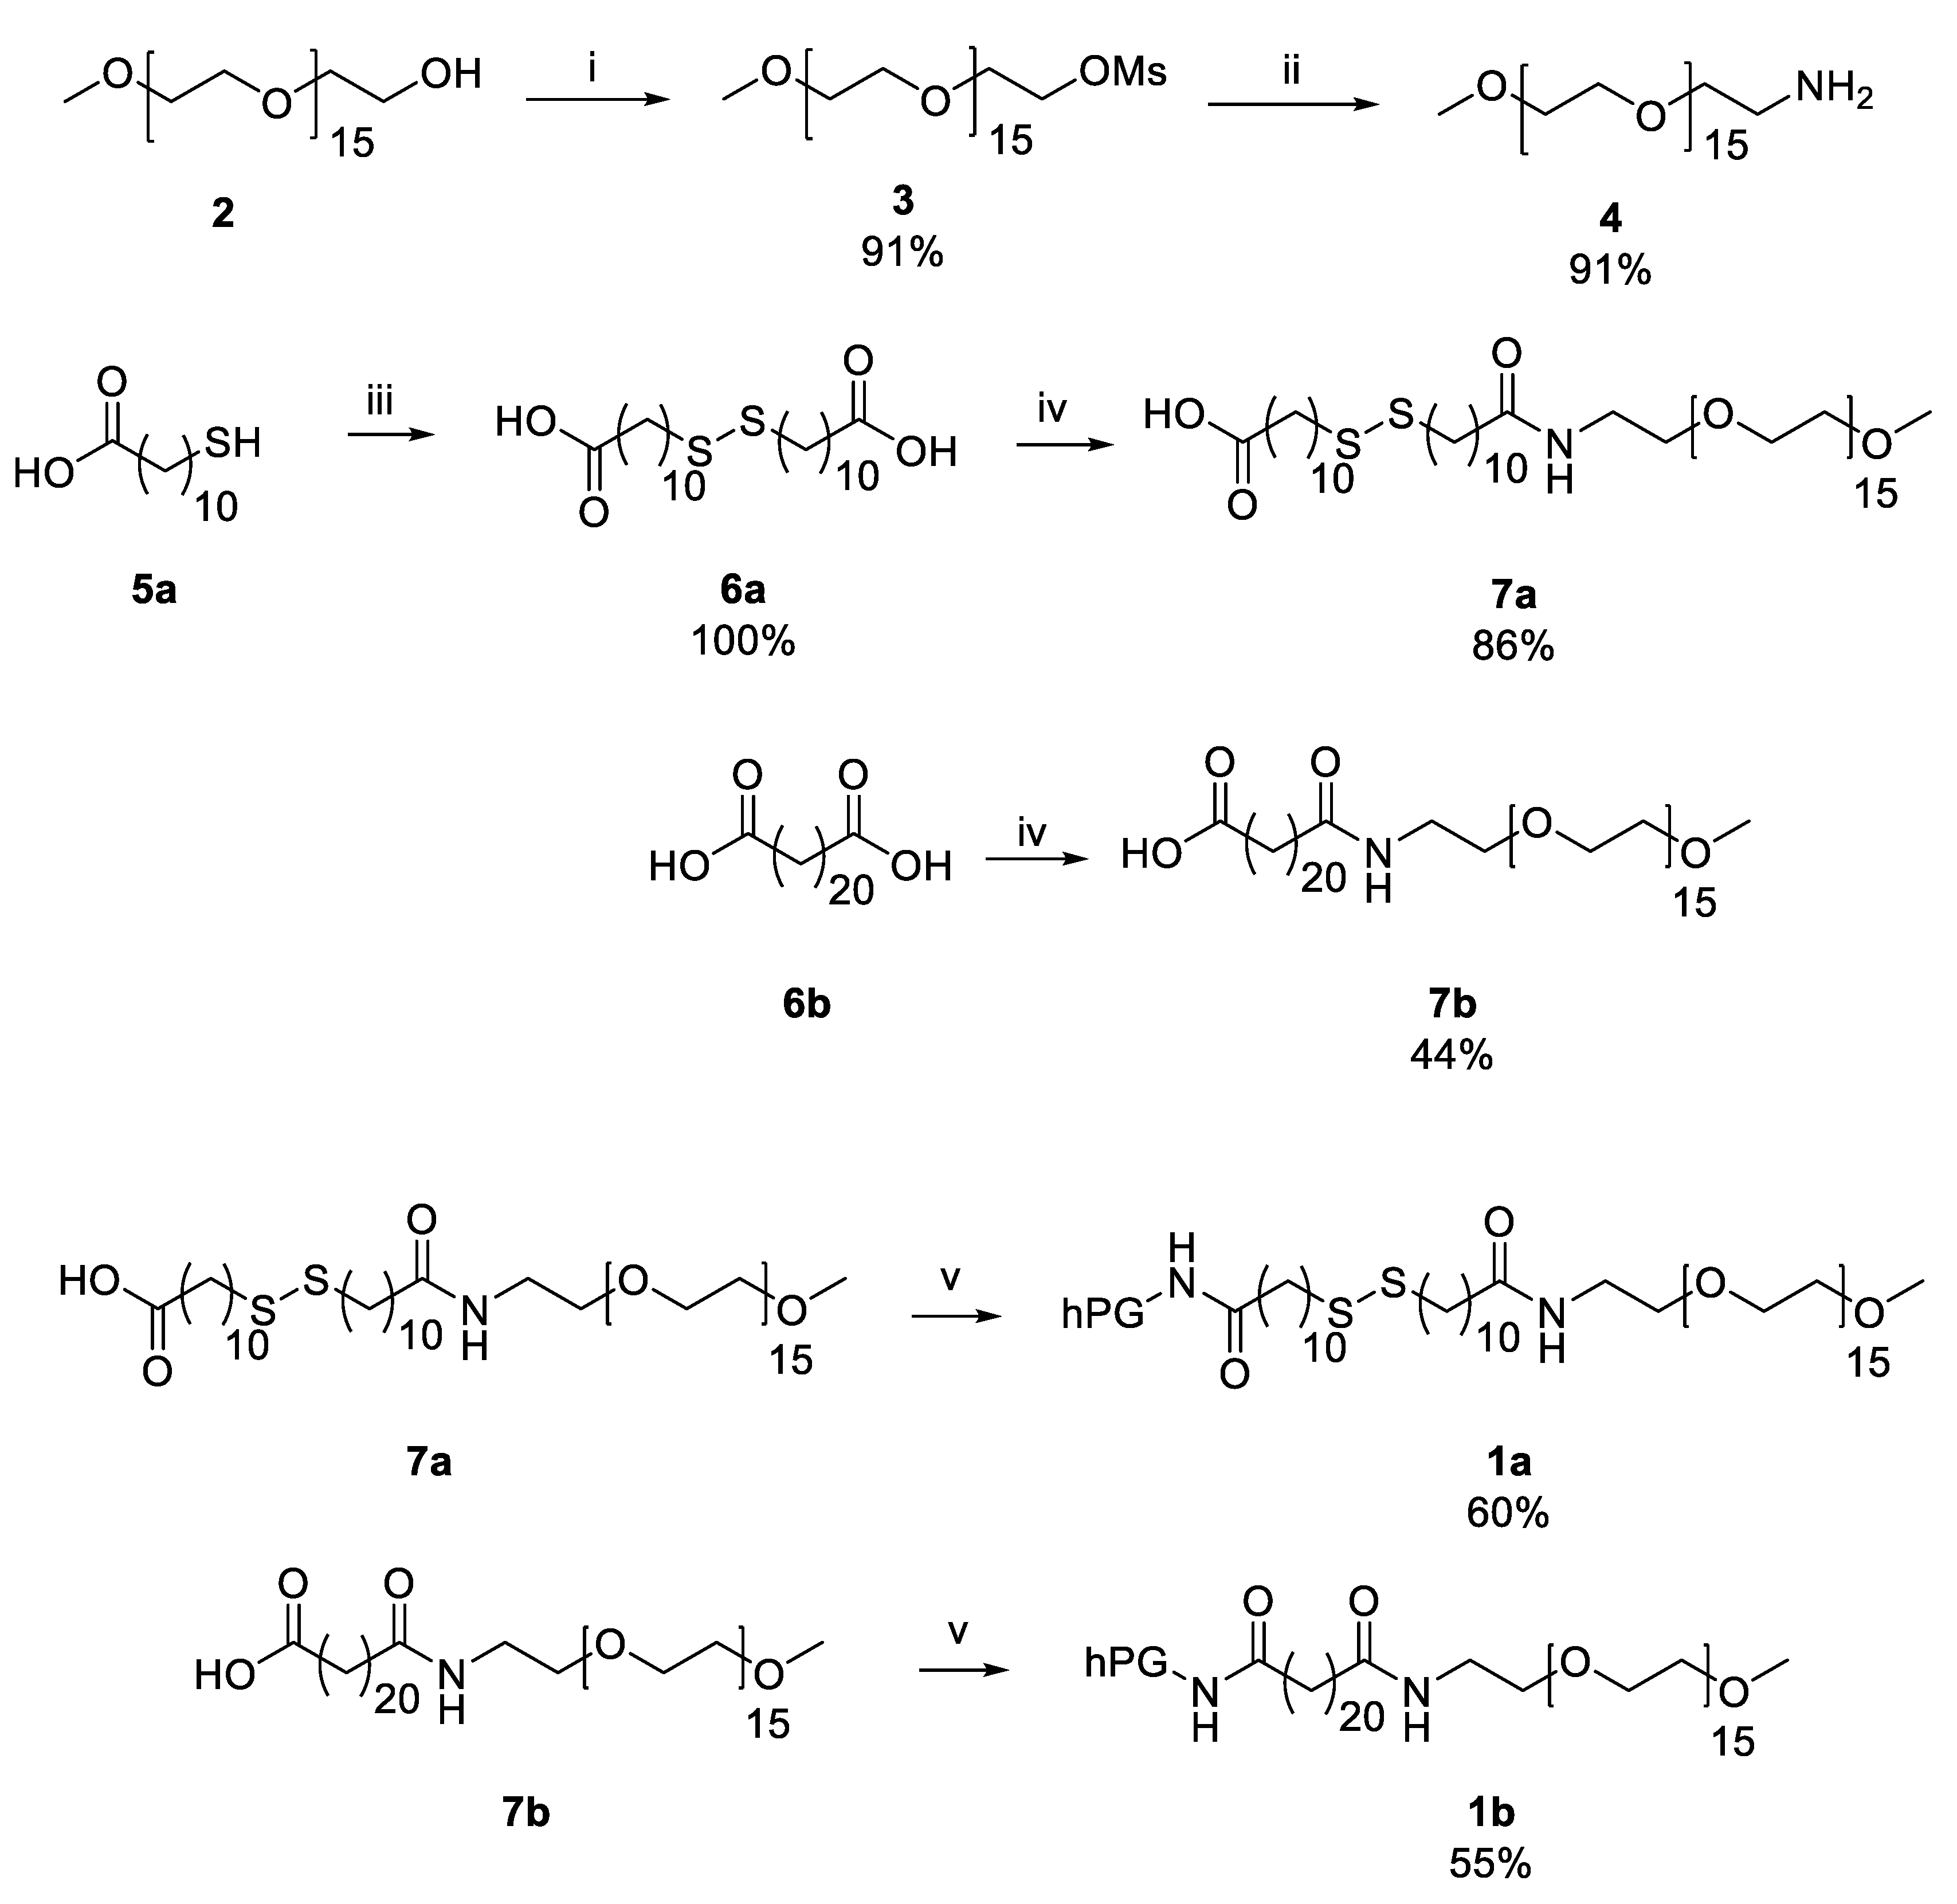
2.2.1. Synthesis of the Starting Materials

mPEG-OMs 3
Based on a procedure [19], methoxy poly (ethylene glycol) (mPEG-OH) 2 (10.04 g, 13.4 mmol, 1.0 equiv.) was dissolved in anhydrous CH2Cl2 (13.5 mL, 1 mL/mmol) and cooled with an ice bath. Triethylamine (4.5 mL, 33.1 mmol, 2.5 equiv.) was added dropwise after adding mesyl chloride (3.0 mL, 33.8 mmol, 2.9 equiv.) slowly. The reaction mixture was warmed up to room temperature and stirred for 17 h. The reaction mixture was filtered, and the solvent removed. The residue was extracted using diethyl ether to give off a white wax-like solid after removing the solvent under reduced pressure (10.13 g, 4.99 mmol, 91%).
1H NMR (500 MHz, MeOD) δ = 4.37 (m, 2H, CH2-OMs), 3.76 (m, 2H, CH2-CH2-OMs), 3.63 (m, 58H, PEG backbone), 3.54 (m, 2H, CH2-OCH3), 3.36 (s, 3H, OCH3), 3.12 (s, 3H, OSO2-CH3). 13C NMR (126 MHz, MeOD) δ = 72.99 (CH2-OCH3), 71.59 (PEG backbone), 71.38 (PEG backbone), 71.01 (CH2-CH2-OSO2-CH3), 70.14 (CH2-OSO2-CH3), 59.10 (OCH3), 37.61 (OSO2-CH3).
mPEG-NH2 4
Based on a procedure [20], mPEG-OMs 3 (4.54 g, 5.48 mmol) was dissolved in an aqueous 25% NH3 solution (40 mL) and stirred for 2 days at room temperature (r.t.) with a sealed cap. Afterwards, it was opened to air and the ammonia allowed to evaporate over the weekend. The pH of the reaction mixture was increased to 13 using 1 M NaOH and extracted with CH2Cl2 (3 × 100 mL). The combined organic phases were dried over sodium sulphate and concentrated using reduced pressure to afford a white wax-like solid (3.74 g, 8.49 mmol, 91%).
1H NMR (500 MHz, MeOD) δ = 3.64 (m, 58H, PEG backbone), 3.53 (m, 6H, PEG backbone), 3.36 (s, 3H, OCH3), 2.80 (t, J = 5.4, 2H, CH2-NH2). 13C NMR (126 MHz, MeOD) δ = 73.26 (CH2-CH2-NH2), 72.97 (CH2-OCH3), 71.56 (PEG backbone), 71.55 (PEG backbone), 71.36 (PEG backbone), 71.25 (PEG backbone), 59.10 (OCH3), 42.07 (CH2-NH2).
11,11′-disulfanediyldiundecanoic acid 6a
Disulfide 6a was synthesized following a procedure [21]. 11-mercaptoundecanoic acid 5a (7.21 g, 33.0 mmol, 1.0 equiv.) was dissolved in MeOH (165 mL, 5 mL per mmol acid). NaOH (0.66 g, 16.5 mmol, 0.5 equiv.), I2 (4.19 g, 16.5 mmol, 0.5 equiv.) and KI (0.16 g, 0.99 mmol, 0.03 equiv.) were added under stirring. The milky yellow solution was stirred for 17 h at r.t. and then decolored with saturated aq. Na2SO3 (20 mL). The solvents were removed under reduced pressure at 50 °C and the resulting aqueous slurry was dispersed in CH2Cl2 and acidified to pH 1 with 1M HCl. The aqueous phase was decanted, and the organic phase was washed with water (100 mL). The organic phase was dried over sodium sulphate and filtered. Removal of the solvent yielded a white powder (7.18 g, 100% yield).
1H NMR (500 MHz, CDCl3) δ = 2.67 (t, J = 7.3, 4H, CH2-SS-CH2), 2.29 (t, J = 7.5, 4H, CH2-COOH), 1.64 (m, 8H, S-CH2-CH2-(CH2)6-CH2-CH2-COOH), 1.28 (m, 24H, S-CH2-CH2-(CH2)6-CH2-CH2-COOH). 13C NMR (126 MHz, CDCl3) δ = 180.38 (COOH), 39.37 (CH2-SS-CH2), 34.19 (CH2-COOH), 29.51, 29.44, 29.34, 29.30, 29.13, 28.61, 24.78 (CH2CH2-COOH).

2.2.2. Synthesis of the Dishells

mPEG-NHCO-C10-SS-C10-CO2H 7a
mPEG-NH2 4 (2.25 g, 3.00 mmol, 1.0 equiv.) and disulfanediyldiundecanoic acid 6a (3.91 g, 9.00 mmol, 3.0 equiv.) were stirred in bulk at 100 °C for 3 h under high vacuum. After cooling down the reaction mixture to 60 °C, the bulk mixture was diluted using methanol (50 mL) and further cooled down using cold water. The formed, white precipitation was filtered off to give a brown wax (3.00 g, 2.57 mmol, 86%).
1H NMR (500 MHz, MeOD) δ = 3.64 (m, 58H, PEG backbone), 3.53 (m, 6H, PEG backbone), 3.36 (s, 3H, OCH3), 2.69 (t, J = 7.2, 4H, CH2-SS-CH2), 2.32 (t, J = 7.4, 2H, CH2-COOH), 2.19 (t, J = 7.5, 2H, CH2-NH2), 1.64 (m, 8H, S-CH2-CH2-(CH2)6-CH2-CH2-COOH), 1.32 (m, 24H, S-CH2-CH2-(CH2)6-CH2-CH2-COOH). 13C NMR (126 MHz, MeOD) δ = 176.36 (COOH), 175.99 (NHCOOH), 72.99, 71.61, 71.59, 71.57, 71.38, 71.29, 70.62, 59.11, 51.97, 40.37, 39.79, 37.06, 34.81, 30.58, 30.57, 30.54, 30.50, 30.44, 30.36, 30.31, 30.29, 30.28, 30.20, 30.18, 29.45, 29.42, 27.03, 26.03.
mPEG-NHCO-C20- CO2H 7b
Docosanedioic acid 6b (1.56 g, 4.20 mmol, 4.0 equiv.) and mPEG-NH2 4 (0.79 g, 1.05 mmol, 1.0 equiv.) were stirred in bulk at 120 °C till a melt was formed and subsequently stirred under vacuum for 3 h. The bulk mixture was cooled down and MeOH was added under stirring at rt. The dispersion was repeatedly separated under centrifugation at 4000 r/min at 4 °C, and the collected supernatants were concentrated under reduced pressure. A short column chromatography of the reaction mixture (Rf = 0.67, MeOH/CH2Cl2 1:9) afforded an orange solid (0.52 g, 0.46 mmol, 44%).
1H NMR (500 MHz, MeOD) δ = 3.64 (m, 58H, PEG backbone), 3.54 (m, 4H, PEG backbone), 3.36 (s, 3H. OCH3), 2.27 (t, J = 7.4, 2H, CH2-COOH), 2.19 (t, J = 7.5, 2H, CH2-NH2), 1.60 (m, 4H, NH-CH2-CH2-(CH2)14-CH2-CH2-COOH), 1.30 (m, 28H, NH-CH2-CH2-(CH2)14-CH2-CH2-COOH). 13C NMR (126 MHz, MeOD) δ = 177.74 (COOH), 177.70 (NHCOOH), 176.39, 72.97, 71.57, 71.36, 71.27, 70.61, 59.11 (OCH3), 40.36, 37.06, 34.96, 30.81, 30.76, 30.74, 30.73, 30.71, 30.65, 30.61, 30.47, 30.43, 30.30, 30.24, 27.04, 26.10.

2.2.3. Synthesis of the Nanocarriers

General procedure: The corresponding dishell (1.5 equiv.) was dissolved in MES pH 5 buffer (50 mL per mmol hPG-NH2), and NHS (1.6 equiv.) was added. Cooled with an ice bath, EDCI (1.6 equiv.) was added and the reaction mixture warmed up to room temperature. hPG in water (1.0 equiv.) was added to the reaction mixture. In the case of the FITC-labelled products, hPG-NH2 was stirred in DMSO and FITC (3 molecules per hPG) in the dark at room temperature 2 d prior to the synthesis. After stirring for 24 h, the reaction mixture was concentrated to about 10 mL under reduced pressure and purified through either dialysis in water (benzoylated cellulose, MWCO = 14,000 g/mol, dialysis tubing by Carl Roth) or a sephadex (Cytiva) column to afford the product.
rsCMS 1a
General procedure. Dishell (1.40 g, 1.20 mmol), MES buffer (40 mL), NHS (0.15 g, 1.28 mmol), EDCI (0.25 g, 1.28 mmol) and hPG-NH2 in water (84 mg in 4.2 mL, 0.80 mmol NH2) afforded a yellow stock solution in water (70% yield).
1H NMR (500 MHz, MeOD) δ = 3.64 (m, hPG and PEG backbone), 3.36 (m, OCH3), 2.69 (t, J = 7.2, CH2-SS-CH2), 2.32 (t, J = 7.4, CH2-COOH), 2.19 (t, J = 7.5, CH2-NH2), 1.40 (m, 1H, alkyl backbone). 13C NMR (126 MHz, MeOD) δ = 176.32, 175.97, 72.95, 71.53, 71.33, 71.26, 70.60, 59.11, 51.99, 40.34, 39.79, 37.05, 34.80, 30.62, 30.57, 30.55, 30.52, 30.48, 30.43, 30.34, 30.29, 30.28, 30.26, 30.19, 30.19, 30.16, 29.44, 29.41, 27.02, 27.01, 26.02.
ccCMS 1b
General procedure. Dishell (1.40 g, 1.20 mmol), MES buffer (40 mL), NHS (0.15 g, 1.28 mmol), EDCI (0.25 g, 1.28 mmol) and hPG-NH2 in water (84 mg in 4.2 mL, 0.80 mmol NH2) afforded a yellow stock solution in water (65% yield).
1H NMR (500 MHz, MeOD) δ = 3.64 (m, hPG and PEG backbone), 3.36 (s, OCH3), 2.22 (m, alkyl backbone), 1.40 (m, alkyl backbone). 13C NMR (126 MHz, MeOD) δ = 178.66, 176.25, 72.93, 71.52, 71.46, 71.32, 71.23, 70.57, 59.10, 40.31, 37.02, 35.89, 30.79, 30.65, 30.48, 30.40, 30.30, 27.01, 26.46.
FITC-labelled nanocarriers
rsCMS-(FITC) and ccCMS-(FITC) were synthesized based on the general procedure while using hPG-NH2 that was stirred for 2 d with FITC (3 molecules per hPG) in dry DMSO prior to use.

2.2.4. Drug Encapsulation

Encapsulation of host molecules via horn sonication. To 1 mL of a CMS stock solution in Milli-Q water, 2.5 mg of the drug was added (5 mg/mL) in order to achieve a concentration of 50 wt%. The mixture was horn sonicated for 2–5 min using an ice bath for cooling. For PhA, drug encapsulation was additionally performed by stirring the carrier with 50 wt% PhA and 100 µL acetone for 2 h, removing acetone afterwards and subsequently stirring for another 22 h. In all cases, non-encapsulated drug was removed by centrifugation at 4000 rpm for 3 min. The supernatant was stored at 4 °C in the dark.

2.2.5. Characterization Methods

Nuclear magnetic resonance (NMR). 1H-NMR and 13C-NMR spectra were acquired at room temperature by a JEOL ECP 500 and Bruker AVANCE 500. Tetramethyl silane (TMS) was used to calibrate the chemical shift δ which is reported in parts per million (ppm). The residual solvent peak was used as a reference (CDCl3, δ 1H = 7.26 ppm, 13C = 77.16 ppm; MeOD, δ 1H = 3.31 ppm, 13C = 49.00 ppm). The peak multiplicity is quoted as s = singlet, d = doublet, t = triplet, q = quartet and m = multiplet, while the coupling constants J are reported in Hertz (Hz). MestReNova version 14.1.1 was used for data processing. NMR spectra of the synthesized compounds are available in the supporting information.
Gel permeation chromatography (GPC). GPC was used to measure the size of the synthesized polymers. For GPC measurements, a Shimadzu liquid chromatograph (Kyoto, Japan) with a pump, degasser, column oven and a differential refractometer was used. The mobile phase, consisting of dimethylformamide (DMF) with 0.3% LiBr and 0.6% acetic acid, was used at a flow rate of 1 mL/min. The three PolarSil columns (PSS Polymer Standards Service GmbH, Mainz, Germany; PolarSil 8 mm × 300 mm, 100, 1000, 3000 Å with 5 µm particle size) that were used were operated at 40 °C with the refractive index (RI) detector set to the same temperature. Samples were measured at a concentration of 10 mg/mL injecting 100 µL. A polystyrene standard (PSS, Mainz, Germany) was used for calibration. LC solution software from Shimadzu was used for data acquirement and interpretation.
Dynamic light scattering (DLS). A Malvern Zetasizer Nano instrument (Malvern Instruments Ltd., Worcestershire, UK) equipped with a He-Ne laser (633 nm) using the backscattering mode (detector angle 173°) was used for DLS measurements. To measure the hydrodynamic diameter (DH), the CMS nanocarriers were dissolved in Milli-Q water or PBS mixed by a vortex shaker for 2 min, and 100 µL of the solution were added to a disposable Plastibrand® micro cuvette (Brand GmbH + Co KG, Wertheim, Germany) with a round aperture. The measurements were performed at 25 °C, equilibrating the system at this temperature for 120 s. The Zetasizer DLS software (Malvern Instruments Ltd., Worcestershire, UK) was used to determine the size distribution by intensity and volume.
Cyclic voltammetry. An autolab PGSTAT302N potentiostat using a three-electrode configuration was used for cyclic voltammetric measurements. Samples were dissolved in dry DMSO, purging nitrogen through it before measuring. Cyclic voltammetric and differential pulse voltammetry (DPV) measurements were performed at a scanning speed of 100 mV/s using glassy carbon as a working electrode, a platinum wire as a counter electrode and a silver wire as a pseudo reference electrode. Raw data were analyzed using Nova 1.5 by Metronohm and figures were plotted using Igor Pro.
High-performance liquid chromatography (HPLC). A Knauer Smartline-HPLC system with an internal UV absorption detector (λ = 254 nm), equipped with a Gemini RP C18 column (Phenomenex, 250 nm × 4.6 mm, particle size: 5 µm) was used for isocratic HPLC measurements. Acetonitrile was used as a mobile phase at a 1.0 mL/min flow rate. Data analysis was performed using Chromgate software (Knauer, Berlin, Germany). For the determination of the drug loading content (DLC) of rapamycin and dexamethasone via HPLC, 50 µL of the drug@CMS solutions were freeze-dried and then dissolved in 300 µL acetonitrile. The concentration of the drug in solution was determined using a calibration curve of rapamycin in acetonitrile (concentration range: 0.5–0.015625 mg/mL). Calibration curves were freshly prepared and measured prior to sample measurements (Figures S15 and S16).
Ultraviolet and visible spectroscopy (UV–Vis). An Agilent Cary 8454 UV-Visible spectrophotometer using Suprasil® from Hellma analytics (Hellma GmbH & Co. KG, Müllheim, Germany) or Spectrosil® (Carl Roth, Karlsruhe, Germany) half-micro quartz cuvettes were used for UV–Vis measurements. Data were collected using the UV-Vis ChemStation Software version B.05.02 (Agilent Technologies, Santa Clara, CA, USA). For the determination of the DLC through UV–Vis, 50 µL of the drug-encapsulated solution were freeze-dried and dissolved in either acetonitrile for Nile red (NR), or in acetone for mTHPP and PhA. The concentration in the sample was determined using the Lambert–Beer law.
Fluorescence spectroscopy. Measurements were performed on a Scinco S-3100 spectrometer at 37 °C, maintained with a Haake F3 thermostat. Measurements were conducted using Suprasil® (Hellma Analytics) half-micro quartz cuvettes with a 4 × 10 mm light path and stopper, and an excitation and emission band width of 5 nm was chosen for the measurements. For the release of NR@rsCMS with TCEP, 100 µL of a 5 mg/mL NR@rsCMS solution in Milli-Q water were dried and dissolved in 10-fold concentrated PBS. Then 10 mM TCEP was added and the pH was set to 6.4 with 310 µL 1M KOH. The fluorescence measurement at 37 °C was started directly after dissolution, and spectra were taken every 5 min for 24 h. The same conditions were used for the release study of NR@ccCMS while measuring the fluorescence spectrum before and after 24 h. For the release of NR@rsCMS with 10 mM GSH, the solution was prepared correspondingly, adding 10 mM GSH and keeping a pH of 7.4. The fluorescence measurement at 37 °C was started directly after dissolution, and spectra were taken every 30 min for 24 h. For the GSH release study with a mixed solution, the sample was shaken at 37 °C, facilitating a mixing of the solution, and taken out at regular intervals to measure the fluorescence spectrum for 24 h. Control release experiments were conducted with rsCMS in 10-fold concentrated PBS, but in the absence of any reducing agent. The respective fluorescence measurements at 37 °C were started directly after dissolution, and spectra were taken every 30 min for 24 h.

2.2.6. Skin Penetration Experiments

Skin samples from healthy donors undergoing plastic surgery were obtained after informed consent. The study was conducted after approval by the Ethics Committee of the Charité—Universitätsmedizin Berlin (approval EA1/135/06, renewed in January 2019) and in accordance with the Declaration of Helsinki guidelines. A few hours after the surgery, the skin was cleaned and examined microscopically, intact skin areas were cut out, subcutaneous fat was removed, and skin pieces of 1.5 × 1.5 cm were prepared. Skin pieces were placed on trans-well inserts with an 8 µm pore membrane (Cell Culture Inserts, BD Falcon™, Durham, NC, USA) and these were placed in a 6-well plate filled with 2 mL RPMI-1640 medium (PAA, Heidelberg, Germany), supplemented with 10% fetal calf serum (FCS, PAA, Heidelberg, Germany), 100 I.E./mL of penicillin and 100 g/mL of streptomycin. The tested formulations, 40 µL of 5 mg/mL CMS nanocarrier suspensions in 2.5% HEC gel, were applied on approximately 1 cm2 of skin, leaving untreated margins. Samples were then incubated for 24 h in an incubator at 37 °C, 5% CO2, 100% humidity. Skin samples treated with 2.5% HEC gel only served as controls. After incubation, the non-penetrated material on the top of skin was removed with a cotton swab; the central treated part of the skin samples was cut with an 8 mm punch biopsy and frozen in liquid nitrogen. Skin sections of 5 µm in thickness were prepared with a cryotome (Frigocut 2800 N, Leica, Bensheim, Germany). Skin from three donors was treated. From each skin sample, at least 20 sections were prepared and at least 20 pictures were taken with a confocal fluorescence scanning microscope (LSM 700 (Zeiss, Jena, Germany)). At least 30 images per CMS sample and control were analyzed using ImageJ software version 1.47 (National Institute of Health, Bethesda, MD, USA). The mean fluorescence intensity (MFI) of SC, viable epidermis (VE) and dermis (D) was calculated for each section. Sample values were subtracted from the MFI of the respective controls and normalized with respect to the mTHPP loading percentage of the respective CMS nanocarrier. Averages and standard errors were calculated, and graphics were prepared using Office Excel (Microsoft Corp., Redmond, WA, USA). Statistical analysis was done using one-way analysis of variance (ANOVA) followed by comparison of two groups with a Student’s t-test.

3. Results and Discussion

3.1. Synthesis of the CMS Nanocarriers and Their Building Blocks

The CMS nanocarriers were synthesized by a convergent synthetic approach, combining two pre-synthesized building blocks (Scheme 1).
The outer shell, mPEG-NH2 4, was obtained by mesylating the hydroxy group of mPEG-OH 2 to mPEG-OMs 3 and subsequent amination. Both reactions were performed with a yield of 91%. Disulfide 6a was obtained through oxidation of mercaptoundecanoic acid 5a with a yield of 100%. Amidation of mPEG-NH2 4 with a four-fold excess of disulfide 6a through condensation under vacuum led to dishell 7a with a yield of 86%. Its non-sulfuric counterpart was synthesized in a similar fashion affording 44% of dishell 7b. The double shell building blocks were conjugated to the core building block hPG-NH2 through amide bond formation in aqueous medium. Thereby, dishell 7a led to the rsCMS nanocarrier 1a with a yield of 70% and dishell 7b led to the non-reduction-sensitive ccCMS nanocarrier 1b with a yield of 65%. Purification via dialysis in water led to a CMS with narrow polydispersity indexes (PDIs) between 1.1 and 1.2 (Table 1). NMR spectra of all materials are depicted in the supplementary information (Figures S1–S14). The FITC-labelled nanocarriers were synthesized accordingly while stirring hPG-NH2 with FITC (three molecules per hPG) in DMSO in the dark at room temperature 2 d prior to the synthesis.
The molar mass of the synthesized CMS nanocarriers depends on the amount of conjugated double shell, reflected by the degree of functionalization (DF). Assuming a full conversion of all 95 amine groups of hPG-NH2 and a resulting DF of 100%, all nanocarriers have a theoretical molar mass of above 100 g/mol (Table 1). GPC and 1H NMR (NMR-based calculation of Mn in SI) indicated a lower degree of functionalization with lower molar masses. Reactions between the double shell 7b and the highly aminated hPG result in poor conversions, reflected by the mediocre DF value of 67% for ccCMS 1b. The rsCMS 1a, on the other hand, resulted in a higher conversion rate with a DF of 89%. Despite the deviant molar mass of rsCMS 1a and ccCMS 1b, GPC analysis gave comparably similar Mn. This has been observed before and shows the frequent limitation of GPC performed with linear standards in the analysis of hyperbranched polymers [22,23]. The PDI value of both carriers varies from 9.3 nm for rsCMS 1a to 14.3 nm for ccCMS 1b. The latter is based on aggregation and has also been reported for comparable structures [24]. While the PDI value of the GPC measurement indicates a narrow monodisperse distribution, the PDI value indicates a moderate polydispersity, which presumably stems from formed aggregations.

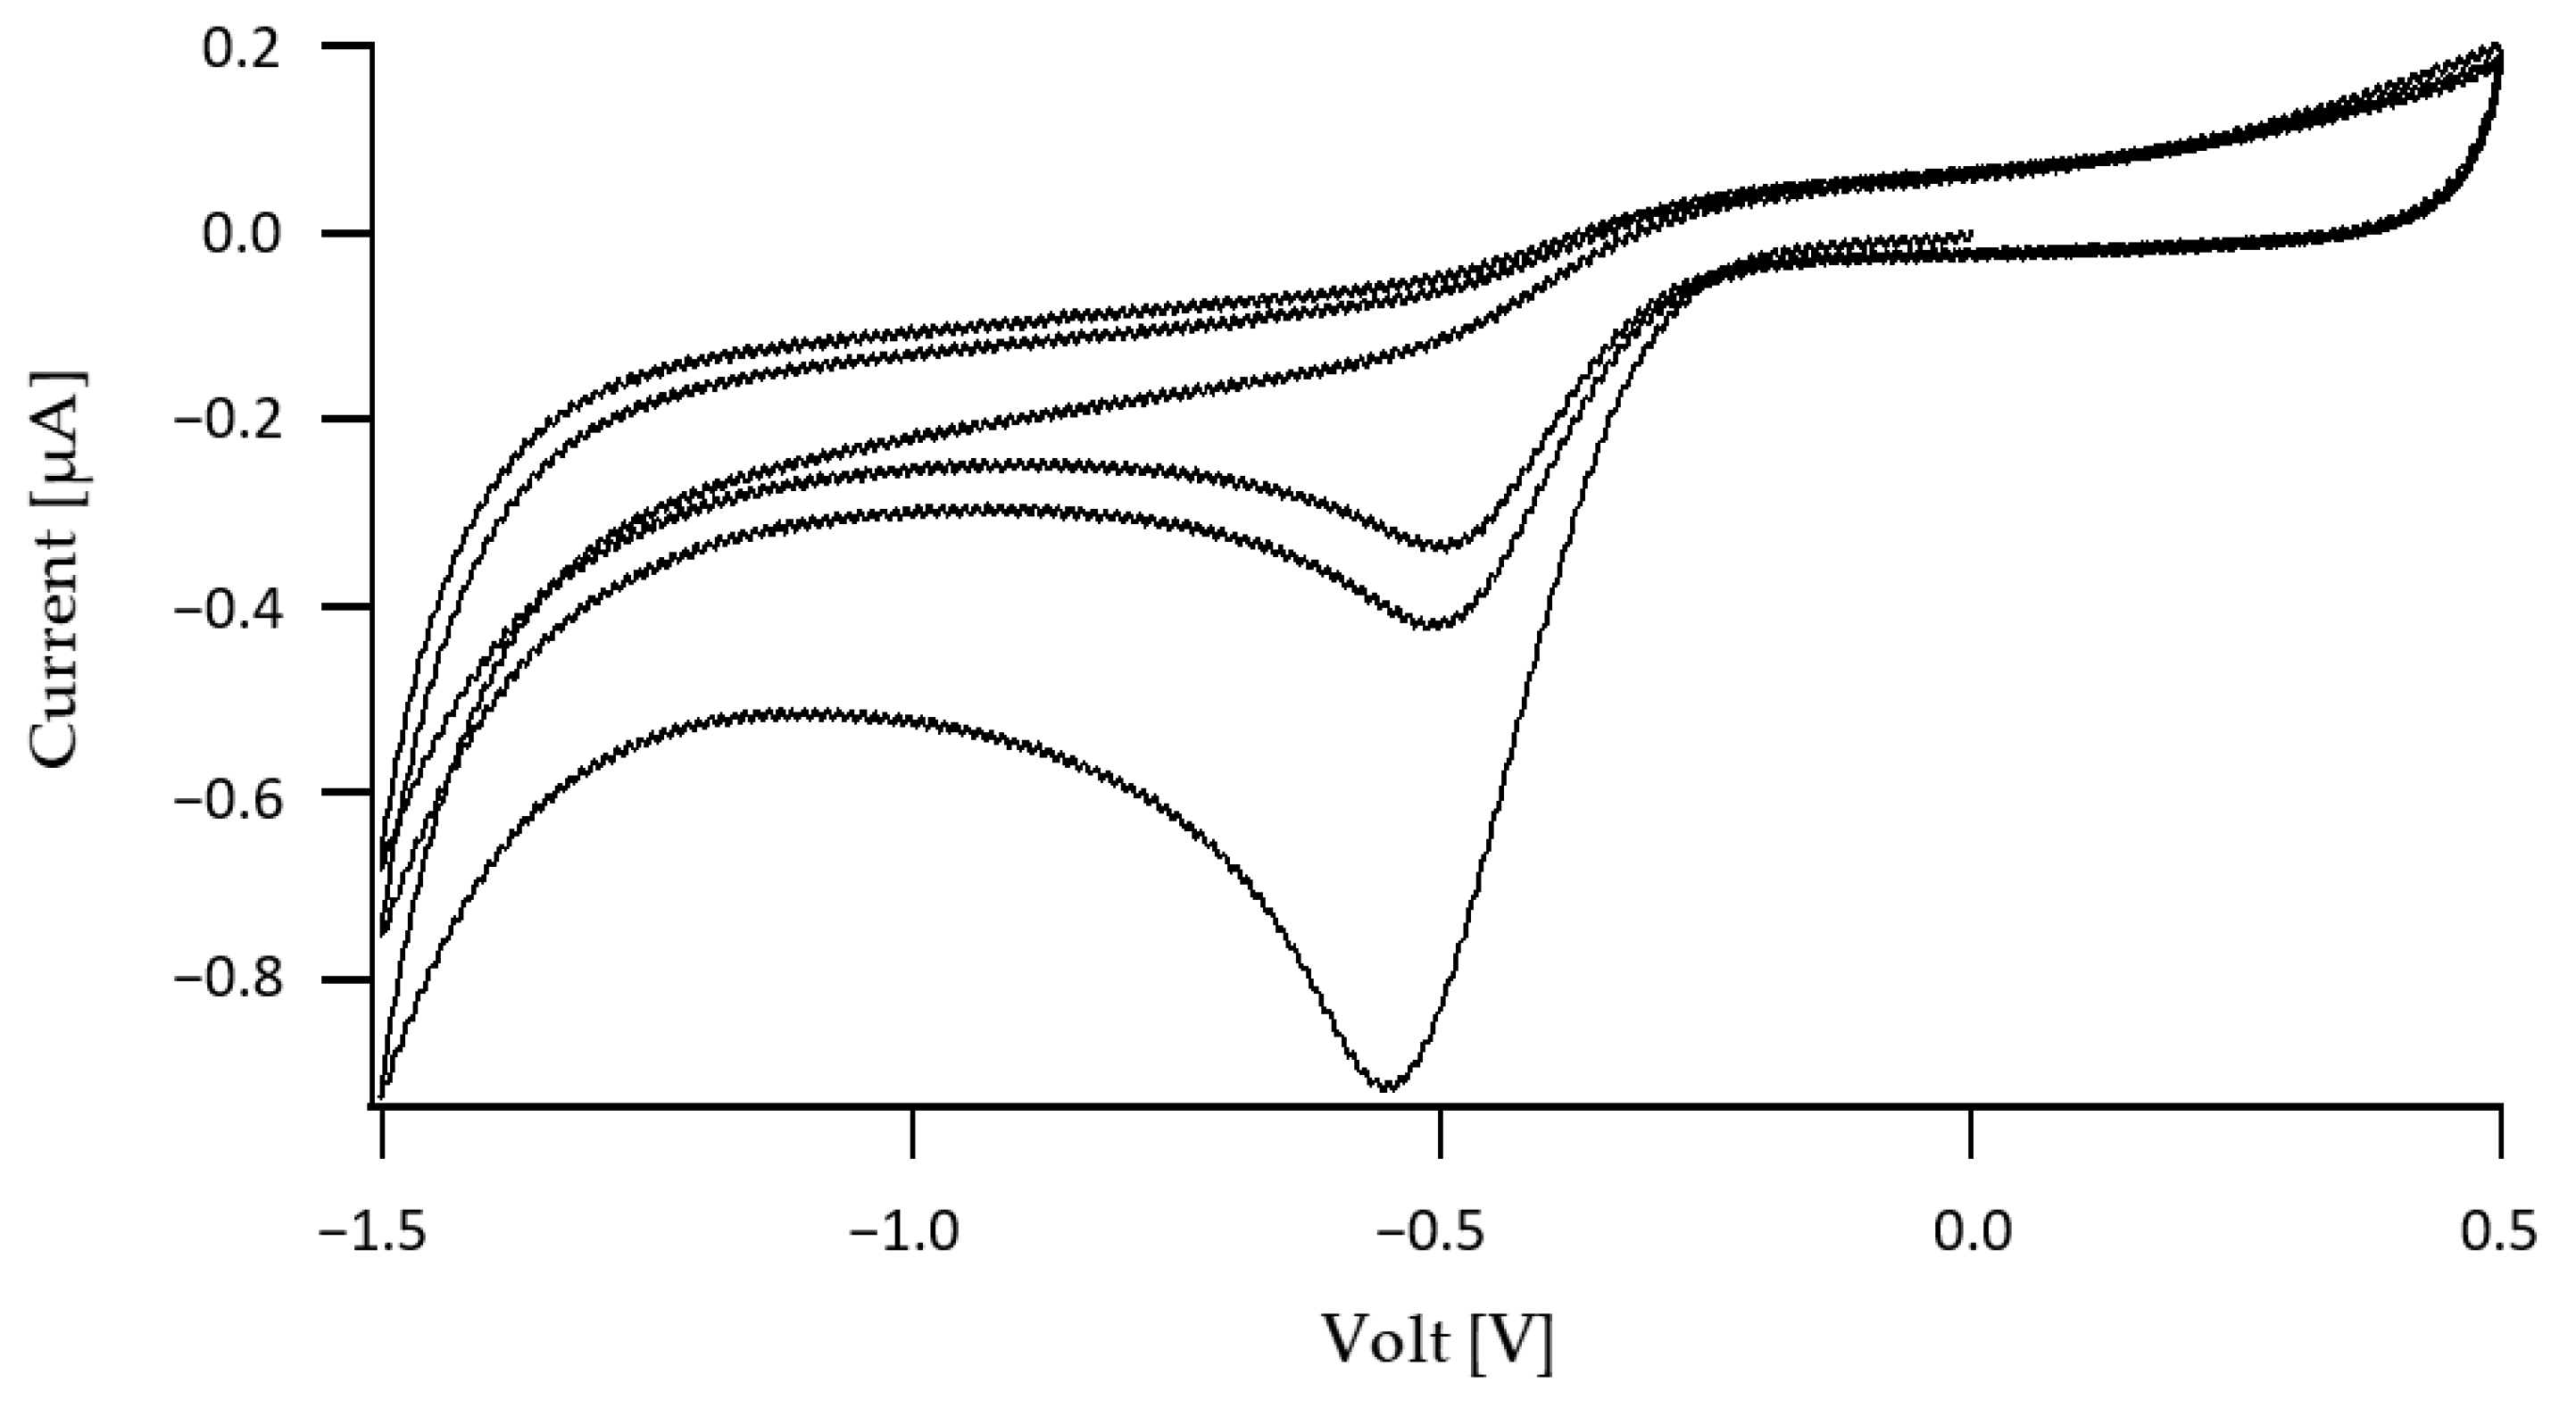
3.2. Redox Potential of rsCMS 1a

To investigate the nature of the redox-sensitive environment of the rsCMS carrier 1a, cyclic voltammetric measurements were performed to compare the reductive potential towards commonly used reducing agents. As reducing agents, TCEP and GSH, which are commonly evident in skin tissues, were used. Additionally, DPV measurements were performed to determine the redox potential.
The rsCMS carrier 1a showed a reducing potential at −0.51 V and an oxidation potential at −0.26 V (Figure 1), which stem from the reduction and subsequent oxidation of its disulfide bonds. DPV measurements gave an overall redox potential of −0.44 V. The structurally similar disulfide 6a showed a reduction potential at −0.55 V and an oxidation potential at −0.38 V and an overall redox potential of −0.51 V, indicating a less pronounced reducibility (S17).
TCEP shows a reduction potential of −1.65 V while the oxidation potential is hidden under the voltammetric curve (Figure S18). Its overall redox potential was determined as −1.62 V. The redox process stems from the oxidation and subsequent reduction of the phosphor moiety. As to be expected, GSH shows a higher reduction potential at −0.75 V and an oxidation potential at −0.65 V, being a milder reducing agent (Figure S19). For the actual measurement, its oxidized counterpart GSSG was used, as the detection limit of GSH is rather high and its use is limited due to its low solubility in DMSO. Its redox potential was determined as −0.70 V. Its redox process can be classified as the thiol oxidization and disulfide cleavage. Having a higher reduction potential than rsCMS 1a, both compounds function as reducing agents for rsCMS 1a.
Being measured under the same conditions, the redox potentials of TCEP, GSH and rsCMS 1a can be compared. Changes in the condition, such as different solvents, choice of electrodes or pH dependence can lead to somewhat large changes in the redox potential, making direct comparisons with the literature unreliable [25]. An overview of the redox potentials is depicted in Table 2.

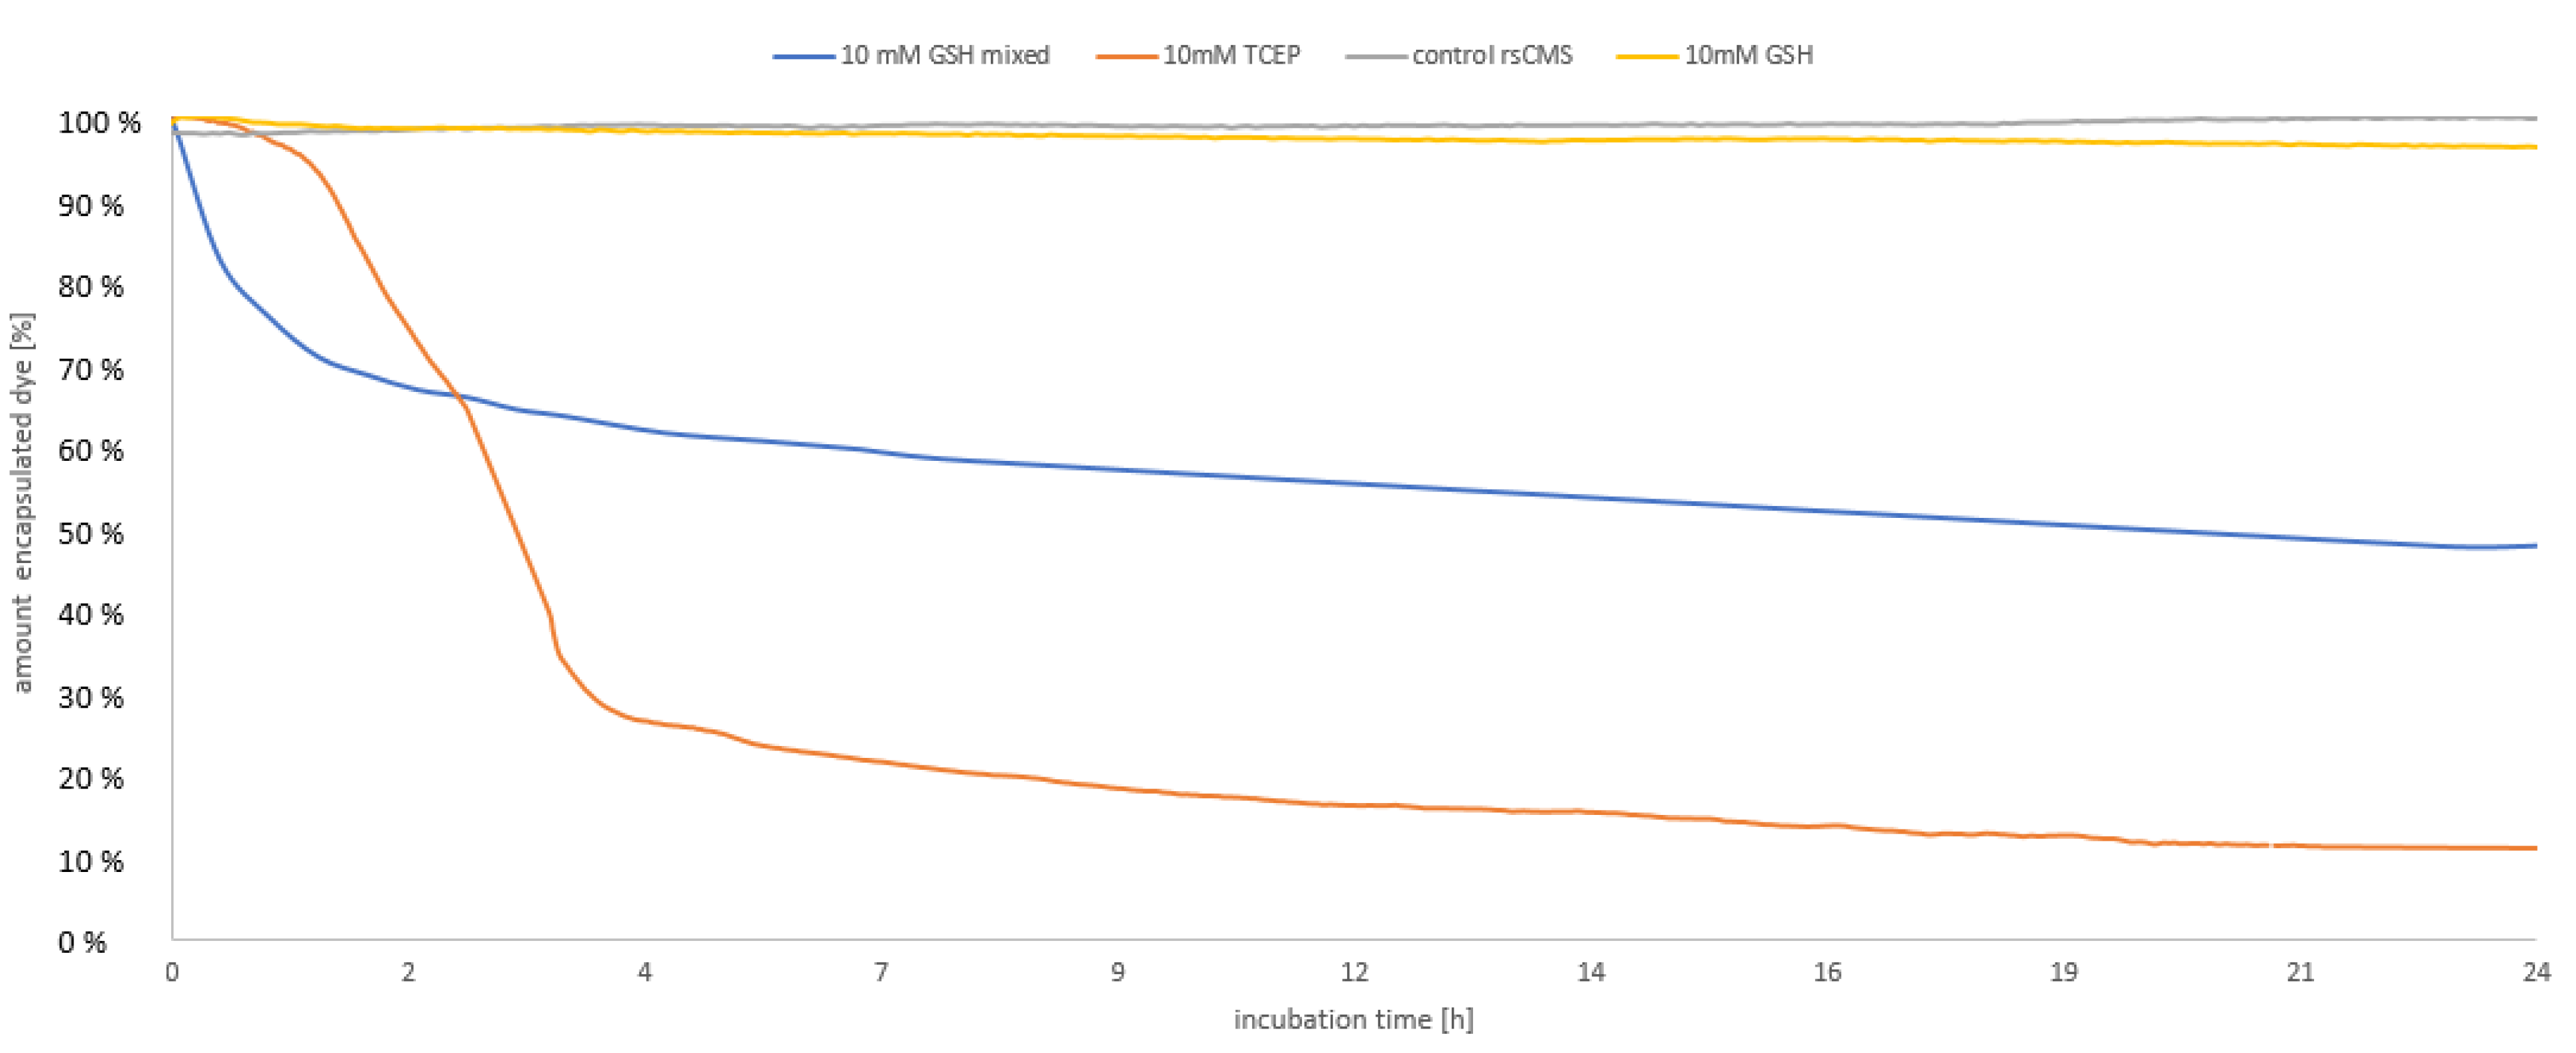
3.3. In Vitro Stimulus-Triggered Release of NR from CMS Nanocarriers

Stimulus-triggered release of drugs from CMS nanocarriers was performed for a proof of concept using NR as a model drug. The fluorescent dye NR has a poor water solubility. Encapsulated into a nanocarrier, its water solubility can be enhanced, which results in a higher NR fluorescence intensity compared to an aqueous solution of the dye. Once released from the nanocarrier, NR either forms aggregates, or precipitates due to its low solubility in water. This results in a reduced fluorescence intensity of the aqueous medium. The dye release can therefore be measured through the fluorescence intensity of the suspension using the wavelength maximum of NR emission [26].
The redox environment of a cell and its redox state in a biological context are still not fully understood to this day [27,28]. The GSH/GSSG couple is the most abundant redox couple in a cell. Their ratio of 100:1 is constantly maintained by enzymes such as γ-glutamylcysteine synthetase or glutathione synthetase [27]. The cytosolic concentration of GSH varies between 1 and 11 mM. For a proof-of-concept study, a concentration of 10 mM GSH was chosen (Figure 2). To balance the acidifying properties of GSH, a 10 mM PBS solution (pH 7.4) was used. The fluorescence measurement of the GSH-triggered release under incubation without shaking shows a fluorescence decrease of 4% within 24 h (Figure 2, yellow line). Having a higher molecular weight, the accessibility of GSH to the disulfide bond is limited, resulting in a low drug release. To facilitate the accessibility of the reduction site, the same release experiment was performed under continuous shaking, measuring the release within 24 h (Figure 2, blue line). In this case, a significant drug release was evident, with 36% of NR released within 4 h, and 52% released after 24 h. The TCEP-triggered release led to a significant release under incubation without shaking, with a 70% release after 4 h and an overall release of 90% within 24 h (Figure 2, orange line). The sigmoidal shape of the release curves indicates an auto-accelerated release process as the reducing agents can access the disulfides more easily once the outer shell is cleaved [29,30,31].
As control reactions, NR release from the rsCMS nanocarrier without reducing agents (Figure 2, grey line) as well as NR release from the ccCMS nanocarrier with TCEP (Figure S20) were measured. As expected, both control reactions showed no decrease in fluorescence intensity, i.e., no triggered NR release.
The reduction of rsCMS 1a by TCEP leads to a partial degradation of the nanocarrier and possible crosslinking. After 24 h of TCEP incubation, the previously clear sample became turbid, and DLS measurement of the filtered nanocarrier sample showed only fragments with a size less than 1 nm. Reduction by GSH, limited by the low fraction of reductive, non-oxidized GSH, as discussed above, was observed by following the methylene signal adjacent to disulfide at 2.8 ppm shifting to 2.6 ppm, assigned to the methylene group of the alkyl inner shell, adjacent to thiol (Figure S21).
In general, cleavage of disulfide-containing polymers by reducing agents, such as dithiothreitol, has been shown by methods such as DLS and GPC measurements [32,33].

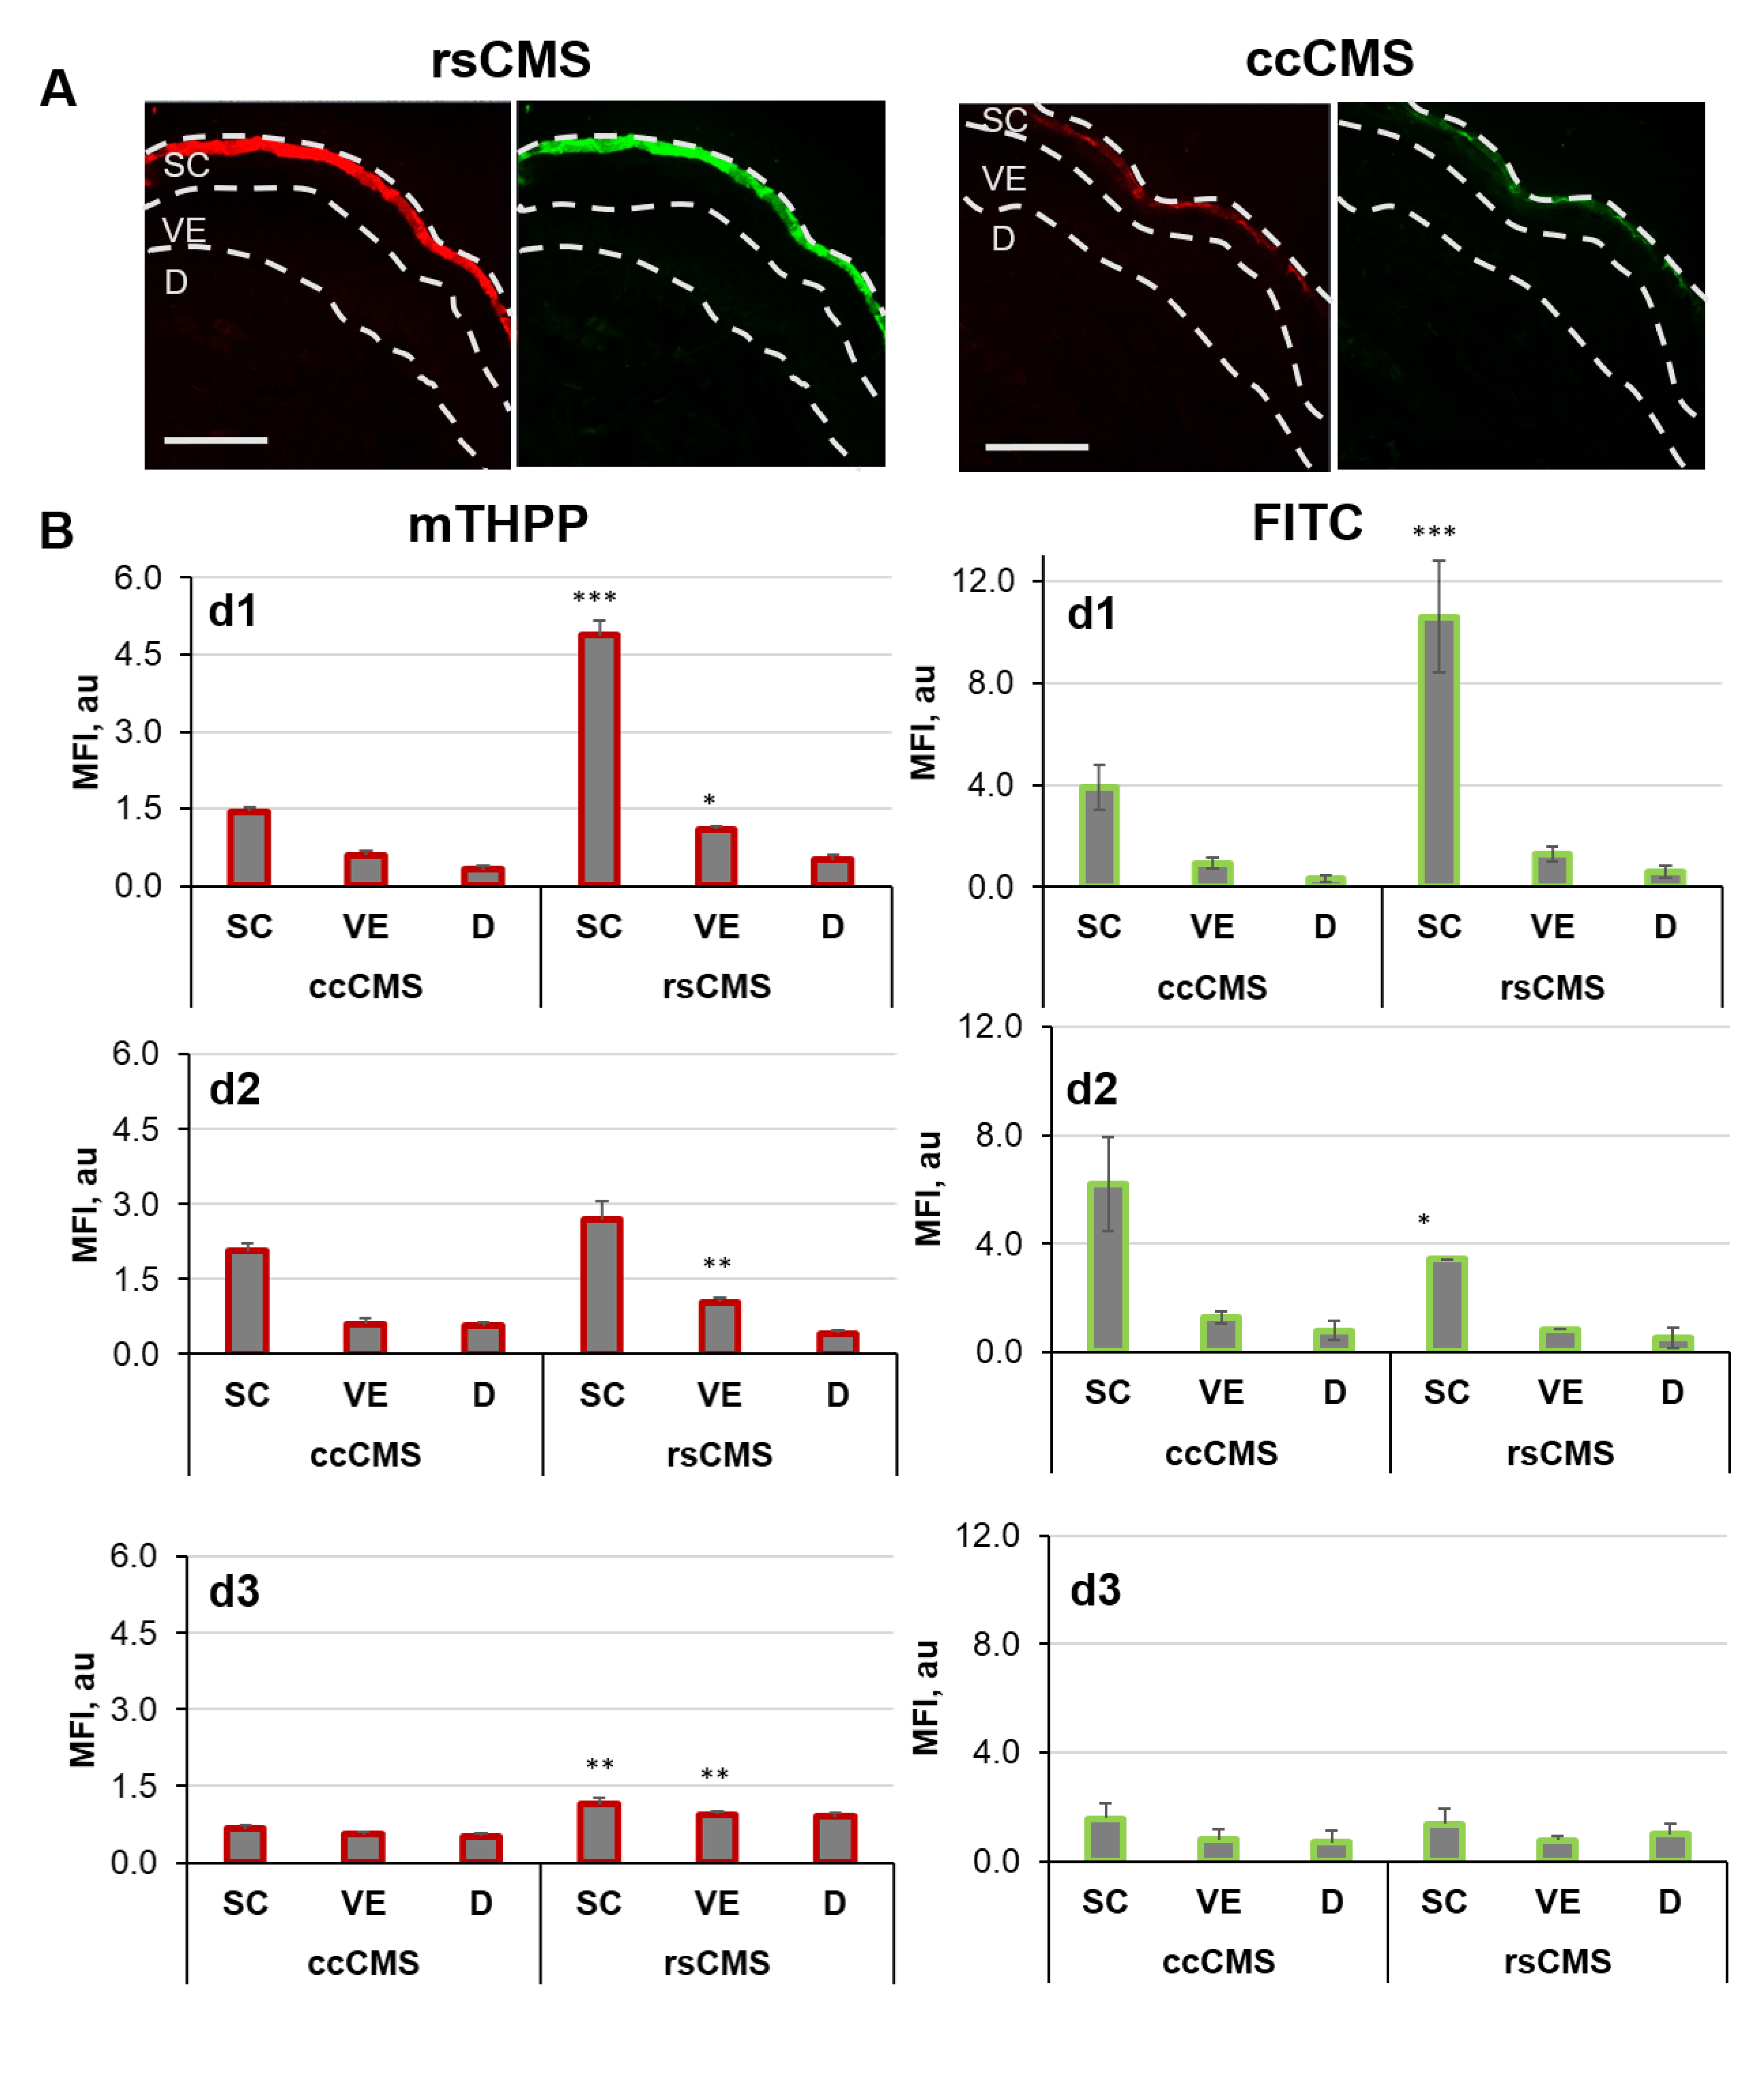
3.4. Penetration of rsCMS-(FITC) and ccCMS-(FITC) Nanocarriers and Diffusion of the Loaded mTHPP in Ex Vivo Human Skin

In order to test the drug delivery ability of the investigated nanocarriers, ex vivo human skin was topically treated with a 2.5% HEC gel formulation of fluorescent CMS nanocarriers (Figure 3). The penetration of the nanocarriers could be detected by the covalently bound FITC (green), whereas the nanocarrier delivery properties could be tested by measuring the fluorescence of the loaded mTHPP dye (red). In Figure 3A, representative images of skin sections from rsCMS and ccCMS samples are shown. Pictures of samples and controls were taken using the same microscope and camera settings. After normalization to the amount of loaded dye, the highest penetration rate was detected for the rsCMS samples. While the nanocarriers were observed in the SC only, a weak but significant mTHPP signal was also appreciable in the VE and D. The analysis of the pictures (at least 30 per sample) was performed using the image processing software ImageJ. Low fluorescence signals were detected for the untreated control skin in all three skin layers: SC, VE and D. The average background fluorescence of controls was subtracted from sample values before averages and normalized values were calculated. Figure 3B shows the summary of the fluorescence intensities for the three different donors.
Acceptable variations between the skin penetration results obtained from different donors were found. The highest fluorescence intensities were detected in the SC, both for mTHPP and FITC signals. Small but detectable amounts of fluorescence signal were also detected in the VE and D. Although in the VE no differences between the FITC signals of the two nanocarriers could be measured, a higher mTHPP signal was detected for rsCMS 1a in the VE as compared to the ccCMS 1b nanocarrier. The higher mTHPP signal in the VE of rsCMS 1a samples can be explained by the interaction of the rsCMS 1a nanocarriers with the SC reductive environment, the triggered dye release and the consequent positive effect on dye diffusion to the VE. In general, these results confirm the possibility to use a reduction-initiated drug release as trigger for topical drug delivery.

3.5. Drug-Loading Capacity

The drug-loading performance of the CMS nanocarriers was screened using the fluorescent dyes NR, mTHPP and PhA, as well as the anti-inflammatory drugs dexamethasone and rapamycin.
NR has a lower log P value, while porphyrins are generally very hydrophobic and are used to mimic very hydrophobic drugs [34,35]. mTHPP itself is a hydrophobic drug used as a photosensitizer in the treatment of head and neck cancer [35]. Dexamethasone and rapamycin were chosen as examples for hydrophobic drugs with low and high molecular weight, respectively. Hence, the DLC of host molecules with a broad range of water solubility was depicted.
The encapsulation of NR, dexamethasone, rapamycin, mTHPP and PhA was achieved through horn sonicating the CMS nanocarrier suspension with the drug for 2 min to achieve a DLC of 1-3 weight percent (wt%), as depicted in Table 3. There is no trend evident regarding the DLC based on the hydrophobicity or molecular weight of the drug. Increasing the horn-sonicating time for mTHPP samples led to an increased DLC from 1 wt% to 2–3 wt%. Stirring PhA with traces of acetone and removing acetone prior to the removal of excess non-encapsulated drug even increased the DLC from 2 wt% to 6 wt%, proving it to be the most effective encapsulating method. There is no visible difference in the DLC based on the carrier used. DLCs in a similar range were observed for CMS systems with similar structures [24,36].
The drug loading was comparable despite the hydrophobicity of the used drug, while different loading methods had an impact of the DLC. The final DLC could have some effect on the speed of drug release, e.g., if the carrier has a higher loading, more drug molecules might be located on the outer shell and thus be released more rapidly once the carrier reacts with reducing agents. Higher DLCs could also have an impact on the in vivo performance, as higher loading is often associated with higher drug delivery across the skin barrier. Additionally, for the same effect of the drug, less nanocarrier will be needed.

4. Conclusions

The synthesis of rsCMS 1a and ccCMS 1b resulted in chemically comparable CMS nanocarriers with sizes below 20 nm and narrow molecular weight distributions. The reduction potential of the disulfide of rsCMS 1a was determined as 0.23 V through cyclic voltammetric measurements. Having a lower reduction potential, TCEP and GSH were proven to be adequate as reducing agents.
The proof-of-concept in vitro study supported the hypothesized triggered release of the fluorescent model drug NR, analyzed by time-dependent fluorescence spectroscopy measurements. The reduction-triggered release of NR from rsCMS 1a was shown with GSH, resulting in a drug release of 52% within 24 h, while the release with TCEP was more pronounced and led to 90% release of the encapsulated dye within 24 h.
The ex vivo skin experiments served as a proof of concept to show the applicability of this concept for dermal drug delivery. With the SC being rich in GSH and other thiol groups, it acts as a trigger for drug delivery once the nanocarriers have penetrated the SC. The chosen macrocyclic dye has similar molecular weight and hydrophilicity (log P) to macrolide drugs like rapamycin.
A DLC of generally 1–6 wt% was achieved for drugs with various molecular weights and water solubility. Thus, these results show the feasibility of the proposed concept for a triggered dermal drug delivery based on the redox potential of the target tissue and great potential for macrolide drugs.

Supplementary Materials

The following are available online at https://www.mdpi.com/1999-4923/13/1/37/s1, Figure S1. 1H NMR of mPEG-OMs 3, Figure S2. 13C NMR of mPEG-OMs 3, Figure S3. 1H NMR of mPEG-NH2 4, Figure S4. 13C NMR of mPEG-NH2 4, Figure S5. 1H NMR of disulfide 6a, Figure S6. 13C NMR of disulfide 6a, Figure S7. 1H NMR of dishell 7a, Figure S8. 13C NMR of dishell 7a, Figure S9. 1H NMR of dishell 7b, Figure S10. 13C NMR of dishell 7b, Figure S11. 1H NMR of rsCMS 1a, Figure S12. 13C NMR of rsCMS 1a, Figure S13. 1H NMR of ccCMS 1b, Figure S14. 13C NMR of ccCMS 1b, Figure S15. Calibration curve of dexamethasone, Figure S16. Calibration curve of rapamycin, Figure S17. Cyclic voltammetric measurements of disulfide 6a in dry DMSO at a scan rate of 100 mV/s, six rounds, Figure S18. Cyclic voltammetric measurements of TCEP in dry DMSO at a scan rate of 100 mV/s, two rounds, Figure S19. Cyclic voltammetric measurements of GSH in dry DMSO at a scan rate of 100 mV/s, three rounds, Figure S20. Fluorescence measurement of NR-encapsulated ccCMS incubated with TCEP before and after 24 h, Figure S21. Stacked 1H NMR spectra of interval measurement, 80 scans per measurement; incubation with 10 mM GSH solution in PBS pH 7.4 at 37 °C; ratio of 2.8 ppm (CH2-SS-CH2) vs. 2.6 ppm (CH2-SH).

Author Contributions

Conceptualization, methodology, synthesis, in vitro studies, data interpretation, writing—original draft preparation, visualization, K.R.; conceptualization, synthesis, in vitro studies, K.A.W.; ex vivo studies, S.H. and F.Z.; methodology, ex vivo studies, data interpretation, visualization, F.R.; conceptualization, guidance, resources, funding acquisition, A.V. and R.H. All authors have read and agreed to the published version of the manuscript.

Funding

This research was funded by a DFG grant, grant number Vo 926/3-1 and by the Fonds der Chemischen Industrie (Sachkostenzuschuss).

Institutional Review Board Statement

The ex vivo study was conducted after approval by the Ethics Committee of the Charité—Universitätsmedizin Berlin (approval EA1/135/06, renewed in January 2019) and in accordance with the Declaration of Helsinki guidelines.

Informed Consent Statement

Informed consent was obtained from all subjects involved in the study.

Data Availability Statement

Data is contained within the article or supplementary material.

Acknowledgments

We would like to acknowledge the assistance of the Core Facility BioSupraMol supported by the DFG. dPG-NH2 was synthesized by Cathleen Schlesener.

Conflicts of Interest

The authors declare no conflict of interest. The funding is project based; yet the funders had no role in the design, in the collection, analyses, or interpretation of data; in the writing of the manuscript, or in the decision to publish the results.

References

  1. Wiseman, A.C. Immunosuppressive Medications. Clin. J. Am. Soc. Nephrol. 2016, 11, 332–343. [Google Scholar] [CrossRef] [Green Version]
  2. Ikeda, E.; Hikita, N.; Eto, K.; Mochizuki, M. Tacrolimus-rapamycin combination therapy for experimental autoimmune uveoretinitis. Jpn. J. Ophthalmol. 1998, 41, 396–402. [Google Scholar] [CrossRef]
  3. Saeidpour, S.; Lohan, S.; Anske, M.; Unbehauen, M.; Fleige, E.; Haag, R.; Meinke, M.; Bittl, R.; Teutloff, C. Localization of dexamethasone within dendritic core-multishell (CMS) nanoparticles and skin penetration properties studied by multi-frequency electron paramagnetic resonance (EPR) spectroscopy. Eur. J. Pharm. Biopharm. 2017, 116, 94–101. [Google Scholar] [CrossRef] [Green Version]
  4. Ogura, R.; Knox, J.M.; Griffin, A.C.; Kusuhara, M.; Ogura, J.M.K.R. The Concentration of Sulfhydryl and Disulfide in Human Epidermis, Hair and Nail. J. Investig. Dermatol. 2010, 38, 69–75. [Google Scholar] [CrossRef] [Green Version]
  5. Pickard, C.; Louafi, F.; McGuire, C.; Lowings, K.; Kumar, P.; Cooper, H.; Dearman, R.J.; Cumberbatch, M.; Kimber, I.; Healy, E.; et al. The Cutaneous Biochemical Redox Barrier: A Component of the Innate Immune Defenses against Sensitization by Highly Reactive Environmental Xenobiotics. J. Immunol. 2009, 183, 7576–7584. [Google Scholar] [CrossRef] [Green Version]
  6. Wang, Y.-C.; Wang, F.; Sun, T.-M.; Wang, J. Redox-Responsive Nanoparticles from the Single Disulfide Bond-Bridged Block Copolymer as Drug Carriers for Overcoming Multidrug Resistance in Cancer Cells. Bioconjugate Chem. 2011, 22, 1939–1945. [Google Scholar] [CrossRef]
  7. Ding, J.; Chen, J.; Li, D.; Xiao, C.; Zhang, J.; He, C.; Zhuang, X.; Chen, X. Biocompatible reduction-responsive polypeptide micelles as nanocarriers for enhanced chemotherapy efficacy in vitro. J. Mater. Chem. B 2013, 1, 69–81. [Google Scholar] [CrossRef]
  8. Xu, P.; Yu, H.; Zhang, Z.; Meng, Q.; Sun, H.; Chen, X.; Yin, Q.; Li, Y. Hydrogen-bonded and reduction-responsive micelles loading atorvastatin for therapy of breast cancer metastasis. Biomaterials 2014, 35, 7574–7587. [Google Scholar] [CrossRef] [PubMed]
  9. Sun, H.; Guo, B.; Li, X.; Cheng, R.; Meng, F.; Liu, H.; Zhong, Z. Shell-Sheddable Micelles Based on Dextran-SS-Poly(ε-caprolactone) Diblock Copolymer for Efficient Intracellular Release of Doxorubicin. Biomacromolecules 2010, 11, 848–854. [Google Scholar] [CrossRef] [PubMed]
  10. Thambi, T.; Deepagan, V.G.; Ko, H.; Lee, D.S.; Park, J.H. Bioreducible polymersomes for intracellular dual-drug delivery. J. Mater. Chem. 2012, 22, 22028–22036. [Google Scholar] [CrossRef]
  11. Cunningham, A.; Ko, N.R.; Oh, J.K. Synthesis and reduction-responsive disassembly of PLA-based mono-cleavable micelles. Colloids Surf. B Biointerfaces 2014, 122, 693–700. [Google Scholar] [CrossRef] [PubMed]
  12. Zhang, P.; Wu, J.; Xiao, F.; Zhao, D.; Luan, Y. Disulfide bond based polymeric drug carriers for cancer chemotherapy and relevant redox environments in mammals. Med. Res. Rev. 2018, 38, 1485–1510. [Google Scholar] [CrossRef] [PubMed]
  13. Radowski, M.R.; Shukla, A.; Von Berlepsch, H.; Böttcher, C.; Pickaert, G.; Rehage, H.; Haag, R. Supramolecular Aggregates of Dendritic Multishell Architectures as Universal Nanocarriers. Angew. Chem. Int. Ed. 2007, 46, 1265–1269. [Google Scholar] [CrossRef] [PubMed]
  14. Kurniasih, I.N.; Keilitz, J.; Haag, R. Dendritic nanocarriers based on hyperbranched polymers. Chem. Soc. Rev. 2015, 44, 4145–4164. [Google Scholar] [CrossRef] [Green Version]
  15. Etrych, T.; Kovář, L.; Šubrt, V.; Braunová, A.; Pechar, M.; Chytil, P.; Říhova, B.; Ulbrich, K. High-molecular-weight Polymers Containing Biodegradable Disulfide Bonds: Synthesis and In Vitro Verification of Intracellular Degradation. J. Bioact. Compat. Polym. 2010, 25, 5–26. [Google Scholar] [CrossRef]
  16. De Vries, W.C.; Grill, D.; Tesch, M.; Ricker, A.; Nüsse, H.; Klingauf, J.; Studer, A.; Gerke, V.; Ravoo, B.J. Reversible Stabilization of Vesicles: Redox-Responsive Polymer Nanocontainers for Intracellular Delivery. Angew. Chem. Int. Ed. 2017, 56, 9603–9607. [Google Scholar] [CrossRef]
  17. Xia, J.; Du, Y.; Huang, L.; Chaurasiya, B.; Tu, J.; Webster, T.J.; Sun, C. Redox-responsive micelles from disulfide bond-bridged hyaluronic acid-tocopherol succinate for the treatment of melanoma. Nanomed. Nanotechnol. Biol. Med. 2018, 14, 713–723. [Google Scholar] [CrossRef]
  18. Roller, S.; Zhou, H.; Haag, R. High-loading polyglycerol supported reagents for Mitsunobu- and acylation-reactions and other useful polyglycerol derivatives. Mol. Divers. 2005, 9, 305–316. [Google Scholar] [CrossRef]
  19. Semple, J.E.; Sullivan, B.; Vojkovsky, T.; Sill, K. Synthesis and facile end-group quantification of functionalized PEG azides. J. Polym. Sci. Part A Polym. Chem. 2016, 54, 2888–2895. [Google Scholar] [CrossRef]
  20. Elbert, D.L.; Hubbell, J.A. Conjugate Addition Reactions Combined with Free-Radical Cross-Linking for the Design of Materials for Tissue Engineering. Biomacromolecules 2001, 2, 430–441. [Google Scholar] [CrossRef]
  21. Belser, T.; Stöhr, M.; Pfaltz, A. Immobilization of Rhodium Complexes at Thiolate Monolayers on Gold Surfaces: Catalytic and Structural Studies. J. Am. Chem. Soc. 2005, 127, 8720–8731. [Google Scholar] [CrossRef] [PubMed] [Green Version]
  22. Mangold, C.; Dingels, C.; Obermeier, B.; Frey, H.; Wurm, F.R. PEG-based Multifunctional Polyethers with Highly Reactive Vinyl-Ether Side Chains for Click-Type Functionalization. Macromolecules 2011, 44, 6326–6334. [Google Scholar] [CrossRef]
  23. Niederer, K.; Schüll, C.; Leibig, D.; Johann, T.; Frey, H. Catechol Acetonide Glycidyl Ether (CAGE): A Functional Epoxide Monomer for Linear and Hyperbranched Multi-Catechol Functional Polyether Architectures. Macromolecules 2016, 49, 1655–1665. [Google Scholar] [CrossRef]
  24. Unbehauen, M.; Fleige, E.; Paulus, F.; Schemmer, B.; Mecking, S.; Moré, S.D.; Haag, R. Biodegradable Core–Multishell Nanocarriers: Influence of Inner Shell Structure on the Encapsulation Behavior of Dexamethasone and Tacrolimus. Polymers 2017, 9, 316. [Google Scholar] [CrossRef] [PubMed] [Green Version]
  25. Harfield, J.C.; Batchelor-McAuley, C.; Compton, R.G. Electrochemical determination of glutathione: A review. Analyst 2012, 137, 2285–2296. [Google Scholar] [CrossRef] [PubMed]
  26. Swain, J.; Mishra, A.K. Nile red fluorescence for quantitative monitoring of micropolarity and microviscosity of pluronic F127 in aqueous media. Photochem. Photobiol. Sci. 2016, 15, 1400–1407. [Google Scholar] [CrossRef] [PubMed]
  27. Schafer, F.Q.; Buettner, G.R. Redox environment of the cell as viewed through the redox state of the glutathione disulfide/glutathione couple. Free. Radic. Biol. Med. 2001, 30, 1191–1212. [Google Scholar] [CrossRef]
  28. Comini, M.A. Measurement and meaning of cellular thiol:disufhide redox status. Free. Radic. Res. 2016, 50, 246–271. [Google Scholar] [CrossRef]
  29. Khutoryanskiy, V.V.; Tirelli, N. Oxidation-responsiveness of nanomaterials for targeting inflammatory reactions. Pure Appl. Chem. 2008, 80, 1703–1718. [Google Scholar] [CrossRef]
  30. D’Arcy, R.; Burke, J.; Tirelli, N. Branched polyesters: Preparative strategies and applications. Adv. Drug Deliv. Rev. 2016, 107, 60–81. [Google Scholar] [CrossRef]
  31. Herzberger, J.; Fischer, K.; Leibig, D.; Bros, M.; Thiermann, R.; Frey, H. Oxidation-Responsive and “Clickable” Poly(ethylene glycol) via Copolymerization of 2-(Methylthio)ethyl Glycidyl Ether. J. Am. Chem. Soc. 2016, 138, 9212–9223. [Google Scholar] [CrossRef] [PubMed] [Green Version]
  32. Page, S.M.; Martorella, M.; Parelkar, S.; Kosif, I.; Emrick, T. Disulfide Cross-Linked Phosphorylcholine Micelles for Triggered Release of Camptothecin. Mol. Pharm. 2013, 10, 2684–2692. [Google Scholar] [CrossRef] [Green Version]
  33. Ko, N.R.; Oh, J.K. Glutathione-Triggered Disassembly of Dual Disulfide Located Degradable Nanocarriers of Polylactide-Based Block Copolymers for Rapid Drug Release. Biomacromolecules 2014, 15, 3180–3189. [Google Scholar] [CrossRef] [PubMed]
  34. Delmas, T.; Fraichard, A.; Bayle, P.-A.; Texier, I.; Bardet, M.; Baudry, J.; Bibette, J.; Couffin, A.-C. Encapsulation and Release Behavior from Lipid Nanoparticles: Model Study with Nile Red Fluorophore. J. Colloid Sci. Biotechnol. 2012, 1, 16–25. [Google Scholar] [CrossRef]
  35. Zabihi, F.; Koeppe, H.; Achazi, K.; Hedtrich, S.; Haag, R. One-Pot Synthesis of Poly(glycerol-co-succinic acid) Nanogels for Dermal Delivery. Biomacromolecules 2019, 20, 1867–1875. [Google Scholar] [CrossRef] [PubMed]
  36. Du, F.; Hönzke, S.; Neumann, F.; Keilitz, J.; Chen, W.; Ma, N.; Hedtrich, S.; Haag, R. Development of biodegradable hyperbranched core-multishell nanocarriers for efficient topical drug delivery. J. Control. Release 2016, 242, 42–49. [Google Scholar] [CrossRef]
  37. Stefánsson, E.; Loftsson, T. Microspheres and Nanotechnology for Drug Delivery. In Retinal Pharmacotherapy; Nguyen, Q.D., Ed.; Saunders/Elsevier: Maryland Heights, MO, USA, 2010; pp. 86–90. ISBN 978-1-4377-0603-1. [Google Scholar]
  38. Gholizadeh, S.; Visweswaran, G.R.R.; Storm, G.; Hennink, W.E.; Kamps, J.A.; Kok, R.J. E-selectin targeted immunoliposomes for rapamycin delivery to activated endothelial cells. Int. J. Pharm. 2018, 548, 759–770. [Google Scholar] [CrossRef]
  39. Ben-Dror, S.; Bronshtein, I.; Wiehe, A.; Röder, B.; Senge, M.O.; Ehrenberg, B. On the Correlation Between Hydrophobicity, Liposome Binding and Cellular Uptake of Porphyrin Sensitizers. Photochem. Photobiol. 2006, 82, 695–701. [Google Scholar] [CrossRef]
Scheme 1. Synthesis of redox-sensitive CMS (rsCMS) 1a and non-redox sensitive nanocarrier (ccCMS) 1b. The following conditions were used: (i) NEt3, MsCl, CH2Cl2, 0 °C– room temperature (r.t.), 17 h, (ii) NH3 (25%) aq, 2 d, (iii) NaOH, I2, KI, MeOH, 17 h, r.t., (iv) PEG750-NH2, bulk, high vacuum, 120 °C, 3 h, (v) (1) N-hydroxysuccinimide, ethyl(dimethylaminopropyl)carbodiimide, 2-Morpholinoethanesulfonic acid pH 6, 0 °C, r.t. (2) hPG-NH2, 24 h, r.t.
Pharmaceutics 13 00037 sch001
Figure 1. Cyclic voltammetric measurement of rsCMS 1a in dry DMSO at a scan rate of 100 mV/s, three rounds.
Pharmaceutics 13 00037 g001
Figure 2. Kinetics of stimulus-triggered release of Nile red (NR) from rsCMS 1a measured with fluorescence spectroscopy over 24 h; NR release was followed by fluorescence intensity decay at NR emission maximum wavelength.
Pharmaceutics 13 00037 g002
Figure 3. Penetration of ccCMS 1b and rsCMS 1a nanocarriers in ex vivo human skin and delivery of the loaded dye meso-tetra (m-hydroxyphenyl) porphyrin (mTHPP). (A) Representative images of skin sections from rsCMS 1a and ccCMS 1b nanocarrier-treated samples. Bars = 50 µm. (B) Summary of the mean fluorescence intensity (MFI) and standard errors from three different donors (d1-d3). Statistical analysis was performed to compare rsCMS 1a values with those of ccCMS 1b nanocarriers in the same skin layers. The stars show significant differences (* p < 0.05; ** p < 0.01; *** p < 0.001).
Pharmaceutics 13 00037 g003
Table 1. Characterization data for redox and control CMS nanocarriers.
CMSMn, Theor. 1 (g/mol)Mn, NMR 2 (g/mol)DF, NMR 2
(%)
Mn, GPC 3 (g/mol)PDI 3DH, vol 4
(nm)
PDI 4
rsCMS 1a118.6 kDa106 kDa8962.7 kDa1.19.30.6
ccCMS 1b112.5 kDa75 kDa6748.5 kDa1.114.30.5
1 Assuming 100% conversion; 2 determined via 1H NMR; 3 determined via Gel permeation chromatography (GPC), polydispersity index (PDI) = Mn/Mw; 4 determined via dynamic light scattering (DLS), PDI = (std dev/mean)2.
Table 2. Redox potentials of tris (2 carboxyethyl)-phosphine (TCEP) and glutathione (GSH), disulfide 6a and rsCMS 1a.
PotentialTCEPGSHDisulfide 6arsCMS 1a
Reduction potential 1−1.65 V−0.75 V−0.55 V−0.51 V
Oxidation potential 1Not detectable−0.65 V−0.38 V−0.26 V
Redox potential 2−1.62 V−0.70 V−0.51 V−0.44 V
1 Measured through cyclic voltammetry; 2 measured through differential pulse voltammetry (DPV) measurements.
Table 3. Drug loading content (DLC) of rapamycin, mTHPP and Pheophorbide A (PhA) by rsCMS 1a and ccCMS 1b.
DrugLog PMn (g/mol)DLC in rsCMS 1aDLC in ccCMS 1b
Dexamethasone1.8 [37]392.462 wt% 12 wt% 1
NR3–5 [34]318.371 wt% 11 wt% 1
Rapamycin4.3 [38]914.173 wt% 12 wt% 1
mTHPP~10–12 [39]678.731 wt% 1, 2 wt% 21 wt% 1, 3 wt% 2
PhA~10–12 [39]592.682 wt% 1, 6 wt% 32 wt% 1, 6 wt% 3
1 Horn sonication of carrier–drug solution for 2 min; 2 horn sonication of carrier–drug solution for 5 min; 3 stirring the carrier–drug solution for 17 h with acetone in water.
Publisher’s Note: MDPI stays neutral with regard to jurisdictional claims in published maps and institutional affiliations.

