Article

Population Pharmacokinetics of Continuous-Infusion Meropenem in Febrile Neutropenic Patients with Hematologic Malignancies: Dosing Strategies for Optimizing Empirical Treatment against Enterobacterales and P. aeruginosa

1
Department of Medicine, University of Udine, 33100 Udine, Italy
2
Institute of Clinical Pharmacology, Santa Maria della Misericordia University-Hospital of Udine, Azienda Sanitaria Universitaria Friuli Centrale (ASUFC), 33100 Udine, Italy
3
Division of Haematology, Santa Maria della Misericordia University-Hospital of Udine, Azienda Sanitaria Universitaria Friuli Centrale (ASUFC), 33100 Udine, Italy
*
Author to whom correspondence should be addressed.
Pharmaceutics 2020, 12(9), 785; https://doi.org/10.3390/pharmaceutics12090785
Submission received: 15 July 2020 / Revised: 10 August 2020 / Accepted: 17 August 2020 / Published: 19 August 2020

Abstract

:
A population pharmacokinetic analysis of continuous infusion (CI) meropenem was conducted in a prospective cohort of febrile neutropenic (FN) patients with hematologic malignancies. A non-parametric approach with Pmetrics was used for pharmacokinetic analysis and covariate evaluation. Monte Carlo simulations were performed for identifying the most appropriate dosages for empirical treatment against common Enterobacterales and P. aeruginosa. The probability of target attainment (PTA) of steady-state meropenem concentration (Css)-to-minimum inhibitory concentration (MIC) ratio (Css/MIC) ≥1 and ≥4 at the European Committee on Antimicrobial Susceptibility Testing (EUCAST) clinical breakpoint of 2 mg/L were calculated. Cumulative fraction of response (CFR) against Enterobacterales and P. aeruginosa were assessed as well. PTAs and CFRs ≥ 90% were considered optimal. A total of 61 patients with 178 meropenem Css were included. Creatinine clearance (CLCR) was the only covariate associated with meropenem clearance. Monte Carlo simulations showed that dosages of meropenem ranging between 1 g q8h and 1.25 g q6h by CI may grant optimal PTAs of Css/MIC ≥4 at the EUCAST clinical breakpoint. Optimal CFRs may be granted with these dosages against the Enterobacterales at Css/MIC ≥ 4 and against P. aeruginosa at Css/MIC ≥ 1. When dealing against P. aeruginosa at Css/MIC ≥ 4, only a dosage of 1.5 g q6h by CI may grant quasi-optimal CFR (around 80–87%). In conclusion, our findings suggest that dosages of meropenem ranging between 1 g q8h and 1.25 g q6h by CI may maximize empirical treatment against Enterobacterales and P. aeruginosa among FN patients with hematologic malignancies having different degree of renal function.

1. Introduction

Patients with hematologic malignancies when suffering from febrile neutropenia (FN) may be at increased risk of developing bacterial infectious complications. Bloodstream infections (BSI) are among the most common and severe ones, with prevalence rates ranging between 11 and 38% [1]. During the last decade, Gram-negative bacteria have become the most prevalent etiological agents of BSI in patients with hematologic malignancies. Two large European epidemiologic studies showed that Gram-negatives accounted for 49–52.6% of BSIs and Gram-positives for 41–46.6% of cases [2,3]. Escherichia coli, Klebsiella pneumoniae, Enterobacter cloacae and Pseudomonas aeruginosa are the most common Gram-negative isolates [3]. Decreased antimicrobial susceptibility is increasingly reported among these pathogens and may represent a worrisome concern in the clinical management of these infections [4]. The overall susceptibility rates of Gram-negatives isolated from patients with hematologic malignancies were 69.8% to cephalosporins, 79.1% to piperacillin/tazobactam and 63.1% to meropenem [3].
Current guidelines recommend an antipseudomonal beta-lactam, such as piperacillin/tazobactam, cefepime or ceftazidime, as first-line choice for empirical treatment of FN patients with hematologic malignancies. Escalation to meropenem is suggested in the absence of a clinical response within 48–72 h [5,6].
Meropenem is a beta-lactam antibiotic whose effect is achieved by the duration of time the serum concentration of the antibiotic is above the minimum inhibitory concentration of the microorganism (time above MIC). This effect is maximally achieved when the concentration of meropenem exceeds the MIC for at least 40% of the dosing interval [7].
However, when dealing with severe infections in immunocompromised hosts and/or in critically ill patients, a more conservative pharmacodynamic target of efficacy up to 100% t > 4–6 × MIC is highly advocated both for maximizing efficacy [8,9] and for preventing the development of breakthrough resistance as well [10]. Administration by continuous infusion (CI) may be helpful in attaining higher pharmacodynamic targets with meropenem in the empirical treatment of FN patients [11].
The aim of this study was to conduct a population pharmacokinetic analysis of CI meropenem in FN patients with hematologic malignancies and to identify dosing strategies that may be helpful in maximizing efficacy and in preventing resistance development in the empirical treatment of Gram-negative infections with meropenem.

2. Materials and Methods

2.1. Study Design

Data for this analysis came from a recent prospective, monocentric, interventional study that assessed the role of real-time therapeutic drug monitoring (TDM)-based optimization of CI meropenem in improving treatment outcome among FN patients with hematologic malignancies [12].
In brief, after starting treatment with fixed meropenem dosing regimen (1 g loading dose over 30 min followed by a maintenance dose of 1 g q8h CI over 8 h if creatinine clearance (CLCR) ≥ 60 mL/min/1.73 m2 or 0.5 g q6h CI over 6 h if CLCR < 60 mL/min/1.73 m2), patients underwent real-time TDM finalized at achieving meropenem steady-state plasma concentrations (Css) of 8–16 mg/L [13] (namely a Css/MIC ratio of 4–8 fold the EUCAST clinical breakpoint of 2 mg/L against Enterobacterales and P. aeruginosa). TDM was first assessed on days 2–3 and then reassessed every 48–72 h until the end of treatment. Stability of CI meropenem was granted by reconstitution of the aqueous solution every 6–8 h with infusion over 6–8 h [14].
Peripheral blood samples were drawn at each TDM assessment, and meropenem concentrations were analyzed by means of a validated high-performance liquid chromatography (HPLC) method [15] with some modifications, as previously described [13,16]. Precision and accuracy were assessed by replicate analysis of quality control samples against calibration standards. Intra- and inter-assay coefficient of variation was always <10%. The lowest limit of detection was 0.5 mg/L.
Patient clinical data (age, gender, weight, height, type of hematologic disease, type and site of infection) were recorded at baseline. Serum creatinine was collected at each TDM assessment, and CLCR was estimated by means of the Chronic Kidney Disease Epidemiology (CKD-EPI) formula [17]. Patient outcome was defined at end of treatment as cured (when all the following occurred: fever disappearance for >48 h, microbiologically eradication with negative cultures in at least two subsequent assessments (in case of documented infection), no radiological signs of infections, no change of antimicrobial therapy) or failed.

2.2. Population Pharmacokinetic Modelling

Population pharmacokinetic analysis was conducted using the non-parametric adaptive grid (NPAG) approach and the algebraic model solver included in the Pmetrics package(version 1.5.0; Laboratory of Applied Pharmacokinetics and Bioinformatics, Los Angeles, CA, USA) of R (version 3.4.4) [18]. A one-compartment base model with zero-order administration and first-order elimination from the central compartment was developed. Pharmacokinetic models with multiple compartments were not tested as we deemed that concentration-time data obtained during continuous-infusion administration did not allow for an accurate estimation of the volume of distribution. Maximum a posteriori (MAP) Bayesian estimates of meropenem clearance (CL) and volume of distribution (V) were determined in each patient.
Influence of covariates was assessed by including the biologically plausible clinical covariates (age, height, weight, gender, CLCR) into the basic model. The degree of association between each covariate and the median MAP Bayesian estimates of meropenem pharmacokinetic parameters was assessed by means of linear regression and of the forward/backward elimination. Variability in the continuous covariates included in the final model was considered by splitting each covariate distribution into homogenuous classes according to the frequency observed in the study population. Covariates were normally distributed within each class and centered around their mean ± SD.
Comparisons of the performances of the models were evaluated by calculating the objective function value (OFV), as well as the Akaike information criteria (AIC) and the Bayesian information criteria (BIC). A decrease of at least 3.84 points in the OFV coupled with a decrease of the AIC and the BIC values were considered for adding the covariates into the basic model.
The goodness of fit and the coefficient of determination of the linear regression of the observed versus the population predicted and individual predicted plot were considered for defining the final population pharmacokinetic model. Internal model validation was performed by means of a visual predictive check (VPC) and by calculating the normalized prediction distribution errors (NPDE). The VPC plot is based on 1000 simulations per each subject in the original population, and by overlaying the observed plasma concentrations with the 95% CIs of the simulated 5th, 25th, 50th, 75th and 95th percentiles. NPDE were calculated for providing a quantitative assessment of the final model. This tool was preferred compared with weighted residual plots because it is considered more reliable for evaluating pharmacokinetic model including covariates [19]. The distribution of NPDEs should be normal in the presence of appropriateness of model fit.
Assay error in the population model was estimated by means of the inter-day variability of laboratory assay data. A first-order polynomial relationship between drug concentrations and the standard deviation of the observations was used (C0 = 0.224, C1 = 0.060). Extra process noise was captured with a gamma (G) model (G = 5).

2.3. Monte Carlo Simulation Analysis and Probability of Target Attainment

One-thousand subject Monte Carlo simulations for each of six incremental dosing regimens of CI meropenem (0.25 g q6h CI, 0.5 g q6h CI, 1 g q8h CI, 1 g q6h CI, 1.25 g q6h CI and 1.5 g q6h CI) were conducted by means of Pmetrics. Meropenem Css were simulated at 48 h. The objective was that of assessing the probability of target attainment (PTA) of a Css/MIC ratio ≥1 and/or ≥4 at the EUCAST clinical breakpoint (2 mg/L) against the most common Enterobacterales and Pseudomonas aeruginosa. PTAs of ≥90% were considered as optimal for maximizing the efficacy of empirical treatment with meropenem in FN patients with hematologic malignancies.
The cumulative fraction of response (CFR) achievable with the tested CI meropenem dosages was calculated against the EUCAST MIC distributions for E.coli, K. pneumoniae, E. cloacae and P. aeruginosa [20]. CFRs ≥ 90% were considered as optimal.

2.4. Ethics

This study was approved by the Ethics Review Board of the Friuli-Venezia-Giulia Region (protocol number: 20496/CEUR, approved: 28 July 2017). Written informed consent was obtained from each patient before enrollment.

3. Results

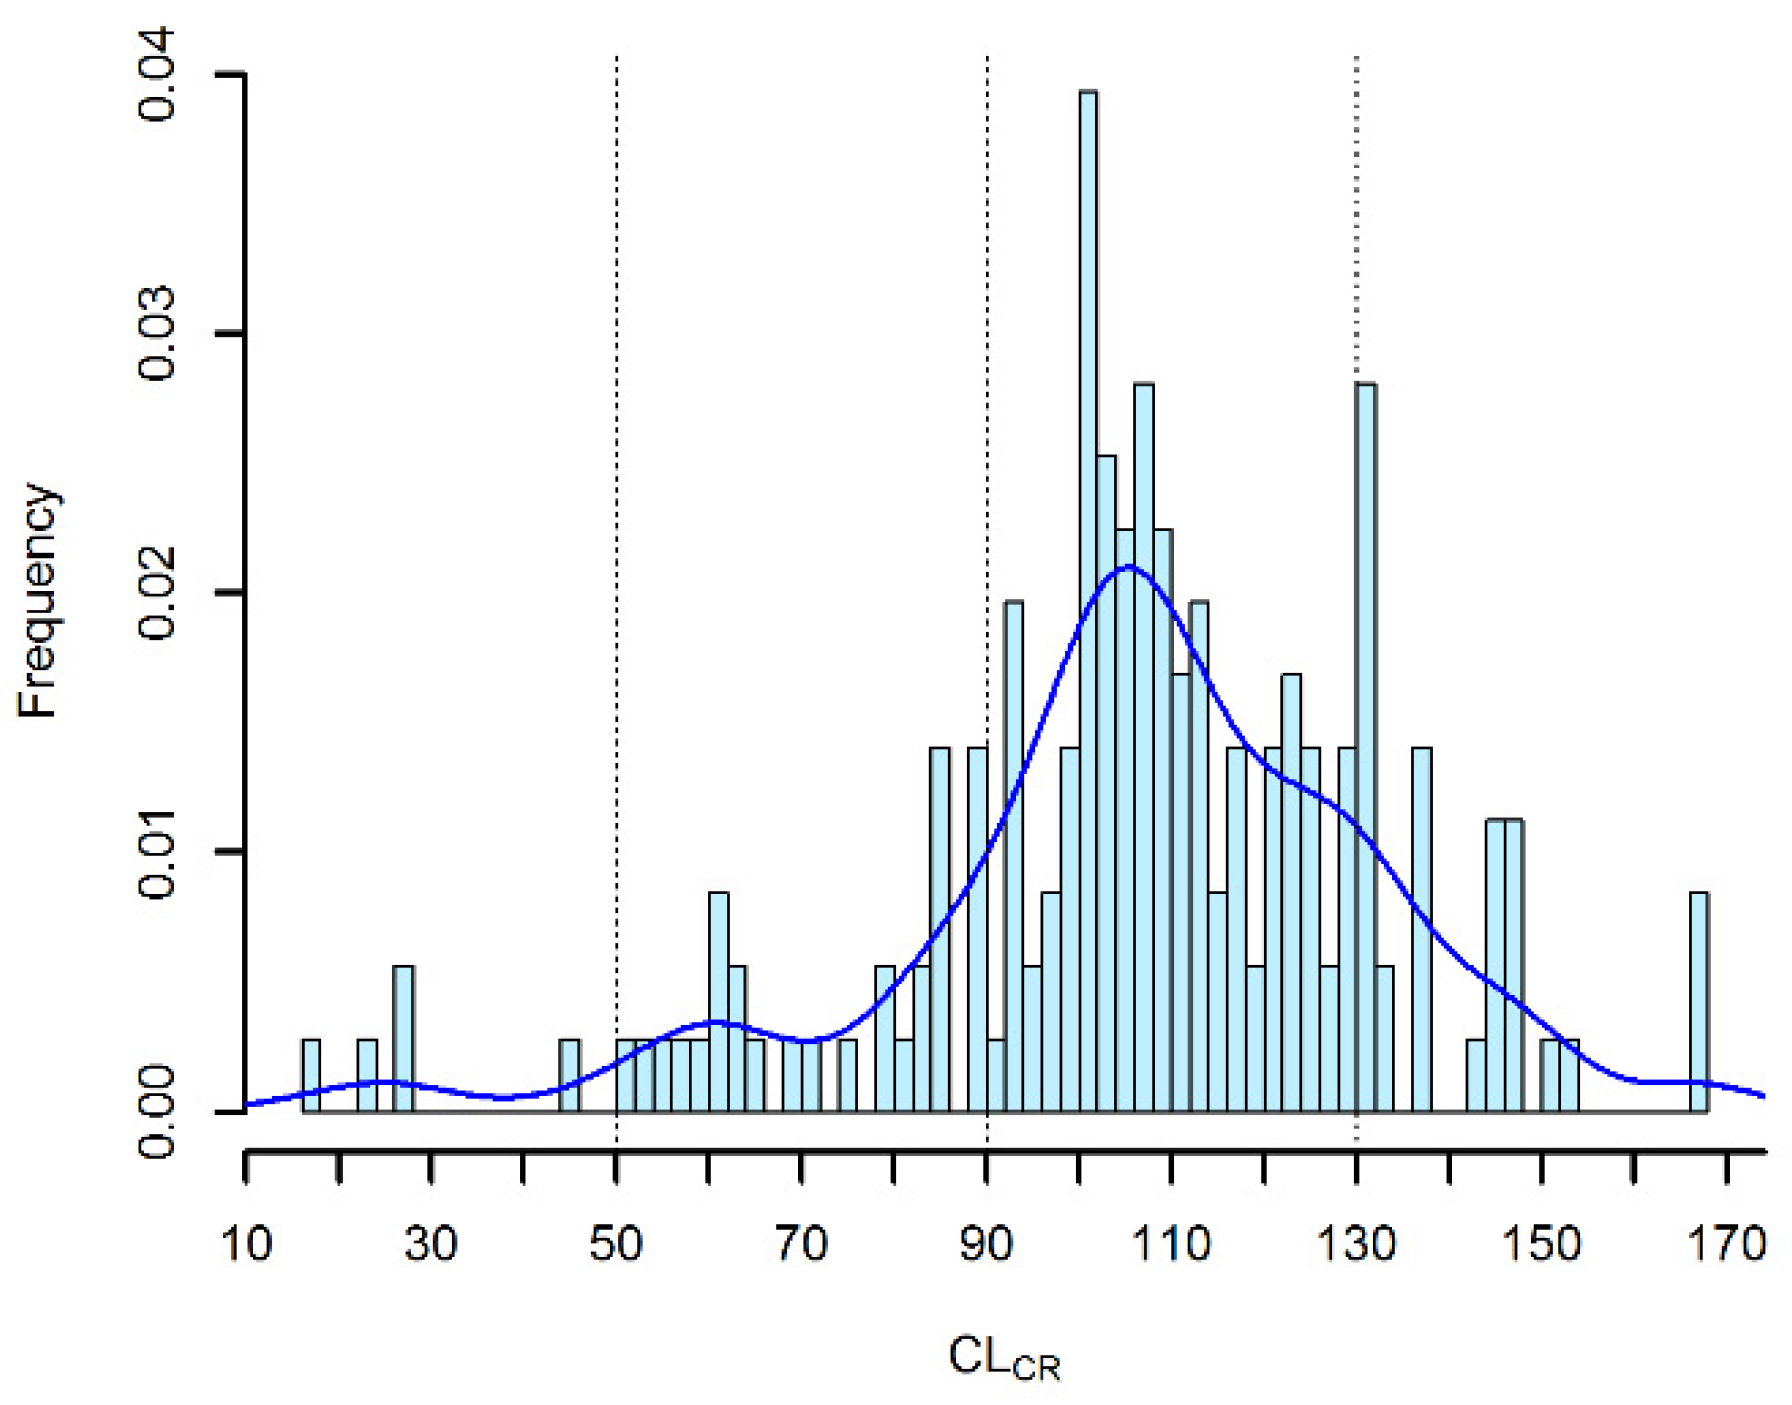
3.1. Patient Population and Meropenem Therapy

From a total of 100 patients who were enrolled in the prospective clinical study [12], 39 were excluded from this analysis because of the inadequacy of blood sampling. The demographic and clinical characteristics of the 61 definitive patients are summarized in Table 1. Median patient age, weight and CLCR were 55 (IQR 54–60) years, 77 (IQR 63–85) kg and 107.3 (IQR 96.1–123.6) mL/min/1.73 m2, respectively. Acute myeloid leukemia was the most frequent underlying hematological disease (57.4%). Thirty out of 61 patients (49.2%) had clinically documented infections, pneumonia (36.7%) and BSI (33.3%) accounting for most of them. Only seven patients had documented Gram-negative infections. Median CI meropenem dose was of 1 g q8h CI. The median duration of meropenem therapy was nine days (IQR 7–12.3 days) and the median number of TDM assessments per patient was 3 (IQR 3–4). The majority of patients (91.8%) were cured.

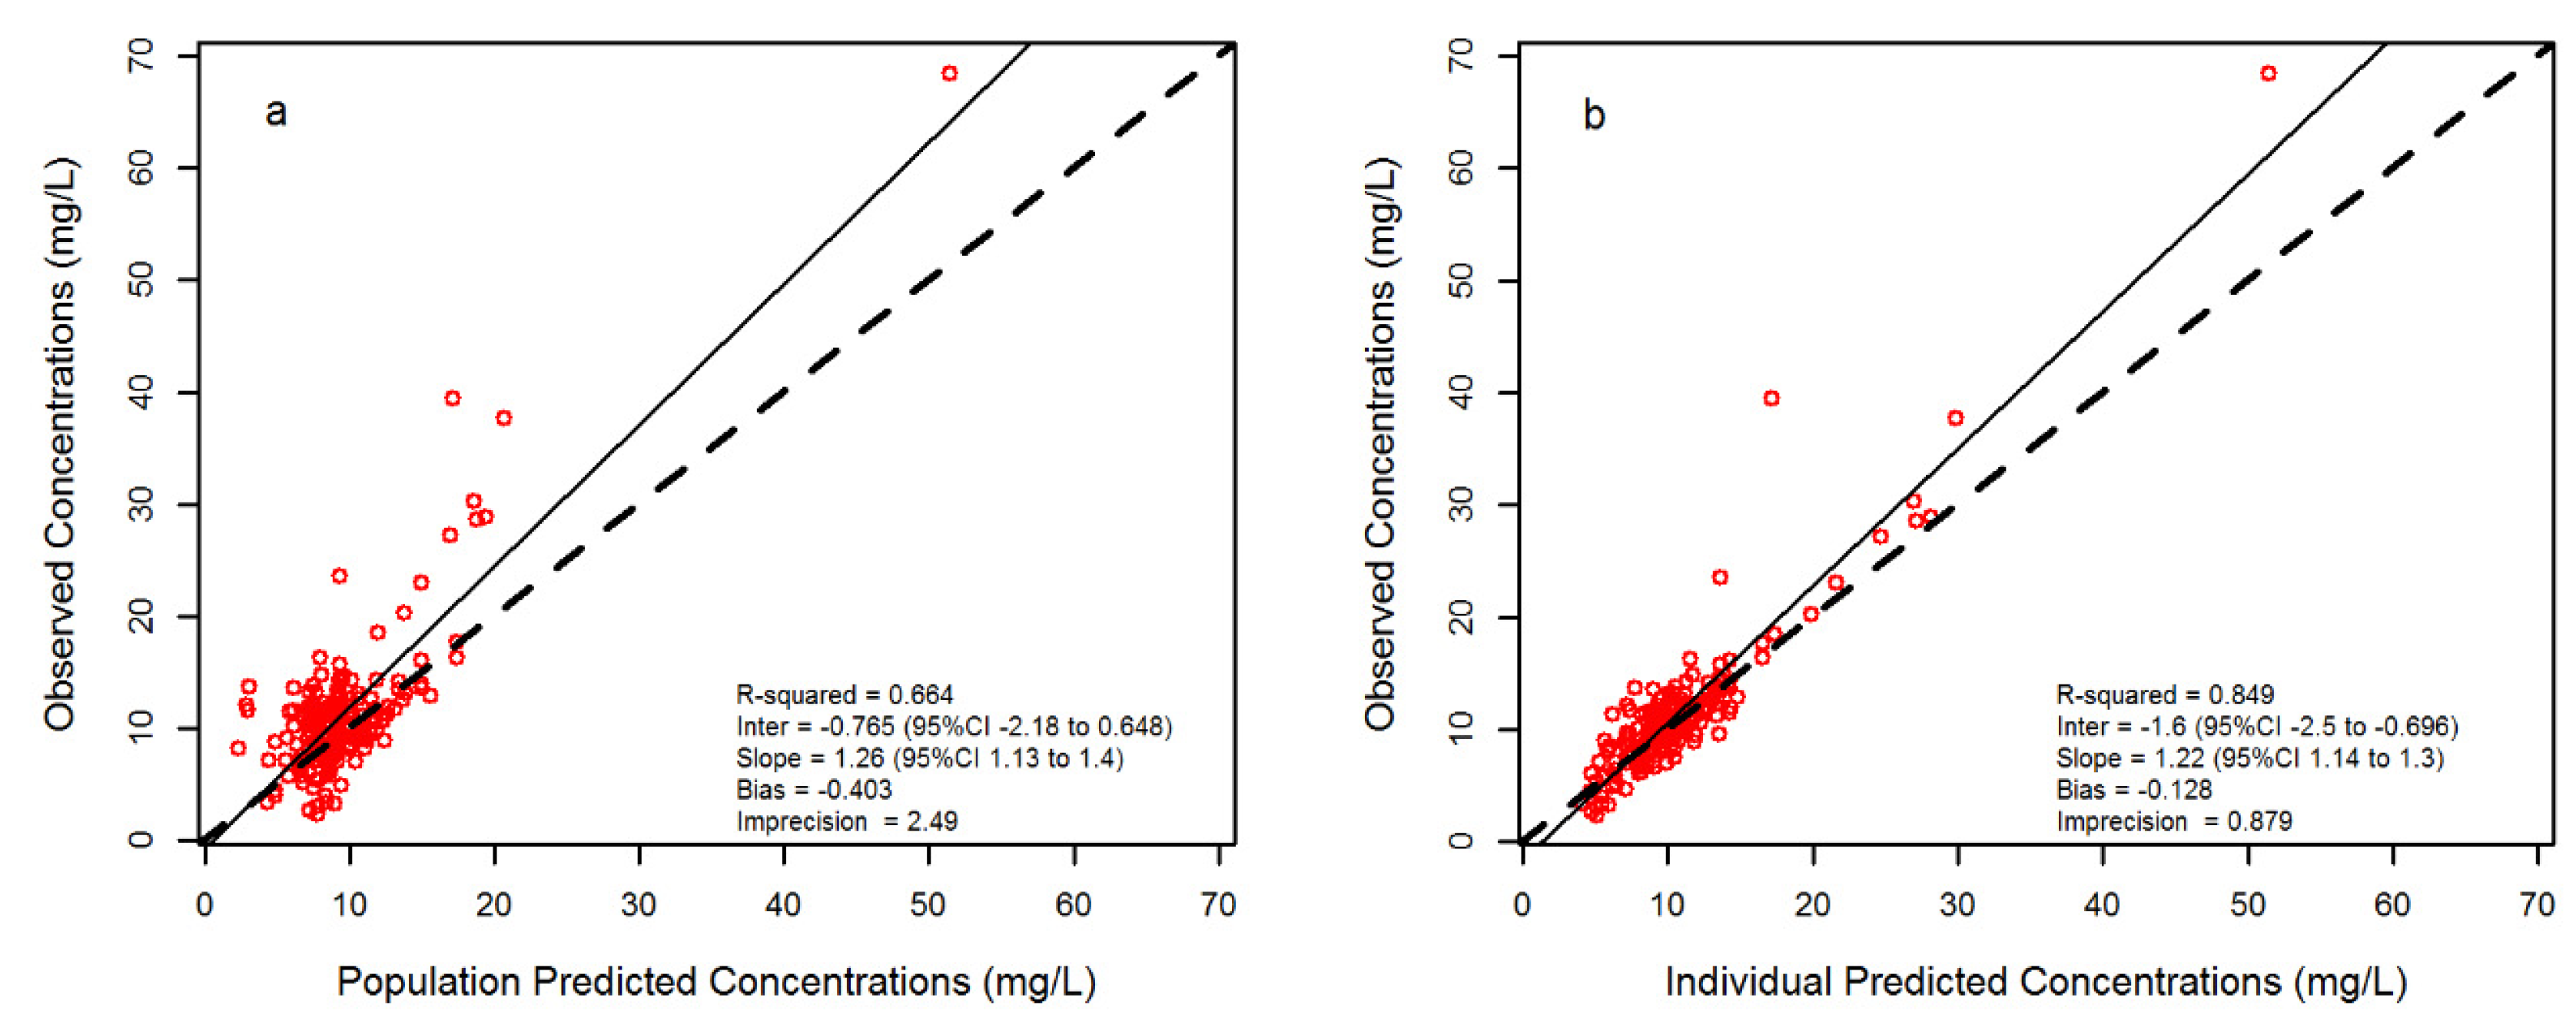
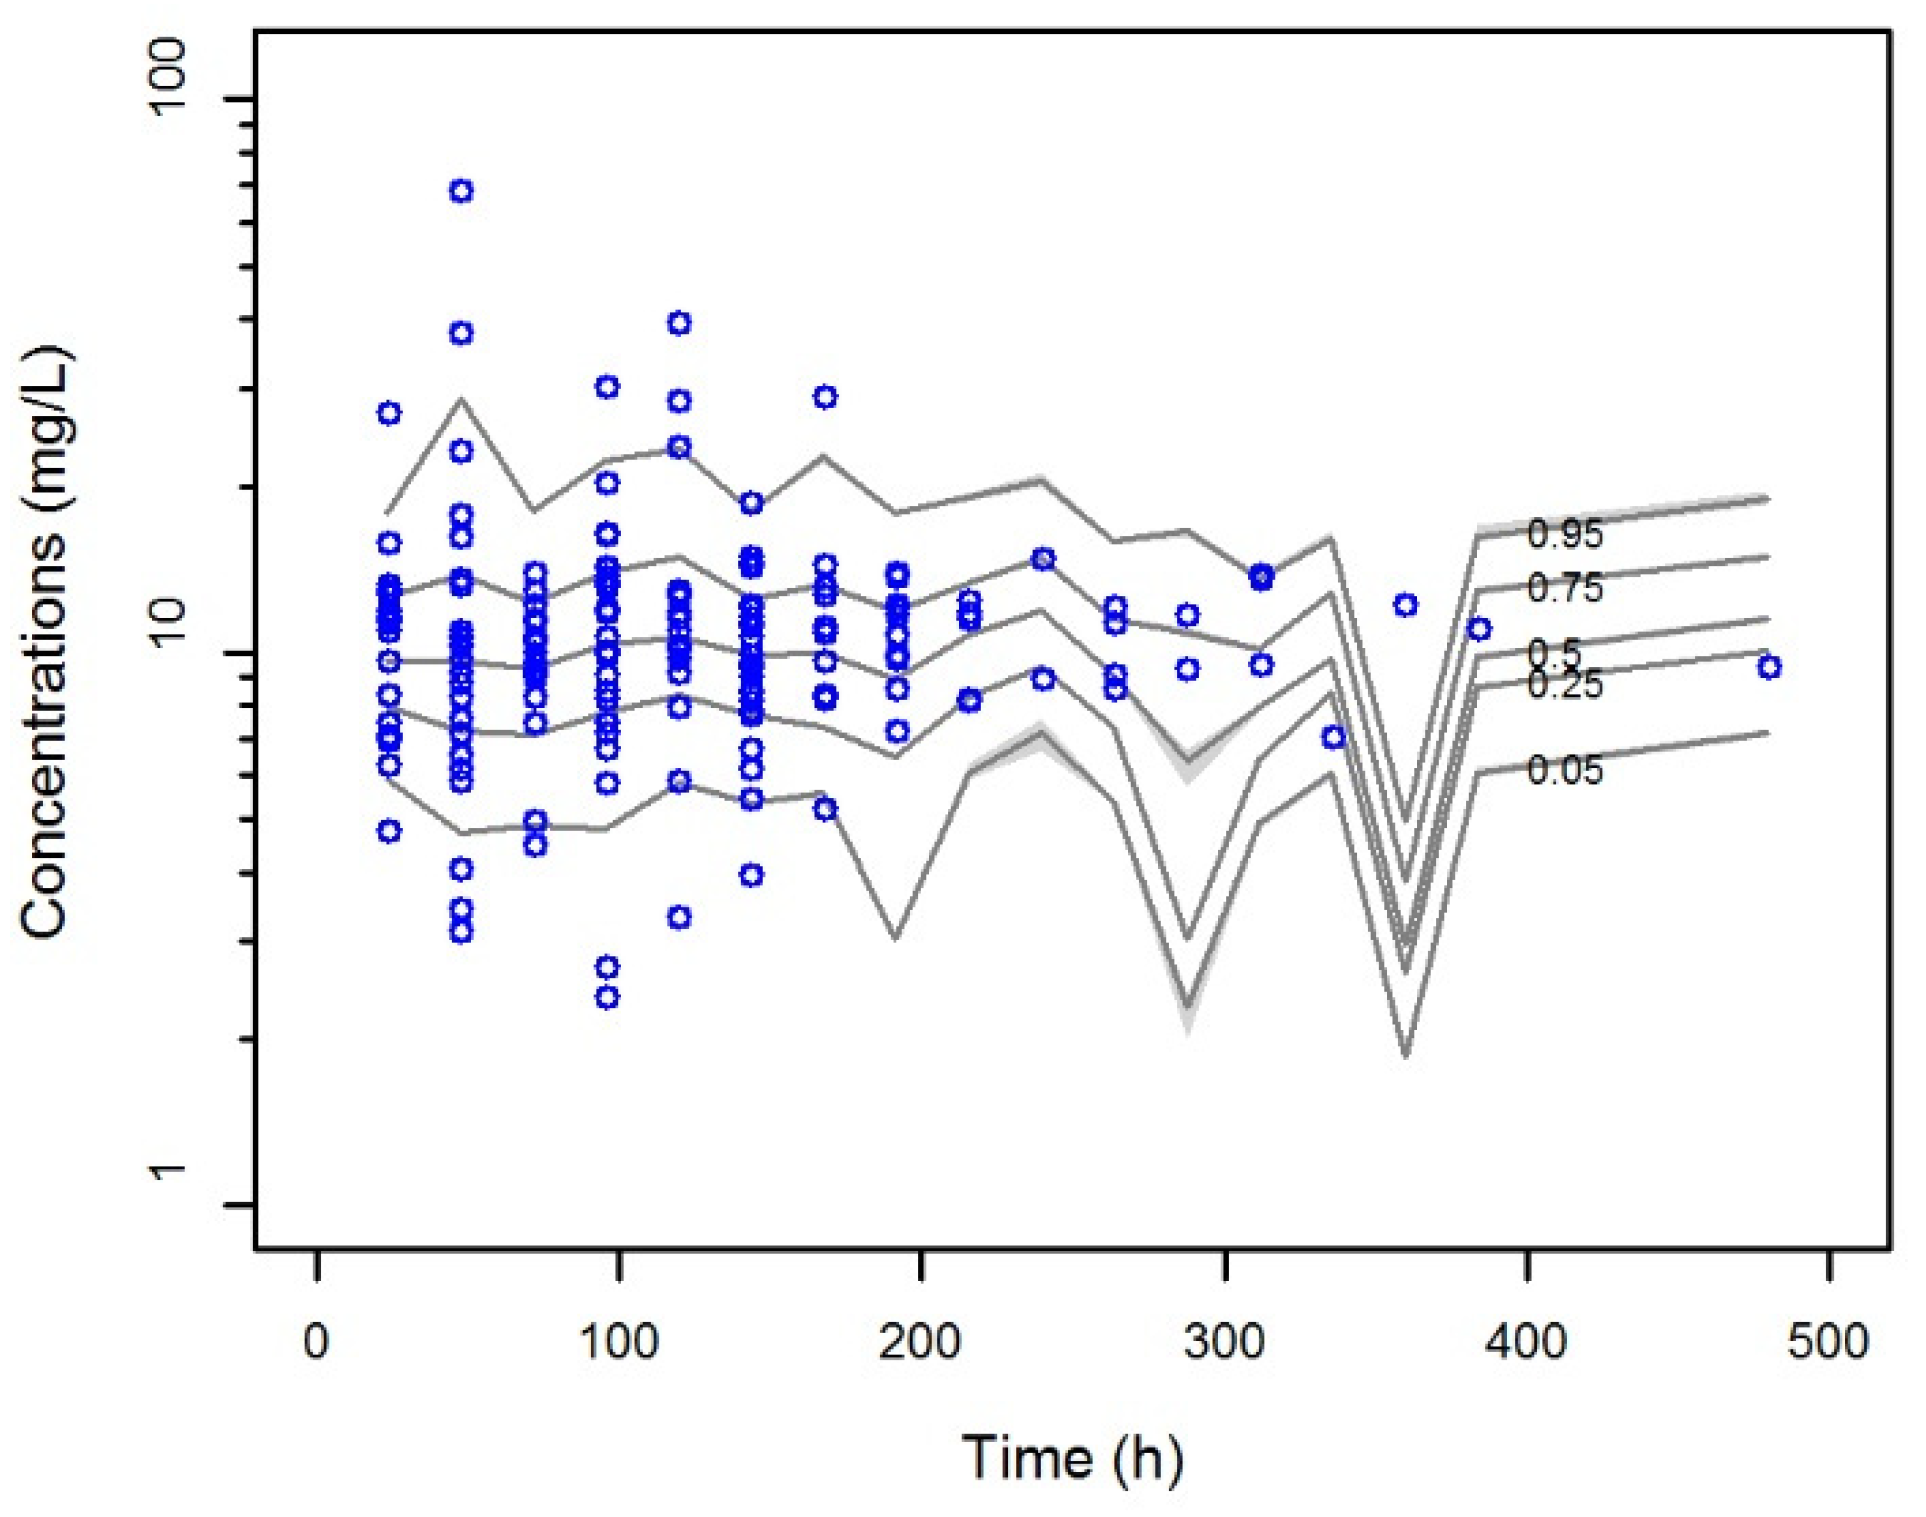
3.2. Population Pharmacokinetic Analysis

A total of 178 plasma meropenem Css were included in the population pharmacokinetic model (median (IQR) value of 10.5 (8.3–10.2) mg/L). The one-compartment base model provided a high fit to the data (R2 of the observed versus predicted concentrations of 0.786), with OFV, BIC and AIC of 928.9, 935 and 944, respectively.
The only covariate significantly associated with meropenem CL was CLCR. After inclusion of CLCR into the base model, the R2 regression value of the observed vs. individual predicted concentrations increased to 0.849, and the values of OFV, BIC and AIC decreased to 874.4, 852 and 895, respectively.
As shown in Figure 1, the individual model-based predictions may be considered appropriate since it deviated from unity essentially in presence of very high concentrations (approximately > 20 mg/L), which represented only a minority of the overall measurements (5.62%). Bias and imprecision were acceptable (−0.128 and 0.879, respectively).
The final model was as follows:
CLi = θ1 + θ2 × CLCRi
where CLi is meropenem clearance of the ith subject, θ1 is the clearance (intercept) when CLCR = 0, θ2 is the slope estimate reflecting the change in clearance per unit change in CLCR, and CLCRi is the creatinine clearance of the ith subject.
The VPC of the final model (Figure 2) showed that 87.6% of the observed concentrations reside within the 95% confidence intervals derived from model predictions. The weighted residuals were normally distributed around zero (p = 0.219 with the Shapiro-Wilk test).
Table 2 summarizes the statistics of the population Bayesian pharmacokinetic parameters obtained with the final covariate model. The mean (±SD) population pharmacokinetic estimates of the final multivariate model were CL = 13.04 (4.85) L/h and V = 21.88 (5.85) L.

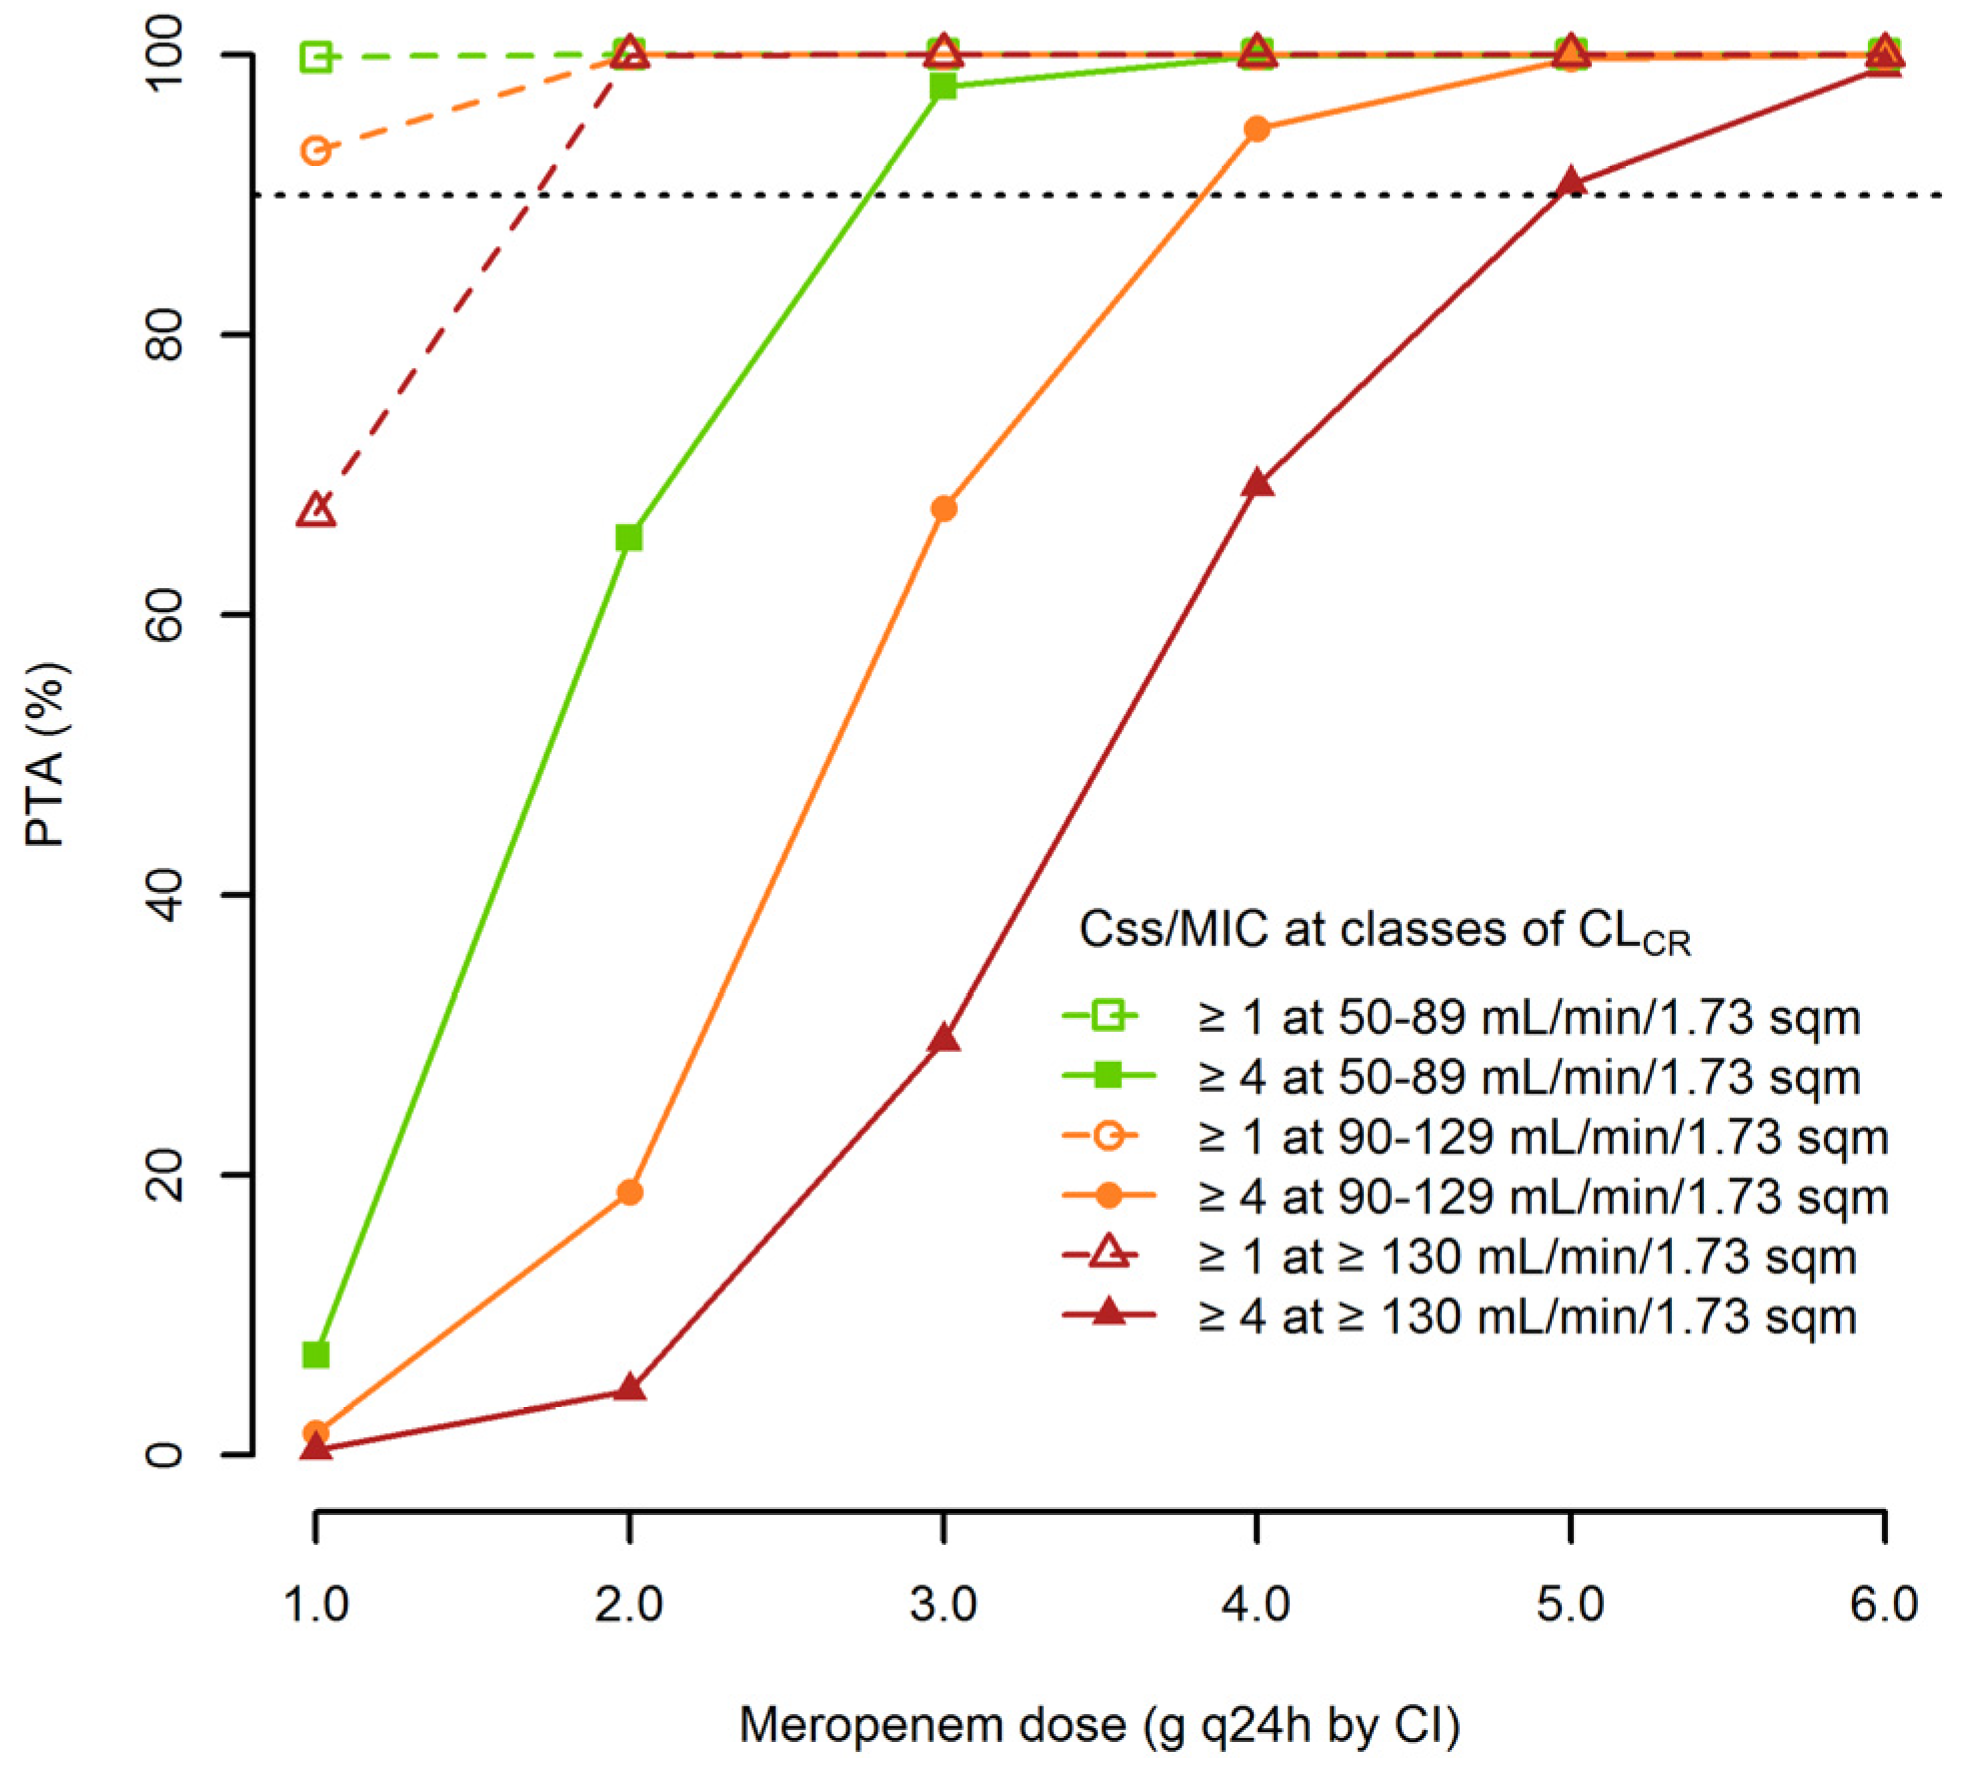
3.3. Monte Carlo Simulation and the Probability of Target Attainment

The frequency of distribution of CLCR observed in our patient population is depicted in Figure 3. Accordingly, 3 different classes of renal function were identified (decreased CLCR (50–89 mL/min/1.73 m2); normal CLCR (90–129 mL/min/1.73 m2); augmented renal clearance (ARC) (CLCR ≥ 130 mL/min/1.73 m2)). On this basis, a total of 18 one-thousand Monte Carlo simultions were conducted in order to test six incremental dosing regimens of CI meropenem (0.25 g q6h CI, 0.5 g q6h CI, 1 g q8h CI, 1 g q6h CI, 1.25 g q6h CI and 1.5 g q6h CI) across these classes of renal function.
Figure 4 shows the PTAs of Css/MIC ≥ 1 and Css/MIC ≥ 4 at the EUCAST clinical breakpoint for Enterobacterales and P. aeruginosa (2 mg/L) achievable with increasing dosages of CI meropenem among the different classes of CLCR. Optimal PTAs of Css/MIC ≥4 were granted by meropenem dosages of 1 g q8h CI, 1 g q6h CI and 1.25 g q6h CI in patients with CLCR of 50–89, 90–129 and ≥130 mL/min/1.73 m2, respectively. Lower dosages (0.25 g q6h CI in patients with CLCR of 50–89 and 90–129 mL/min/1.73 m2, 0.5 g q6h CI in those with ≥130 mL/min/1.73 m2) were sufficient for achieving optimal PTAs of Css/MIC ≥ 1.
The CFRs achievable at Css/MIC of ≥4 and ≥1 against the EUCAST MIC distributions of E. coli, K. pneumoniae, E. cloacae and P. aeruginosa with incremental dosages of CI meropenem in different classes of renal function are summarized in Table 3. Optimal CFRs against E. coli, K. pneumoniae and E. cloacae were granted at Css/MIC ≥4 just with dosing regimen as low as 0.25 g q6h CI in all of the classes of renal function. Optimal CFRs against P. aeruginosa were granted at Css/MIC ≥ 1 with meropenem dosages of 0.5 g q6h CI, 1 g q8h CI and 1 g q6h CI in patients with CLCR of 50–89, 90–129 and ≥130 mL/min/1.73 m2, respectively. Conversely, when targeting at Css/MIC ≥ 4 against P. aeruginosa, only quasi-optimal CFRs, ranging between 87.78 and 81.30% were achievable with the highest dosing regimen of 1.5 g q6h CI across the three classes of CLCR.

4. Discussion

In this study, we conducted a population pharmacokinetic analysis with CI meropenem in FN patients with hematologic malignancies and tested which could be the dosages that are most advisable for empirical treatment against P. aeruginosa.
To the best of our knowledge, this is the first study that assessed the population pharmacokinetics of meropenem in FN patients with hematologic malignancies during administration by CI at different dosages of the drug. The population pharmacokinetics of meropenem was investigated among FN patients with hematologic malignancies during intermittent infusion administration in two previous studies. Overall, our findings are in agreement with their results. Among 57 Korean patients who were treated with a meropenem dose of 0.5 g every 8 h by intermittent infusion and had a mean CLCR of 121 mL/min, the estimates of CL and Vd were 9.7 L/h and 14.6 L, respectively [21]. Ariano et al. found that among 60 bacteremic patients with FN who received a meropenem dose of 1 g every 8 h by intermittent infusion and had a CLCR ranging 97–107 mL/min/1.73 m2, the estimated CL was 15.4 L/h and the Vd was 14.4 L [11].
The association of CLCR with meropenem CL is consistent with meropenem being eliminated mainly by the renal route and is in agreement with previous findings as well.
From the pathophysiological standpoint, FN patients with hematologic malignancies may be considered as a special population. Previous studies showed that some underlying conditions may significantly alter the pharmacokinetic behavior of hydrophilic antibiotics in this population. The renal clearance of the aminoglycosides [22,23], the beta-lactams [24,25] and of daptomycin [26] were shown to be greatly increased in patients with acute leukemia. Noteworthy, as much as 22.9% of our study population had ARC at presentation, namely a condition that may increase meropenem CL. This may cause drug underexposure when standard dosages of meropenem are administered by intermittent infusion.
Extended or continuous infusion administration was shown to be beneficial in attaining the pharmacodynamic target of efficacy with beta-lactams and in improving clinical outcome in the treatment of patients with FN [12,27] and of critically ill patients with severe infections as well [8,28,29]. Additionally, it is worth mentioning that in a recent prospective study focused at targeting meropenem Css/MIC at 4–8 by means of real-time TDM, we showed that this strategy may be helpful in FN patients with hematologic malignancies also in preventing the emergence of carbapenem resistance among Enterobacterales. No colonization by carbapenem-resistant Enterobacterales was found at rectal swabs among all of the patients (63) who were re-hospitalized within 3-months after meropenem treatment [12].
The need for high-dose regimens of meropenem by CI has been previously advocated for the treatment of severe infections in various settings [30,31,32]. Monte Carlo simulations showed that dosages of meropenem ranging between 1 g q8h and 1.25 g q6h by CI may maximize empirical treatment against Enterobacterales and P. aeruginosa among FN patients with hematologic malignancies and different degree of renal function. These dosages are reliable for achieving optimal PTAs of Css/MIC ≥ 4 against all of the bacterial strains that are susceptible to meropenem according to the EUCAST clinical breakpoint (≤2 mg/L). Additionally, they may grant optimal CFRs against the Enterobacterales at Css/MIC ≥ 4 and against P.aeruginosa at Css/MIC ≥ 1. When dealing against P. aeruginosa at Css/MIC ≥ 4, these dosages may be suboptimal, and only a dosage of 1.5 g q6h by CI may grant quasi-optimal CFR (around 80–87%) in all of the three classes of renal function. This is due to the fact that around 20% of the P. aeruginosa strains may have MIC > 2 mg/L according to the EUCAST MIC distribution [20] and are therefore considered carbapenem-resistant in vitro. When dealing with meropenem-resistant P. aeruginosa isolates, real-time TDM may allow optimization of meropenem treatment [12]. Alternatively, switch to other anti-pseudomonal agents, like ceftolozane-tazobactam, should be considered.
We acknowledge some limits of this study. The limited number of TDM assessments per patient and estimated, rather than measured, renal function might account for some unexplained variability in the population pharmacokinetic model. However, the prospective design and the large sample size are valuable strengths of this study.
In conclusion, our findings suggest that dosages of meropenem ranging between 1 g q8h and 1.25 g q6h by CI may maximize empirical treatment against Enterobacterales and P. aeruginosa among FN patients with hematologic malignancies and different degree of renal function. Real-time TDM may represent a valuable tool for appropriately targeting meropenem Css in patients with ARC and/or with borderline susceptible P. aeruginosa strains.

Author Contributions

P.G.C., A.C. and D.L. performed the analysis and drafted the manuscript; D.L., C.F. and M.Z. acquired and interpreted clinical data; A.C., R.F. and F.P. conceptualized and supervised the project and reviewed the entire contents of the manuscript. All authors have read and agree to the published version of the manuscript.

Funding

This research received no external funding.

Conflicts of Interest

A.C. has received honoraria from and has been a speaker for Pfizer, Gilead, Merck, Celgene and Jenssen; F.P. participated in speaker bureau for Angelini, Basilea Pharmaceutica Gilead, Hikma, Merck Sharp and Dohme, Nordic Pharma, Pfizer and Sanofi Aventis, and in the advisory board for Angelini, Basilea Pharmaceutica, Correvio, Gilead, Merck Sharp and Dohme, Nordic Pharma, Novartis, Pfizer and Thermo–Fisher. All other authors: no conflict of interest. Companies had no role in the design of the study; in the collection, analyses, or interpretation of data; in the writing of the manuscript, or in the decision to publish the results.

References

  1. Tumbarello, M.; Trecarichi, E.M.; Caira, M.; Candoni, A.; Pastore, D.; Cattaneo, C.; Fanci, R.; Nosari, A.; Spadea, A.; Busca, A.; et al. Derivation and validation of a scoring system to identify patients with bacteremia and hematological malignancies at higher risk for mortality. PLoS ONE 2012, 7, e51612. [Google Scholar] [CrossRef] [PubMed]
  2. Gudiol, C.; Bodro, M.; Simonetti, A.; Tubau, F.; Gonzalez-Barca, E.; Cisnal, M.; Domingo-Domenech, E.; Jimenez, L.; Carratala, J. Changing aetiology, clinical features, antimicrobial resistance, and outcomes of bloodstream infection in neutropenic cancer patients. Clin. Microbiol. Infect. 2013, 19, 474–479. [Google Scholar] [CrossRef] [PubMed] [Green Version]
  3. Trecarichi, E.M.; Pagano, L.; Candoni, A.; Pastore, D.; Cattaneo, C.; Fanci, R.; Nosari, A.; Caira, M.; Spadea, A.; Busca, A.; et al. Current epidemiology and antimicrobial resistance data for bacterial bloodstream infections in patients with hematologic malignancies: An Italian multicentre prospective survey. Clin. Microbiol. Infect. 2015, 21, 337–343. [Google Scholar] [CrossRef] [PubMed] [Green Version]
  4. Garcia-Vidal, C.; Cardozo-Espinola, C.; Puerta-Alcalde, P.; Marco, F.; Tellez, A.; Aguero, D.; Romero-Santana, F.; Diaz-Beya, M.; Gine, E.; Morata, L.; et al. Risk factors for mortality in patients with acute leukemia and bloodstream infections in the era of multiresistance. PLoS ONE 2018, 13, e0199531. [Google Scholar] [CrossRef]
  5. Heinz, W.J.; Buchheidt, D.; Christopeit, M.; von Lilienfeld-Toal, M.; Cornely, O.A.; Einsele, H.; Karthaus, M.; Link, H.; Mahlberg, R.; Neumann, S.; et al. Diagnosis and empirical treatment of fever of unknown origin (FUO) in adult neutropenic patients: Guidelines of the Infectious Diseases Working Party (AGIHO) of the German Society of Hematology and Medical Oncology (DGHO). Ann. Hematol. 2017, 96, 1775–1792. [Google Scholar] [CrossRef] [Green Version]
  6. Schmidt-Hieber, M.; Teschner, D.; Maschmeyer, G.; Schalk, E. Management of febrile neutropenia in the perspective of antimicrobial de-escalation and discontinuation. Expert Rev. Anti Infect. Ther. 2019, 17, 983–995. [Google Scholar] [CrossRef]
  7. Ellis, J.M.; Kuti, J.L.; Nicolau, D.P. Use of Monte Carlo simulation to assess the pharmacodynamics of beta-lactams against Pseudomonas aeruginosa infections in children: A report from the OPTAMA program. Clin. Ther. 2005, 27, 1820–1830. [Google Scholar] [CrossRef]
  8. Yu, Z.; Pang, X.; Wu, X.; Shan, C.; Jiang, S. Clinical outcomes of prolonged infusion (extended infusion or continuous infusion) versus intermittent bolus of meropenem in severe infection: A meta-analysis. PLoS ONE 2018, 13, e0201667. [Google Scholar] [CrossRef]
  9. Wong, G.; Brinkman, A.; Benefield, R.J.; Carlier, M.; De Waele, J.J.; El Helali, N.; Frey, O.; Harbarth, S.; Huttner, A.; McWhinney, B.; et al. An international, multicentre survey of beta-lactam antibiotic therapeutic drug monitoring practice in intensive care units. J. Antimicrob. Chemother. 2014, 69, 1416–1423. [Google Scholar] [CrossRef] [Green Version]
  10. Sumi, C.D.; Heffernan, A.J.; Lipman, J.; Roberts, J.A.; Sime, F.B. What Antibiotic Exposures Are Required to Suppress the Emergence of Resistance for Gram-Negative Bacteria? A Systematic Review. Clin. Pharmacokinet. 2019, 58, 1407–1443. [Google Scholar] [CrossRef]
  11. Ariano, R.E.; Nyhlen, A.; Donnelly, J.P.; Sitar, D.S.; Harding, G.K.M.; Zelenitsky, S.A. Pharmacokinetics and pharmacodynamics of meropenem in febrile neutropenic patients with bacteremia. Ann. Pharmacother. 2005, 39, 32–38. [Google Scholar] [CrossRef]
  12. Cojutti, P.G.; Lazzarotto, D.; Candoni, A.; Dubbini, M.V.; Zannier, M.E.; Fanin, R.; Pea, F. Real-time TDM-based optimization of continuous infusion meropenem for improving treatment outcome of febrile neutropenia in oncohematologic patients: Results from a prospective, monocentric, interventional study (in press). J. Antimicrob. Chemother. 2020, dkaa267. [Google Scholar] [CrossRef] [PubMed]
  13. Pea, F.; Viale, P.; Cojutti, P.; Furlanut, M. Dosing nomograms for attaining optimum concentrations of meropenem by continuous infusion in critically ill patients with severe gram-negative infections: A pharmacokinetics/pharmacodynamics-based approach. Antimicrob. Agents Chemother. 2012, 56, 6343–6348. [Google Scholar] [CrossRef] [PubMed] [Green Version]
  14. Franceschi, L.; Cojutti, P.; Baraldo, M.; Pea, F. Stability of generic meropenem solutions for administration by continuous infusion at normal and elevated temperatures. Ther. Drug Monit. 2014, 36, 674–676. [Google Scholar] [CrossRef] [PubMed]
  15. Mendez, A.S.L.; Steppe, M.; Schapoval, E.E.S. Validation of HPLC and UV spectrophotometric methods for the determination of meropenem in pharmaceutical dosage form. J. Pharm. Biomed. Anal. 2003, 33, 947–954. [Google Scholar] [CrossRef]
  16. Cojutti, P.; Maximova, N.; Pea, F. Pharmacokinetics and pharmacodynamics of continuous-infusion meropenem in pediatric hematopoietic stem cell transplant patients. Antimicrob. Agents Chemother. 2015, 59, 5535–5541. [Google Scholar] [CrossRef] [Green Version]
  17. Levey, A.S.; Stevens, L.A.; Schmid, C.H.; Zhang, Y.L.; Castro 3rd, A.F.; Feldman, H.I.; Kusek, J.W.; Eggers, P.; Van Lente, F.; Greene, T.; et al. A new equation to estimate glomerular filtration rate. Ann. Intern. Med. 2009, 150, 604–612. [Google Scholar] [CrossRef]
  18. Neely, M.N.; van Guilder, M.G.; Yamada, W.M.; Schumitzky, A.; Jelliffe, R.W. Accurate detection of outliers and subpopulations with Pmetrics, a nonparametric and parametric pharmacometric modeling and simulation package for R. Ther. Drug Monit. 2012, 34, 467–476. [Google Scholar] [CrossRef] [Green Version]
  19. Brendel, K.; Comets, E.; Laffont, C.; Laveille, C.; Mentre, F. Metrics for external model evaluation with an application to the population pharmacokinetics of gliclazide. Pharm. Res. 2006, 23, 2036–2049. [Google Scholar] [CrossRef] [Green Version]
  20. The European Committee on Antimicrobial Susceptibility Testing-EUCAST. Available online: https://www.eucast.org/mic_distributions_and_ecoffs (accessed on 16 June 2020).
  21. Lee, D.-G.; Choi, S.-M.; Shin, W.-S.; Lah, H.-O.; Yim, D.-S. Population pharmacokinetics of meropenem in febrile neutropenic patients in Korea. Int. J. Antimicrob. Agents 2006, 28, 333–339. [Google Scholar] [CrossRef] [PubMed] [Green Version]
  22. Zeitany, R.G.; El Saghir, N.S.; Santhosh-Kumar, C.R.; Sigmon, M.A. Increased aminoglycoside dosage requirements in hematologic malignancy. Antimicrob. Agents Chemother. 1990, 34, 702–708. [Google Scholar] [CrossRef] [PubMed] [Green Version]
  23. Romano, S.; Fdez de Gatta, M.M.; Calvo, M.V.; Caballero, D.; Dominguez-Gil, A.; Lanao, J.M. Population pharmacokinetics of amikacin in patients with haematological malignancies. J. Antimicrob. Chemother. 1999, 44, 235–242. [Google Scholar] [CrossRef] [PubMed]
  24. Pea, F.; Viale, P.; Damiani, D.; Pavan, F.; Cristini, F.; Fanin, R.; Furlanut, M. Ceftazidime in acute myeloid leukemia patients with febrile neutropenia: Helpfulness of continuous intravenous infusion in maximizing pharmacodynamic exposure. Antimicrob. Agents Chemother. 2005, 49, 3550–3553. [Google Scholar] [CrossRef] [PubMed] [Green Version]
  25. Lamoth, F.; Buclin, T.; Csajka, C.; Pascual, A.; Calandra, T.; Marchetti, O. Reassessment of recommended imipenem doses in febrile neutropenic patients with hematological malignancies. Antimicrob. Agents Chemother. 2009, 53, 785–787. [Google Scholar] [CrossRef] [PubMed] [Green Version]
  26. Cojutti, P.G.; Candoni, A.; Ramos-Martin, V.; Lazzarotto, D.; Zannier, M.E.; Fanin, R.; Hope, W.; Pea, F. Population pharmacokinetics and dosing considerations for the use of daptomycin in adult patients with haematological malignancies. J. Antimicrob. Chemother. 2017, 72, 2342–2350. [Google Scholar] [CrossRef]
  27. Feher, C.; Rovira, M.; Soriano, A.; Esteve, J.; Martinez, J.A.; Marco, F.; Carreras, E.; Martinez, C.; Fernandez-Aviles, F.; Suarez-Lledo, M.; et al. Effect of meropenem administration in extended infusion on the clinical outcome of febrile neutropenia: A retrospective observational study. J. Antimicrob. Chemother. 2014, 69, 2556–2562. [Google Scholar] [CrossRef] [Green Version]
  28. Abdul-Aziz, M.H.; Lipman, J.; Akova, M.; Bassetti, M.; De Waele, J.J.; Dimopoulos, G.; Dulhunty, J.; Kaukonen, K.-M.; Koulenti, D.; Martin, C.; et al. Is prolonged infusion of piperacillin/tazobactam and meropenem in critically ill patients associated with improved pharmacokinetic/pharmacodynamic and patient outcomes? An observation from the Defining Antibiotic Levels in Intensive care unit patients (DALI) cohort. J. Antimicrob. Chemother. 2016, 71, 196–207. [Google Scholar]
  29. Lorente, L.; Lorenzo, L.; Martin, M.M.; Jimenez, A.; Mora, M.L. Meropenem by continuous versus intermittent infusion in ventilator-associated pneumonia due to gram-negative bacilli. Ann. Pharmacother. 2006, 40, 219–223. [Google Scholar] [CrossRef]
  30. Taccone, F.S.; Cotton, F.; Roisin, S.; Vincent, J.-L.; Jacobs, F. Optimal meropenem concentrations to treat multidrug-resistant Pseudomonas aeruginosa septic shock. Antimicrob. Agents Chemother. 2012, 56, 2129–2131. [Google Scholar] [CrossRef] [Green Version]
  31. Cojutti, P.G.; Barbarino, C.; De Monte, A.; Hope, W.; Pea, F. Higher than standard meropenem and linezolid dosages needed for appropriate treatment of an intracerebral hemorrhage patient with augmented renal clearance. Eur. J. Clin. Pharmacol. 2018, 74, 1091–1092. [Google Scholar] [CrossRef]
  32. Cojutti, P.; Sartor, A.; Righi, E.; Scarparo, C.; Bassetti, M.; Pea, F. Population Pharmacokinetics of High-Dose Continuous-Infusion Meropenem and Considerations for Use in the Treatment of Infections Due to KPC-Producing Klebsiella pneumoniae. Antimicrob. Agents Chemother. 2017, 61, e00794-17. [Google Scholar] [CrossRef] [Green Version]
Figure 1. Scatter and linear fit plot for the final population pharmacokinetic model. Observed versus population-predicted plasma concentrations (a) and observed versus individual-predicted plasma concentrations (b). Solid lines are the lines of regression between observed and predicted concentrations. Dashed lines are the lines of identity. Red rings are meropenem concentrations.
Pharmaceutics 12 00785 g001
Figure 2. Visual predictive check (VPC) of meropenem concentration versus time for the final covariate model. Gray shadings display predicted interval of simulated data. Blue dots represent observed concentrations.
Pharmaceutics 12 00785 g002
Figure 3. Histogram and kernel density plot of the distribution of patients’ creatinine clearance (CLCR).
Pharmaceutics 12 00785 g003
Figure 4. Probability of target attainments (PTAs) of Css/MIC ≥ 4 (solid lines) and Css/MIC ≥ 1 (dashed lines) at the EUCAST clinical breakpoint of 2 mg/L against Enterobacterales and P. aeruginosa with incremental dosages of continuous infusion meropenem in relation to different classes of CLCR. Horizontal broken line identifies the threshold for optimal PTA (≥90%).
Pharmaceutics 12 00785 g004
Table 1. Patient characteristics.
Patient demographics
Total number of patients61
Age (years)55 (54–60)
Gender (male/female)37/24
Body weight (kg)77 (63–85)
CLCR (mL/min/1.73 m2)107.3 (96.1–123.6)
Patients with ARC14 (22.9)
Underlying hematological disease
AML35 (57.4)
Lymphoma12 (19.7)
ALL11 (18.0)
MM3 (4.9)
Clinically documented infections
Overall30 (49.2)
Pneumonia11 (18.0)
BSI10 (16.4)
Intra-abdominal infection5 (8.2)
SSTI2 (3.4)
UTI1 (1.6)
Septic shock1 (1.6)
Gram-negative isolates
Escherichia coli5 (8.2)
Klebsiella pneumonia1 (1.6)
Pseudomonas aeruginosa1 (1.6)
Meropenem treatment
Median dose (g)1 g q8h CI (1 g q8h CI–1 g q8h CI)
Length of treatment (days)9 (7–12.3)
No. of TDM assessments per patient3 (3–4)
Meropenem Css (mg/L)10.5 (8.3–10.2)
Clinical outcome
Cured56 (91.8)
Failed5 (8.2)
Data are presented as median (IQR) for continuous variables, and as number (%) for dichotomous variables. ALL, acute lymphocytic leukemia; AML, acute myeloid leukemia; ARC, augmented renal clearance (defined as CLCR ≥ 130 mL/min/1.73 m2); BSI, blood stream infection; CLCR, creatinine clearance; MM, multiple myeloma; SSTI, skin and soft tissue infection; TDM, therapeutic drug monitoring; UTI, urinary tract infection.
Table 2. Parameter estimates of meropenem for the final covariate one-compartment population pharmacokinetic model.
ParameterMeanStandard DeviationCoefficient of Variation (%)Median
CLi (L/h) = θ1 + θ2 × CLCRi
θ10.270.1348.530.20
θ20.120.0327.440.13
V (L)21.885.8526.7120.00
θ1 and θ2 are the intercept and slope, respectively, of the linear relationship between meropenem clearance of the ith subject (CLi) and creatinine clearance of the ith subject (CLCRi) estimated by means of the CKD-EPI formula; V, volume of distribution.
Table 3. Cumulative fraction of response (CFR) achievable at Css/MIC of ≥4 and ≥1 against the EUCAST MIC distributions of E. coli, K. pneumoniae, E. cloacae and P. aeruginosa with incremental dosages of CI meropenem in different classes of renal function.
CI-Meropenem Dosages at Classes of Renal Function E. coliK. pneumoniaeE. cloacaeP. aeruginosa
Css/MIC ≥ 4Css/MIC ≥ 1Css/MIC ≥ 4Css/MIC ≥ 1Css/MIC ≥ 4Css/MIC ≥ 1Css/MIC ≥ 4Css/MIC ≥ 1
CLCR: 50–89 mL/min/1.73 m2
0.25 g q6h CI99.9299.9799.0499.6498.7999.5865.8384.14
0.5 g q6h CI99.9699.9899.4099.8099.3399.7576.7190.11
1 g q8h CI99.9799.9799.5599.8899.5099.8681.4193.72
1 g q6h CI99.97100.0099.6499.9399.5799.9284.0896.15
1.25 g q6h CI99.98100.0099.7099.9699.6399.9586.1397.74
1.5 g q6h CI99.9100.0099.7599.9899.6899.9787.7898.57
CLCR: 90–129 mL/min/1.73 m2
0.25 g q6h CI99.8699.9698.7299.5298.2499.4656.7680.12
0.5 g q6h CI99.9599.9899.2399.7299.0999.6571.2586.71
1 g q8h CI99.9699.9899.4199.8199.3499.7676.9190.21
1 g q6h CI99.9699.9999.5299.8699.4699.8380.2092.59
1.25 g q6h CI99.9799.9999.5899.9099.5399.8882.2894.47
1.5 g q6h CI99.97100.0099.6499.9399.5799.9284.2196.30
CLCR: ≥130 mL/min/1.73 m2
0.25 g q6h CI99.8099.9698.4399.4197.6299.3348.9076.66
0.5 g q6h CI99.9299.9799.0599.6498.8199.5766.2084.17
1 g q8h CI99.9599.9999.2899.7499.1799.6777.9187.62
1 g q6h CI99.9699.9999.4199.8199.3499.7576.8790.14
1.25 g q6h CI99.9699.9999.4999.8599.4499.8179.6092.13
1.5 g q6h CI99.9799.9999.5599.8899.4999.8581.3093.59
CLCR, creatinine clearance; CI, continuous infusion.

