Next Article in Journal
Subset Analysis for Screening Drug–Drug Interaction Signal Using Pharmacovigilance Database
Next Article in Special Issue
Combination Delivery of Alpha-Tocopheryl Succinate and Curcumin Using a GSH-Sensitive Micelle (PAH-SS-PLGA) to Treat Pancreatic Cancer
Previous Article in Journal
Progestogens Are Metabolized by the Gut Microbiota: Implications for Colonic Drug Delivery
Previous Article in Special Issue
Micro/Nanorobot: A Promising Targeted Drug Delivery System
 
 
Retraction published on 23 January 2024, see Pharmaceutics 2024, 16(2), 156.
Article

RETRACTED: Thymoquinone-Loaded Soy-Phospholipid-Based Phytosomes Exhibit Anticancer Potential against Human Lung Cancer Cells

1
Department of Pharmaceutics, Faculty of Pharmacy, King Abdulaziz University, Jeddah 21589, Saudi Arabia
2
Advanced Drug Delivery Research Group, Faculty of Pharmacy, King Abdulaziz University, Jeddah 21589, Saudi Arabia
3
Center of Excellence for Drug Research and Pharmaceutical Industries, King Abdulaziz University, Jeddah 21589, Saudi Arabia
4
Department of Pharmaceutics and Industrial Pharmacy, Faculty of Pharmacy, Cairo University, Cairo 11562, Egypt
5
Department of Pharmaceutics, College of Pharmacy, Jouf University, Sakaka, Al-Jouf 2014, Saudi Arabia
6
Department of Clinical Biochemistry, Faculty of Medicine, King Abdulaziz University, Jeddah 21589, Saudi Arabia
7
Oasi Research Institute—IRCCS, Via Conte Ruggero, 73, 94018 Troina (EN), Italy
8
Department of Natural Products and Alternative Medicine, Faculty of Pharmacy, King Abdulaziz University, Jeddah 21589, Saudi Arabia
9
Department of Pharmaceutics, College of Pharmacy, King Saud University, P.O. Box 2457, Riyadh 11451, Saudi Arabia
10
General Surgery KAUH, King Abdulaziz University Hospital, Jeddah 21589, Saudi Arabia
*
Author to whom correspondence should be addressed.
Pharmaceutics 2020, 12(8), 761; https://doi.org/10.3390/pharmaceutics12080761
Submission received: 19 July 2020 / Revised: 6 August 2020 / Accepted: 7 August 2020 / Published: 12 August 2020 / Retracted: 23 January 2024
(This article belongs to the Special Issue Nanocarriers for Drug Delivery Systems)

Abstract

:
Thymoquinone (TQ), a natural polyphenol, has been associated with various pharmacological responses; however, low bioavailability of TQ limits its clinical application. Thus, a novel phytosomal delivery system of TQ-Phospholipon® 90H complex (TQ-phytosome) was developed by refluxing combined with anti-solvent precipitation. This TQ delivery system was optimized by a three-factor, three-level Box-Behnken design. The optimized TQ-phytosome size was (45.59 ± 1.82 nm) and the vesicle size was confirmed by transmission electron microscopy. The in vitro release pattern of the formulation indicated a biphasic release pattern, where an initial burst release was observed within 2 h, followed by a prolonged release. A remarkable increase in dose-dependent cytotoxicity was evident from the significant decrease in IC50 value of TQ-phytosomes (4.31 ± 2.21 µM) against the A549 cell line. The differential effect of TQ-phytosomes in cell cycle analysis was observed, where cancer cells were accumulated on G2-M and pre-G1 phases. Furthermore, increased apoptotic induction and cell necrosis of TQ-phytosomes were revealed with the annexin V staining technique via activation of caspase-3. In reactive oxygen species (ROS) analysis, TQ-phytosomes acted to significantly increase ROS generation in A549 cells. In conclusion, the sustained release profile with significantly-improved anticancer potential could be obtained with TQ by this phytosomal nanocarrier platform.

1. Introduction

Lung cancer is among the most frequent and severe cancer types. The early stages of lung cancer typically do not exhibit signs or symptoms. Coughing, weight loss, shortness of breath, and chest pain are the most common symptoms [1,2]. Five-year survival rate for lung cancer (18.6%) is worse than for many other tumor types, such as colorectal (64.5%), breast (89.6%), and prostate (98.2%) [2,3,4]. This makes it the most common cause of cancer-related death in men, and the second-most common cause after breast cancer in women. At diagnosis the most common age is 70 years [5]. The presence of thymoquinone (TQ) has been established in various natural sources comprising therapeutic properties; however, the first identified traditional source was the black seed from Nigella sativa L., used as folk medicine in many tropical countries [6]. The black seed oil has established its traditional use against respiratory disorders and inflammatory conditions and to enhance immunity [7]. The non-toxic nature of this freely-available phytochemical has been investigated widely for the last two decades for its potential role against cancers [8]. The trigger for caspase recruitment involves the promotion of TQ-induced apoptotic potential, whereas upregulation of the proapoptotic proteins (e.g., Bax) and downregulation of antiapoptotic proteins (e.g., BCL-2) are also underlying molecular mechanisms [9]. TQ potentiates the generation of cellular reactive oxygen species (ROS) during a mitochondrial malfunction, which also contributes towards cellular apoptosis [10]. However, several limitations of this promising natural compound prevent translation from laboratory to the clinic. Amongst these limitations, the main one is poor bioavailability, which is due to the low aqueous solubility of the component. Therefore, conventional drug delivery systems could not resolve this issue associated with TQ [11]. Alternatively, poor knowledge on molecular targets of the component also limits its clinical use. Thus, there is an urge to devise a novel drug delivery system to overcome the issues of poor aqueous solubility, and simultaneous evaluation of the underlying molecular mechanism of TQ is necessary. Nanotechnology-based drug delivery tools are emerging to resolve bioavailability issue of poorly soluble drugs [12,13,14]. Approaches have already been made to improve the anticancer efficacy of TQ by incorporating it into different nanocarriers, such as nanoparticles [15,16], liposomes [12], niosomes [13], and nanostructured lipid carriers [14]. Focus on phytosome-based drug delivery is a novel concept, where poorly soluble polyphenolic phytoconstituents are formulated into vesicular dosage form by interacting with phospholipids in an aqueous environment. This novel delivery has shown the potential to improve the oral bioavailability of the active phytoconstituents [17,18]. The concept of phytosomes was first brought into drug delivery in 1991, with the complexation between the phytoconstituent and polar section of the phospholipid due to hydrogen-bonding [19]. However, the two long fatty acid chains in the phospholipid remain free and encapsulate the polar head of the phospholipid-phytoconstituent complex [20]. This complex structure of phytosomes is also known to be of therapeutic benefit due to the phospholipid content [21]. Because of the potential advantages of delivering polyphenolic phytoconstituents, the present study was targeted to deliver TQ using this novel and promising nanocarrier platform, which has not yet been explored for this plant component. Therefore, the phytosome formulation of TQ was optimized using Box-Behnken statistical analysis. Further, extensive analysis of the optimized formulation was performed against A549 cell lines to establish the efficacy and mechanism of action of the TQ-phytosomes in the treatment of lung cancer.

2. Materials and Methods

2.1. Materials

TQ (purity ≥98%), was procured from Sigma-Aldrich Inc. (St. Louis, MO, USA). The phospholipid, Phospholipon® 90H (90% hydrogenated soy phosphatidylcholine), was gifted by Lipoid GmbH (Ludwigshafen, Rhineland-Palatinate, Germany). The rest of the chemicals were of analytical grade.

2.2. Experimental Design and Optimization

Optimization of TQ-phytosome formulations was achieved using three-factor Box-Behnken statistical quality by design technique (Design-Expert software, version 12; Stat-Ease Inc., Minneapolis, MN, USA). This design was used to evaluate the effect of independent formulation variables, such as TQ to phospholipid molar ratio (A), process temperature (°C, B), and reflux time (h, C) on the dependent variable (response) and vesicle size (nm, Y) of the phytosome formulations. The design generated 17 runs with different combinations of the three independent variables at their low (−1), medium (0), and high (+1) levels for optimization of TQ-phytosome formulation as shown in Table 1.
The best-fitting model for the measured response was selected by computing and utilizing predicted and adjusted determination coefficients. Adequate precision was also computed to confirm the suitability of the model. Statistical analysis of measured response was performed using analysis of variance (ANOVA). Interaction between the investigated variables was studied from the generated contour plots. The optimization of process parameters to achieve minimum vesicle size was performed using the numerical method [17].

2.3. Preparation of TQ-phytosomes

Refluxing followed by the anti-solvent precipitation method was used to develop TQ-phytosomes [17]. Based on experimental design data, accurately weighed TQ and Phospholipon® 90H (achieving the specified molar ratio according to the experimental design) were placed in a 100 mL round bottom flask and refluxed with 20 mL dichloromethane. Based on the experimental design data, refluxing was performed at a specific temperature for specified time-period followed by evaporation to around 5 mL. TQ-phytosomes was obtained by lyophilizing the concentrate for 72 h. The developed TQ-phytosomes was stored at 4 °C until further use.

2.4. Fourier-Transform Infrared (FTIR) Spectroscopy Study

Fourier-transform infrared (FTIR) analysis was utilized to investigate the interaction between TQ and Phospholipon® 90H. TQ, Phospholipon® 90H, and optimized TQ-phytosome spectra were measured in the range of 4000–400 cm−1 using an FTIR spectrophotometer (Nicolet IZ 10, Thermo Fisher Scientific, Waltham, MA, USA).

2.5. Vesicle Size Measurement

The vesicle size of the TQ-phytosome formulation was measured by the dynamic light scattering (DLS) technique using Zetasizer Nano ZSP (Malvern Panalytical Ltd., Malvern, UK) after dispersing phytosomes with deionized water [22]. Measurement of each sample was performed in three replicates and all the measurements were carried out at a temperature of 25 °C at a laser wavelength of 633 nm, whereas the scattering angle was 173°, with medium viscosity of 0.8872 cP and refractive index of 1.33.

2.6. Transmission Electron Microscopy (TEM)

The shape and aggregation of the TQ-phytosomes vesicles were assessed using TEM (JEOL-JEM-1011: JEOL-Tokyo, Tokyo, Japan) by spreading one drop of suspended phytosome samples on a carbon-coated grid. Negative staining of the sample was performed using 1% phosphotungstic acid followed by drying at room temperature for 15 min before visualization.

2.7. In Vitro Release

In vitro release study of TQ from the free-TQ suspension (in 0.25% carboxymethyl cellulose) and TQ-phytosomes was performed following the dialysis bag method of Alhakamy et al. [17] in 0.2 M phosphate buffer saline (PBS) (pH 7.4). The phytosomes and the suspension formulations of TQ equivalent to 1 mg of the drug were incorporated into clean activated dialysis bags of 12–14 kDa molecular weight cutoffs (Sigma-Aldrich, St. Louis, MO, USA). The test was initiated by placing the sealed bags into 100 mL PBS at 37 ± 0.5 °C. The set was stirred continuously at a speed of 100 rpm using a magnetic stirrer and samples of 2 mL were withdrawn at predetermined time points (0.5, 1.0, 2.0, 4.0, 6.0, 8.0, and 12.0 h). An equivalent quantity of fresh PBS was replaced into the release system and the samples were analyzed for TQ using a developed HPLC method [23]. The release study was performed in triplicate to express the results as average ± standard deviation (SD). The release data for free-TQ suspension and TQ-phytosomes were compared statistically.

2.8. Cytotoxic Effects of Optimized TQ-phytosomes on Human Lung Cancer Cells

2.8.1. Cell Line and Culture Condition

The human lung cancer cell line (A549) was obtained using a cell strain from the American Type Cultural Collection (ATCC). The cell line was cultured as a monolayer in Roswell Park Memorial Institute (RPMI) 1640 cell culture media supplemented with penicillin (10 U/mL), streptomycin (10 µg/mL), amphotericin B (0.25 µg/mL), and 10% (v/v) fetal bovine serum in a humidified environment (5% carbon dioxide (CO2), and 95% air) at 37 °C for 48 h. While non-cancerous endothelial cells (EA.hy926) were cultured in Dulbecco’s modified Eagle’s medium. Then, cells were incubated with different concentrations of the optimized TQ-phytosome, blank-phytosomes, and free-TQ using a range of concentrations with reference to TQ at logarithmic intervals for 48 h at 37 °C in a CO2 incubator. A commercially-available MTT assay kit was used in determination of IC50 values based on the manufacturer’s instructions (ABCAM, Cambridge, UK).

2.8.2. Determination of IC50 Using MTT Assay

The cytotoxicity of TQ-phytosomes was investigated against the A549 cell line. The cell suspension (2 × 10⁵ cells) was seeded into a 96-well tissue culture plate followed by 24 h incubation in a 5% CO2 incubator at 37 °C for cell attachment. Optimized TQ-loaded phytosomes at concentrations ranging from 1 to 200 µM, blank-phytosomes, and free-TQ were added to a 96-well plate followed by 24 h incubation at standard conditions. Thiazolyl blue tetrazolium bromide (MTT) assay using a commercially-available kit (ABCAM, Cambridge, UK) was performed to determine IC50 values of all the samples to study cell viability potential. The studies were performed in triplicate.

2.8.3. Cell Cycle Analysis

The cell cycle analysis was carried out using flow cytometry experiments following previously-described methods [24,25]. The cells were incubated for 24 h with 2.1 µM of the optimized TQ-loaded phytosomes, free-TQ, and blank phytosomes. A control group of cells without any treatment was also added in the study. After incubation, samples were centrifuged to separate the cells and then fixed with 70% cold ethanol. The cells were again centrifuged and washed with PBS. Cells were stained using propidium iodide in PBS and RNAse-staining buffer followed by flow cytometry (FACS Calibur, BD Bioscience, San Jose, CA, USA) analysis.

2.8.4. Annexin V Staining

Cell apoptosis was investigated using the reported dual staining technique [26]. The cell suspension containing 1 × 10⁵ cells per well was incubated for 24 h with different samples of 2.1 µM the optimized TQ-phytosome, blank-phytosomes, and free-TQ in a 96-well plate. A control group of cells without any treatment was also added to the study. Commercially-available kit (BD Bioscience) was used for staining. Following incubation, the cells were centrifuged and re-suspended in 1× binding buffer (500 µL). Propidium iodide (BD Bioscience) and annexin V-FITC (5 μL of each) were added and the cells were incubated for 5 min at room temperature in the dark environment followed by flow cytometry analysis.

2.8.5. Caspase-3 Assay

Caspase-3 activity was performed using a commercial kit (BD Biosciences) [27]. The cell suspension containing 5 × 10⁴ numbers of A549 cells per well was incubated with 2.1 µM of the optimized TQ-phytosomes, blank phytosomes, and free-TQ in a 96-well plate. Additionally, a control group of cells without any treatment was kept in this study. The caspase-3 activity of the tested samples was evaluated by measuring the absorbance of the cell lysate at a wavelength of 405 nm.

2.8.6. Reactive Oxygen Species (ROS) Determination

The ROS determination was carried out using A549 cells with a non-fluorescent probe, 2,7-diacetyl dichlorofluorescein diacetate (DCFH-DA) [28]. The probe penetrates into the intracellular matrix of the cells and oxidized to fluorescent dichlorofluorescein (DCF) by ROS [29]. The cell suspension containing 2 × 10⁵ cells in each well of a 96-well plate was incubated with free-TQ, TQ-phytosomes, and blank-phytosomes for 24 h. A control group of cells without any treatment was also included. Further, 10 μM DCFH-DA was added and incubated for an additional half hour at 37 °C. Afterwards, the cells were washed with PBS and the fluorescence intensity was determined using a microplate reader at 485 nm (excitation wavelength) and of 530 nm (an emission wavelength).

2.9. Statistical Analysis

Replicates of three data for each sampling point were presented as mean ± SD. Data sets of two groups were analyzed using the t-test (two-tailed) and multiple t-test runs were carried out by means of one-way ANOVA followed by Turkey’s post hoc test. Statistical analyses were performed using IBM SPSS® statistical software (Ver. 25, SPSS Inc., Chicago, IL, USA). Outcomes were indicated as being statistically significant at p <  0.05.

3. Results

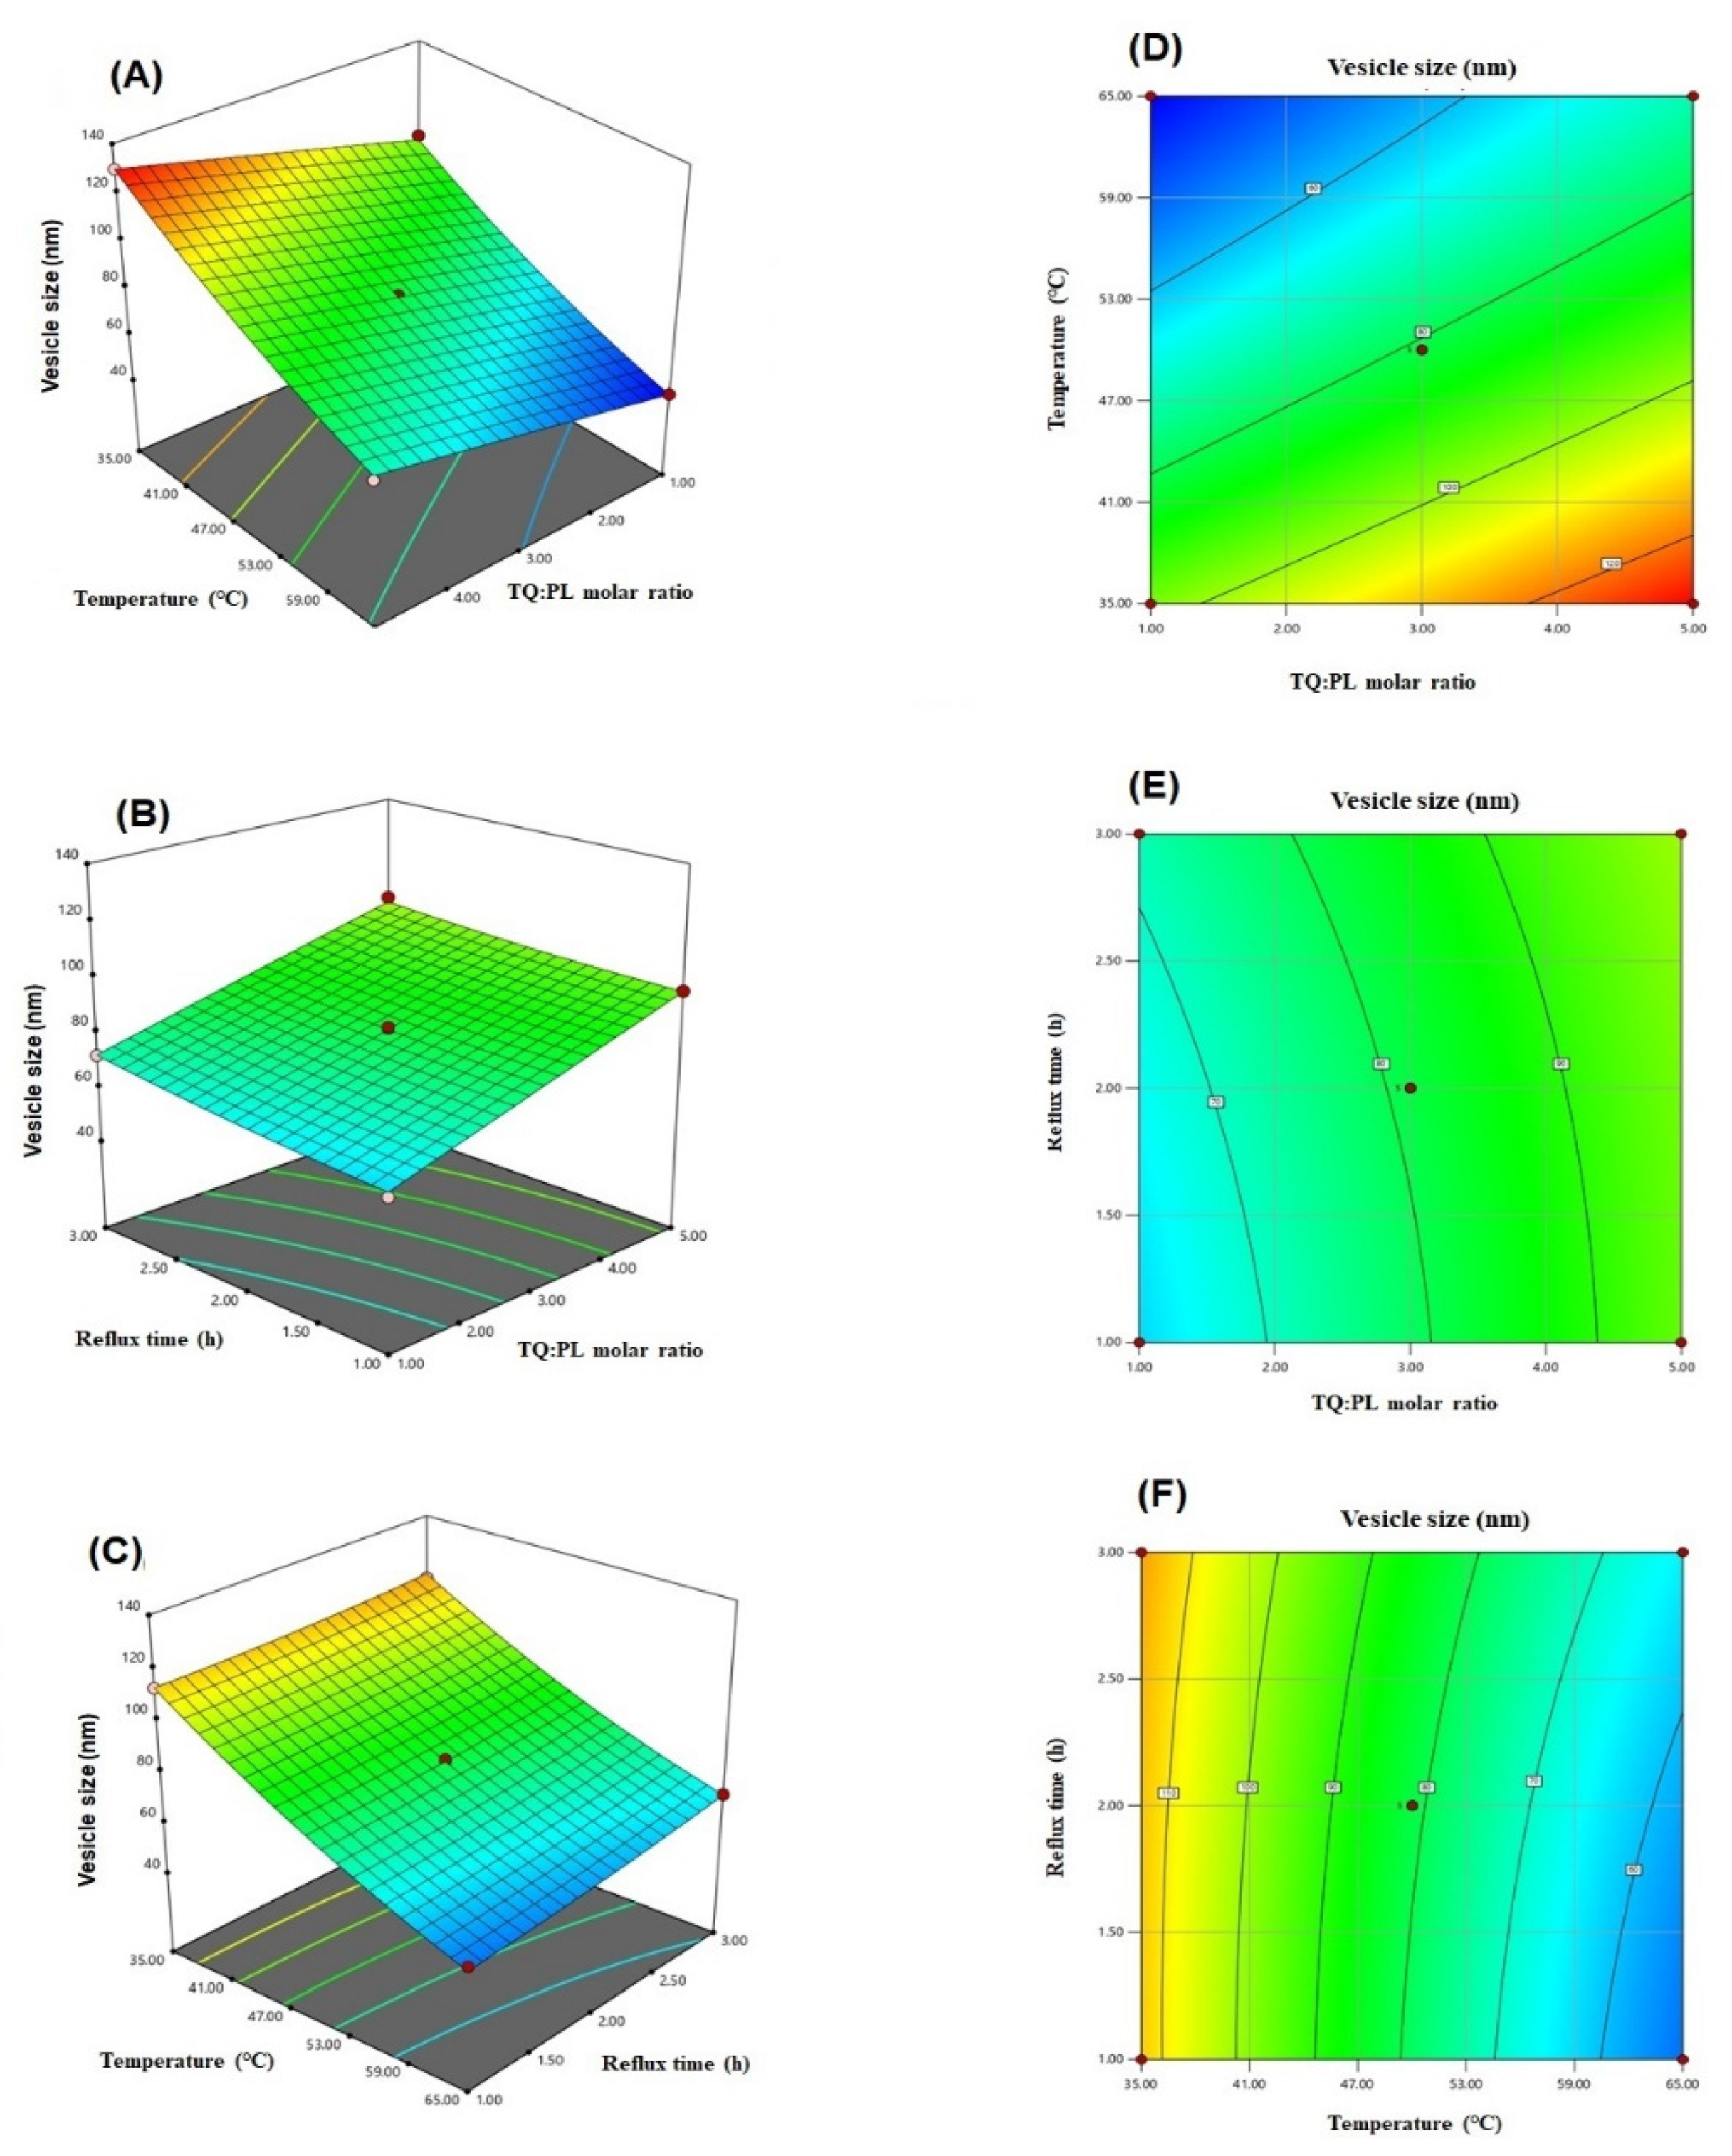
3.1. Influence of Independent Variables on Vesicle Size

The generated runs with different combinations of the three independent variables for optimization of the TQ-phytosome formulation are represented Table 1.
All the prepared TQ-phytosomes were nano-sized with vesicles size ranging from 43.7 to 129.9 nm. The observed and predicted values for the vesicle size are compiled in Table 2. The vesicle size of TQ-phytosomes are best fitted to the quadratic model based on its highest determination coefficient.
The statistical outcome for the vesicle size is presented in Table 3. The p-values in Table 2 indicate the statistical significance of the influence of the three independent variables (TQ to phospholipid molar ratio (PL, A), process temperature (°C, B), and reflux time (h, C)) on vesicle size. In addition, the interaction between process temperature and the reflux time (BC) and the quadratic term corresponding to the process temperature (B2) were also significant at the same level.
The equation relating the vesicle size to the independent variables according to the fitted model was generated by the software (Equation (1)). Furthermore, the effect of the variables on the vesicle size and the interaction between them are illustrated in the three-dimensional and contour plots presented in Figure 1.
Y = 81.32 + 15.24 A − 27.90 B + 3.71 C − 1.28 AB − 1.20 AC + 1.97 BC − 0.135 A2 + 4.34 B2 + 1.12 C2

3.2. Optimization of TQ-Loaded Phytosomes

The numerically-optimized values for independent variables and the predicted responses obtained from Box-Behnken statistical design are displayed in Table 4. During numerical optimization, minimum vesicle size was set as the goal in the software. As discussed earlier, the minimum vesicle size could be achieved with lower TQ to phospholipid molar ratio with lower reflux time and higher temperatures. The optimized formulation was prepared and assessed for the vesicle size. The observed vesicle size of 45.59 ± 1.82 nm was in good agreement with the predicted one with residual percentage error of 4.39%.

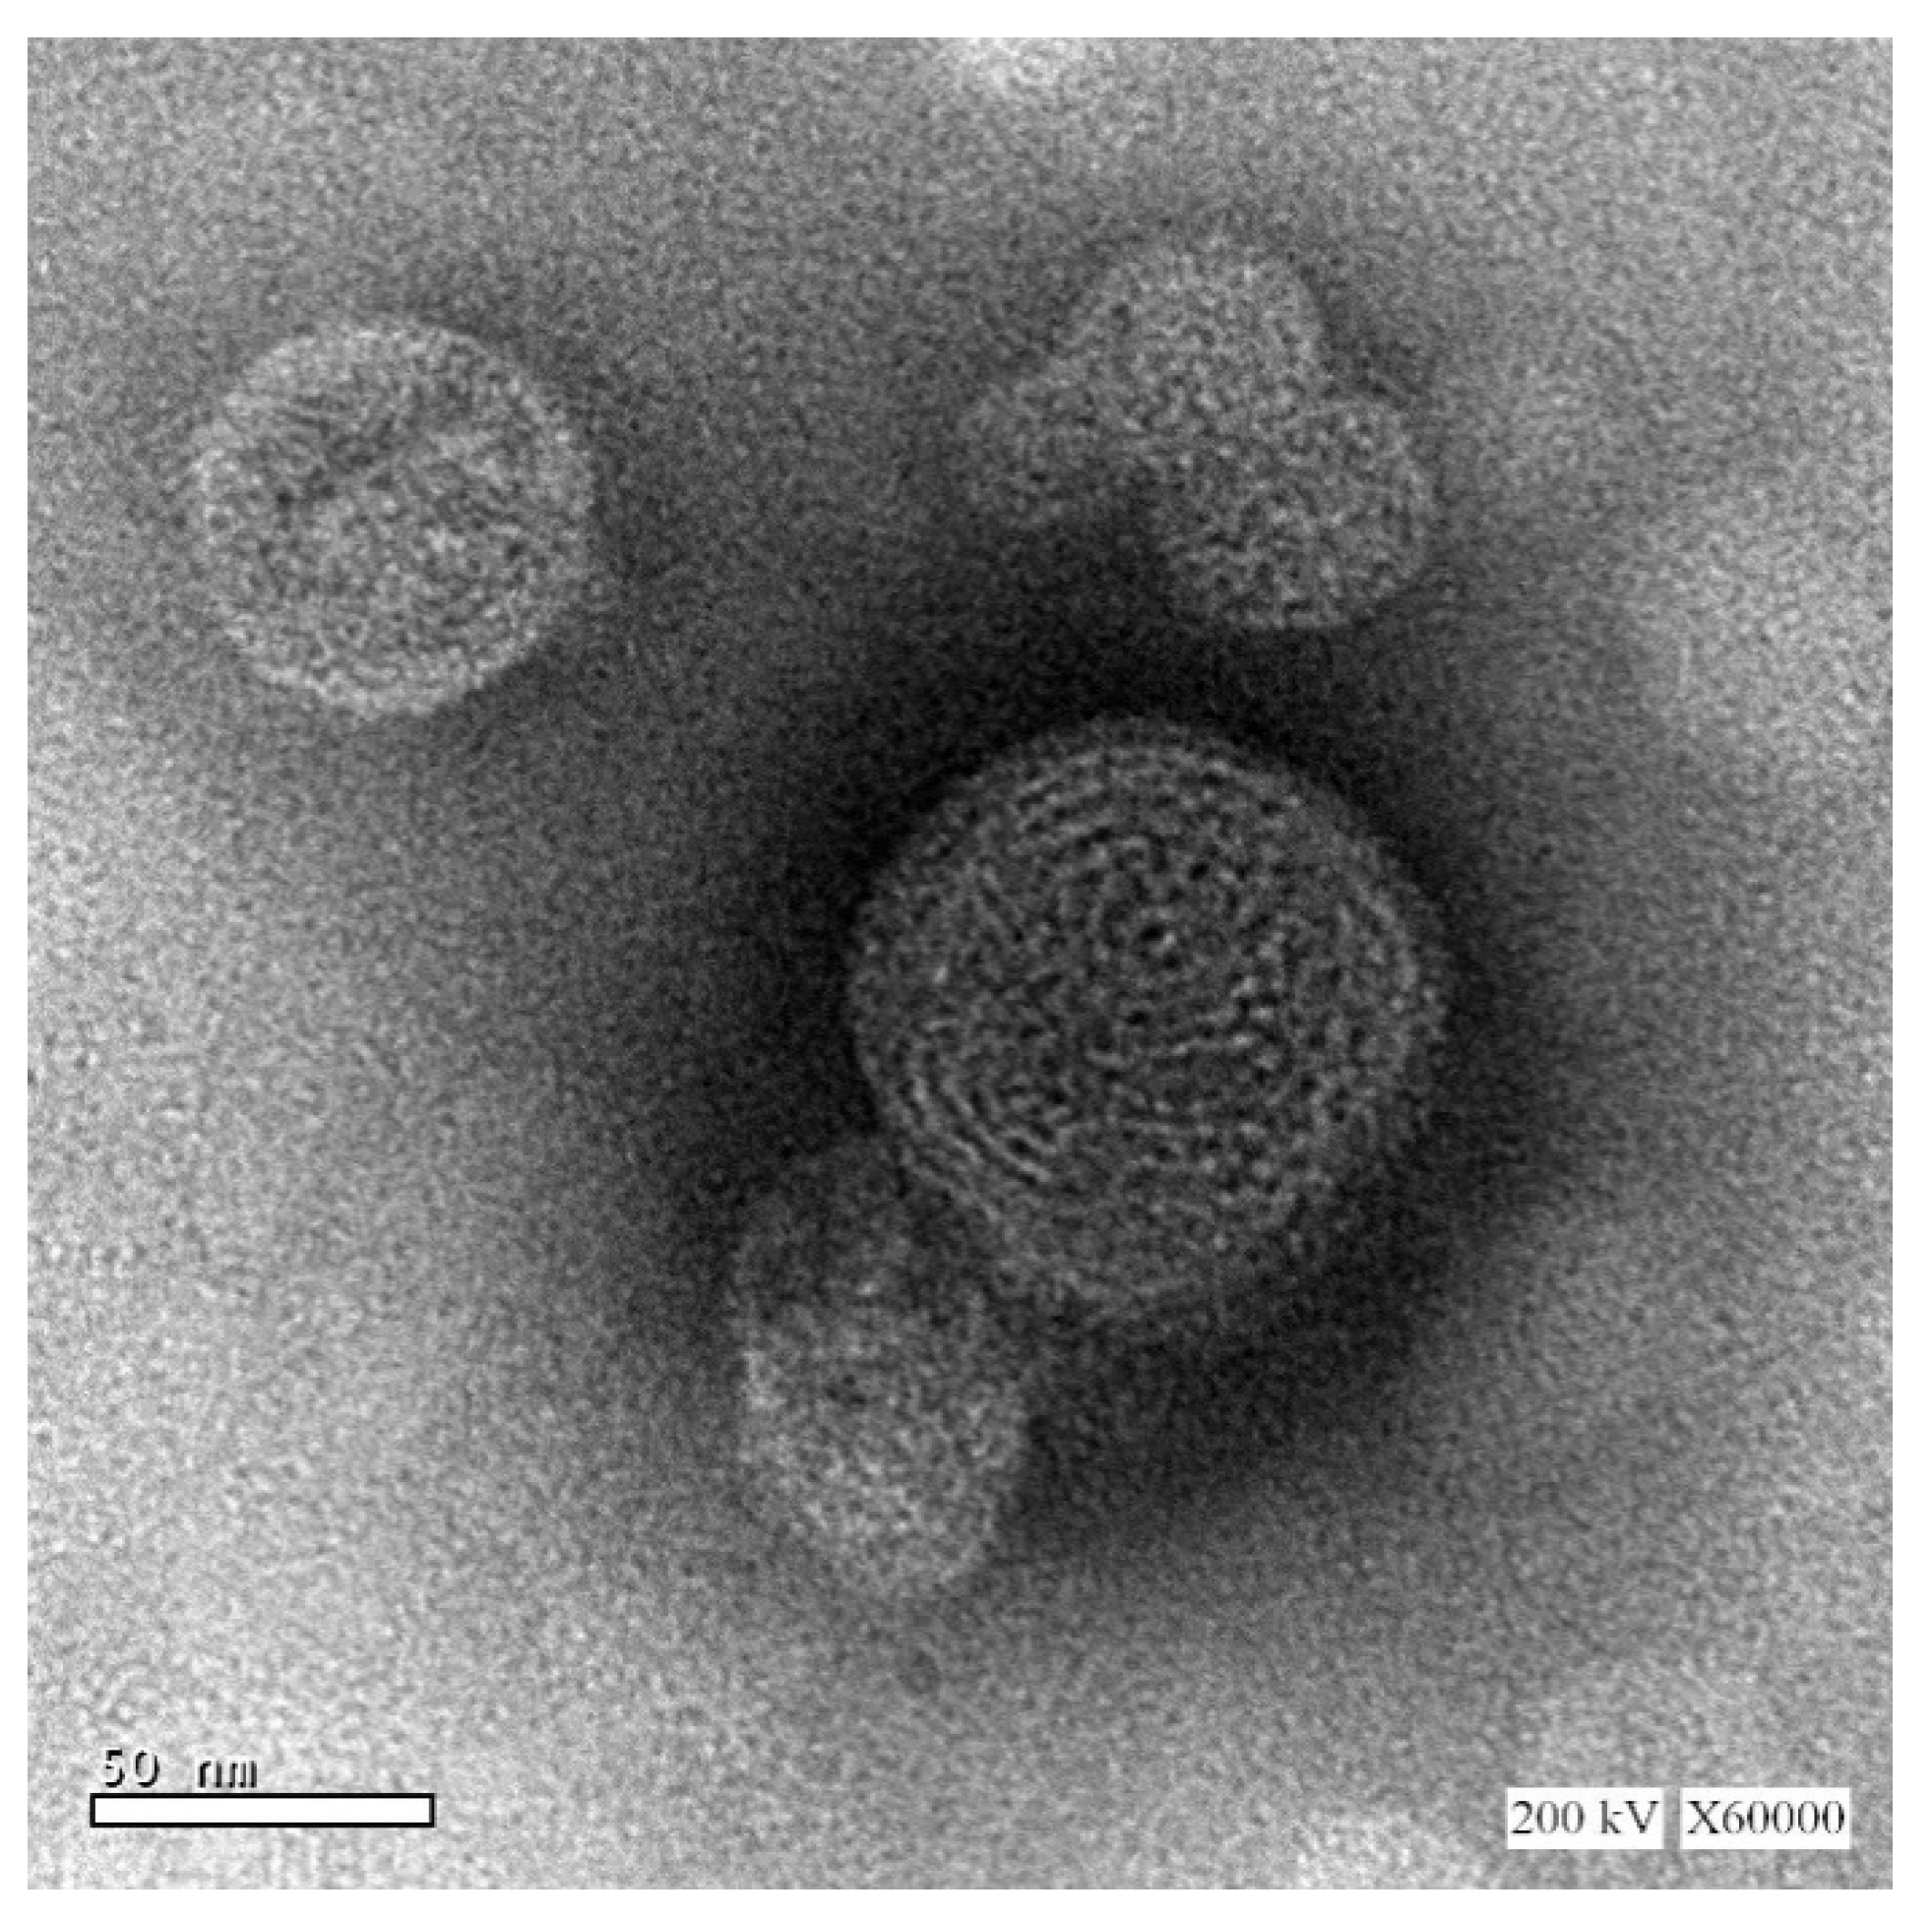
3.3. Transmission Electron Microscopy (TEM)

The size and morphology of the optimized TQ-phytosomes were analyzed by TEM. The results obtained from the DLS method were in agreement with the vesicle size of the TEM micrograph (Figure 2). On further analysis, the morphology of the TQ-loaded phytosomes seemed to be spherical in shape with a smooth surface and no evidence of drug precipitate, where the sign of uniform vesicle formation was marked, however, the spherical phytosomes showed some extent of aggregation.

3.4. Fourier-Transform Infrared (FTIR) Spectroscopy

As represented in Figure 3, TQ showed a characteristic broad bond at 1615 cm−1, 1643 cm−1 due to the conjugated carbonyl group and 2965 cm−1 stretching bond of the dialiphatic CH2 group, while Phospholipon® 90H, showed sharp peaks at 2849 and 2923 cm−1 for the two amino group salts which confirmed at 1650 cm−1 and at 1740 cm−1 which represent the ketone group. Decreasing peak strength of the major groups in addition to disappearing of the Phospholipon® 90H peak (3017 cm−1) indicated the engagement of the function groups of TQ and Phospholipon® 90H together in the prepared phytosomes.

3.5. In Vitro TQ Release Study

The in vitro release pattern of TQ from the optimized TQ-phytosomes and free-TQ suspension is presented in Figure 4. From the representation, it could be evidenced that there is an increased release of TQ from the phytosomes across the dialysis membrane. An initial burst release of TQ from both the formulations was evident within the first 2 h, with approximately 33% of TQ from the phytosomes, whereas there was 20% release from the suspension.

3.6. Cytotoxic Activity

3.6.1. Determination of IC50 Values

The cytotoxic activity of the three samples, blank-phytosomes, free-TQ, and TQ-phytosomes were determined at different concentrations by the cell-killing performance in the MTT assay on the A549 cell line. From the findings, it can be inferred that the blank-phytosomes showed the least signs of cytotoxic effect to the experimental cell line, while the least IC50 value was observed with TQ-phytosomes (Figure 5).

3.6.2. Cell Cycle Analysis

Further evaluation of these formulations against cell cycle progression was performed by means of DNA content flow cytometry assay. The results of the flow cytometry analysis on A549 cell cycle analysis is depicted in Figure 6. Significant alterations in different cell cycle phases have been noted when the cells are treated with free-TQ or TQ-phytosomes. The effect of TQ-phytosomes has been observed in all phases, except for S-phase. As summarized in Figure 6, the treatment of phytosomal delivery of TQ to the cells resulted in the significant arrest of G0-G1 phase along with the enhancement of cells with the G2-M phase, where the differences are found to be more significant than the other tested samples. A comparable report has been observed in the pre-G1 apoptosis phase of the cell cycle.

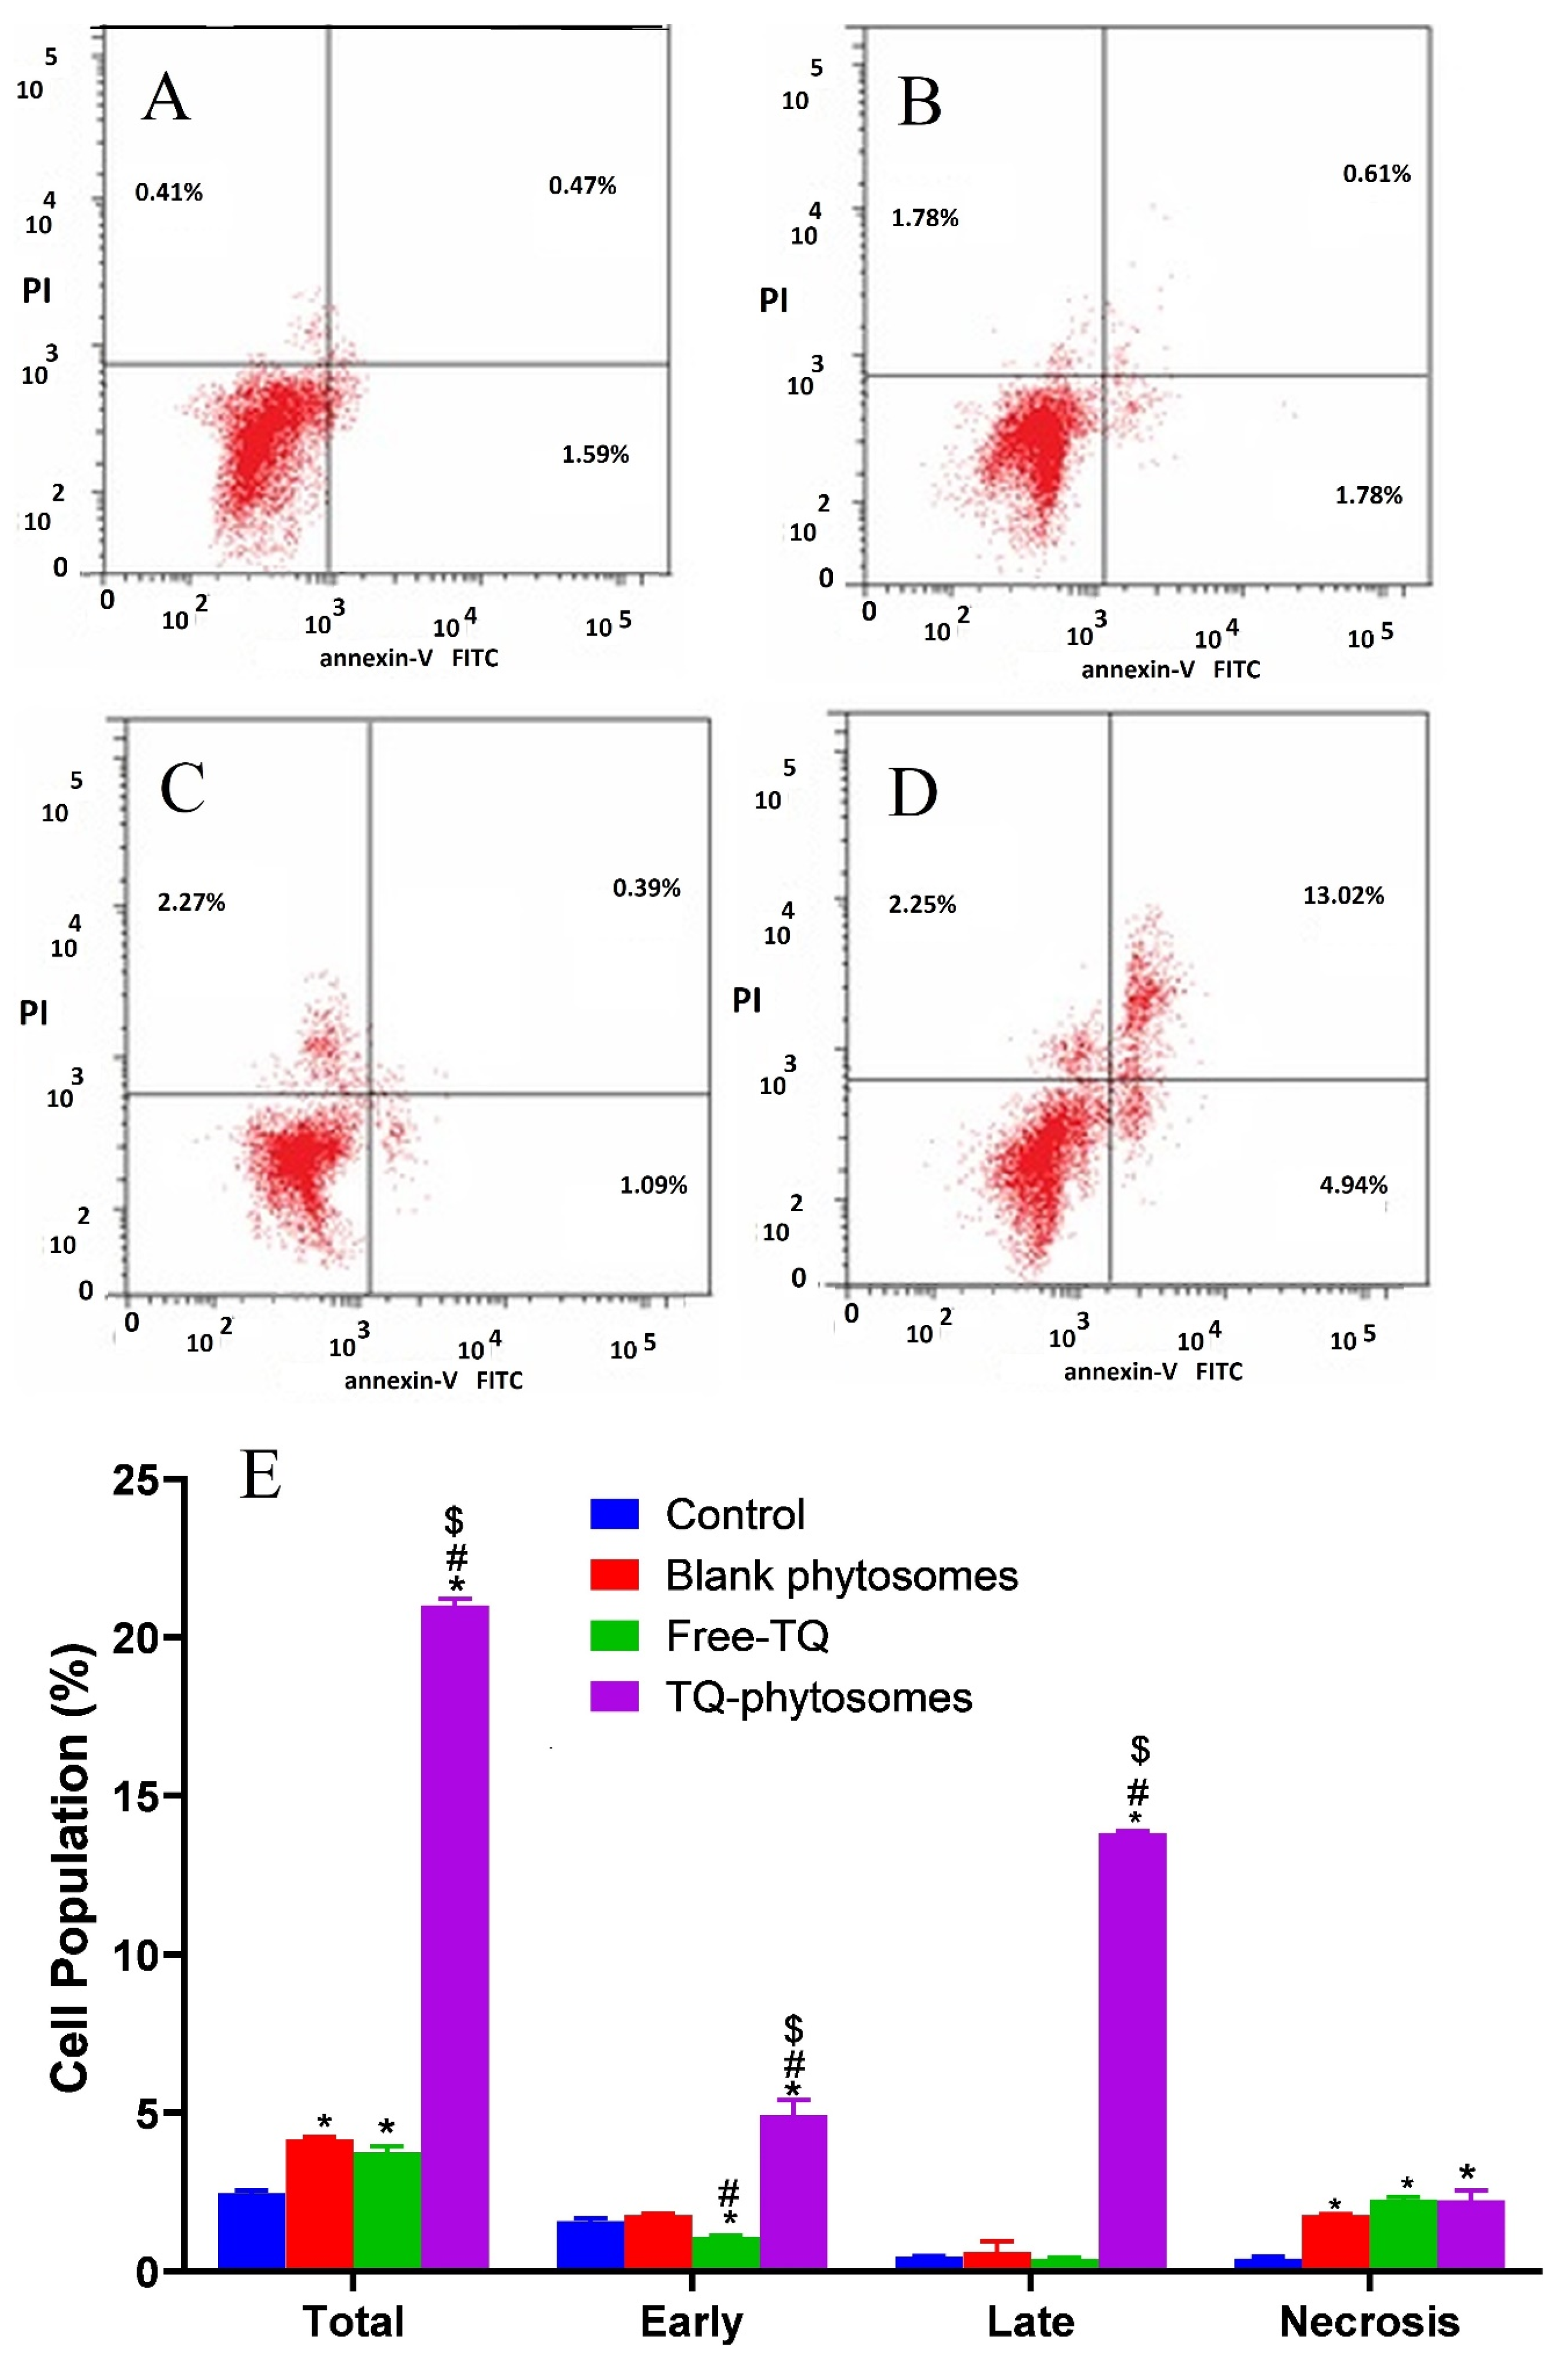
3.6.3. Apoptotic Assessment

Herein, to present the apoptotic potential of the blank-phytosomes, free-TQ and TQ-phytosomes, we analyzed the induction of apoptosis (early, late, and total) and necrosis. Incubation of the A549 cells with the tested samples for 24 h, together with flow cytometry analysis and annexin-V/FITC and propidium iodide staining results are represented in Figure 7. From the figure, it is evident that exposure of TQ within the phytosomal formulation significantly induced apoptosis after the exposure (21.01 ± 1.02%) when compared to the untreated control (2.47 ± 0.35%) or treated free-TQ (3.75 ± 0.56%). Additionally, significant necrotic cell death was observed following blank-phytosomes, free-TQ, and TQ-phytosome sample treatments to the cancer cells, by 1.78 ± 0.14%, 2.27 ± 0.24%, and 2.25 ± 0.41%, respectively, when compared to the necrosis in control cells (0.41 ± 0.12%).

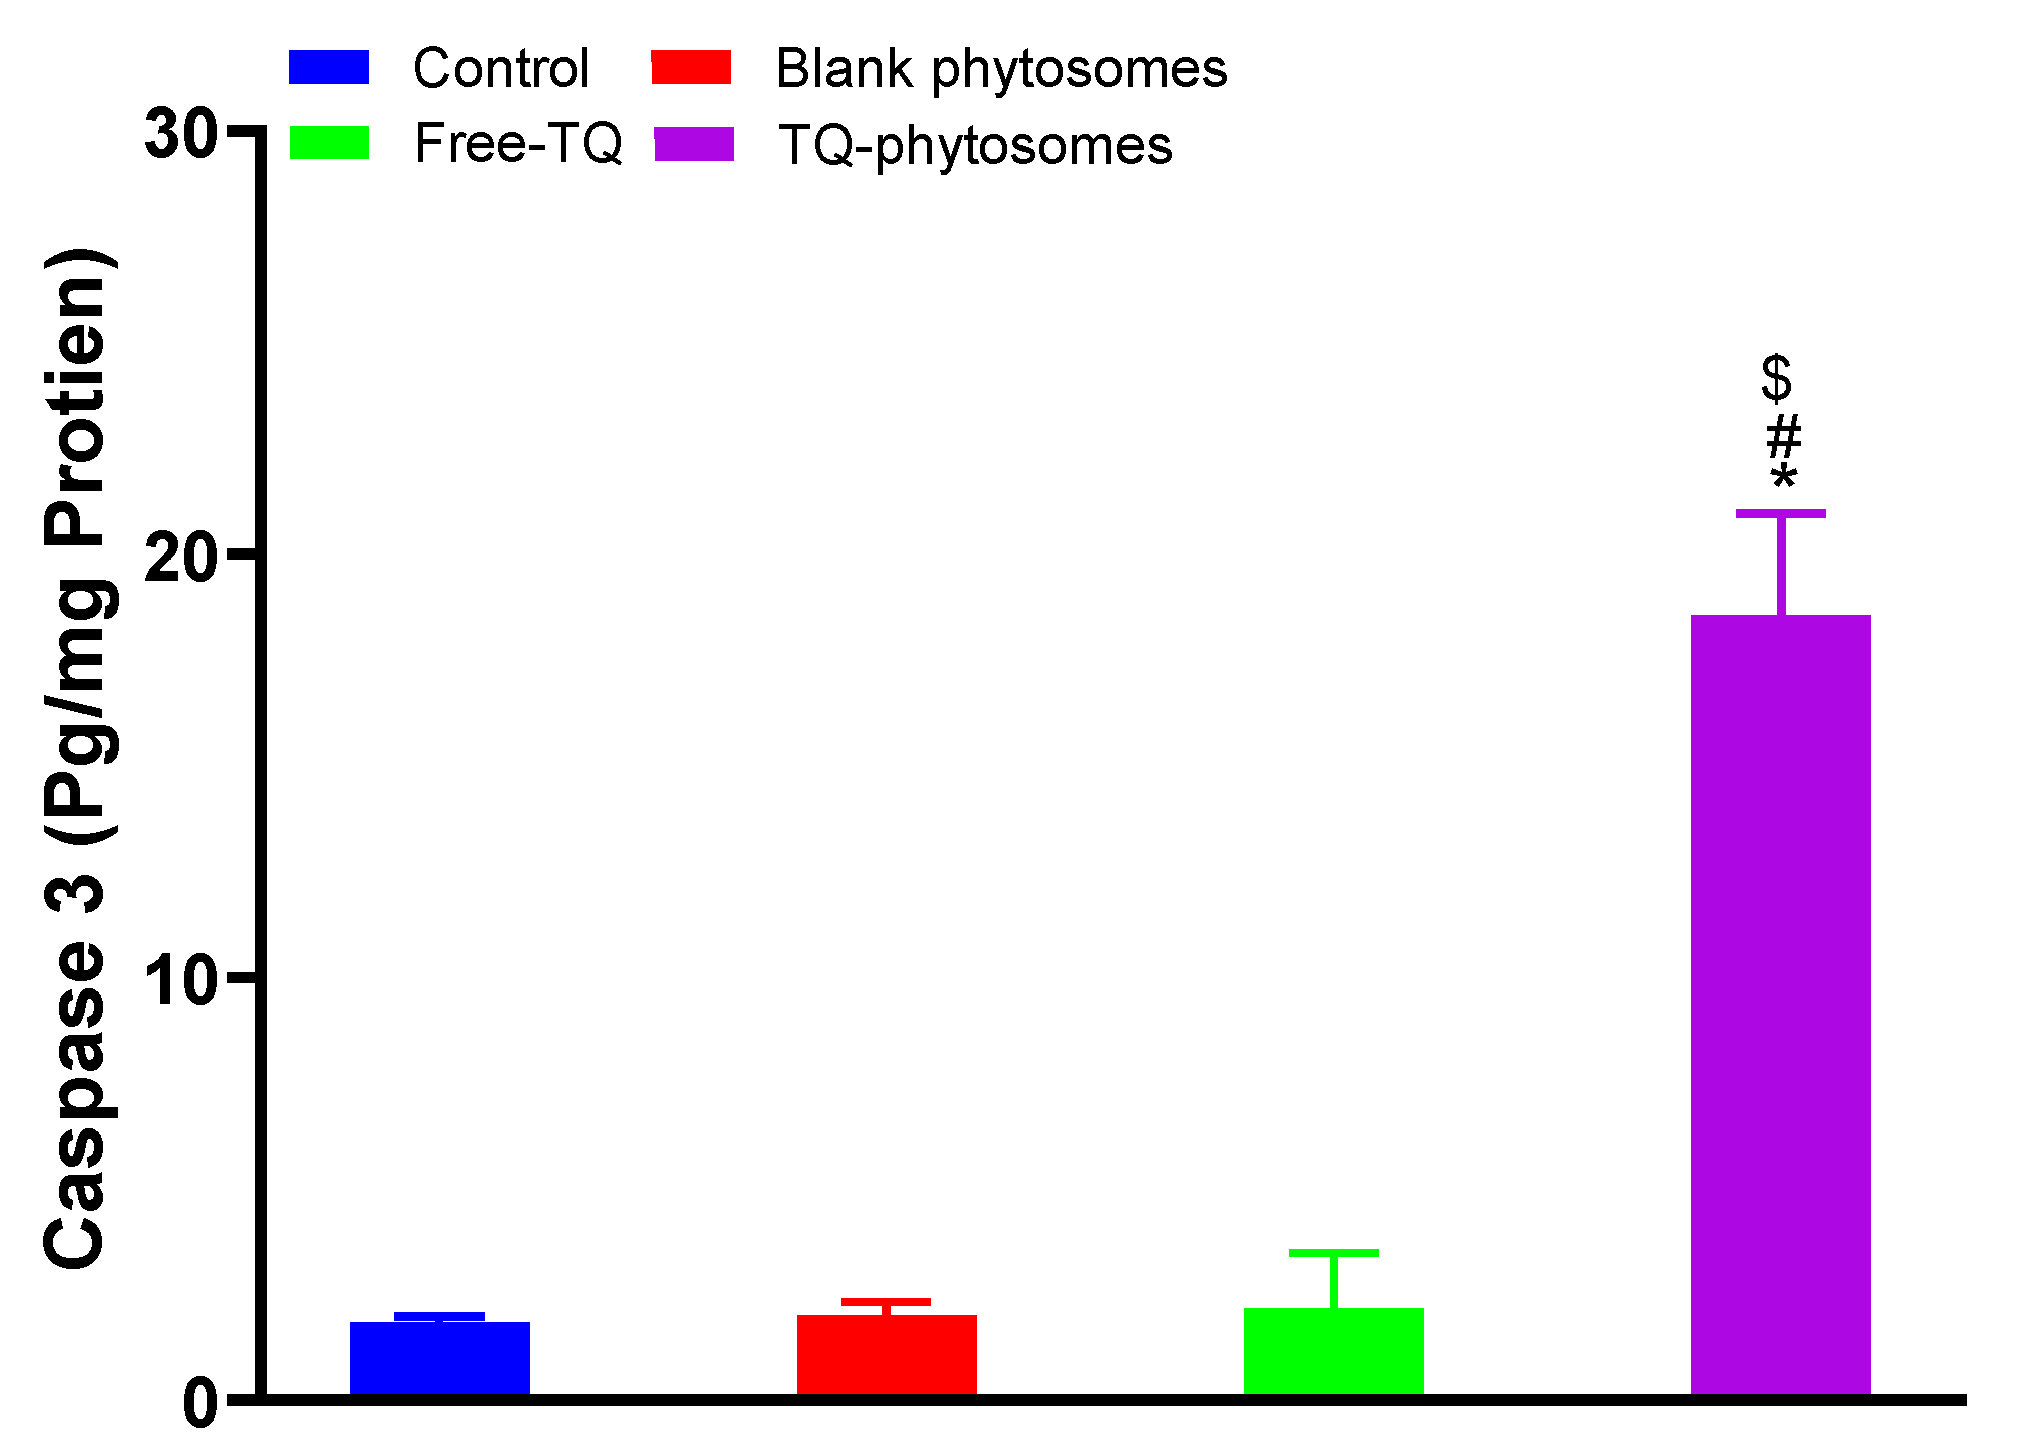
3.6.4. Caspase-3 Assay

Analysis results of caspase-3 using the commercial kit are represented in Figure 8, where significant enhancement in caspase-3 content is clearly indicated in the TQ-phytosome-treated A549 cell line, where the increased caspase-3 content is approximately 9-fold compared to the free-TQ treated cells. Alternatively, the modulatory effect of free-TQ on A549 cells was found to be insignificant within our experimental limits.

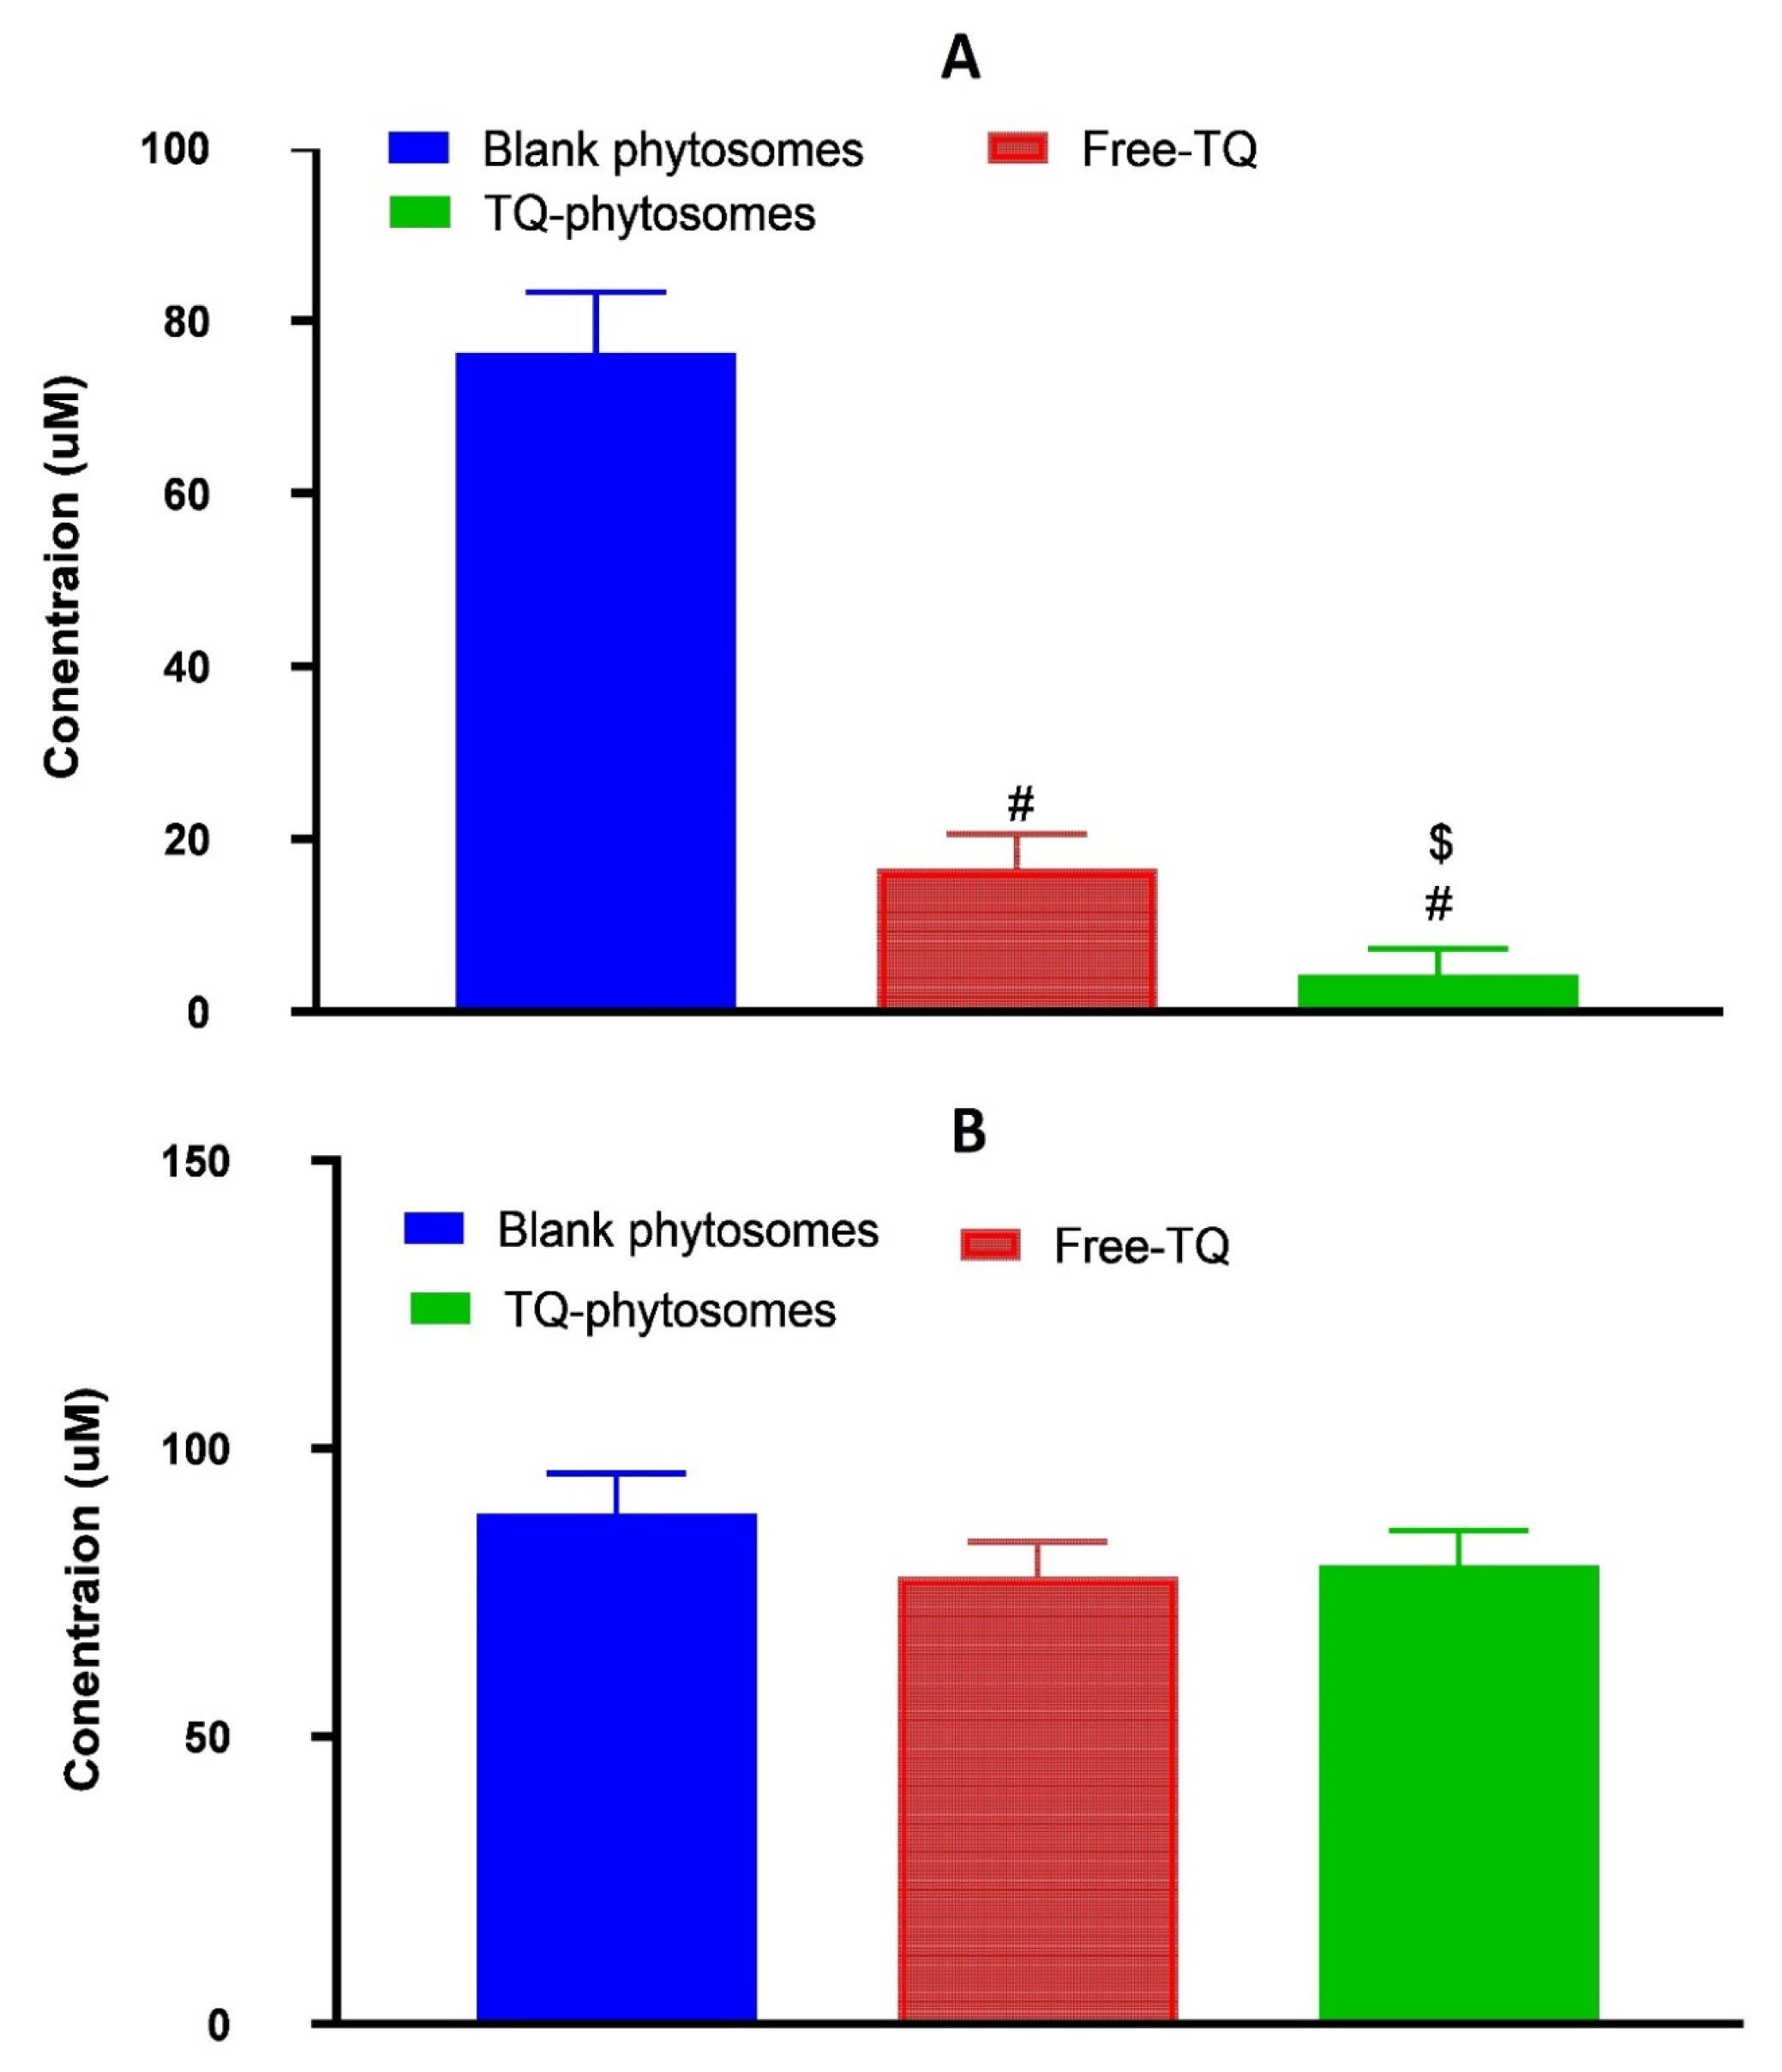
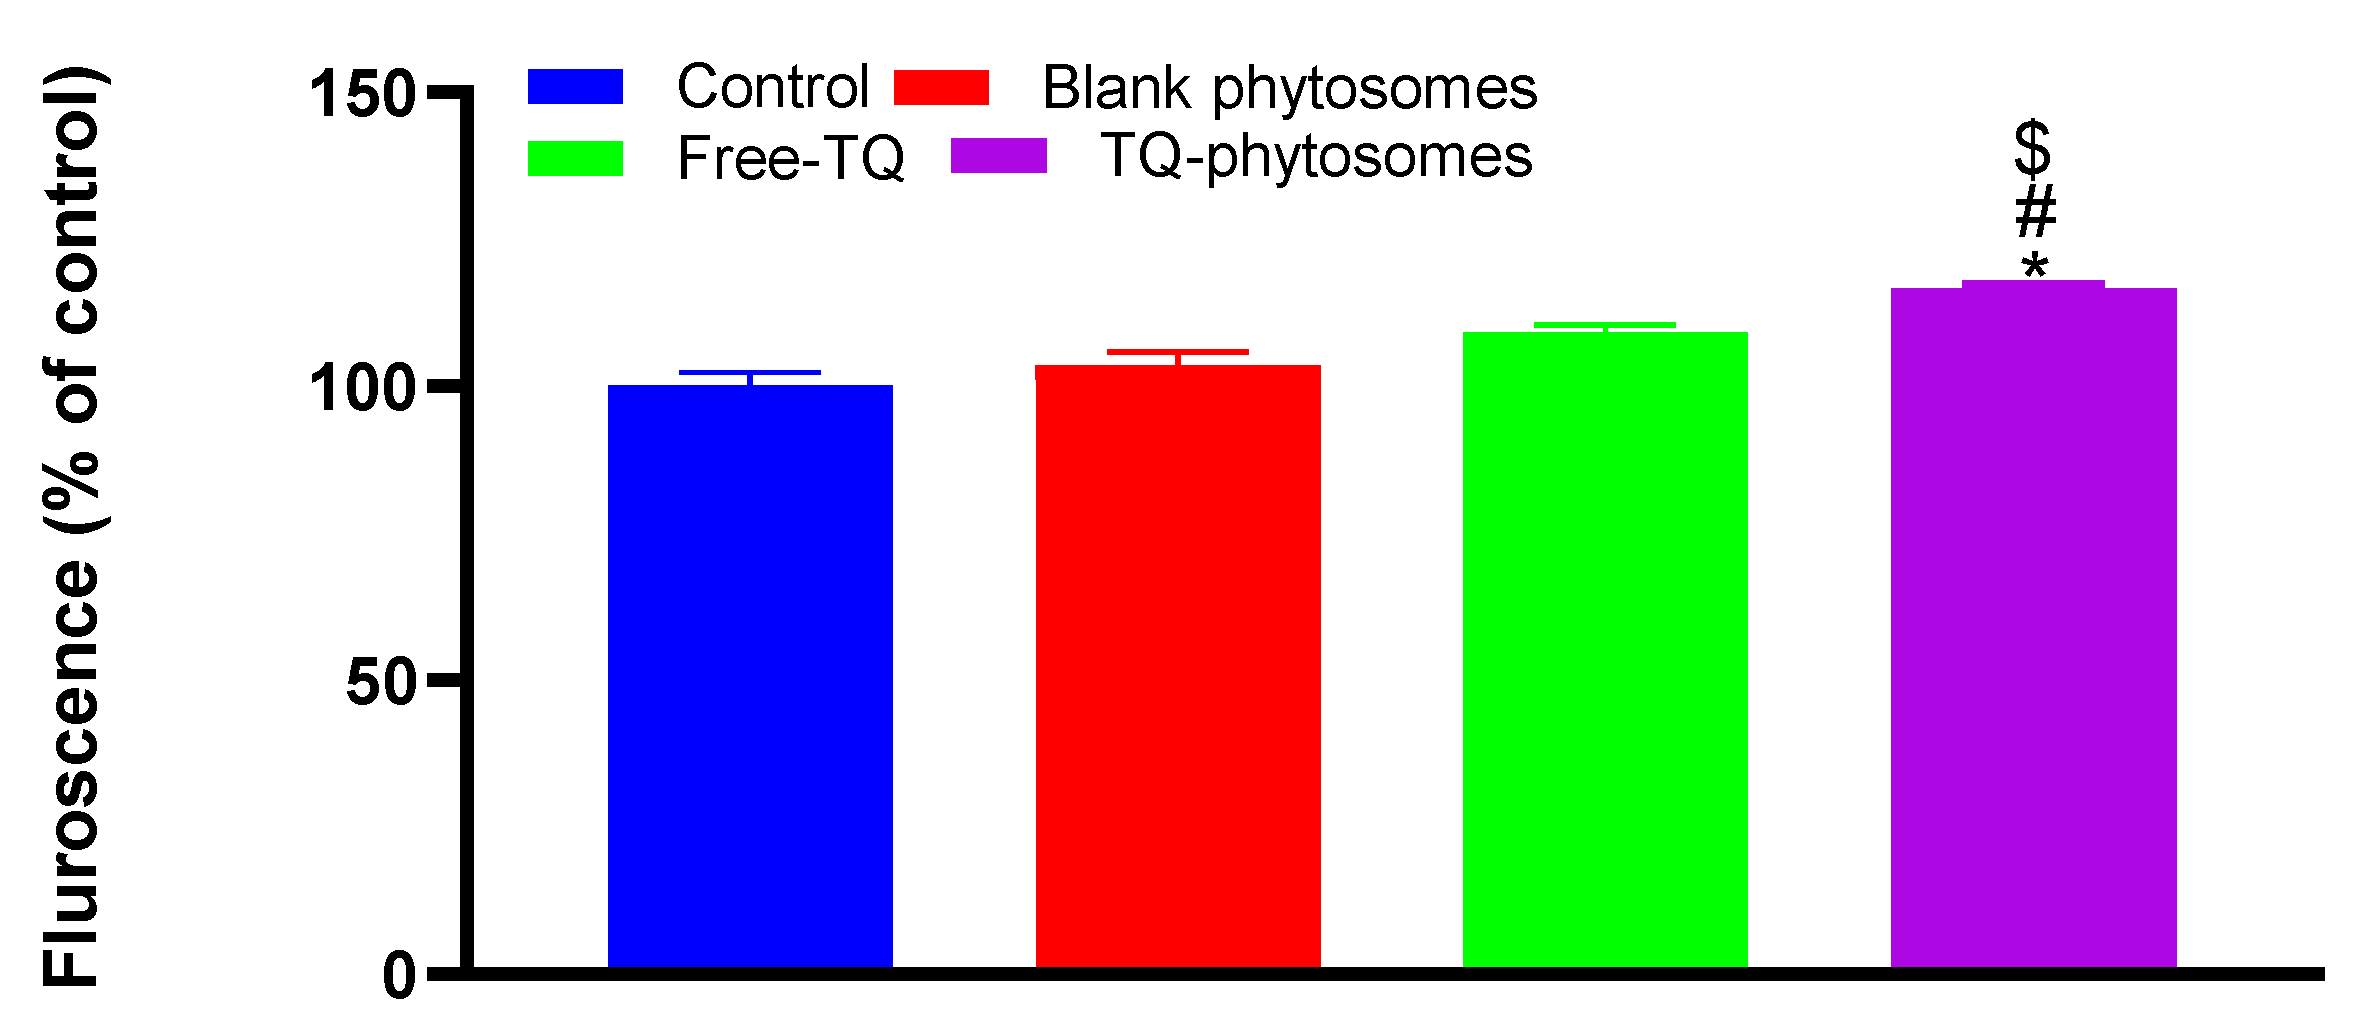
3.6.5. Determination of Generated ROS

The induction of ROS using DCFH-DA by the fluorescein microscopy was measured in A549 cells following incubating with blank-phytosomes, free-TQ, and TQ-phytosomes (Figure 9). The cleavage of the acetoxymethyl group on DCFH-DA normally results in the presence of non-specific esterases within the cell, which results in a non-fluorescent molecule. However, the generation of ROS can irreversibly convert DCFH-DA to fluorescent DCF [30]. A significant increase in the fluorescence (16.6%) in TQ-phytosome-treated cells compared to the cells in the control group indicated an increased production of ROS within the A549 cells. Alternatively, the generated ROS were slightly higher in blank-phytosomes and free-TQ treated cells than those of the control group; however, the increased fluorescence levels were statistically insignificant.

4. Discussion

Regarding the statistical analysis of vesicle size data, the good agreement between R2 value of 0.9935 and adjusted R2 value of 0.9962, in addition to adequate precision value of 61.26 (greater than 4) ensured the quadratic model validity. Furthermore, the observed and predicted values for the vesicle size, presented in Table 2, were in good agreement with each other. The percent difference in their values, expressed as percent error was less than 10% for all runs. These results confirmed the fitting of the data to the selected model. The positive coefficients of A and C indicated that vesicle size was increased with increasing TQ to phospholipid molar ratio and reflux time, whereas, the negative coefficient of B foreshadowed an inverse relationship between vesicle size and process temperature. The observed increased size with increasing phospholipid molar ratio might be explained by increase of phospholipid content in the developed phytosomes. Our finding was in agreement with other work reported in literature [17,31,32].
This initial burst release characteristics of TQ might be explained by the release of surface TQs from the phytosomes, because of easy dissociation of trapped TQs from the surface phospholipid of the phytosomes. Thereafter, there was a gradual release of TQ from the phytosomes with almost complete release within 12 h period, whereas it was around 49% from the suspension, indicating almost doubling of the amount of TQ released from the optimized phytosomes compared to the free drug suspension. Furthermore, the sustained release behavior of the TQ might be attributed to two different phenomena where initially the TQ was dissociated at the core of the stable phytosomes followed by diffusion of the dissociated TQ to the media through the phytosome skeleton [33]. These findings could be extrapolated and it can be assumed that the developed TQ-phytosomes would be stable in the in vivo blood circulation from where the TQ will release slowly because of incorporation of the TQ– IC50phospholipid complex within the architecture of the optimized phytosome, indicating that phytosomes act as an effective delivery system for TQ. The findings of value of the free-TQ against A549 cells are in agreement with the recent report by Acharya et al. [34], whereas, findings of the IC50 value of blank-phytosomes are similar to the published report by Alhakamy et al. [17]. The decrease in IC50 value of TQ when delivered by this phytosome nanocarrier successfully reduced the IC50 value by almost 45%, indicating the superiority of the delivery tool. This is similar to a previous study showing the cytotoxic activity of TQ in the human lung cancer cell line (A549 cells) [35]. These cytostatic activities of TQ-phytosomes were confirmed in NCI-H460 lung cancer cells. It could be concluded that the cytotoxicity of TQ was greatly augmented by its formulation of phytosomes. That could be attributed to TQ’s high cellular permeability. The main factor may be the modified mechanism of TQ cellular uptake. Free-TQ had been taken by passive transport, while phytosomes had been taken by endocytosis. In addition, phytosomes containing abundant phospholipids could carry amphiphilic agents to cross the cell membrane resulting in high intracellular drug concentrations [36,37,38]. However, the optimized formula showed relatively-weak cytotoxic activity against EA.hy926 non-cancerous endothelial cells. Apoptosis, programmed cell death, is a physiological mechanism that is precisely regulated at the genetic level, resulting in programmed removal of damaged cells.The differential effect of TQ-phytosomes on pre-G1 and G2-M phases of the A549 cell line clearly demonstrated that the phytosomal formulation of TQ possesses augmentation property of TQ by the novel nanocarrier platform. An increased percentage of cells in the pre-G1 phase of the cell cycle is a characteristic indication of apoptotic potential [39]. Moreover, the induction of apoptosis with increased efficacy of TQ in arresting at different stages of cell cycle could be correlated to its ability to modulate expressions of cellular components during the cell signaling pathways of apoptosis and cell-cycle arrest. Similar findings on TQ treatment of cancer cells have been reported in the literature [9], however, comparing our findings on free-TQ and phytosomal delivery, an enhanced efficacy with TQ-phytosomes could be clearly shown. Thus, correlating to the previous results on cell-cycle analysis it could be inferred that the increased apoptotic potential of the TQ might be because of arresting different phases of cell cycles. These data gain support from a previous report on TQ that highlighted the ability of TQ to cause colorectal cancer cell (HCT 116) arrest in the G2-M phase; TQ caused a G2/M phase cell cycle arrest in both TFK1 and HuCCT-1 cells in vitro and resulted in decreased expression of the G2/M checkpoint protein cyclin B1. Also, TQ significantly increased the percentage of apoptotic cells in the pre-G phase [23,27]. Nevertheless, reported studies also indicated that TQ blocks cells in the G0-G1 phase [14,16]. This is in agreement with previous studies suggesting induction of apoptosis as a mechanism of anti-proliferative properties of TQ [40]. In regard to annexin V, these data gain support from previous reports showing enhanced melanoma cell staining with annexin V after challenge with TQ. Furthermore, TQ-phytosomes showed significant increase in the proportion of A549 cells with positive annexin staining. This is in agreement with studies showing the ability of phytosomes to enhance annexin V-staining of ovarian cells when loaded with icariin [17]. These observations might be due to the lipophilic nature of the formulation which offers improved delivery of the anti-proliferative agents [41]. In the present study, TQ-phytosomes significantly enhanced caspase-3 content. This is in harmony with the previous reports indicating the ability of TQ to enhance cellular caspase-3 [34,38,39]. In addition, the enhanced effects of phytosomes on cleaved caspase-3 content in A543 cells has been previously demonstrated [39]. Elevation of cleaved caspase-3 content is the last cytosolic event preceding apoptosis. Thus, it can be deduced that formulating TQ in a nanostructured system greatly enhances caspase-3 content. Indeed, boosting of cleaved caspase-3 activity by nanostructured systems of anti-tumor agents has been well reported [27]. These results support the observed enhancement of caspase-3 content. Further, it has been evidenced in the literature that TQ has a pro-oxidant property and thus, TQ generates ROS to induce apoptosis within the cancer cells. This induction of apoptosis might follow different molecular pathways, such as activation of Akt followed by conformational alterations of BCL-2 and activation of an apoptotic regulator (Bax), which ultimately induces caspase-dependent apoptosis of cancer cells by the release of cytochrome-c due to the loss of mitochondrial membrane potential [42]. Our findings on ROS generation by the TQ-phytosomes is in agreement to the reports by Park et al., where the authors reported an enhanced level of intracellular ROS in the renal carcinoma cells by the action of the pro-oxidant TQ, which had ultimately enhanced the apoptotic potential of TQ [41].

5. Conclusions

In summary, an optimized TQ-phytosome within the nanometer size range was developed using a Box-Behnken design tool. The spherical phytosomal deliveries were found to release the entrapped TQ in two phases, where the release was distinctly higher than that of the free-TQ suspension. Such improved performance of the TQ-phytosomes provided a 3-fold increase in the cytotoxic potential against A549 cells. Further, the differential role of TQ-phytosomes on A549 cell cycle analysis indicated the increased apoptotic potential of the nanocarrier, which was confirmed by the annexin V staining assay. This increased apoptosis of the cells was further established by the enhancement of caspase-3 expression which increased 2-fold in TQ-phytosomes in comparison with free-TQ treated cells. Additionally, ROS-based activation of Akt, leading to loss of mitochondrial membrane potential, might be another reason for increased apoptotic activity of the TQ–phytosomal treatment. Overall, this phytosomal delivery would be a promising nanocarrier cargo for delivering TQ; however, further extensive studies on in vitro and in vivo experimental models are necessary to establish this platform for effective treatment against lung cancer.

Author Contributions

Conceptualization, N.A.A. and S.M.B.-E.; methodology, U.A.F.; software, N.K.A.; validation, Z.A.A., G.C., A.L.A., and A.F.A.; formal analysis, M.A.A.; investigation, A.L.A.; resources, Z.A.A.; data curation, S.M.B.-E.; writing—original draft preparation, G.C.; writing—review and editing, F.O.A.; visualization, A.F.A.; supervision, O.A.A.A.; project administration, N.A.A.; funding acquisition, U.A.F. All authors have read and agreed to the published version of the manuscript.

Funding

This project was funded by the Deanship of Scientific Research (DSR) at King Abdulaziz University, Jeddah, under grant no. (RG-2–166–41). The authors, therefore, acknowledge with thanks the DSR for technical and financial support.

Conflicts of Interest

The authors declare no conflict of interest. The funders had no role in the design of the study; in the collection, analyses, or interpretation of data; in the writing of the manuscript, or in the decision to publish the results.

References

  1. McMullen, S.; Hess, L.M.; Kim, E.S.; Levy, B.; Mohamed, M.; Waterhouse, D.; Wozniak, A.; Goring, S.; Müller, K.; Muehlenbein, C.; et al. Treatment Decisions for Advanced Non-Squamous Non-Small Cell Lung Cancer: Patient and Physician Perspectives on Maintenance Therapy. Patient 2019, 12, 223–233. [Google Scholar] [CrossRef] [PubMed]
  2. Li, Y.; Fu, J.; Yuan, X.; Hu, C. Simvastatin inhibits the proliferation of A549 lung cancer cells through oxidative stress and up-regulation of SOD2. Pharmazie 2014, 69, 610–614. [Google Scholar] [PubMed]
  3. Walther, U.; Emmrich, K.; Ramer, R.; Mittag, N. Lovastatin lactone elicits human lung cancer cell apoptosis via a COX-2/PPARγ-dependent pathway. Oncotarget 2016, 7, 10345–10362. [Google Scholar] [CrossRef] [PubMed]
  4. Alfaifi, M.Y.; Shati, A.A.; Elbehairi, S.E.I.; Fahmy, U.A.; Alhakamy, N.A.; Md, S. Anti-tumor effect of PEG-coated PLGA nanoparticles of febuxostat on A549 non-small cell lung cancer cells. 3 Biotech 2020, 10, 133. [Google Scholar] [CrossRef]
  5. Lin, J.J.; Ezer, N.; Sigel, K.; Mhango, G.; Wisnivesky, J.P. The Effect of Statins on Survival in Patients with Stage IV Lung Cancer. Lung Cancer 2016, 99, 137–142. [Google Scholar] [CrossRef]
  6. Khader, M.; Eckl, P.M. Thymoquinone: An emerging natural drug with a wide range of medical applications. Iran. J. Basic Med. Sci. 2014, 17, 950–957. [Google Scholar]
  7. Schneider-Stock, R.; Fakhoury, I.H.; Zaki, A.M.; El-Baba, C.O.; Gali-Muhtasib, H.U. Thymoquinone: Fifty years of success in the battle against cancer models. Drug Discov. Today 2014, 19, 18–30. [Google Scholar] [CrossRef]
  8. Gali-Muhtasib, H.; Roessner, A.; Schneider-Stock, R. Thymoquinone: A promising anti-cancer drug from natural sources. Int. J. Biochem. Cell Biol. 2006, 38, 1249–1253. [Google Scholar] [CrossRef]
  9. Samarghandian, S.; Azimi-Nezhad, M.; Farkhondeh, T. Thymoquinone-induced antitumor and apoptosis in human lung adenocarcinoma cells. J. Cell. Physiol. 2019, 234, 10421–10431. [Google Scholar] [CrossRef]
  10. El-Najjar, N.; Chatila, M.; Moukadem, H.; Vuorela, H.; Ocker, M.; Gandesiri, M.; Schneider-Stock, R.; Gali-Muhtasib, H. Reactive oxygen species mediate thymoquinone-induced apoptosis and activate ERK and JNK signaling. Apoptosis 2010, 15, 183–195. [Google Scholar] [CrossRef]
  11. Kalam, M.A.; Raish, M.; Ahmed, A.; Alkharfy, K.M.; Mohsin, K.; Alshamsan, A.; Al-Jenoobi, F.I.; Al-Mohizea, A.M.; Shakeel, F. Oral bioavailability enhancement and hepatoprotective effects of thymoquinone by self-nanoemulsifying drug delivery system. Mater. Sci. Eng. C 2017, 76, 319–329. [Google Scholar] [CrossRef] [PubMed]
  12. Odeh, F.; Ismail, S.I.; Abu-Dahab, R.; Mahmoud, I.S.; Al Bawab, A. Thymoquinone in liposomes: A study of loading efficiency and biological activity towards breast cancer. Drug Deliv. 2012, 19, 371–377. [Google Scholar] [CrossRef] [PubMed]
  13. Rajput, S.; Puvvada, N.; Kumar, B.N.P.; Sarkar, S.; Konar, S.; Bharti, R.; Dey, G.; Mazumdar, A.; Pathak, A.; Fisher, P.B.; et al. Overcoming Akt Induced Therapeutic Resistance in Breast Cancer through siRNA and Thymoquinone Encapsulated Multilamellar Gold Niosomes. Mol. Pharm. 2015, 12, 4214–4225. [Google Scholar] [CrossRef] [PubMed]
  14. Ng, W.K.; Yazan, L.S.; Yap, L.H.; Hafiza, W.A.G.W.N.; How, C.W.; Abdullah, R. Thymoquinone-loaded nanostructured lipid carrier exhibited cytotoxicity towards breast cancer cell lines (MDA-MB-231 and MCF-7) and cervical cancer cell lines (HeLa and SiHa). Biomed Res. Int. 2015, 2015, 263131. [Google Scholar] [CrossRef]
  15. Soni, P.; Kaur, J.; Tikoo, K. Dual drug-loaded paclitaxel–thymoquinone nanoparticles for effective breast cancer therapy. J. Nanoparticle Res. 2015, 17, 1–12. [Google Scholar] [CrossRef]
  16. Bhattacharya, S.; Ahir, M.; Patra, P.; Mukherjee, S.; Ghosh, S.; Mazumdar, M.; Chattopadhyay, S.; Das, T.; Chattopadhyay, D.; Adhikary, A. PEGylated-thymoquinone-nanoparticle mediated retardation of breast cancer cell migration by deregulation of cytoskeletal actin polymerization through miR-34a. Biomaterials 2015, 51, 91–107. [Google Scholar] [CrossRef]
  17. Alhakamy, N.A.; Fahmy, U.A.; Badr-Eldin, S.M.; Ahmed, O.A.A.; Asfour, H.Z.; Aldawsari, H.M.; Algandaby, M.M.; Eid, B.G.; Abdel-Naim, A.B.; Awan, Z.A.; et al. Optimized Icariin Phytosomes Exhibit Enhanced Cytotoxicity and Apoptosis-Inducing Activities in Ovarian Cancer Cells. Pharmaceutics 2020, 12, 346. [Google Scholar] [CrossRef]
  18. Gnananath, K.; Sri Nataraj, K.; Ganga Rao, B. Phospholipid Complex Technique for Superior Bioavailability of Phytoconstituents. Adv. Pharm. Bull. 2017, 7, 35–42. [Google Scholar] [CrossRef]
  19. Bombardelli, E.; Spelta, M. Phospholipid-polyphenol complexes: A new concept in skin care ingredients. Cosmet. Toilet. 1991, 106, 69–76. [Google Scholar]
  20. Lu, M.; Qiu, Q.; Luo, X.; Liu, X.; Sun, J.; Wang, C.; Lin, X.; Deng, Y.; Song, Y. Phyto-phospholipid complexes (phytosomes): A novel strategy to improve the bioavailability of active constituents. Asian J. Pharm. Sci. 2019, 14, 265–274. [Google Scholar] [CrossRef]
  21. Azeez, N.A.; Deepa, V.S.; Sivapriya, V. Phytosomes: Emergent promising nano vesicular drug delivery system for targeted tumor therapy. Adv. Nat. Sci. Nanosci. Nanotechnol. 2018, 9, 33001. [Google Scholar] [CrossRef]
  22. Xu, L.; Xu, D.; Li, Z.; Gao, Y.; Chen, H. Synthesis and potent cytotoxic activity of a novel diosgenin derivative and its phytosomes against lung cancer cells. Beilstein J. Nanotechnol. 2019, 10, 1933–1942. [Google Scholar] [CrossRef] [PubMed]
  23. Aboul-Enein, H.Y.; Abou-Basha, L.I. Simple HPLC Method for the Determination of Thymoquinone in Black Seed Oil (Nigella Sativa Linn). J. Liq. Chromatogr. 1995, 18, 895–902. [Google Scholar] [CrossRef]
  24. Anwar, M.M.; Abd El-Karim, S.S.; Mahmoud, A.H.; Amr, A.E.-G.E.; Al-Omar, M.A. A Comparative Study of the Anticancer Activity and PARP-1 Inhibiting Effect of Benzofuran-Pyrazole Scaffold and Its Nano-Sized Particles in Human Breast Cancer Cells. Molecules 2019, 24, 2413. [Google Scholar] [CrossRef] [PubMed]
  25. Hu, G.; Cun, X.; Ruan, S.; Shi, K.; Wang, Y.; Kuang, Q.; Hu, C.; Xiao, W.; He, Q.; Gao, H. Utilizing G2/M retention effect to enhance tumor accumulation of active targeting nanoparticles. Sci. Rep. 2016, 6, 27669. [Google Scholar] [CrossRef]
  26. Hsiao, K.Y.; Wu, Y.-J.; Liu, Z.N.; Chuang, C.W.; Huang, H.H.; Kuo, S.M. Anticancer Effects of Sinulariolide-Conjugated Hyaluronan Nanoparticles on Lung Adenocarcinoma Cells. Molecules 2016, 21, 297. [Google Scholar] [CrossRef]
  27. Czarnomysy, R.; Surażyński, A.; Muszynska, A.; Gornowicz, A.; Bielawska, A.; Bielawski, K. A novel series of pyrazole-platinum(II) complexes as potential anti-cancer agents that induce cell cycle arrest and apoptosis in breast cancer cells. J. Enzyme Inhib. Med. Chem. 2018, 33, 1006–1023. [Google Scholar] [CrossRef]
  28. Chen, X.; Zhong, Z.; Xu, Z.; Chen, L.; Wang, Y. 2′,7′-Dichlorodihydrofluorescein as a fluorescent probe for reactive oxygen species measurement: Forty years of application and controversy. Free Radic. Res. 2010, 44, 587–604. [Google Scholar] [CrossRef]
  29. Ramkumar, M.; Rajasankar, S.; Gobi, V.V.; Dhanalakshmi, C.; Manivasagam, T.; Justin Thenmozhi, A.; Essa, M.M.; Kalandar, A.; Chidambaram, R. Neuroprotective effect of Demethoxycurcumin, a natural derivative of Curcumin on rotenone induced neurotoxicity in SH-SY 5Y Neuroblastoma cells. BMC Complement. Altern. Med. 2017, 17, 1–11. [Google Scholar]
  30. Jiang, Y.; Yu, X.; Su, C.; Zhao, L.; Shi, Y. Chitosan nanoparticles induced the antitumor effect in hepatocellular carcinoma cells by regulating ROS-mediated mitochondrial damage and endoplasmic reticulum stress. Artif. Cells Nanomed. Biotechnol. 2019, 47, 747–756. [Google Scholar] [CrossRef]
  31. Dubey, V.; Mishra, D.; Dutta, T.; Nahar, M.; Saraf, D.K.; Jain, N.K. Dermal and transdermal delivery of an anti-psoriatic agent via ethanolic liposomes. J. Control. Release 2007, 123, 148–154. [Google Scholar] [CrossRef] [PubMed]
  32. Saoji, S.D.; Raut, N.A.; Dhore, P.W.; Borkar, C.D.; Popielarczyk, M.; Dave, V.S. Preparation and Evaluation of Phospholipid-Based Complex of Standardized Centella Extract (SCE) for the Enhanced Delivery of Phytoconstituents. AAPS J. 2016, 18, 102–114. [Google Scholar] [CrossRef] [PubMed]
  33. Hou, Z.; Li, Y.; Huang, Y.; Zhou, C.; Lin, J.; Wang, Y.; Cui, F.; Zhou, S.; Jia, M.; Ye, S.; et al. Phytosomes loaded with mitomycin C-soybean phosphatidylcholine complex developed for drug delivery. Mol. Pharm. 2013, 10, 90–101. [Google Scholar] [CrossRef] [PubMed]
  34. Acharya, B.R.; Chatterjee, A.; Ganguli, A.; Bhattacharya, S.; Chakrabarti, G. Thymoquinone inhibits microtubule polymerization by tubulin binding and causes mitotic arrest following apoptosis in A549 cells. Biochimie 2014, 97, 78–91. [Google Scholar] [CrossRef]
  35. Cheng, H.; Wang, L.; Mollica, M.; Re, A.T.; Wu, S.; Zuo, L. Nitric oxide in cancer metastasis. Cancer Lett. 2014, 353, 1–7. [Google Scholar] [CrossRef]
  36. Fahmy, U.A.; Badr-Eldin, S.M.; Ahmed, O.A.A.; Aldawsari, H.M.; Tima, S.; Asfour, H.Z.; Al-Rabia, M.W.; Negm, A.A.; Sultan, M.H.; Madkhali, O.A.A.; et al. Intranasal Niosomal In Situ Gel as a Promising Approach for Enhancing Flibanserin Bioavailability and Brain Delivery: In Vitro Optimization and Ex Vivo/In Vivo Evaluation. Pharmaceutics 2020, 12, 485. [Google Scholar] [CrossRef]
  37. Ahmed, O.A.A.; Fahmy, U.A.; Bakhaidar, R.; El-Moselhy, M.A.; Okbazghi, S.Z.; Ahmed, A.-S.F.; Hammad, A.S.A.; Alhakamy, N.A. Omega-3 Self-Nanoemulsion Role in Gastroprotection against Indomethacin-Induced Gastric Injury in Rats. Pharmaceutics 2020, 12, 140. [Google Scholar] [CrossRef]
  38. Alhakamy, N.A.; Badr-Eldin, S.M.; Ahmed, O.A.A.; Asfour, H.Z.; Aldawsari, H.M.; Algandaby, M.M.; Eid, B.G.; Abdel-Naim, A.B.; Awan, Z.A.; Alghaith, A.F.; et al. Piceatannol-Loaded Emulsomes Exhibit Enhanced Cytostatic and Apoptotic Activities in Colon Cancer Cells. Antioxidants 2020, 9, 419. [Google Scholar] [CrossRef]
  39. Alhakamy, N.A.; Ahmed, O.A.A.; Kurakula, M.; Caruso, G.; Caraci, F.; Asfour, H.Z.; Alfarsi, A.; Eid, B.G.; Mohamed, A.I.; Alruwaili, N.K.; et al. Chitosan-Based Microparticles Enhance Ellagic Acid’s Colon Targeting and Proapoptotic Activity. Pharmaceutics 2020, 12, 652. [Google Scholar] [CrossRef]
  40. Park, E.J.; Chauhan, A.K.; Min, K.J.; Park, D.C.; Kwon, T.K. Thymoquinone induces apoptosis through downregulation of c-FLIP and Bcl-2 in Renal carcinoma Caki cells. Oncol. Rep. 2016, 36, 2261–2267. [Google Scholar] [CrossRef]
  41. Gali-Muhtasib, H.U.; Abou Kheir, W.G.; Kheir, L.A.; Darwiche, N.; Crooks, P.A. Molecular pathway for thymoquinone-induced cell-cycle arrest and apoptosis in neoplastic keratinocytes. Anticancer. Drugs 2004, 15, 389–399. [Google Scholar] [CrossRef] [PubMed]
  42. Aggarwal, V.; Tuli, H.S.; Varol, A.; Thakral, F.; Yerer, M.B.; Sak, K.; Varol, M.; Jain, A.; Khan, M.A.; Sethi, G. Role of reactive oxygen species in cancer progression: Molecular mechanisms and recent advancements. Biomolecules 2019, 9, 735. [Google Scholar] [CrossRef] [PubMed]
Figure 1. Three-dimensional (AC) and contour (DF) plots for the effect of TQ to phospholipid molar ratio (A), temperature process (B), and reflux time on the vesicle size of TQ-phytosomes.
Pharmaceutics 12 00761 g001
Figure 2. TEM micrographs of the optimized TQ-phytosomes.
Pharmaceutics 12 00761 g002
Figure 3. Fourier-transform infrared (FTIR) of TQ, Phospholipon® 90H, and TQ-phytosomes.
Pharmaceutics 12 00761 g003
Figure 4. In vitro release profiles TQ from optimized TQ-phytosomes and suspension in phosphate buffer saline (PBS) (pH 7.4) at 37 ± 0.5 °C (results are presented as mean ± SD, n = 3).
Pharmaceutics 12 00761 g004
Figure 5. (A) Representation of cytotoxicity of free-TQ, blank-phytosomes, and TQ-phytosomes in A549 cells. (B) Representation of cytotoxicity of free-TQ, blank-phytosomes, and TQ-phytosomes in EA.hy926. # represents significant difference from free-TQ (p < 0.05)) whereas $ represents significant difference from free-TQ (p < 0.05).
Pharmaceutics 12 00761 g005
Figure 6. Flow cytometric analysis of free-TQ, blank-phytosomes, and TQ-phytosomes on the cell cycle distribution of A549 cells. * represents significant difference from control (p < 0.05), # represents significant difference from free-TQ (p < 0.05) whereas $ represents significant difference from free-TQ (p < 0.05).
Pharmaceutics 12 00761 g006
Figure 7. (AD)Apoptotic and necrotic assessment of free-TQ, blank-phytosomes, and TQ-phytosomes in A549 cells. The cells were exposed to the samples for 24 h and stained with annexin-V/FITC and propidium iodide and are plotted. (E) Representation of A549 cell death following apoptotic and necrotic assay by cytometric analysis after annexin V staining. * represents significant difference from control (p < 0.05), # represents significant difference from free-TQ (p < 0.05), whereas $ represents significant difference from free-TQ (p < 0.05).
Pharmaceutics 12 00761 g007
Figure 8. Analysis ofcaspase-3 content on A549 cells following exposure of free-TQ, blank-phytosomes, and TQ-phytosomes. * represents significant difference from control (p < 0.05), # represents significant difference from free-TQ (p < 0.05), whereas $ represents significant difference from free-TQ (p < 0.05).
Pharmaceutics 12 00761 g008
Figure 9. Representation of fluorescence intensity following free-TQ, blank-phytosomes, and TQ-phytosome-induced generation of intracellular reactive oxygen species in A549 cells. * represents significant difference from control (p < 0.05), # represents significant difference from free-TQ (p < 0.05), whereas $ represents significant difference from free-TQ (p < 0.05).
Pharmaceutics 12 00761 g009
Table 1. Independent variable levels, their combination, and the measured response for thymoquinone (TQ)–phytosome experimental runs prepared according to a Box-Behnken design.
Run NumberIndependent VariablesDependent Variable
A (Mole/Mole)B (°C)C (h)Y (nm)
R11:350.002.0080.7
R21:365.001.0054.9
R31:350.002.0082.2
R41:350.002.0081.7
R51:365.003.0064.7
R61:335.001.00112.8
R71:335.003.00114.7
R81:150.003.0071.8
R91:350.002.0082.2
R101:550.003.00101.8
R111:565.002.0069.7
R121:135.002.0098.8
R131:550.001.0095.2
R141:535.002.00129.9
R151:165.002.0043.7
R161:350.002.0079.8
R171:150.001.0060.4
Independent variableLevels
Low (−1)Medium (0)High (1)
(0)(−1)(+1)
TQ to phospholipid molar ratio (A)1:11:31:5
Process temperature (°C, B)355065
Reflux time (h, C)123
Dependent variableGoal
Vesicle Size (Y, nm)Minimize
Table 2. Data for actual and fitted values of mean vesicle size.
RunMean Vesicle Size (nm)
Actual ValuesPredicted ValuesResidual% Error
R180.781.32−0.620.76%
R254.953.191.713.21%
R382.281.320.881.08%
R481.781.320.380.47%
R564.764.560.140.22%
R6112.8112.94−0.140.12%
R7114.7116.41−1.711.47%
R871.871.97−0.170.24%
R982.281.320.881.08%
R10101.8100.051.751.75%
R1169.771.59−1.892.64%
R1298.896.911.891.95%
R1395.295.020.180.19%
R14129.9129.94−0.040.03%
R1543.743.660.040.09%
R1679.881.32−1.521.87%
R1760.462.15−1.752.82%
Table 3. Analysis of variance output for the effect of independent variables on vesicle size.
SourceSum of SquaresDegree(s) of FreedomMean SquareF-Valuep-Value
Model8309.9059923.323273.803<0.0001 *
A-PL1857.45111857.451550.811<0.0001 *
B-Temp.6227.2816227.2801846.644<0.0001 *
C-Time110.26131110.26132.6970.0007 *
AB6.502516.5031.9280.2075
AC5.7615.7601.7080.2325
BC15.6025115.6034.6270.0485 *
20.07673710.0770.0230.8843
279.30779179.30823.5180.0019 *
25.23463215.2351.5520.2529
Residual23.605573.372
Lack of Fit19.217536.4065.8390.0606
Pure Error4.38841.097
Cor Total8333.51116
* Significant at p < 0.05.
Table 4. Optimized independent variables and predicted response.
FactorOptimized Level/Predicted Response
IndependentA1:1.4
B64.83
C1.82
DependentY (nm)43.67

