Formulation and Characterisation of a Combination Captopril and Hydrochlorothiazide Microparticulate Dosage Form


Abstract
:
1. Introduction
2. Materials and Methods
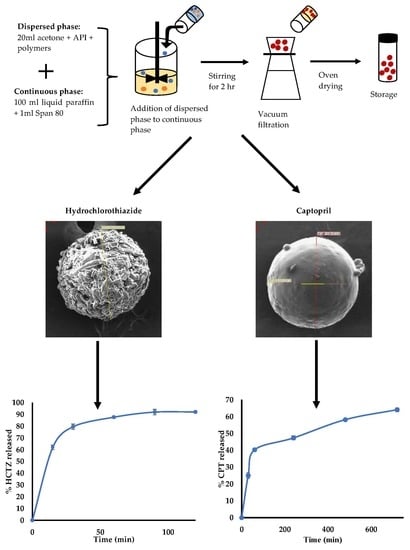
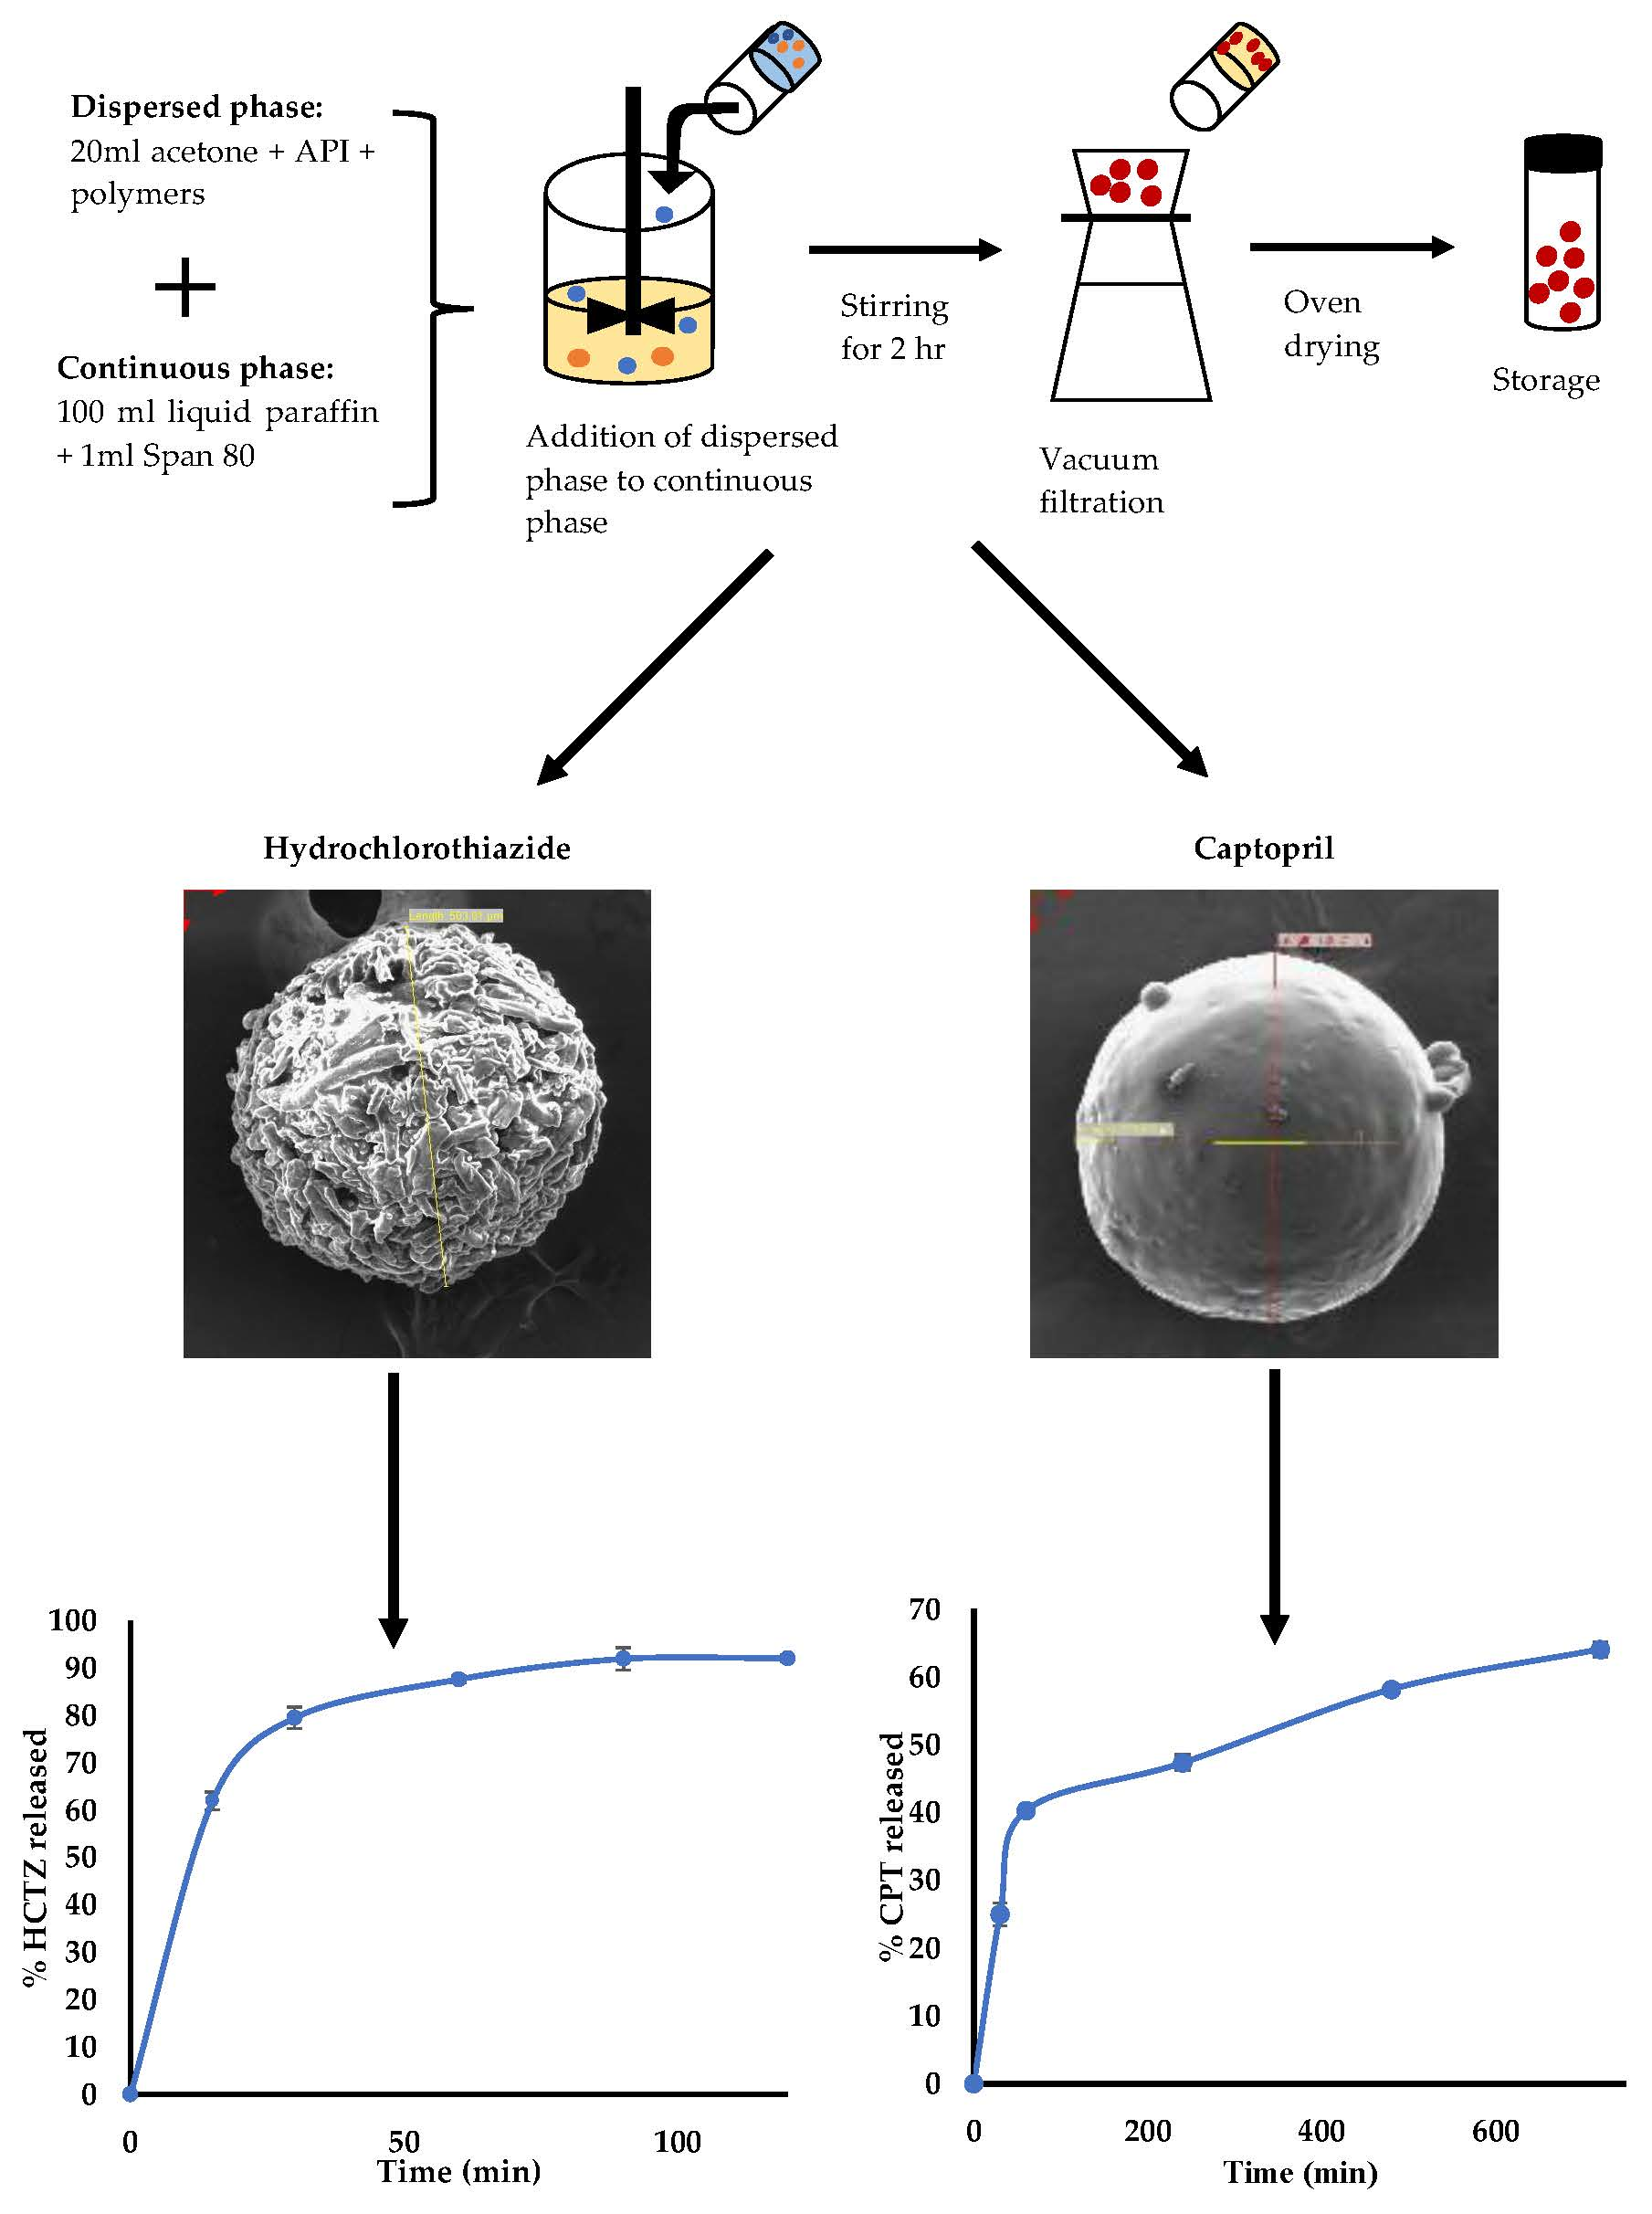
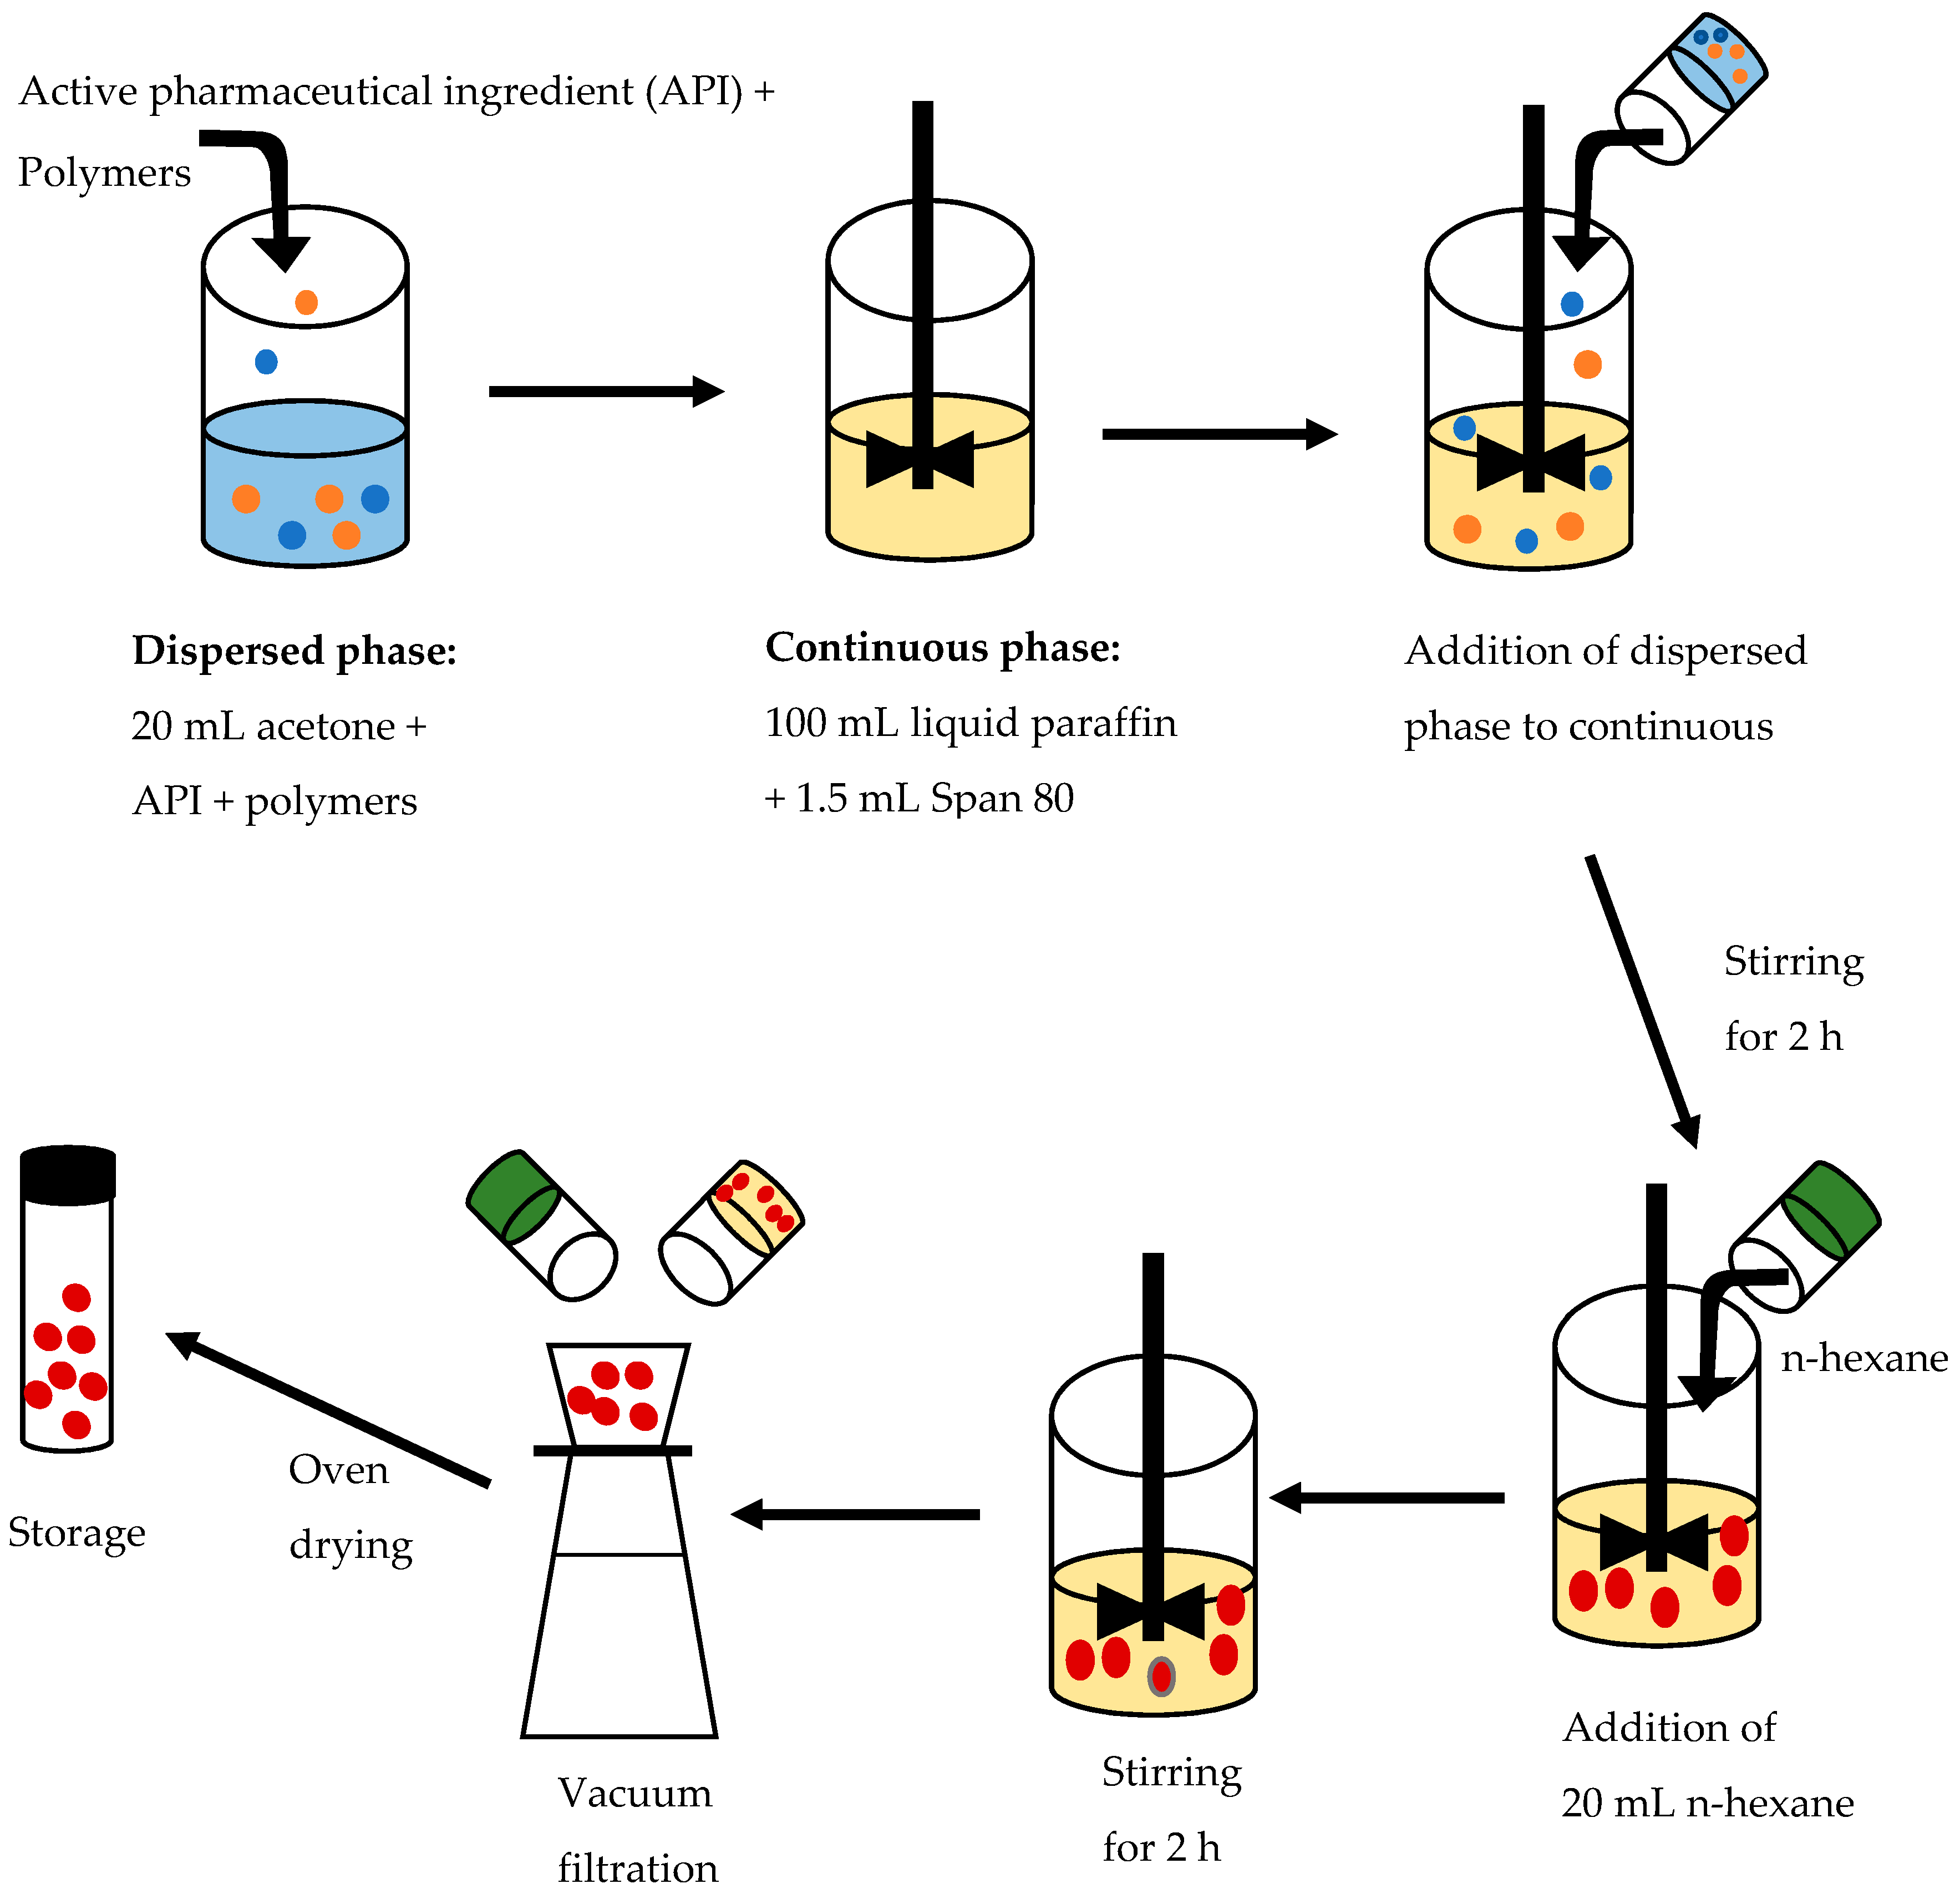
2.1. Manufacture of Microparticles
2.1.1. Manufacture of HCTZ Microparticles
2.1.2. Manufacture of CPT Microparticles
2.2. Characterisation
2.2.1. Encapsulation Efficiency
2.2.2. In Vitro Release
2.2.3. Powder X-ray Diffraction (PXRD)
2.2.4. Differential Scanning Calorimetry (DSC)
2.2.5. Fourier Transform Infrared Spectroscopy (FTIR)
2.2.6. Scanning Electron Microscopy (SEM)
2.2.7. Mathematical Modelling of In Vitro Release
3. Results and Discussion
3.1. Manufacture of Microparticles
3.1.1. Manufacture of HCTZ Microparticles
3.1.2. Manufacture of CPT Microparticles
3.1.3. Formulation Optimisation
3.2. Characterisation
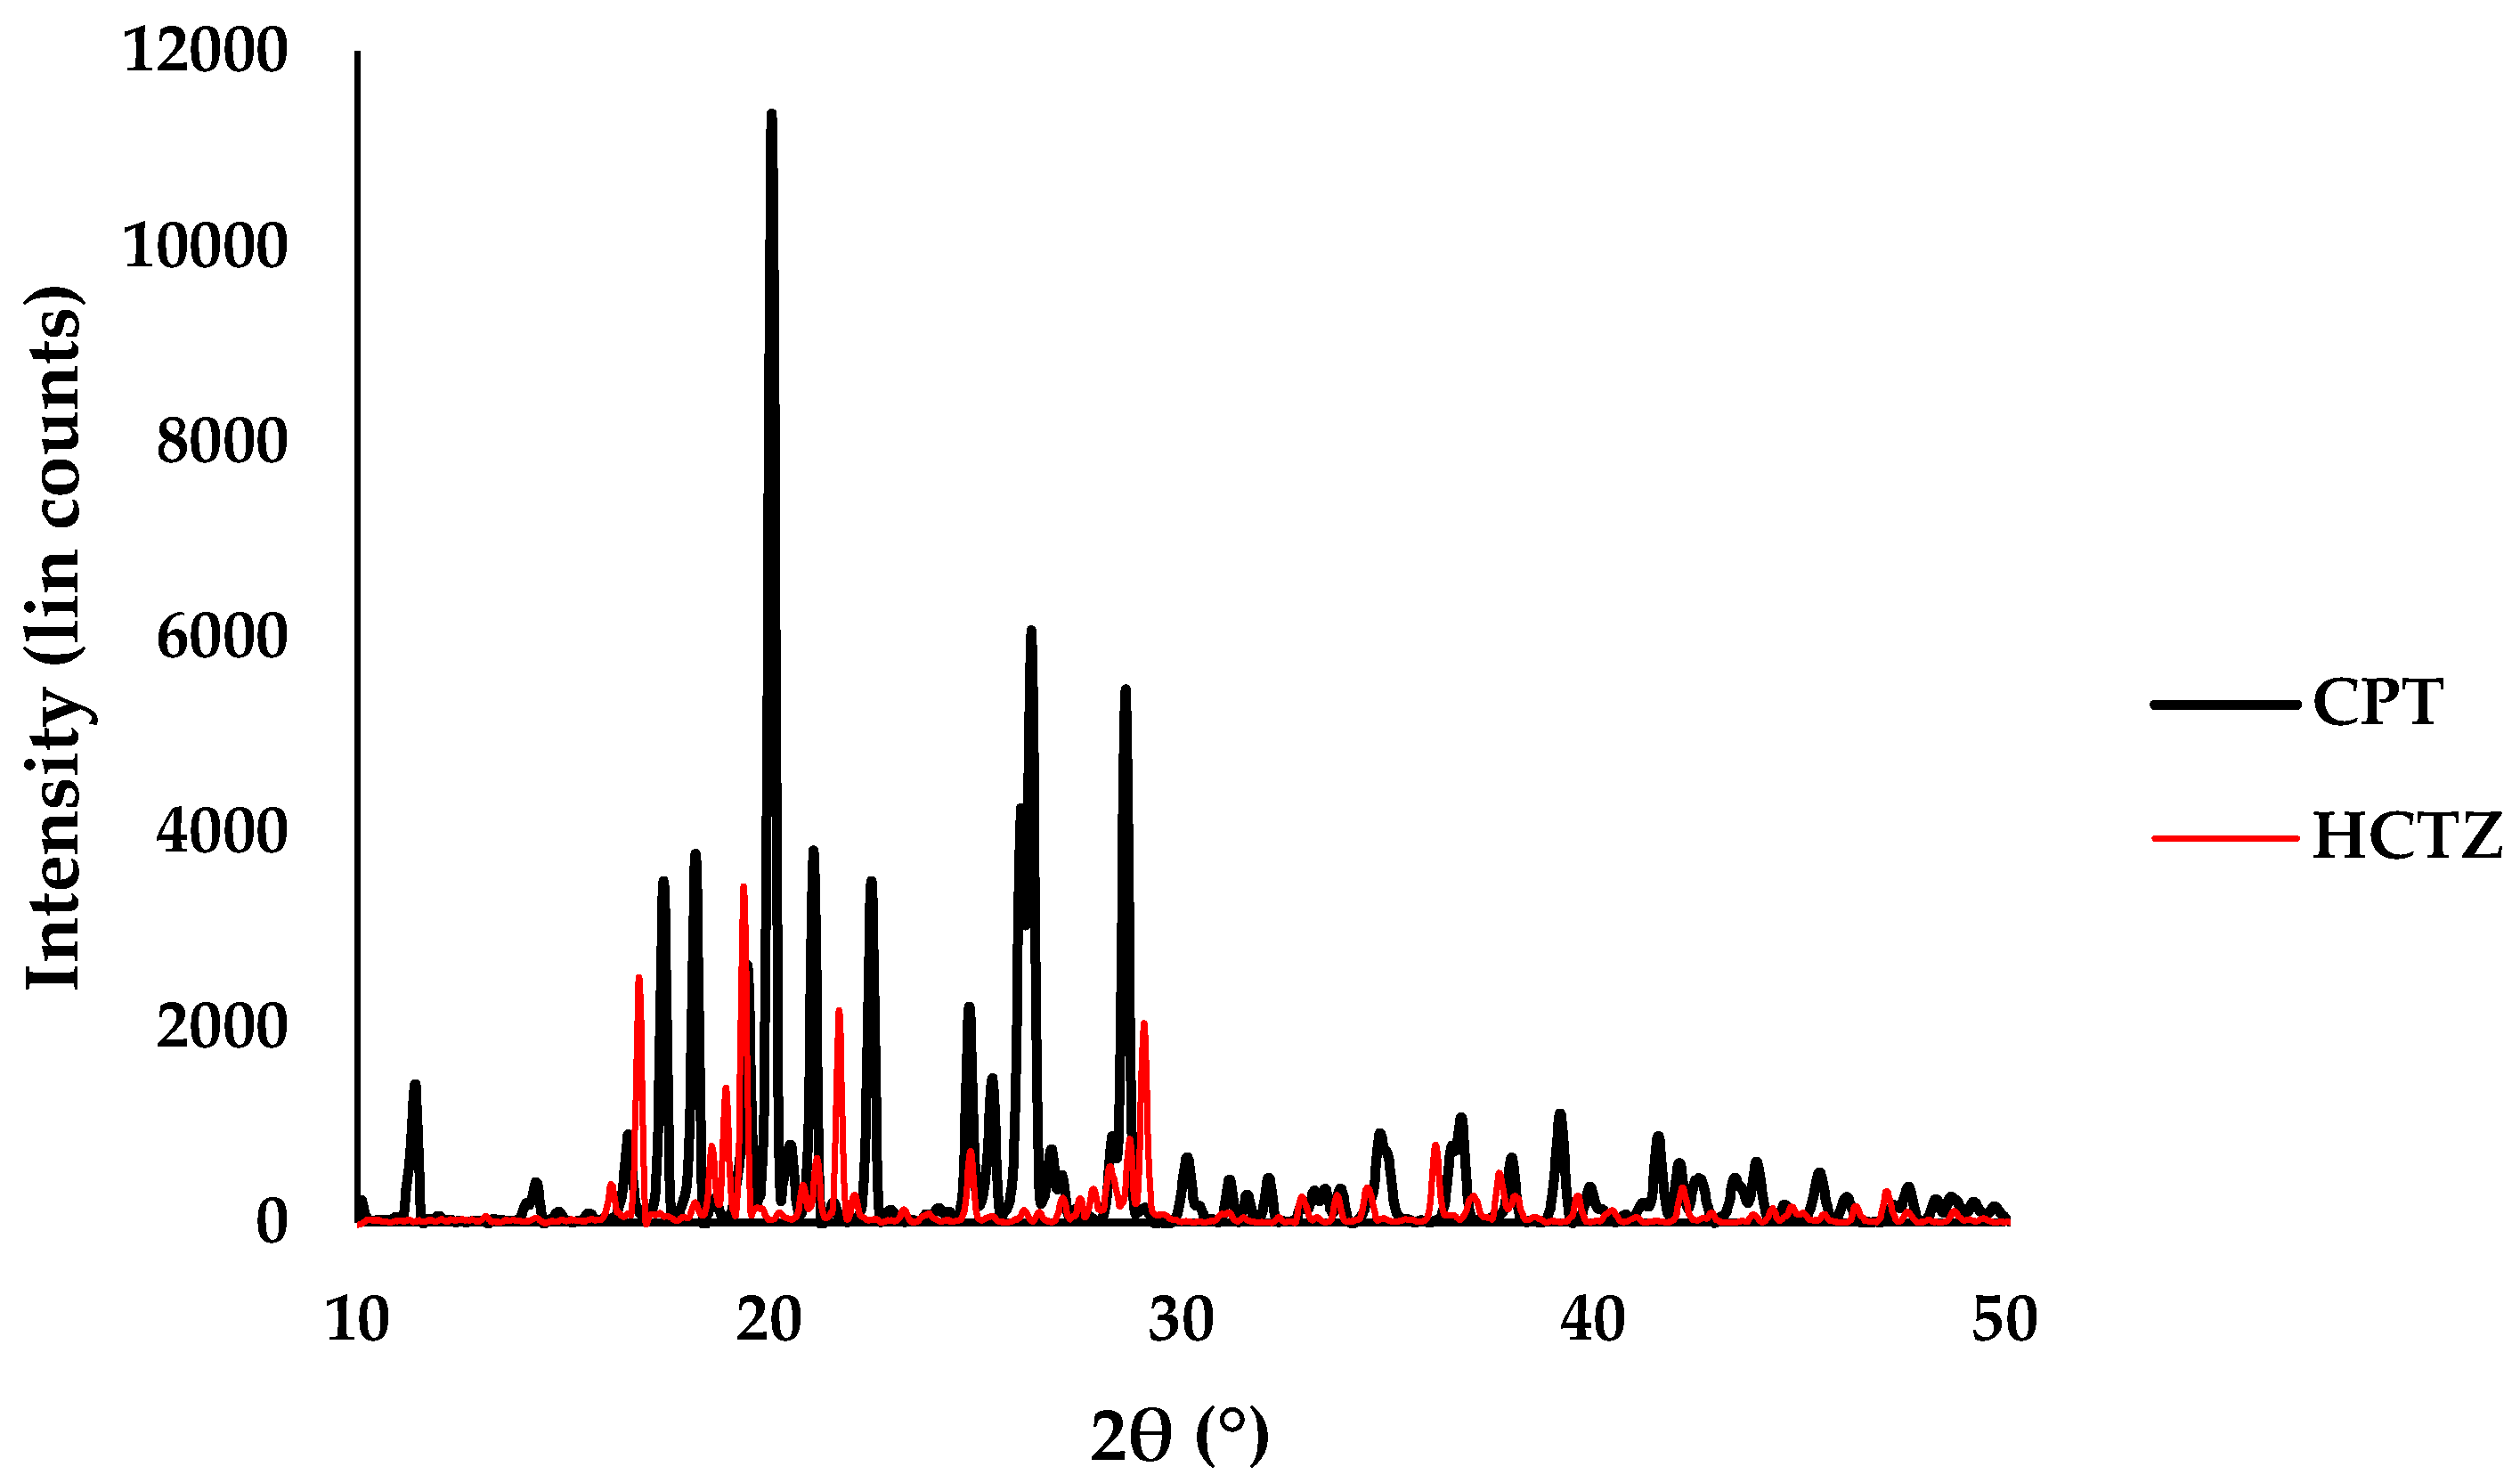
3.2.1. Powder X-ray Diffraction (XRD)
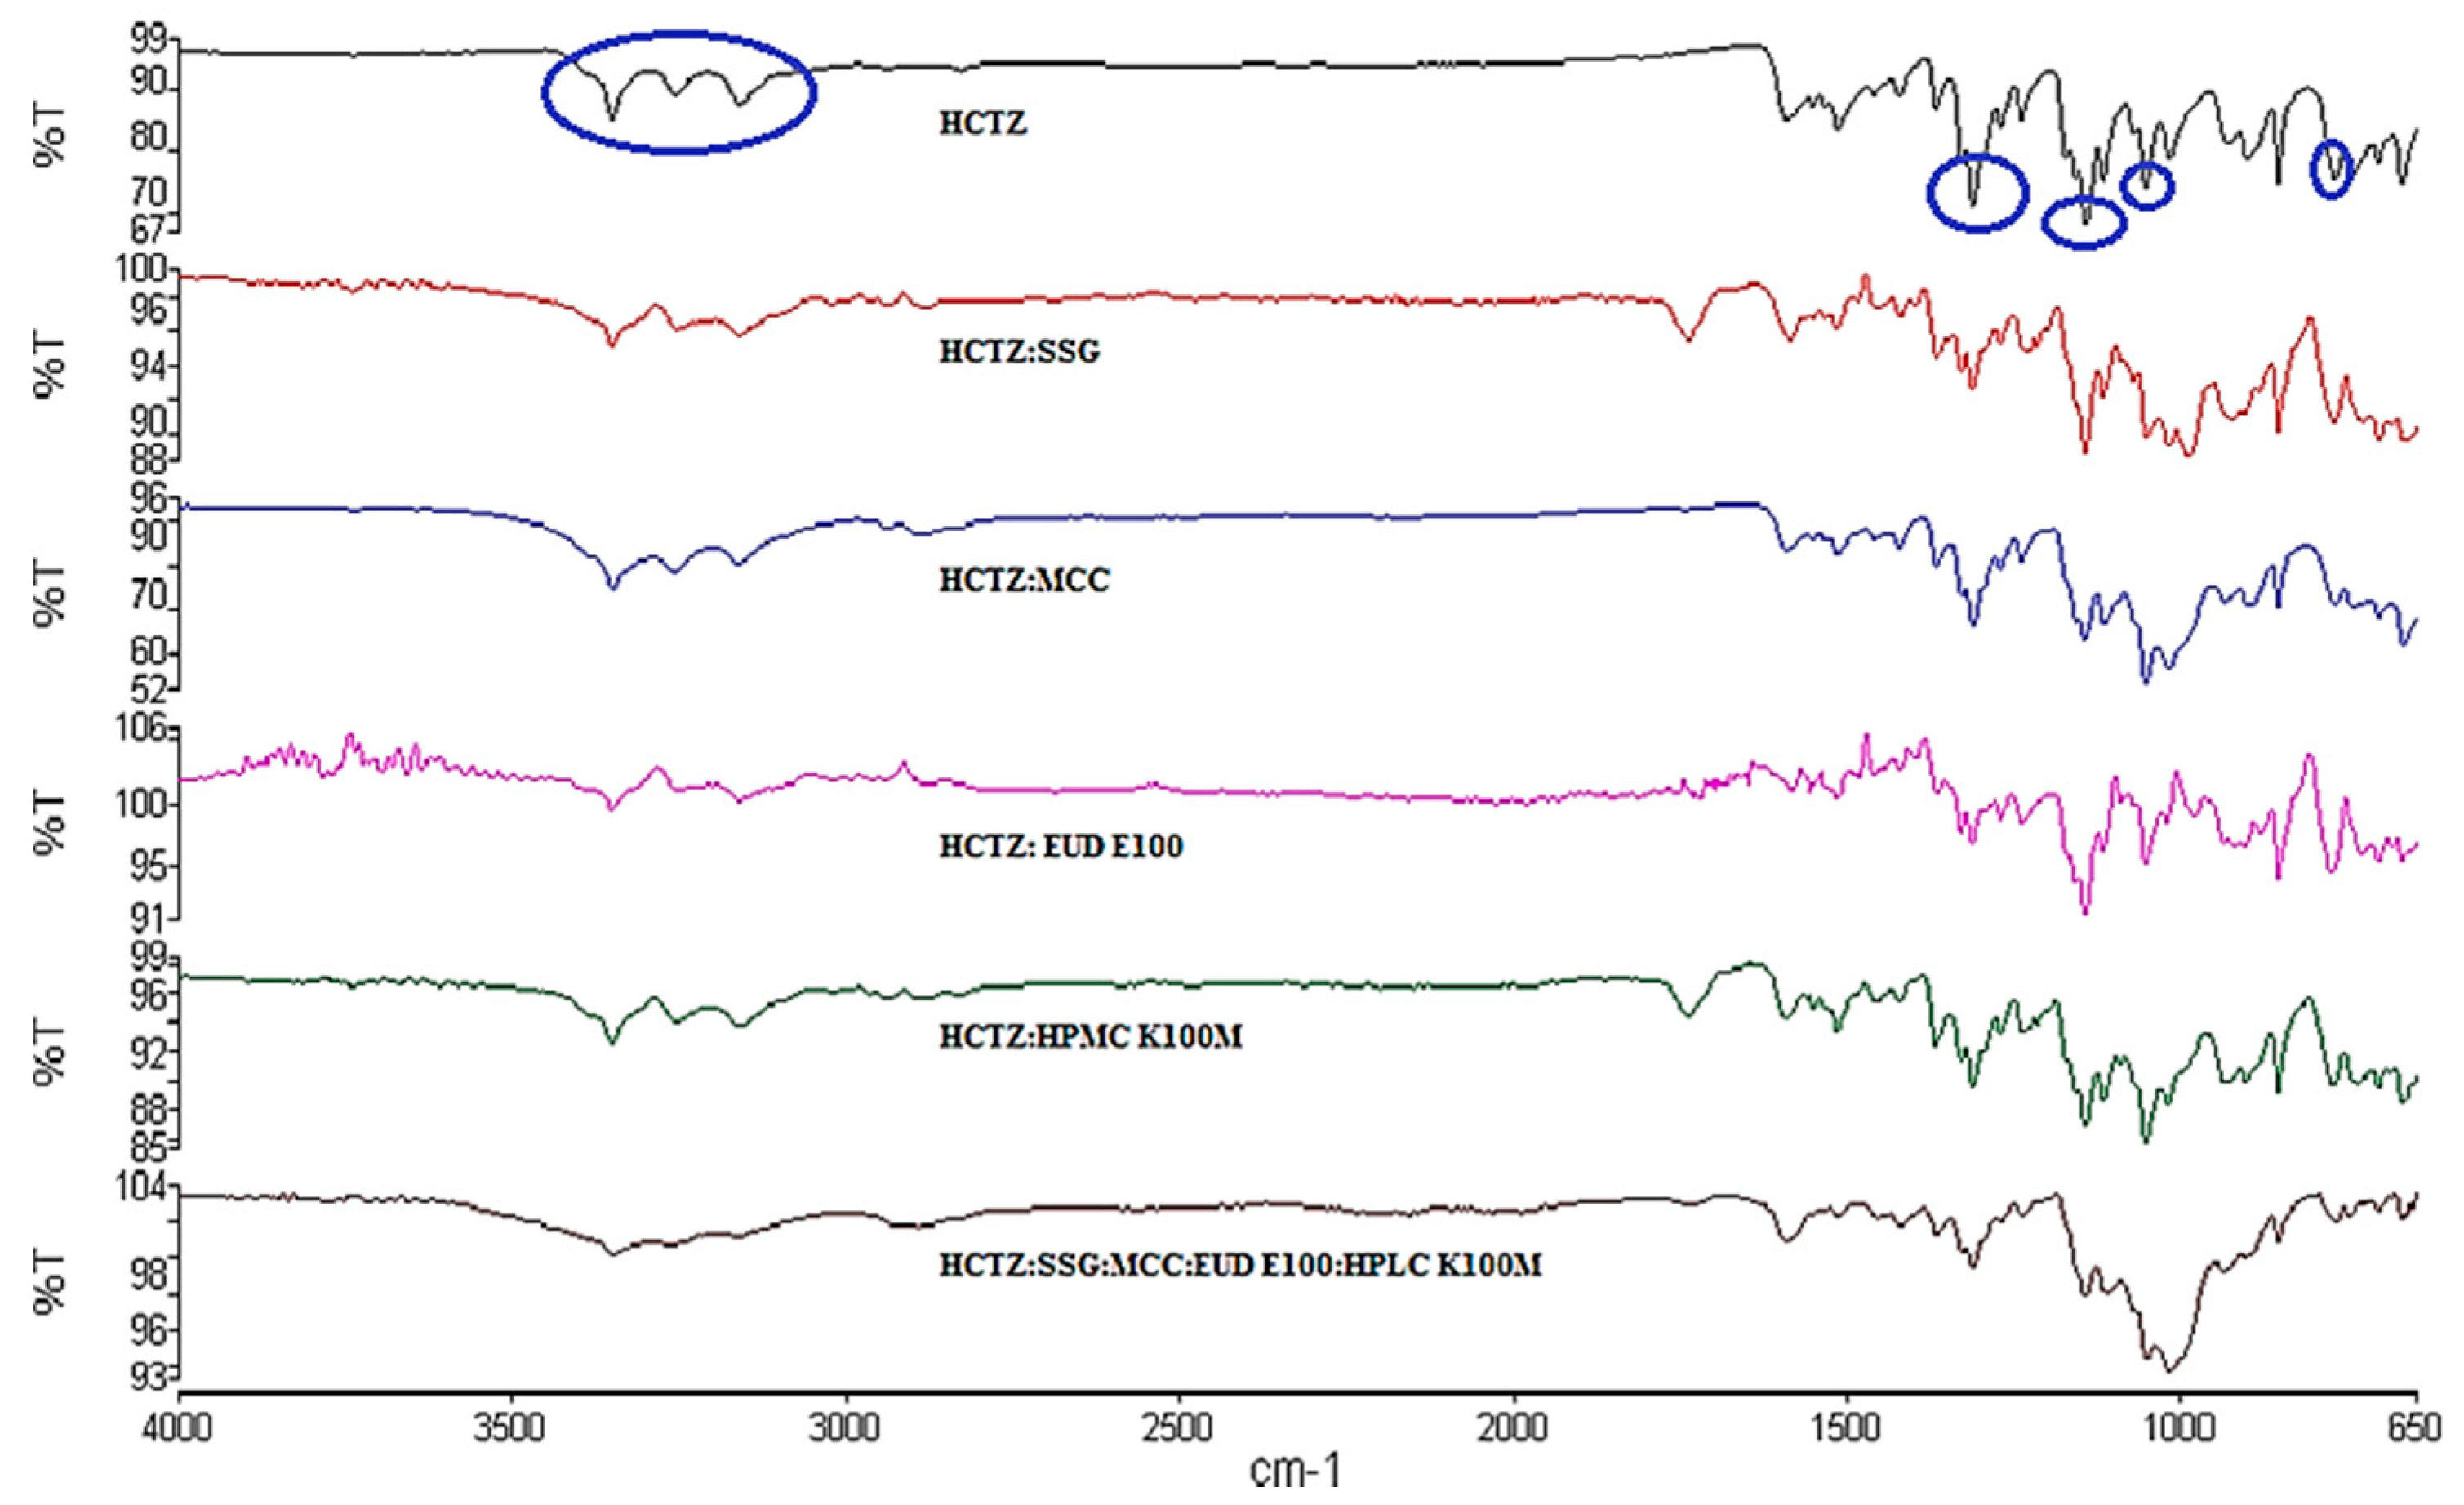
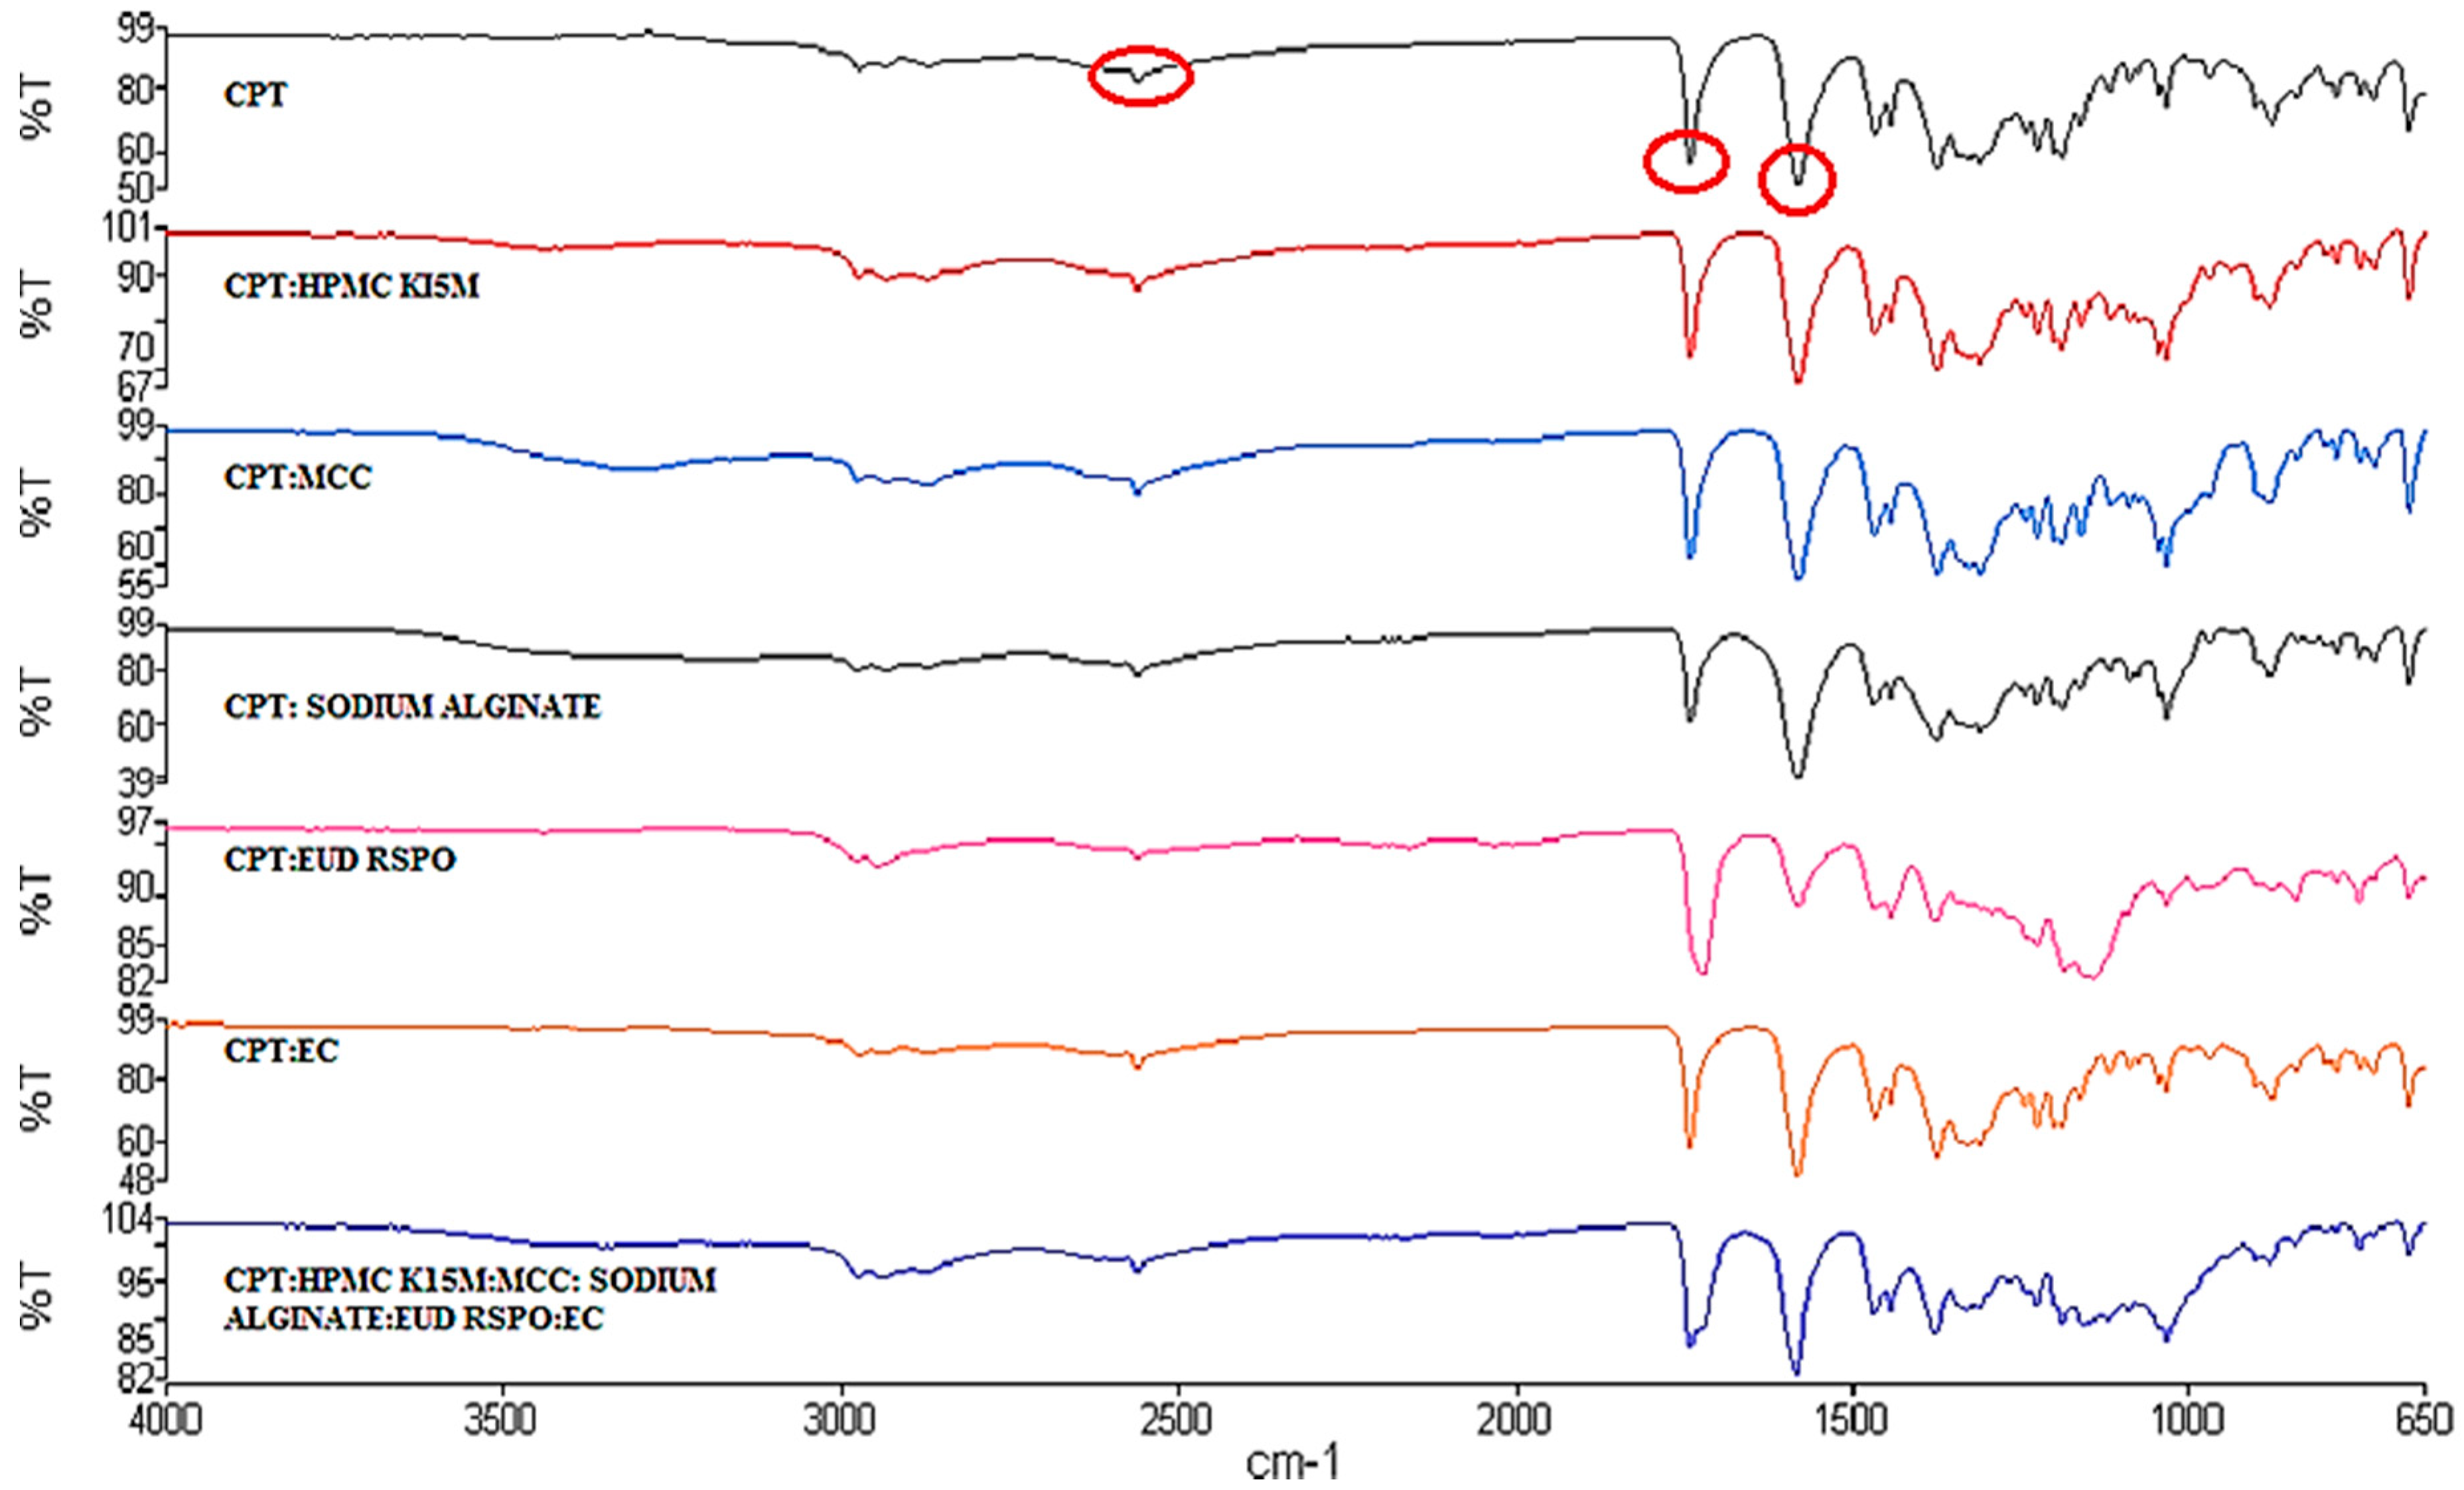
3.2.2. FTIR
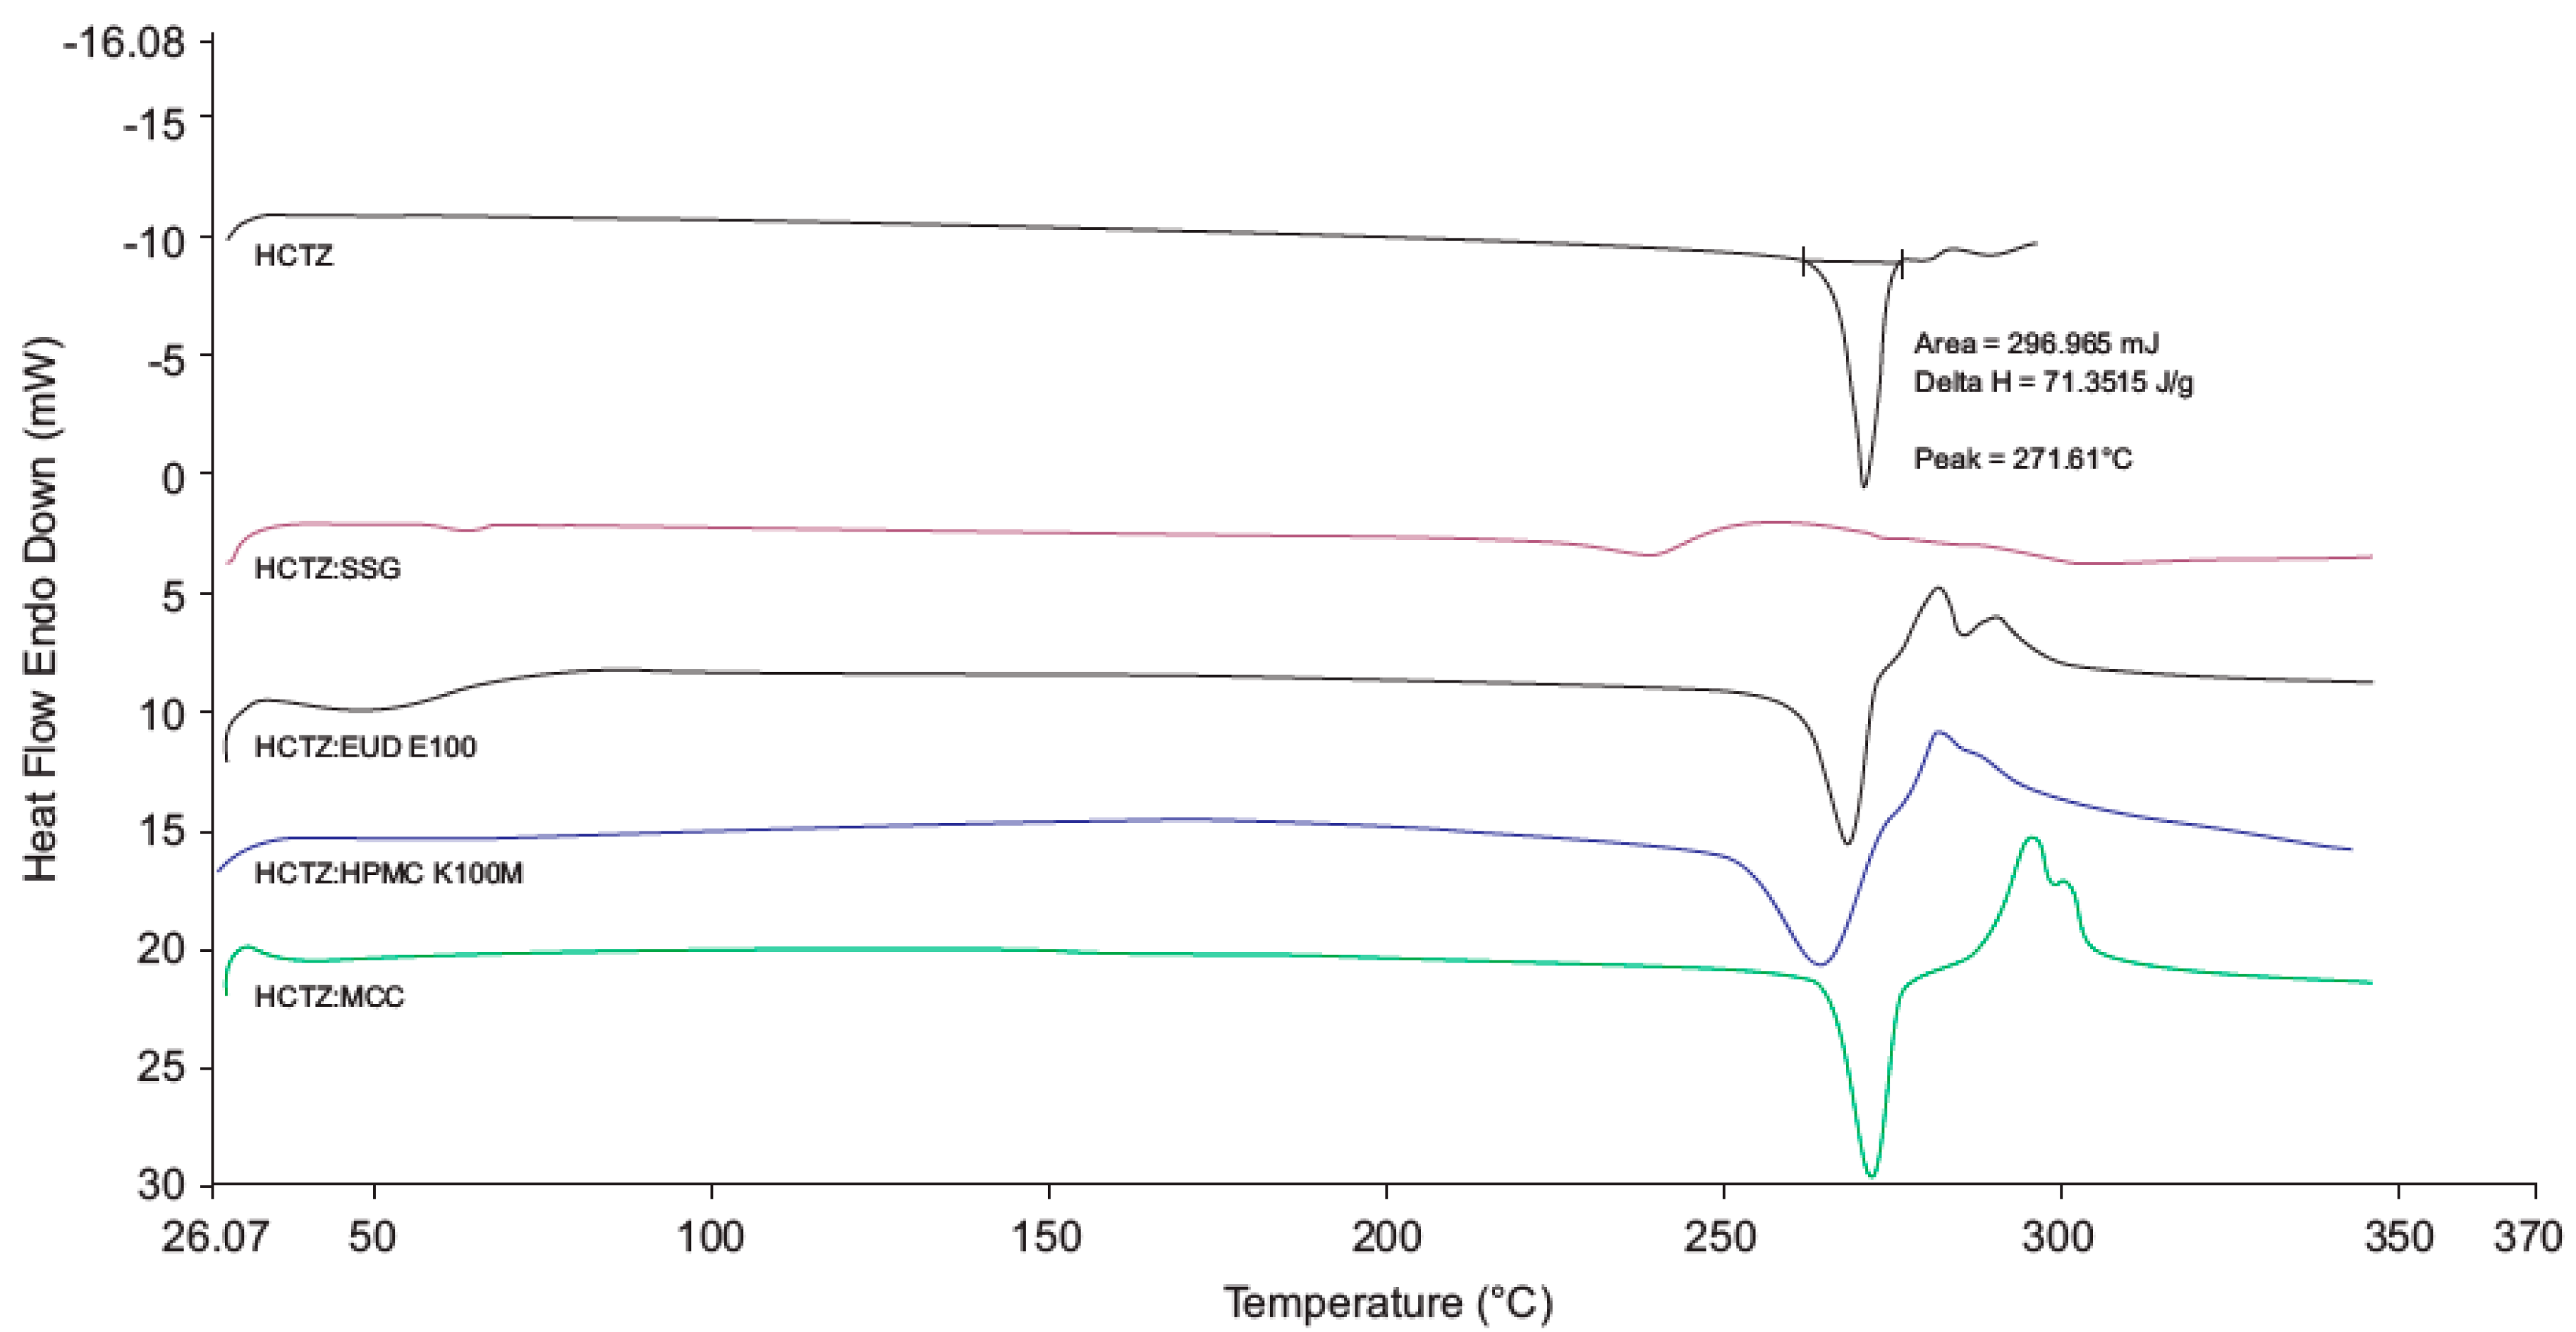
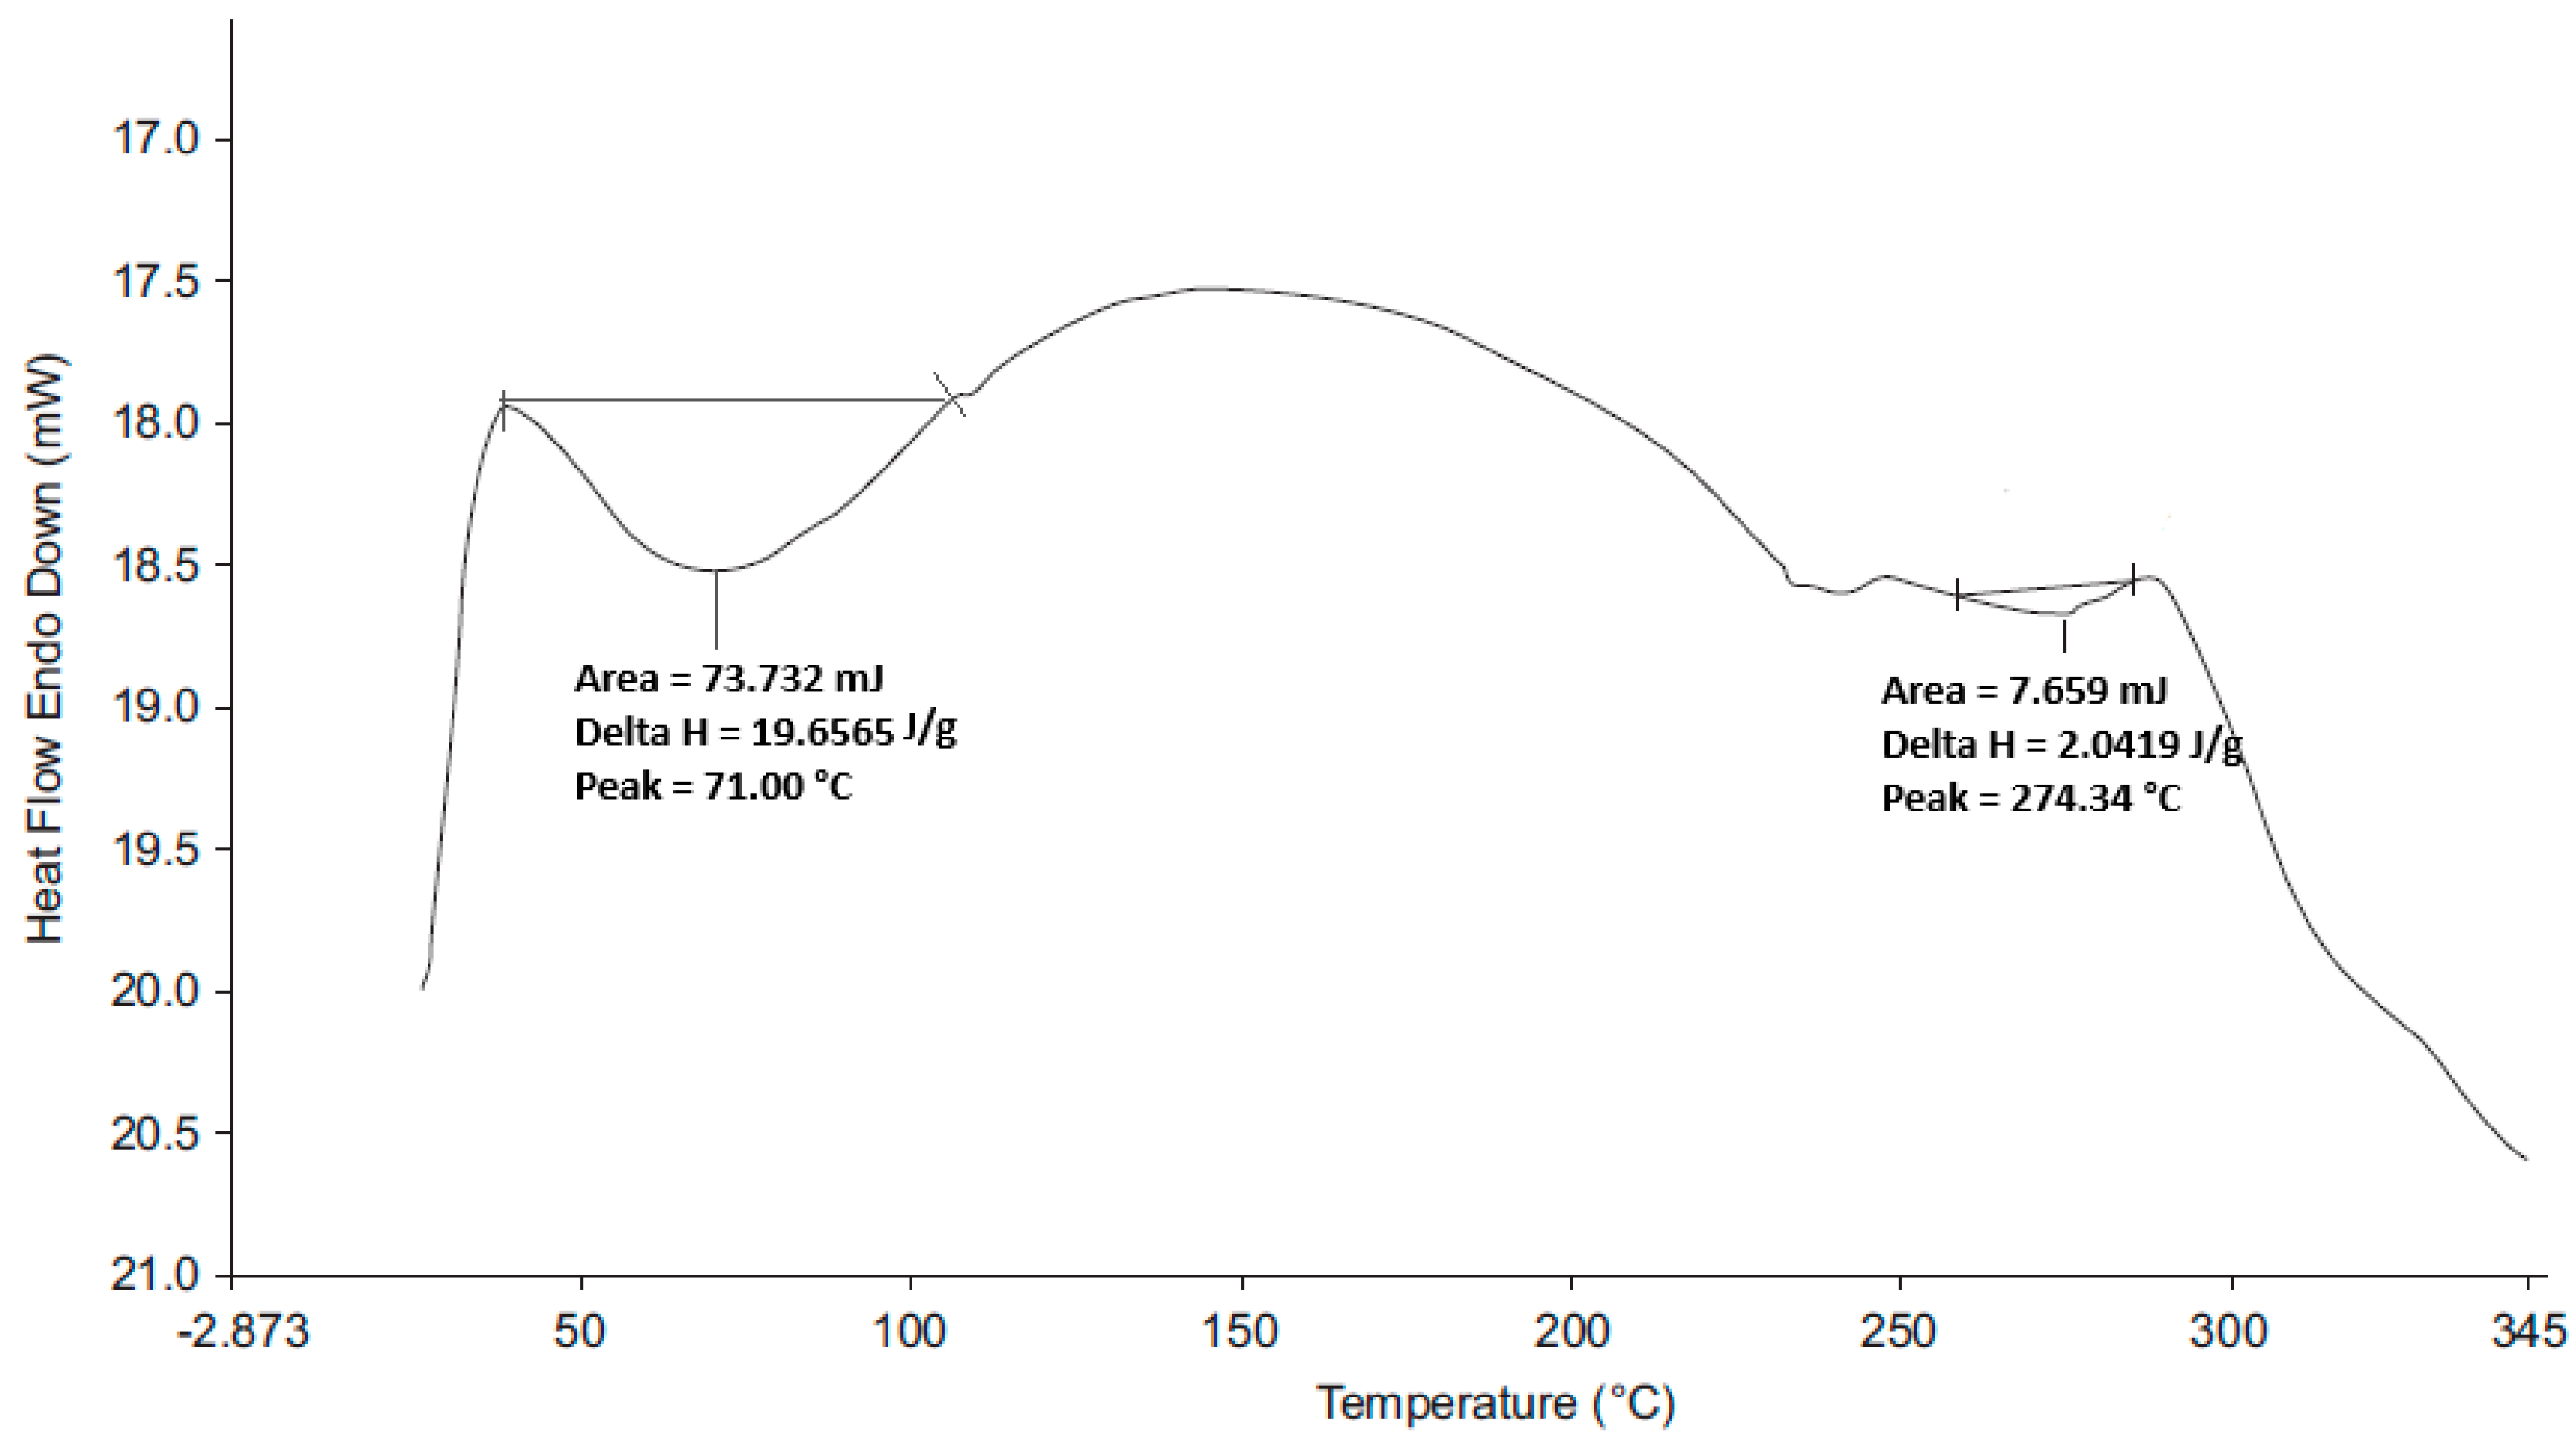
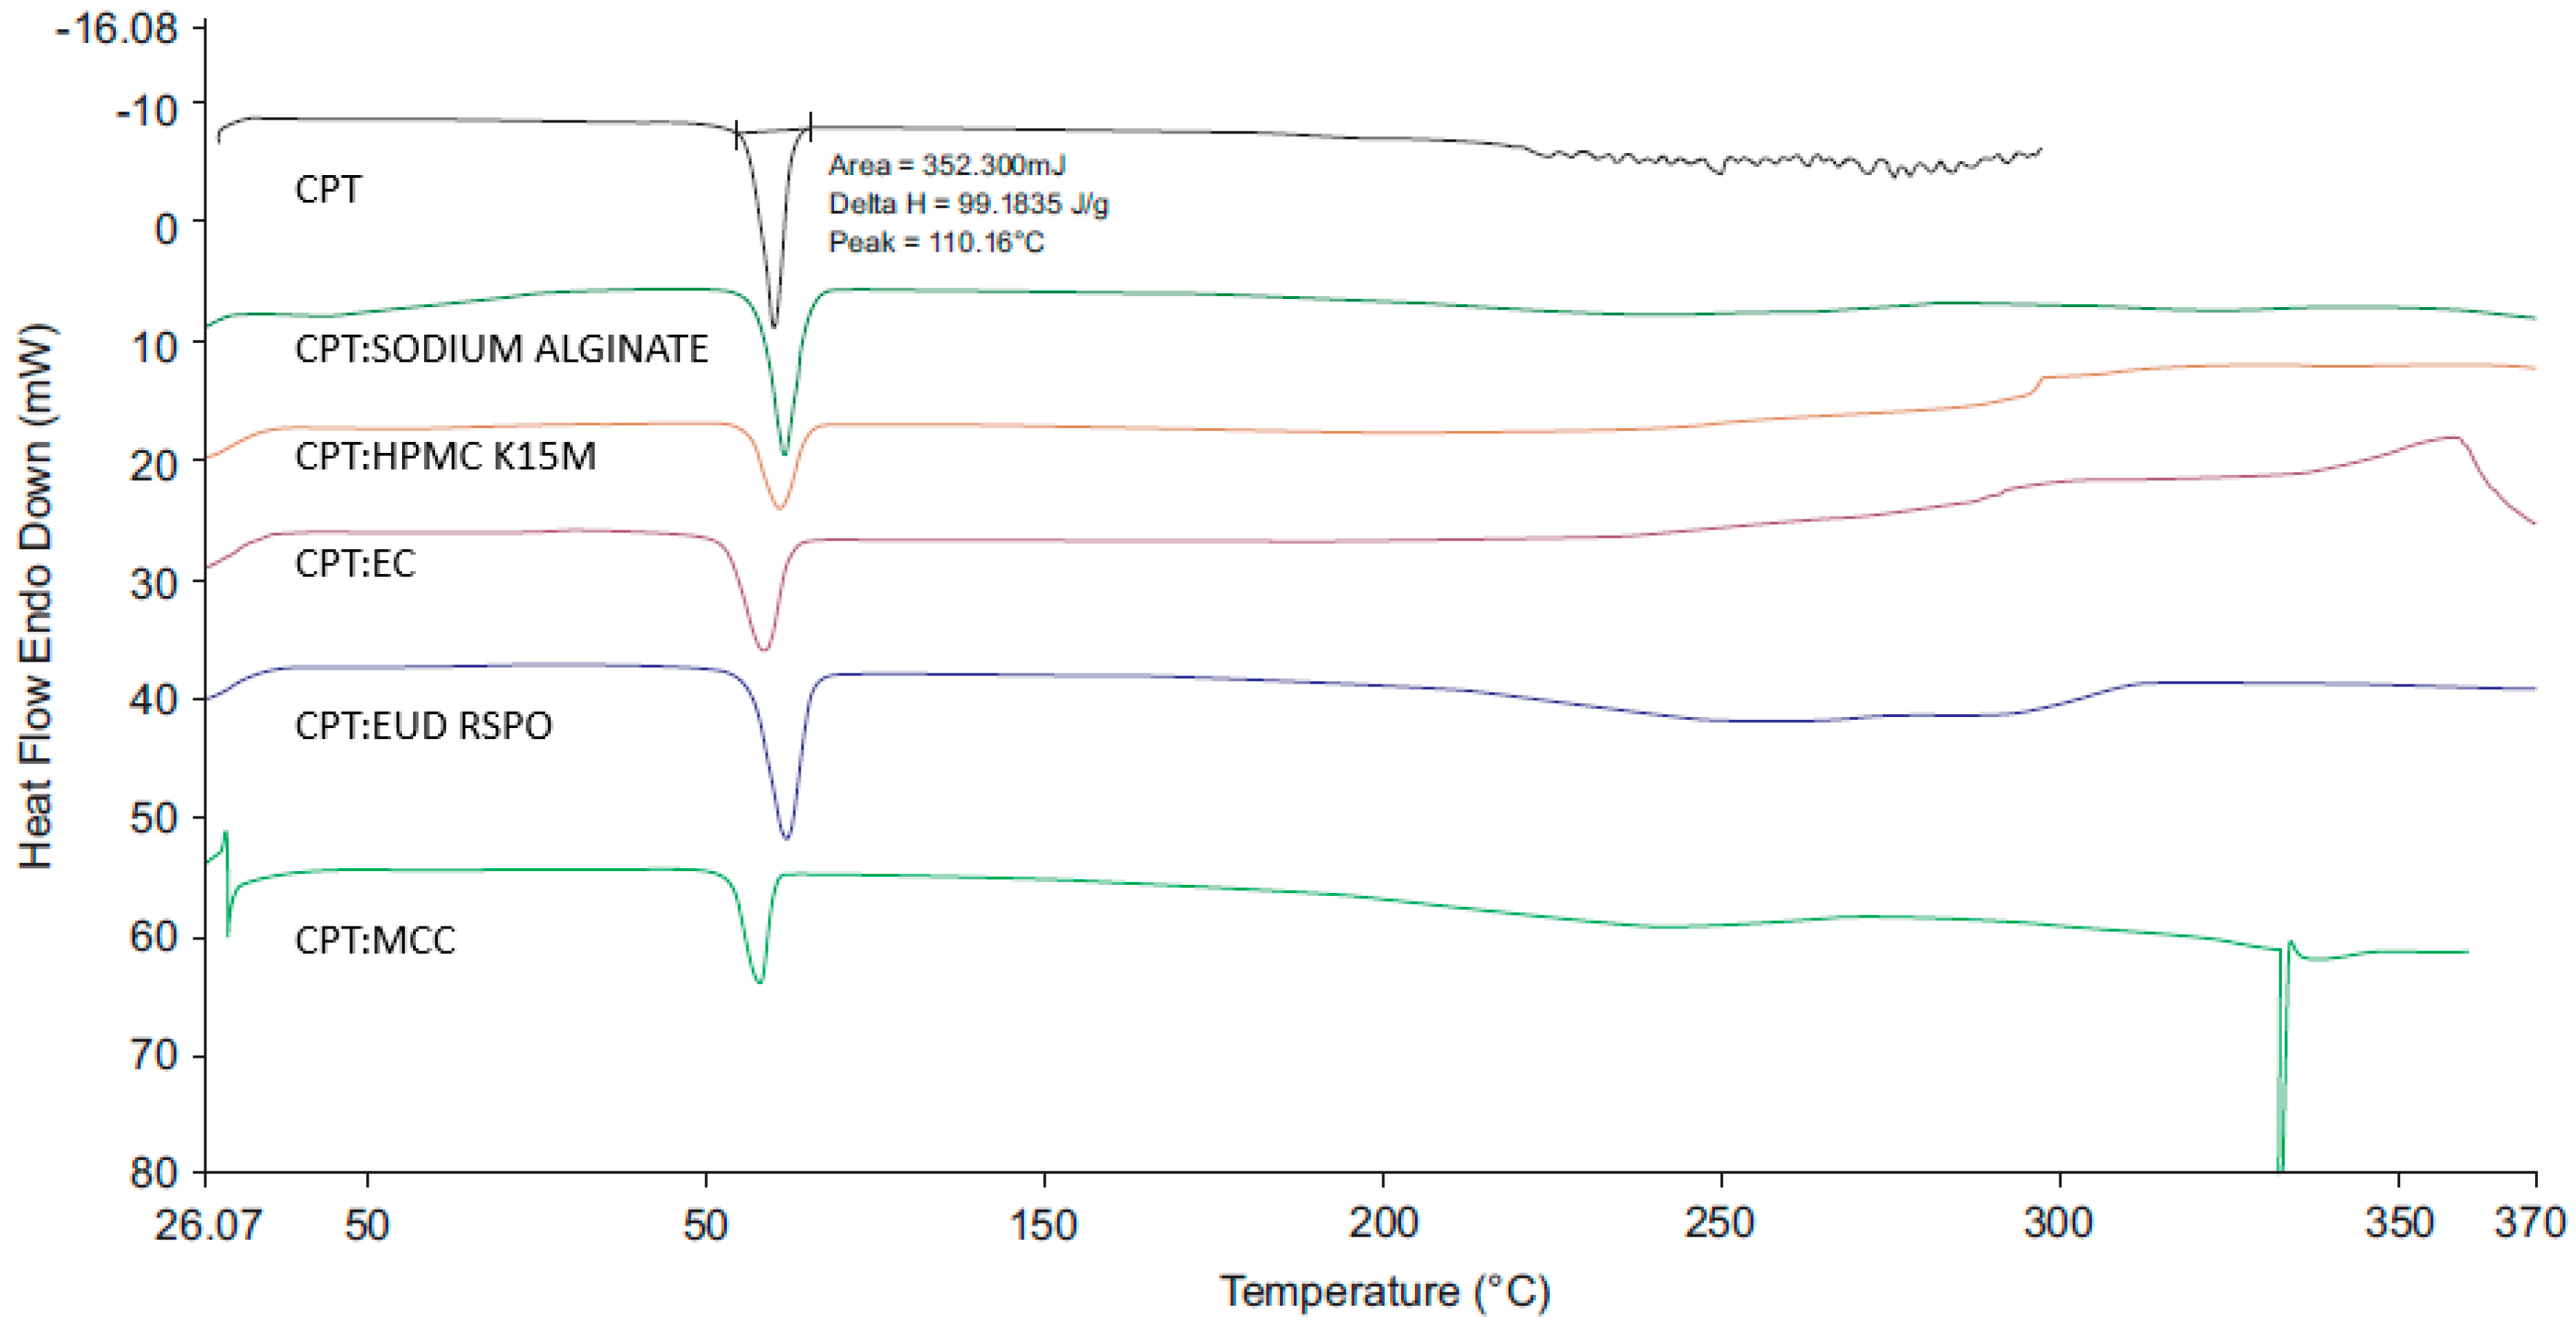
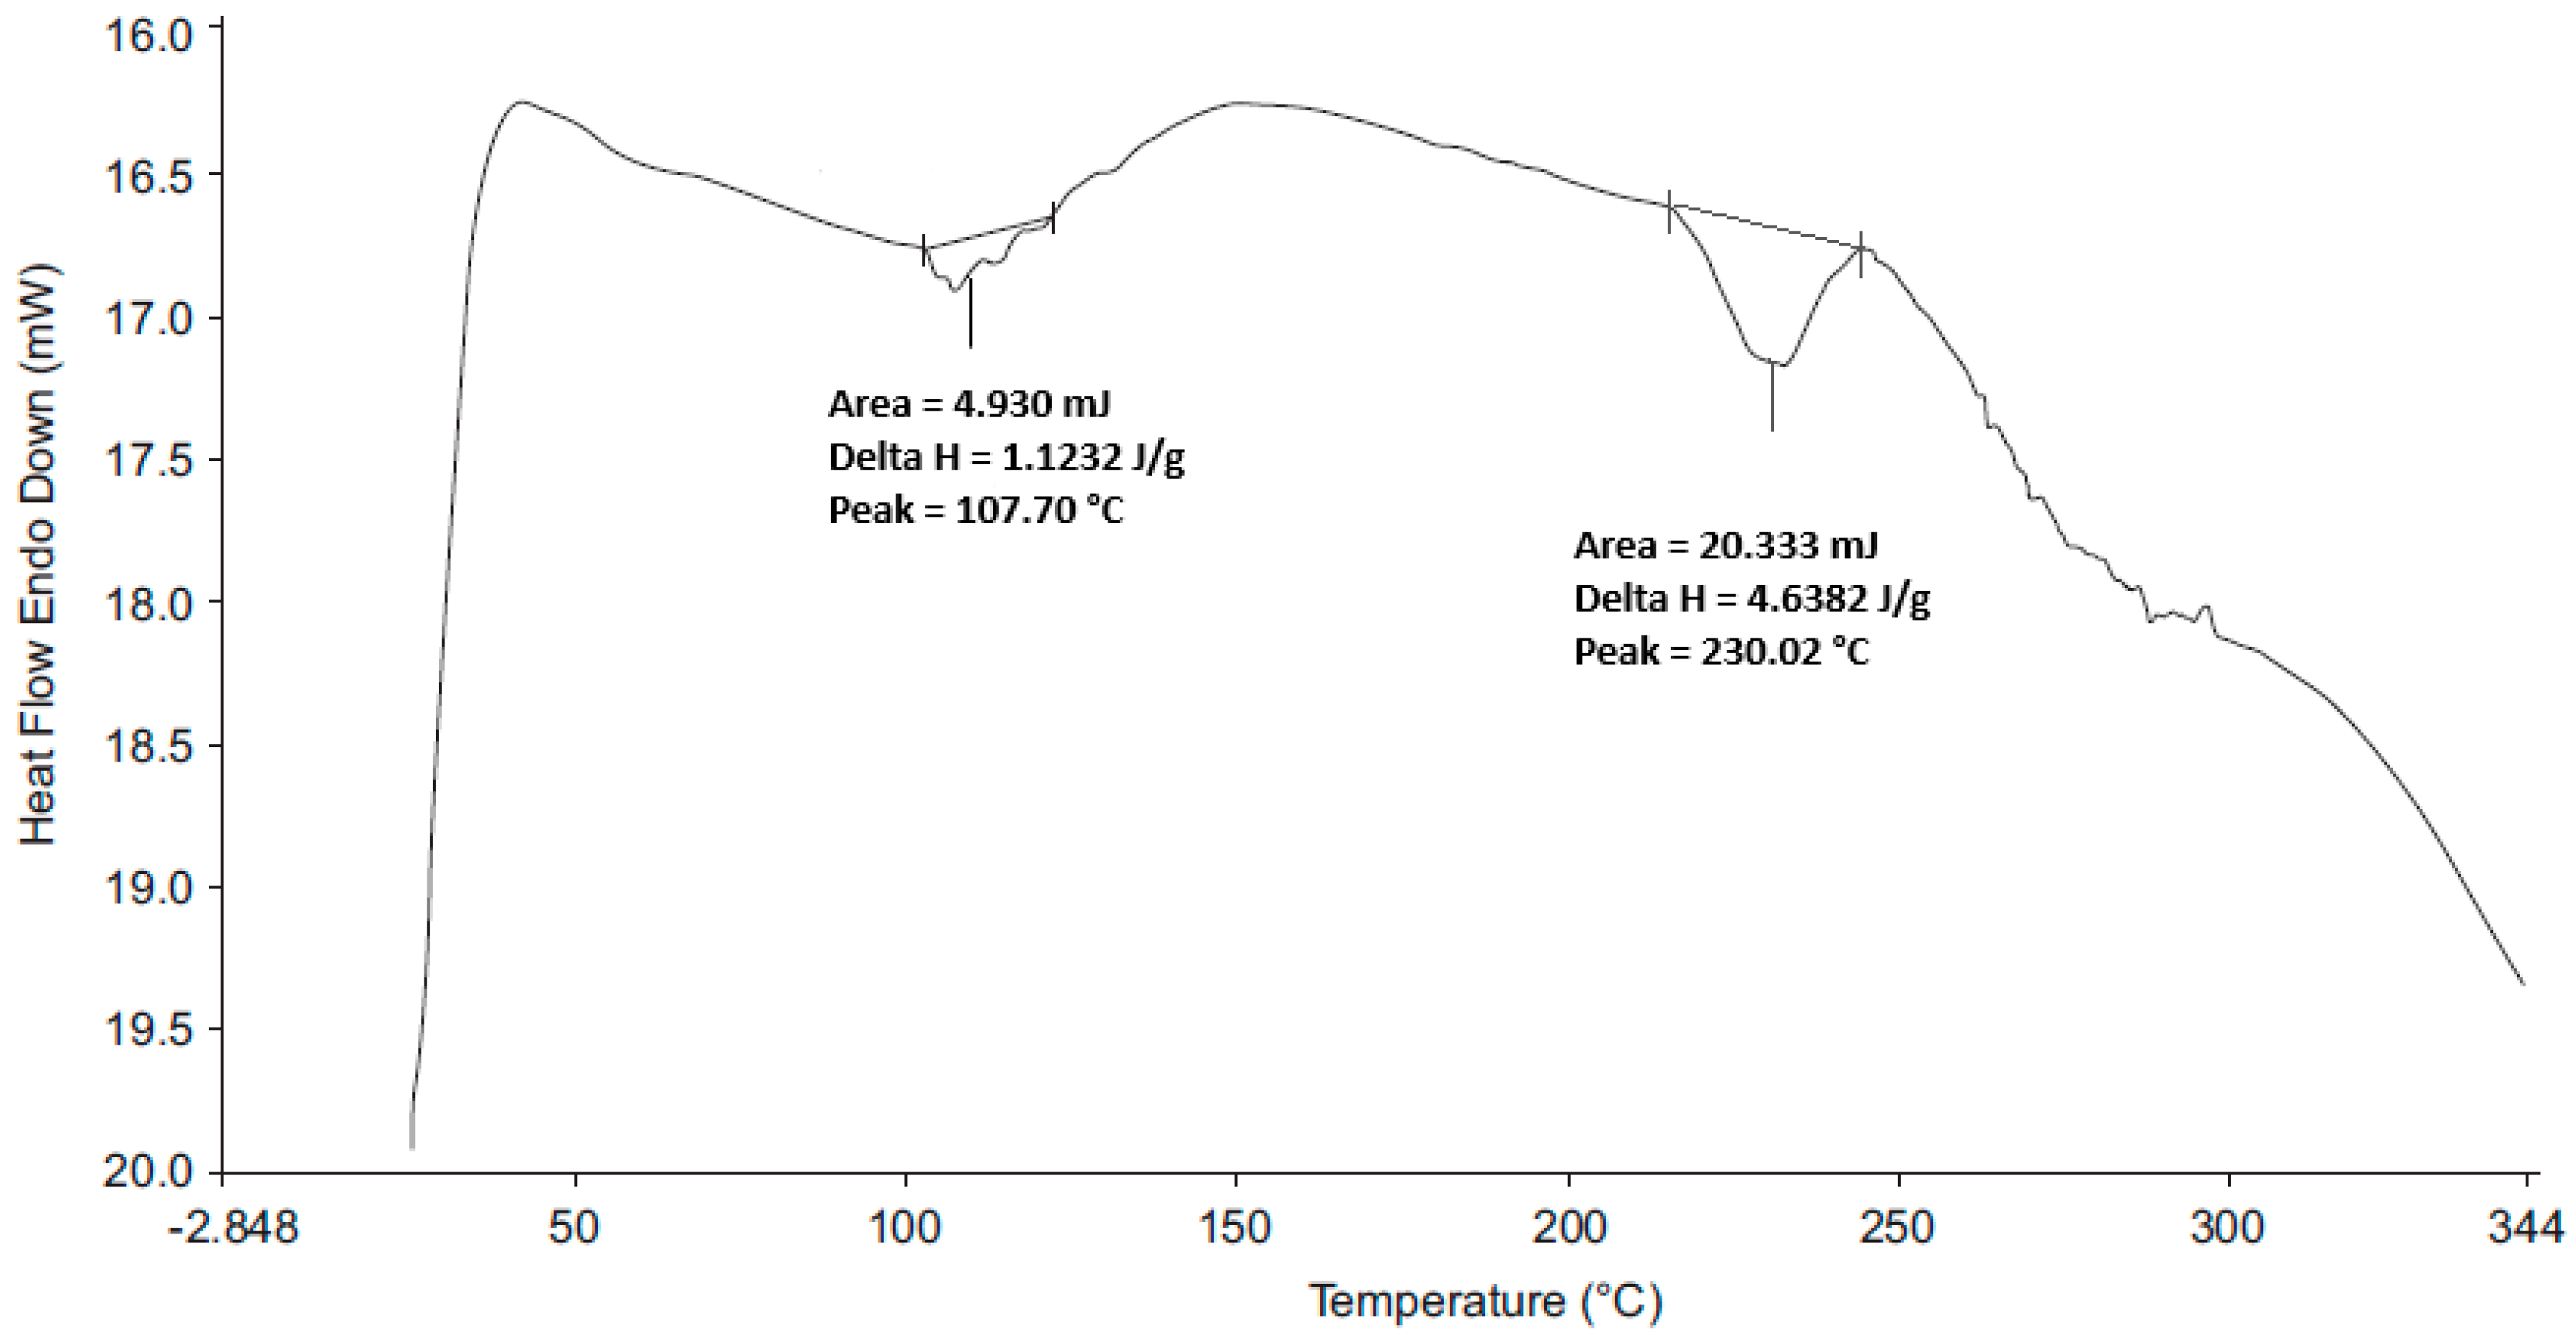
3.2.3. DSC
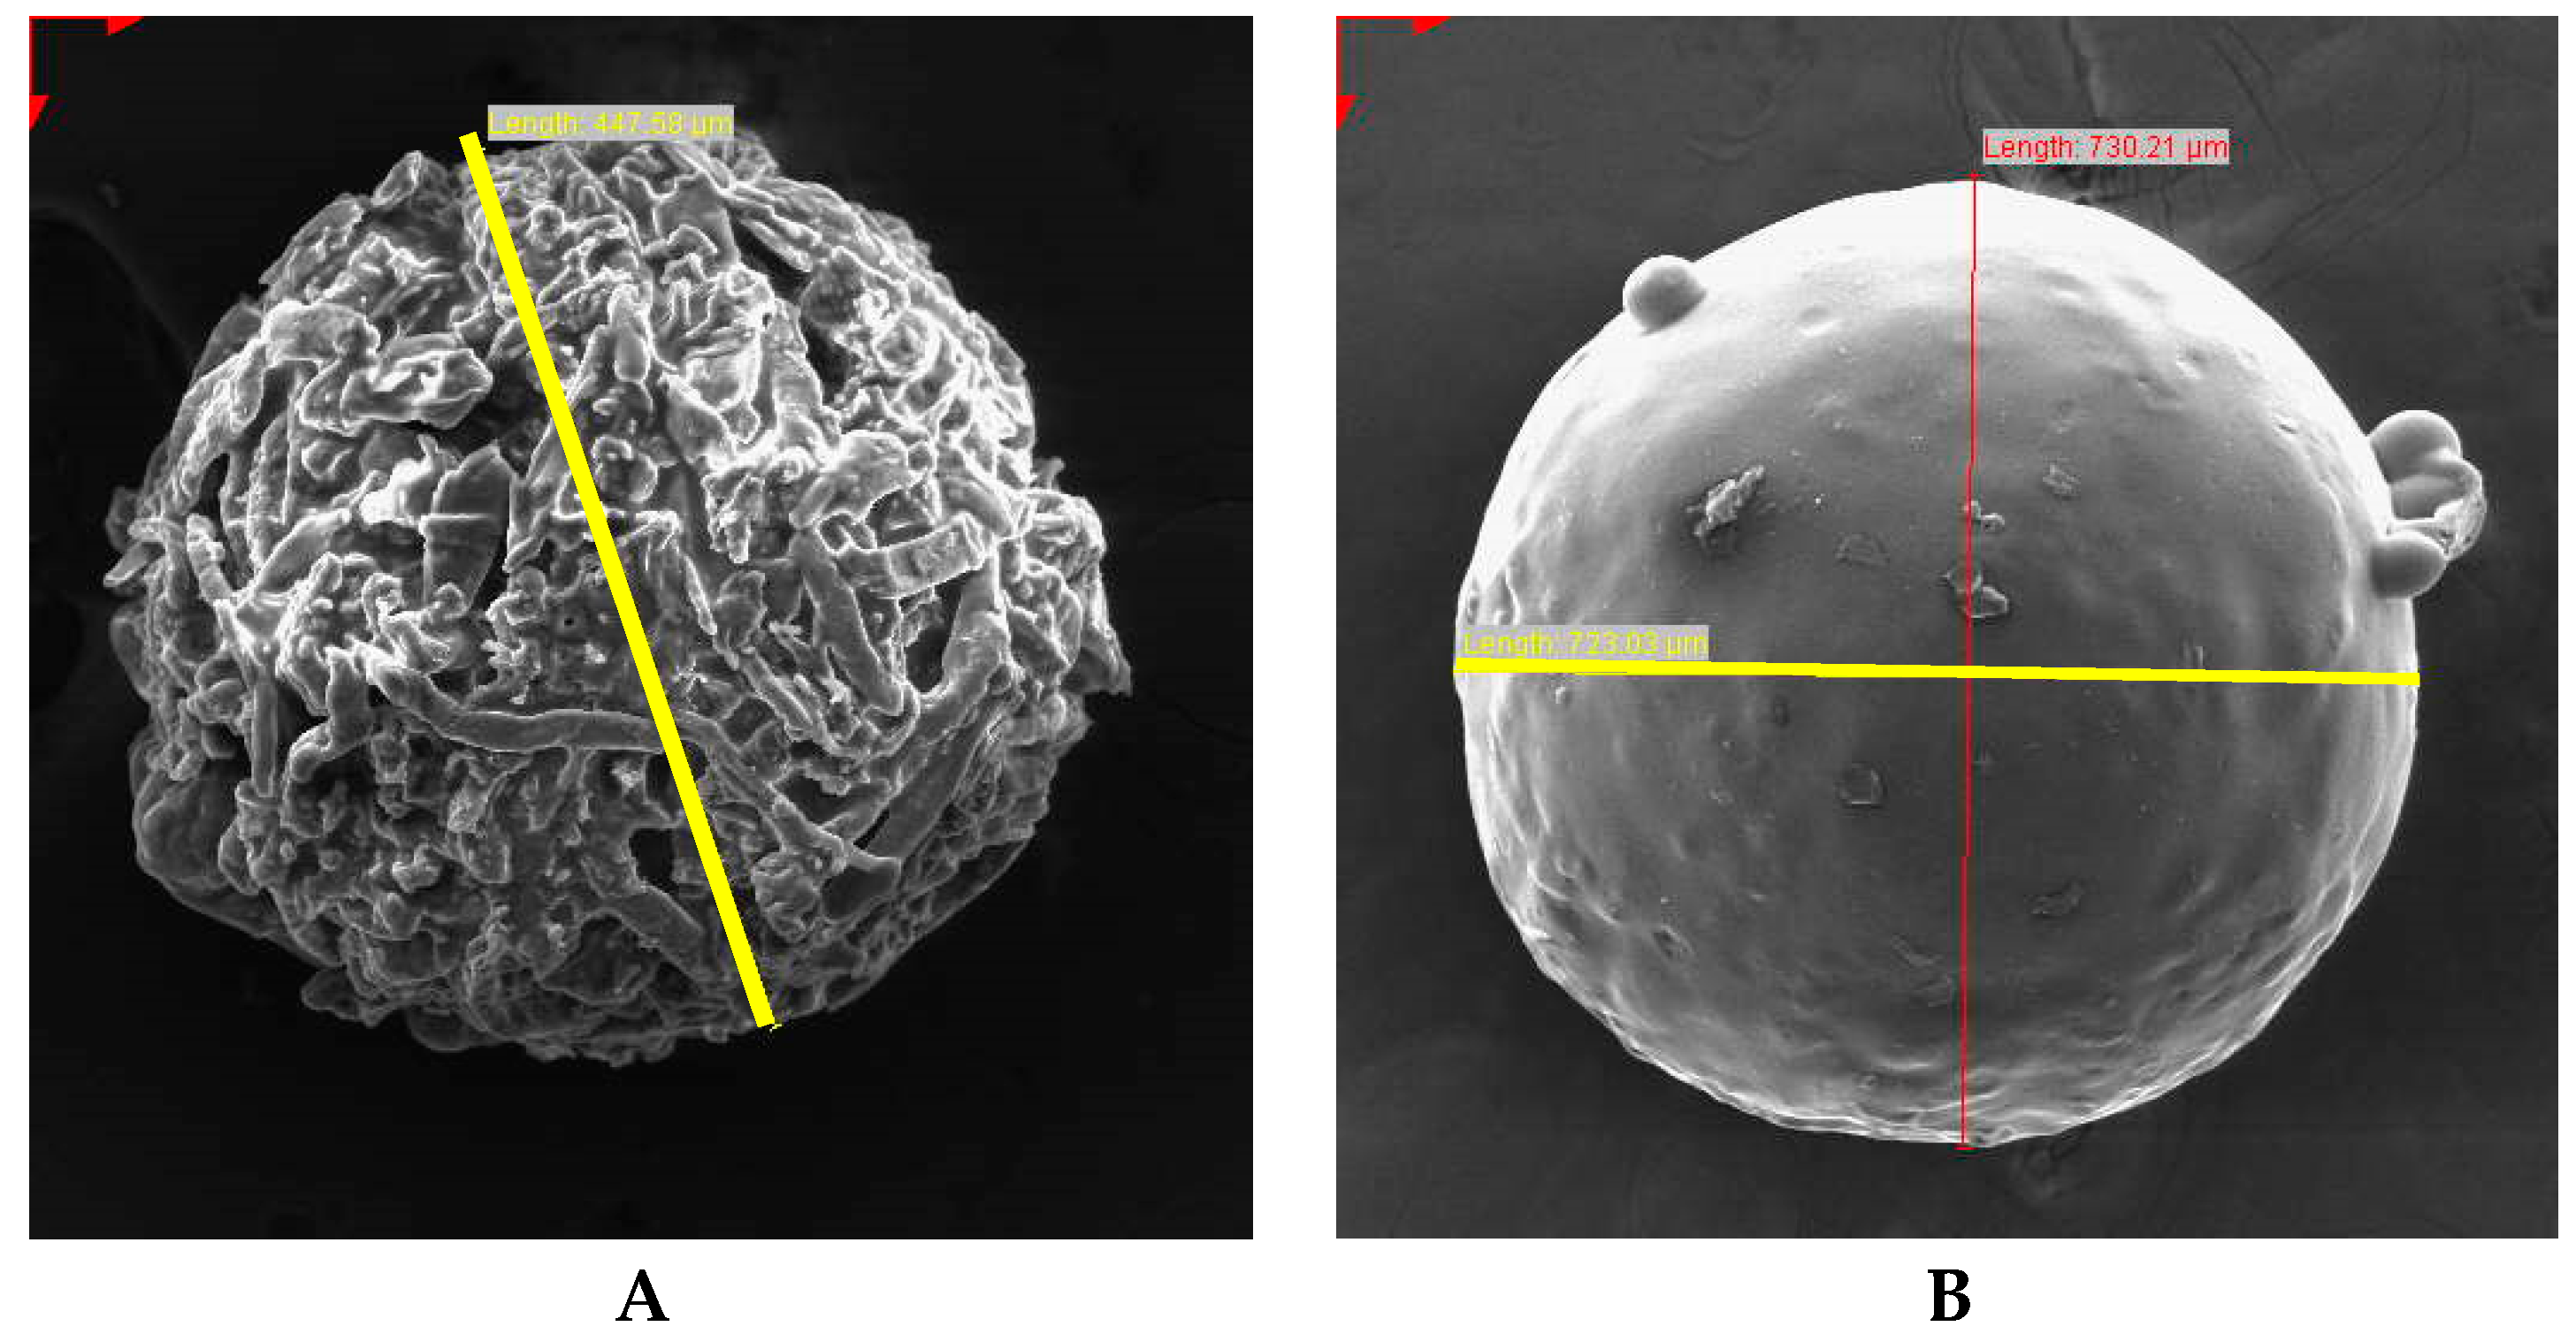
3.2.4. Scanning Electron Microscopy (SEM)
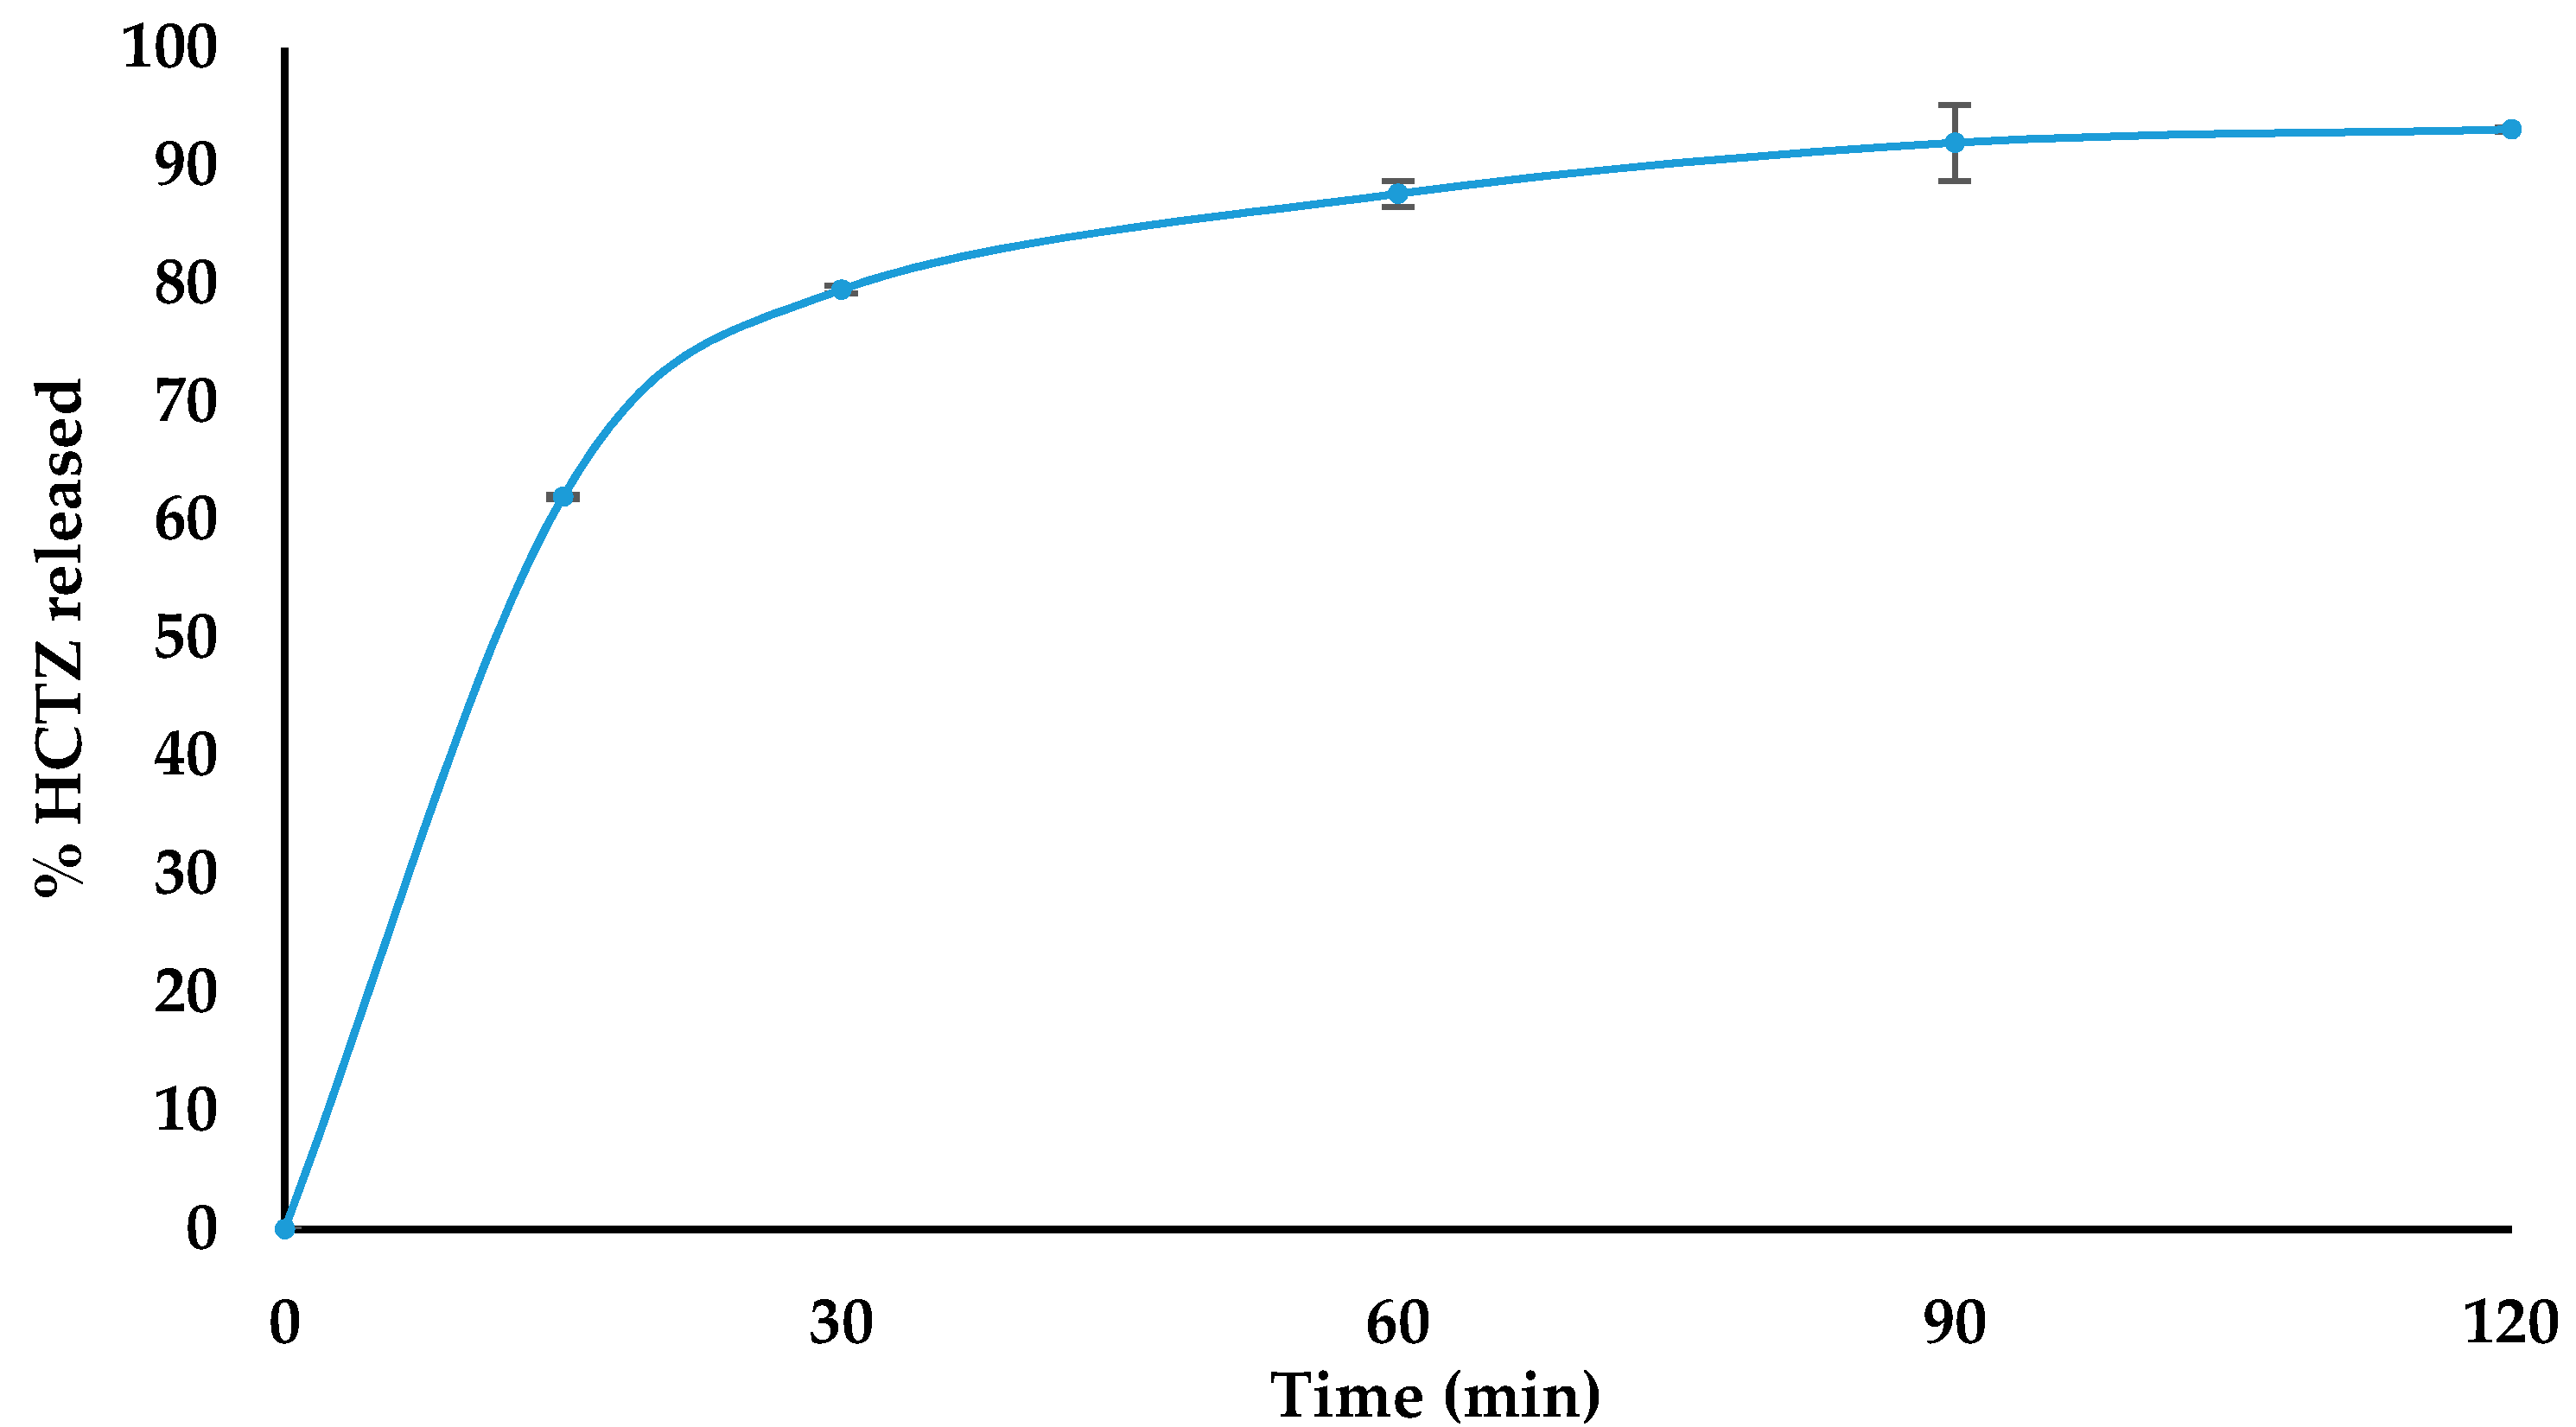
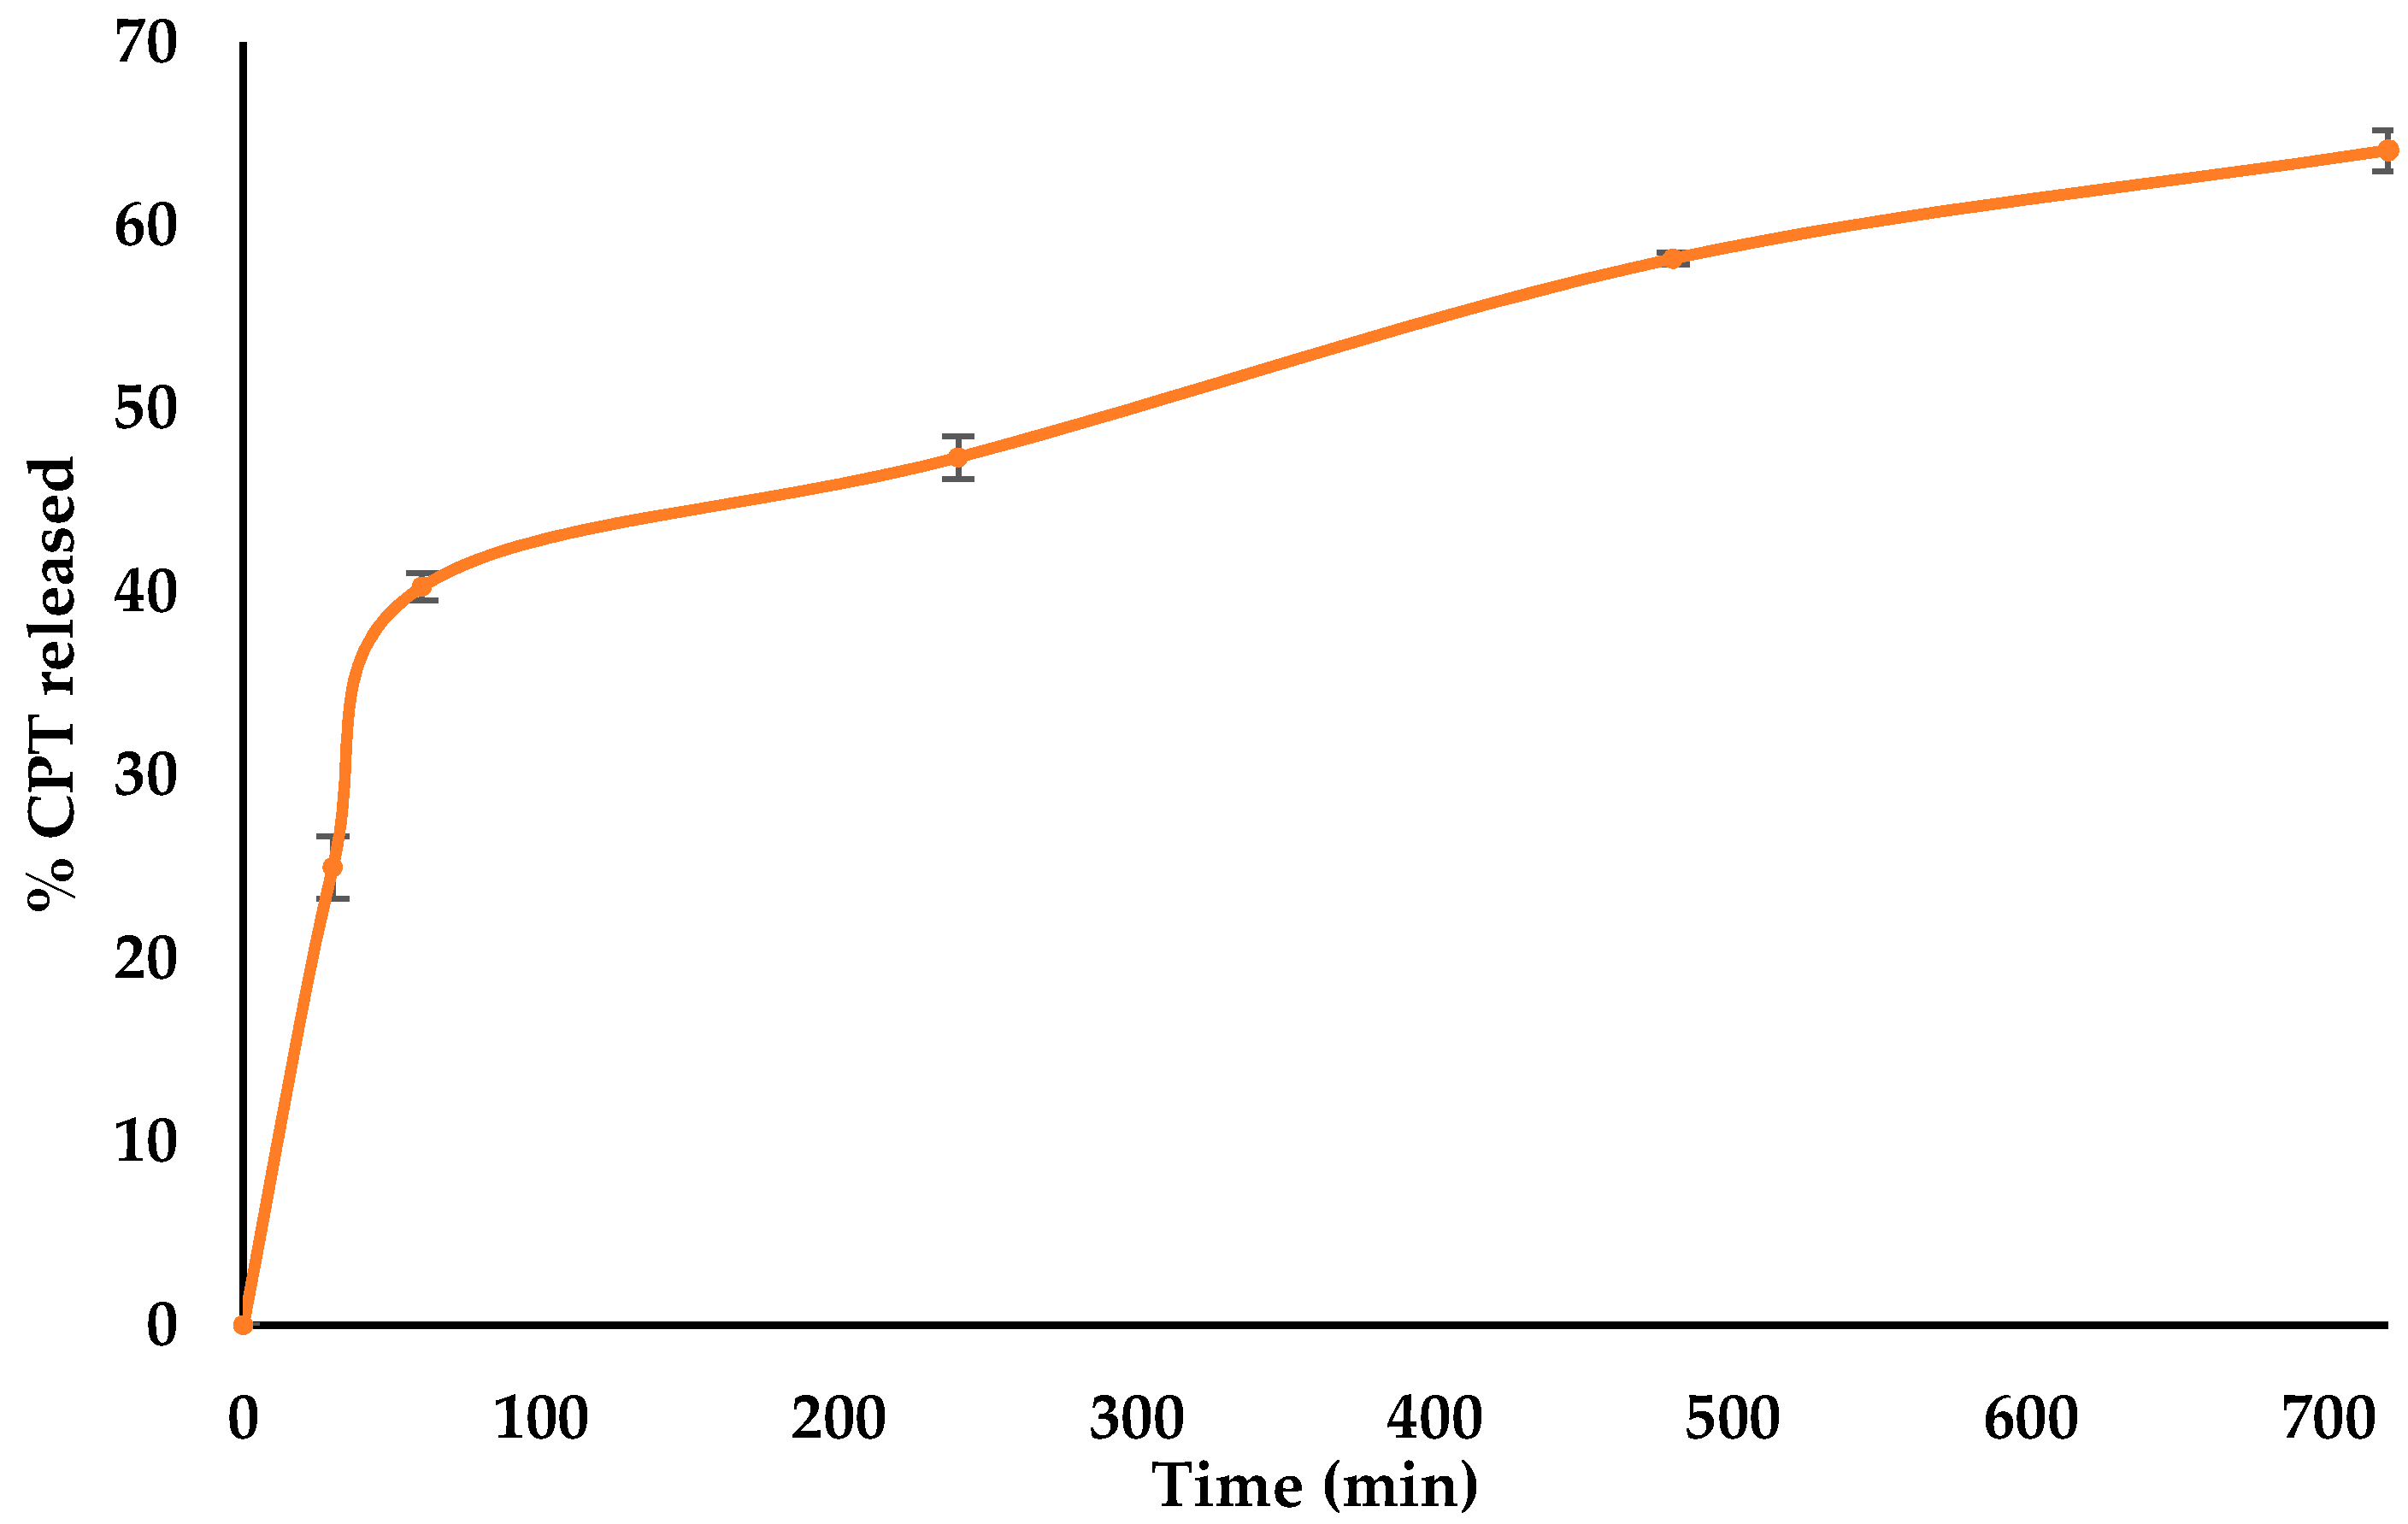
3.2.5. In Vitro Release Kinetics of HCTZ
4. Conclusions
Author Contributions
Funding
Acknowledgments
Conflicts of Interest
References
- Haynes, R.B.; Ackloo, E.; Sahota, N.; McDonald, H.P.; Yao, X. Interventions for enhancing medication adherence. Cochrane Database Syst. Rev. 2008, 4. [Google Scholar] [CrossRef] [PubMed]
- Nieuwlaat, R.; Wilczynski, N.; Navarro, T.; Hobson, N.; Jeffery, R.; Keepanasseril, A.; Agoritsas, T.; Mistry, N.; Iorio, A.; Jack, S.; et al. Interventions for enhancing medication adherence. Cochrane Database Syst. Rev. 2014. [Google Scholar] [CrossRef] [PubMed]
- Rossiter, D. (Ed.) South African Medicines Formulary, 12th ed.; Health and Medical Publishing Group: Cape Town, South Africa, 2016. [Google Scholar]
- Liu, F.; Ranmal, S.; Batchelor, H.K.; Orlu-Gul, M.; Ernest, T.B.; Thomas, I.W.; Flanagan, T.; Tuleu, C. Patient-centered pharmaceutical design to improve acceptability of medicines: Similarities and differences in paediatric and geriatric populations. Drugs 2014, 74, 1871–1889. [Google Scholar] [CrossRef] [PubMed] [Green Version]
- Chandrasekaran, P.; Kandasamy, R. Solid oral flexible formulations for pediatric and geriatric patients: Age-appropriate formulation platforms. Indian J. Pharm. Sci. 2018, 80, 14–25. [Google Scholar] [CrossRef] [Green Version]
- Ranmal, S.R.; Cram, A.; Tuleu, C. Age-appropriate and acceptable paediatric dosage forms: Insights into end-user perceptions, preferences and practices from the Children’s Acceptability of Oral Formulations (CALF) Study. Int. J. Pharm. 2016, 514, 296–307. [Google Scholar] [CrossRef] [PubMed]
- Stoltenberg, I.; Breitkreutz, J. Orally disintegrating mini-tablets (ODMTs)–A novel solid oral dosage form for paediatric use. Eur. J. Pharm. Biopharm. 2011, 78, 462–469. [Google Scholar] [CrossRef] [PubMed]
- Wesoły, M.; Kluk, A.; Sznitowska, M.; Ciosek, P.; Wróblewski, W. Influence of experimental conditions on electronic tongue results—Case of valsartan minitablets dissolution. Sensors 2016, 16, 1353. [Google Scholar] [CrossRef] [PubMed]
- Timucin, U. Mini Tablets: A Short Review-Revision. Open J. Chem. 2017, 12–22. [Google Scholar] [CrossRef] [Green Version]
- Hwisa, N.T.; Katakam, P.; Chandu, B.R.; Adiki, S.K. Solvent evaporation techniques as promising advancement in microencapsulation. Vedic Res. Int. Biol. Med. Chem. 2013, 1, 8–22. [Google Scholar] [CrossRef]
- Jelvehgari, M.; Montazam, S.H. Comparison of microencapsulation by emulsion-solvent extraction/evaporation technique using derivatives cellulose and acrylate-methacrylate copolymer as carriers. Jundishapur J. Nat. Pharm. Prod. 2012, 7, 144–152. [Google Scholar] [PubMed]
- Giri, T.K.; Choudhary, C.; Ajazuddin; Alexander, A.; Badwaik, H.; Tripathi, D.K. Prospects of pharmaceuticals and biopharmaceuticals loaded microparticles prepared by double emulsion technique for controlled delivery. Saudi Pharm. J. 2013, 21, 125–141. [Google Scholar] [CrossRef] [PubMed] [Green Version]
- Manjanna, K.M.; Shivakumar, B.; Pramod Kumar, T.M. Microencapsulation: An acclaimed novel drug-delivery system for NSAID in arthritis. Crit. Rev. Ther. Drug Carrier Syst. 2010, 27, 509–545. [Google Scholar] [CrossRef]
- Halder, A.; Sa, B. Preparation and in vitro evaluation of polystyrene-coated diltiazem-resin complex by oil-in-water emulsion solvent evaporation method. AAPS PharmSciTech 2006, 7, 105–112. [Google Scholar] [CrossRef] [PubMed] [Green Version]
- Hoa, L.T.M.; Chi, N.T.; Nguyen, L.H.; Chien, D.M. Preparation and characterisation of nanoparticles containing ketoprofen and acrylic polymers prepared by emulsion solvent evaporation method. J. Exp. Nanosci. 2012, 7, 189–197. [Google Scholar] [CrossRef]
- National Department of Health Hospital Level Paediatrics: Standard Treatment Guidelines and Essential Medicines List for South Africa. Available online: http://www.kznhealth.gov.za/pharmacy/paediatric-stgs-eml_4thed2017.pdf (accessed on 15 June 2018).
- South African Department of Health Primary Health Care: Standard Treatment Guidelines and Essential Medicines List for South Africa. Available online: http://www.health.gov.za/index.php/component/phocadownload/category/285-phc?download=3244:Primaryhealthcarelevel-2018-signedaryhealthcarelevel-2018-signed (accessed on 6 December 2018).
- Sanphui, P.; Devi, V.K.; Clara, D.; Malviya, N.; Ganguly, S.; Desiraju, G.R. Cocrystals of hydrochlorothiazide: Solubility and diffusion/permeability enhancements through drug–coformer interactions. Mol. Pharm. 2015, 12, 1615–1622. [Google Scholar] [CrossRef] [PubMed]
- Kumar, S.; Kaur, R.; Rajput, R.; Singh, M. Bio pharmaceutics classification system (BCS) class IV drug nanoparticles: Quantum leap to improve their therapeutic index. Adv. Pharm. Bull. 2018, 8, 617–625. [Google Scholar] [CrossRef]
- Savjani, K.T.; Gajjar, A.K.; Savjani, J.K. Drug solubility: Importance and enhancement techniques. ISRN Pharm. 2012, 2012, 195727. [Google Scholar] [CrossRef] [PubMed] [Green Version]
- Williams, R.O.; Watts, A.B.; Miller, D.A. (Eds.) Formulating Poorly Water Soluble Drugs; AAPS Press: New York, NY, USA, 2012. [Google Scholar]
- Tambosi, G.; Coelho, P.F.; Luciano, S.; Lenschow, I.C.S.; Zétola, M.; Stulzer, H.K.; Pezzini, B.R.; Tambosi, G.; Coelho, P.F.; Luciano, S.; et al. Challenges to improve the biopharmaceutical properties of poorly water-soluble drugs and the application of the solid dispersion technology. Matéria (Rio Jan.) 2018, 23. [Google Scholar] [CrossRef]
- Chikukwa, M.T. Ruramai Formulation and Characterisation of a Combination Captopril and Hydrochlorothiazide Microparticulate Dosage Form for Paediatric Use; Rhodes University: Makhanda, South Africa, 2020. [Google Scholar]
- Zhang, Y.; Huo, M.; Zhou, J.; Zou, A.; Li, W.; Yao, C.; Xie, S. DDSolver: An add-in program for modeling and comparison of drug dissolution profiles. AAPS J. 2010, 12, 263–271. [Google Scholar] [CrossRef] [PubMed] [Green Version]
- Jelvehgari, M.; Dastmalch, S.; Nazila, D. Theophylline-ethylcellulose microparticles: Screening of the process and formulation variables for preparation of sustained release particles. Iran. J. Basic Med. Sci. 2012, 15, 608–624. [Google Scholar] [PubMed]
- Jelvehgari, M.; Barar, J.; Valizadeh, H.; Shadrou, S.; Nokhodchi, A. Formulation, characterization and in vitro evaluation of theophylline-loaded Eudragit RS 100 microspheres prepared by an emulsion-solvent diffusion/evaporation technique. Pharm. Dev. Technol. 2011, 16, 637–644. [Google Scholar] [CrossRef] [PubMed]
- ICH Harmonised Guideline Impurities: Guideline for residual Solvents Q3c (R6) Current Step 4 Version. Available online: https://www.ich.org/fileadmin/Public_Web_Site/ICH_Products/Guidelines/Quality/Q3C/Q3C__R6___Step_4.pdf (accessed on 16 September 2019).
- Subedi, G.; Shrestha, A.K.; Shakya, S. Study of effect of different factors in formulation of micro and nanospheres with solvent evaporation technique. Open Pharm. Sci. J. 2016, 3, 182–195. [Google Scholar] [CrossRef]
- Sharma, N.; Madan, P.; Lin, S. Effect of process and formulation variables on the preparation of parenteral paclitaxel-loaded biodegradable polymeric nanoparticles: A co-surfactant study. Asian J. Pharm. Sci. 2016, 11, 404–416. [Google Scholar] [CrossRef] [Green Version]
- Subhedar, P.; Naik, J.B.; Muley, D.N. Effect of polymer concentration on sustained release microparticles of metformin hydrochloride prepared by using spray dryer. Polym. Plast. Technol. Eng. 2010, 49, 267–271. [Google Scholar] [CrossRef]
- Kranz, H.; Bodmeier, R. A novel in situ forming drug delivery system for controlled parenteral drug delivery. Int. J. Pharm. 2007, 332, 107–114. [Google Scholar] [CrossRef] [PubMed]
- Shams, T.; Illangakoon, U.E.; Parhizkar, M.; Harker, A.H.; Edirisinghe, S.; Orlu, M.; Edirisinghe, M. Electrosprayed microparticles for intestinal delivery of prednisolone. J. R. Soc. Interface 2018, 15, 20180491. [Google Scholar] [CrossRef] [PubMed]
- Busatto, C.; Pesoa, J.; Helbling, I.; Luna, J.; Estenoz, D. Effect of particle size, polydispersity and polymer degradation on progesterone release from PLGA microparticles: Experimental and mathematical modeling. Int. J. Pharm. 2018, 536, 360–369. [Google Scholar] [CrossRef] [PubMed]
- Chen, W.; Palazzo, A.; Hennink, W.E.; Kok, R.J. Effect of particle size on drug loading and release kinetics of gefitinib-loaded PLGA microspheres. Mol. Pharm. 2017, 14, 459–467. [Google Scholar] [CrossRef] [PubMed]
- Adjei, F.K.; Osei, Y.A.; Kuntworbe, N.; Ofori-Kwakye, K. Evaluation of the disintegrant properties of native starches of five new cassava varieties in paracetamol tablet formulations. J. Pharm. 2017, 2017, 2326912. [Google Scholar] [CrossRef] [PubMed] [Green Version]
- Markl, D.; Zeitler, J.A. A review of disintegration mechanisms and measurement techniques. Pharm. Res. 2017, 34, 890–917. [Google Scholar] [CrossRef] [PubMed] [Green Version]
- Shihora, H.; Panda, S. Superdisintegrants, utility in dosage forms: A quick review introduction. J. Pharm. Sci. Biosci. Res. 2011, 1, 148–153. [Google Scholar]
- Maji, R.; Ray, S.; Das, B.; Nayak, A.K. Ethyl cellulose microparticles containing metformin HCl by emulsification-solvent evaporation technique: Effect of formulation variables. ISRN Polym. Sci. 2012, 2012, 1–7. [Google Scholar] [CrossRef] [Green Version]
- Raut, N.S.; Somvanshi, S.; Jumde, A.B.; Khandelwal, H.M.; Umekar, M.J.; Kotagale, N.R. Ethyl cellulose and hydroxypropyl methyl cellulose buoyant microspheres of metoprolol succinate: Influence of pH modifiers. Int. J. Pharm. Investig. 2013, 3, 163–170. [Google Scholar] [PubMed] [Green Version]
- Chandran, S.; Asghar, L.; Mantha, N. Design and evaluation of ethyl cellulose based matrix tablets of ibuprofen with pH modulated release kinetics. Indian J. Pharm. Sci. 2008, 70, 596–602. [Google Scholar] [CrossRef] [PubMed] [Green Version]
- Guidance for Industry Dissolution Testing of Immediate Release Solid Oral Dosage Forms US Department of Health and Human Services, Food and Drug Administration, Center for Drug Evaluation and Research (CDER); US Department of Health and Human Services, Food and Drug Administration, Center for Drug Evaluation and Research (CDER): Rockville, MD, USA, 1997.
- Blockman, M. South African Medicines Formulary, 11th ed.; Rossiter, D., Ed.; FA Print: Cape Town, South Africa, 2012. [Google Scholar]
- Stulzer, H.K.; Rodrigues, P.O.; Cardoso, T.M.; Matos, J.S.R.; Silva, M.A.S. Compatibility studies between captopril and pharmaceutical excipients used in tablets formulations. J. Therm. Anal. Calorim. 2008, 91, 323–328. [Google Scholar] [CrossRef]
- Kadin, H. Captopril. In Analytical Profiles of Drug Substances; Florey, K., Ed.; Academic Press: New York, NY, USA, 1982; Volume 11, pp. 79–137. [Google Scholar]
- Arafa, M.F.; El-Gizawy, S.A.; Osman, M.A.; Maghraby, G.M. El Sucralose as co-crystal co-former for hydrochlorothiazide: Development of oral disintegrating tablets. Drug Dev. Ind. Pharm. 2016, 42, 1225–1233. [Google Scholar] [CrossRef] [PubMed]
- Sonpal, R.N.; Shelat, P.; Lalwani, A. Solubility enhancement of hydrochlorothiazide using a novel drug-drug solid dispersion technology. Int. J. Pharm. Sci. Nanotechnol. 2015, 8, 2924–2936. [Google Scholar]
- Vaculikova, E.; Cernikova, A.; Placha, D.; Pisarcik, M.; Peikertova, P.; Dedkova, K.; Devinsky, F.; Jampilek, J.; Andronescu, E.; Grumezescu, A.M. Preparation of hydrochlorothiazide nanoparticles for solubility enhancement. Molecules 2016, 21, 1005. [Google Scholar] [CrossRef] [PubMed] [Green Version]
- Madurai, S.L.; Joseph, S.W.; Mandal, A.B.; Tsibouklis, J.; Reddy, B.S.R. Intestine-specific, oral delivery of captopril/montmorillonite: Formulation and release kinetics. Nanoscale Res. Lett. 2011, 6, 1–8. [Google Scholar] [CrossRef] [PubMed] [Green Version]
- Sirisha, P.L.; Babu, G.K.; Babu, P.S. Conceptuation, formulation and evaluation of sustained release floating tablets of captopril compression coated with gastric dispersible hydrochlorothiazide using 2(3) factorial design. Int. J. Pharm. Investig. 2014, 4, 77–87. [Google Scholar] [PubMed] [Green Version]
- Deppeler, H.P. Hydrochlorothiazide. Anal. Profiles Drug Subst. 1981, 10, 405–441. [Google Scholar]
- Chourasiya, V.; Bohrey, S.; Pandey, A. Hydrochlorothiazide containing PLGA nanoparticles: Design, characterization, in-vitro drug release and release kinetic study. Polym. Sci. Ser. B 2015, 57, 645–653. [Google Scholar] [CrossRef]
- Soares-Sobrinho, J.L.; De La Roca Soares, M.F.; Lopes, P.Q.; Correia, L.P.; De Souza, F.S.; Macĉdo, R.O.; Rolim-Neto, P.J. A Preformulation Study of a New Medicine for Chagas Disease Treatment: Physicochemical Characterization, Thermal Stability, and Compatibility of Benznidazole. AAPS PharmSciTech 2010, 11, 1391–1396. [Google Scholar] [CrossRef] [PubMed] [Green Version]
- Lyoo, W.; Cho, S.; Shin, D.; Han, S.; Park, C.; Kim, J.; Noh, S. Effect of processing Parameters on the Size and Size Distribution of High Molecular Weight Atactic Poly(vinyl alcohol) Gel Particles Prepared by Water-in-Oil Emulsion Method Using High Pressure Homogenizer. Polym. Polym. Compos. 2006, 14, 47–53. [Google Scholar] [CrossRef]
- Singh Kadian, S.; Harikumar, S.L. Eudragit and Its Pharmaceutical Significance. Available online: http://www.farmavita.net/documents/Eudragit-Review.pdf (accessed on 28 April 2019).
- Wasilewska, K.; Szekalska, M.; Ciosek-Skibinska, P.; Lenik, J.; Basa, A.; Jacyna, J.; Markuszewski, M.; Winnicka, K. Ethylcellulose in organic solution or aqueous dispersion form in designing taste-masked microparticles by the spray drying technique with a model bitter drug: Rupatadine fumarate. Polymers (Basel) 2019, 11, 522. [Google Scholar] [CrossRef] [PubMed] [Green Version]
- Adeleke, O.A. Premium ethylcellulose polymer based architectures at work in drug delivery. Int. J. Pharm. X 2019. [Google Scholar] [CrossRef] [PubMed]
- Siepmann, J.; Siepmann, F. Modeling of diffusion controlled drug delivery. J. Control. Release 2012, 161, 351–362. [Google Scholar] [CrossRef] [PubMed]
- Chikukwa, M.T.R.; Wesoly, M.; Korzeniowska, A.B.; Ciosek-Skibinska, P.; Walker, R.B.; Khamanga, S.M.M. Assessment of taste masking of captopril by ion-exchange resins using electronic gustatory system. Pharm. Dev. Technol. 2019, 1–9. [Google Scholar] [CrossRef] [PubMed]


| API | Input Variables | Output Responses | Optimisation Constraints |
|---|---|---|---|
| HCTZ | SSG (g) | % EE | maximise |
| Eud® E100 (g) | % released at 30 min | maximise | |
| Speed (rpm) | % released at 120 min | maximise | |
| CPT | Ethyl cellulose (g) Speed (rpm) | % EE | maximise |
| % released at 30 min | minimise | ||
| % released at 720 min | minimise |
| Batch | Input Variables | Output Responses | ||||
|---|---|---|---|---|---|---|
| SSG (A) g | EUD® E100 (B) g | Speed (C) rpm | EE % | Released at 30 min % | Released at 120 min % | |
| H-01 | 0.35 | 1.00 | 750 | 81.09 | 74.97 | 83.32 |
| H-02 | 0.35 | 1.00 | 750 | 84.97 | 73.20 | 85.34 |
| H-03 | 0.20 | 1.00 | 1000 | 91.00 | 75.11 | 85.03 |
| H-04 | 0.20 | 1.00 | 500 | 70.30 | 60.00 | 60.81 |
| H-05 | 0.20 | 0.50 | 750 | 85.15 | 75.70 | 90.53 |
| H-06 | 0.35 | 1.50 | 500 | 70.14 | 62.38 | 63.52 |
| H-07 | 0.35 | 0.50 | 1000 | 82.01 | 39.09 | 73.33 |
| H-08 | 0.20 | 1.50 | 750 | 78.11 | 83.01 | 94.81 |
| H-09 | 0.50 | 1.50 | 750 | 74.71 | 89.32 | 106.32 |
| H-10 | 0.50 | 0.50 | 750 | 103.86 | 86.55 | 94.25 |
| H-11 | 0.35 | 1.00 | 750 | 86.47 | 70.32 | 85.89 |
| H-12 | 0.35 | 1.00 | 750 | 84.18 | 73.66 | 104.8 |
| H-13 | 0.35 | 1.50 | 1000 | 83.76 | 84.24 | 89.62 |
| H-14 | 0.35 | 1.00 | 750 | 89.81 | 72.42 | 88.80 |
| H-15 | 0.50 | 1.00 | 500 | 81.42 | 73.65 | 98.29 |
| H-16 | 0.50 | 1.00 | 1000 | 83.24 | 86.24 | 91.89 |
| H-17 | 0.35 | 0.50 | 500 | 89.47 | 71.21 | 83.10 |
| Output Response | Best Fit Model | Significant Factors |
|---|---|---|
| % EE | Quadratic | Eud® E100 |
| Speed | ||
| % HCTZ released at 30 min | Quadratic | SSG |
| Eud® E100 | ||
| Speed | ||
| % HCTZ released at 120 min | 2 FI | None |
| Batch | EUD® RSPO g | Speedrpm | EE % | Released at 30 min % | Released at 480 min % |
|---|---|---|---|---|---|
| C-01 | 0.586 | 1000 | 30.75 | 58.27 | 86.20 |
| C-02 | 3.00 | 1250 | 68.16 | 27.02 | 61.71 |
| C-03 | 1.00 | 1250 | 43.28 | 53.99 | 66.60 |
| C-04 | 2.00 | 1353.55 | 75.05 | 33.31 | 55.19 |
| C-05 | 2.00 | 1000 | 64.60 | 33.96 | 69.83 |
| C-06 | 2.00 | 1000 | 74.37 | 28.33 | 72.29 |
| C-07 | 2.00 | 1000 | 68.34 | 30.21 | 77.52 |
| C-08 | 2.00 | 646.45 | 55.25 | 7.38 | 40.03 |
| C-09 | 2.00 | 1000 | 68.87 | 33.68 | 78.91 |
| C-10 | 2.00 | 1000 | 70.26 | 26.22 | 74.63 |
| C-11 | 1.00 | 750 | 70.51 | 33.82 | 73.41 |
| C-12 | 3.414 | 1000 | 71.50 | 19.78 | 62.41 |
| C-13 | 3.00 | 750 | 52.01 | 17.37 | 66.89 |
| Response | Best Fit Model | Significant Factors |
|---|---|---|
| % EE | Quadratic | Ethyl cellulose (EC) |
| % CPT released at 30 min | Quadratic | EC |
| Speed | ||
| % CPT released at 480 min | Quadratic | None |
| Batch | Output Monitored | Predicted Value | Experimental Value | Prediction Error (%) |
|---|---|---|---|---|
| H-OPT | % EE | 100.00 | 79.13 | 26.31 |
| % released at 30 min | 88.39 | 83.97 | 5.26 | |
| % released at 120 min | 88.37 | 92.45 | 4.41 | |
| C-OPT | % EE | 79.28 | 76.27 | −3.94 |
| % released at 30 min | 24.82 | 24.978 | 0.65 | |
| % released at 480 min | 60.01 | 58.20 | −3.11 |
© 2020 by the authors. Licensee MDPI, Basel, Switzerland. This article is an open access article distributed under the terms and conditions of the Creative Commons Attribution (CC BY) license (http://creativecommons.org/licenses/by/4.0/).
Share and Cite
Chikukwa, M.T.R.; Walker, R.B.; Khamanga, S.M.M. Formulation and Characterisation of a Combination Captopril and Hydrochlorothiazide Microparticulate Dosage Form. Pharmaceutics 2020, 12, 712. https://doi.org/10.3390/pharmaceutics12080712
Chikukwa MTR, Walker RB, Khamanga SMM. Formulation and Characterisation of a Combination Captopril and Hydrochlorothiazide Microparticulate Dosage Form. Pharmaceutics. 2020; 12(8):712. https://doi.org/10.3390/pharmaceutics12080712
Chicago/Turabian StyleChikukwa, Mellisa T. R., Roderick B. Walker, and Sandile M. M. Khamanga. 2020. "Formulation and Characterisation of a Combination Captopril and Hydrochlorothiazide Microparticulate Dosage Form" Pharmaceutics 12, no. 8: 712. https://doi.org/10.3390/pharmaceutics12080712