Quantification of Pharmacokinetic Profiles of PD-1/PD-L1 Antibodies by Validated ELISAs

 , ,
, ,
Abstract
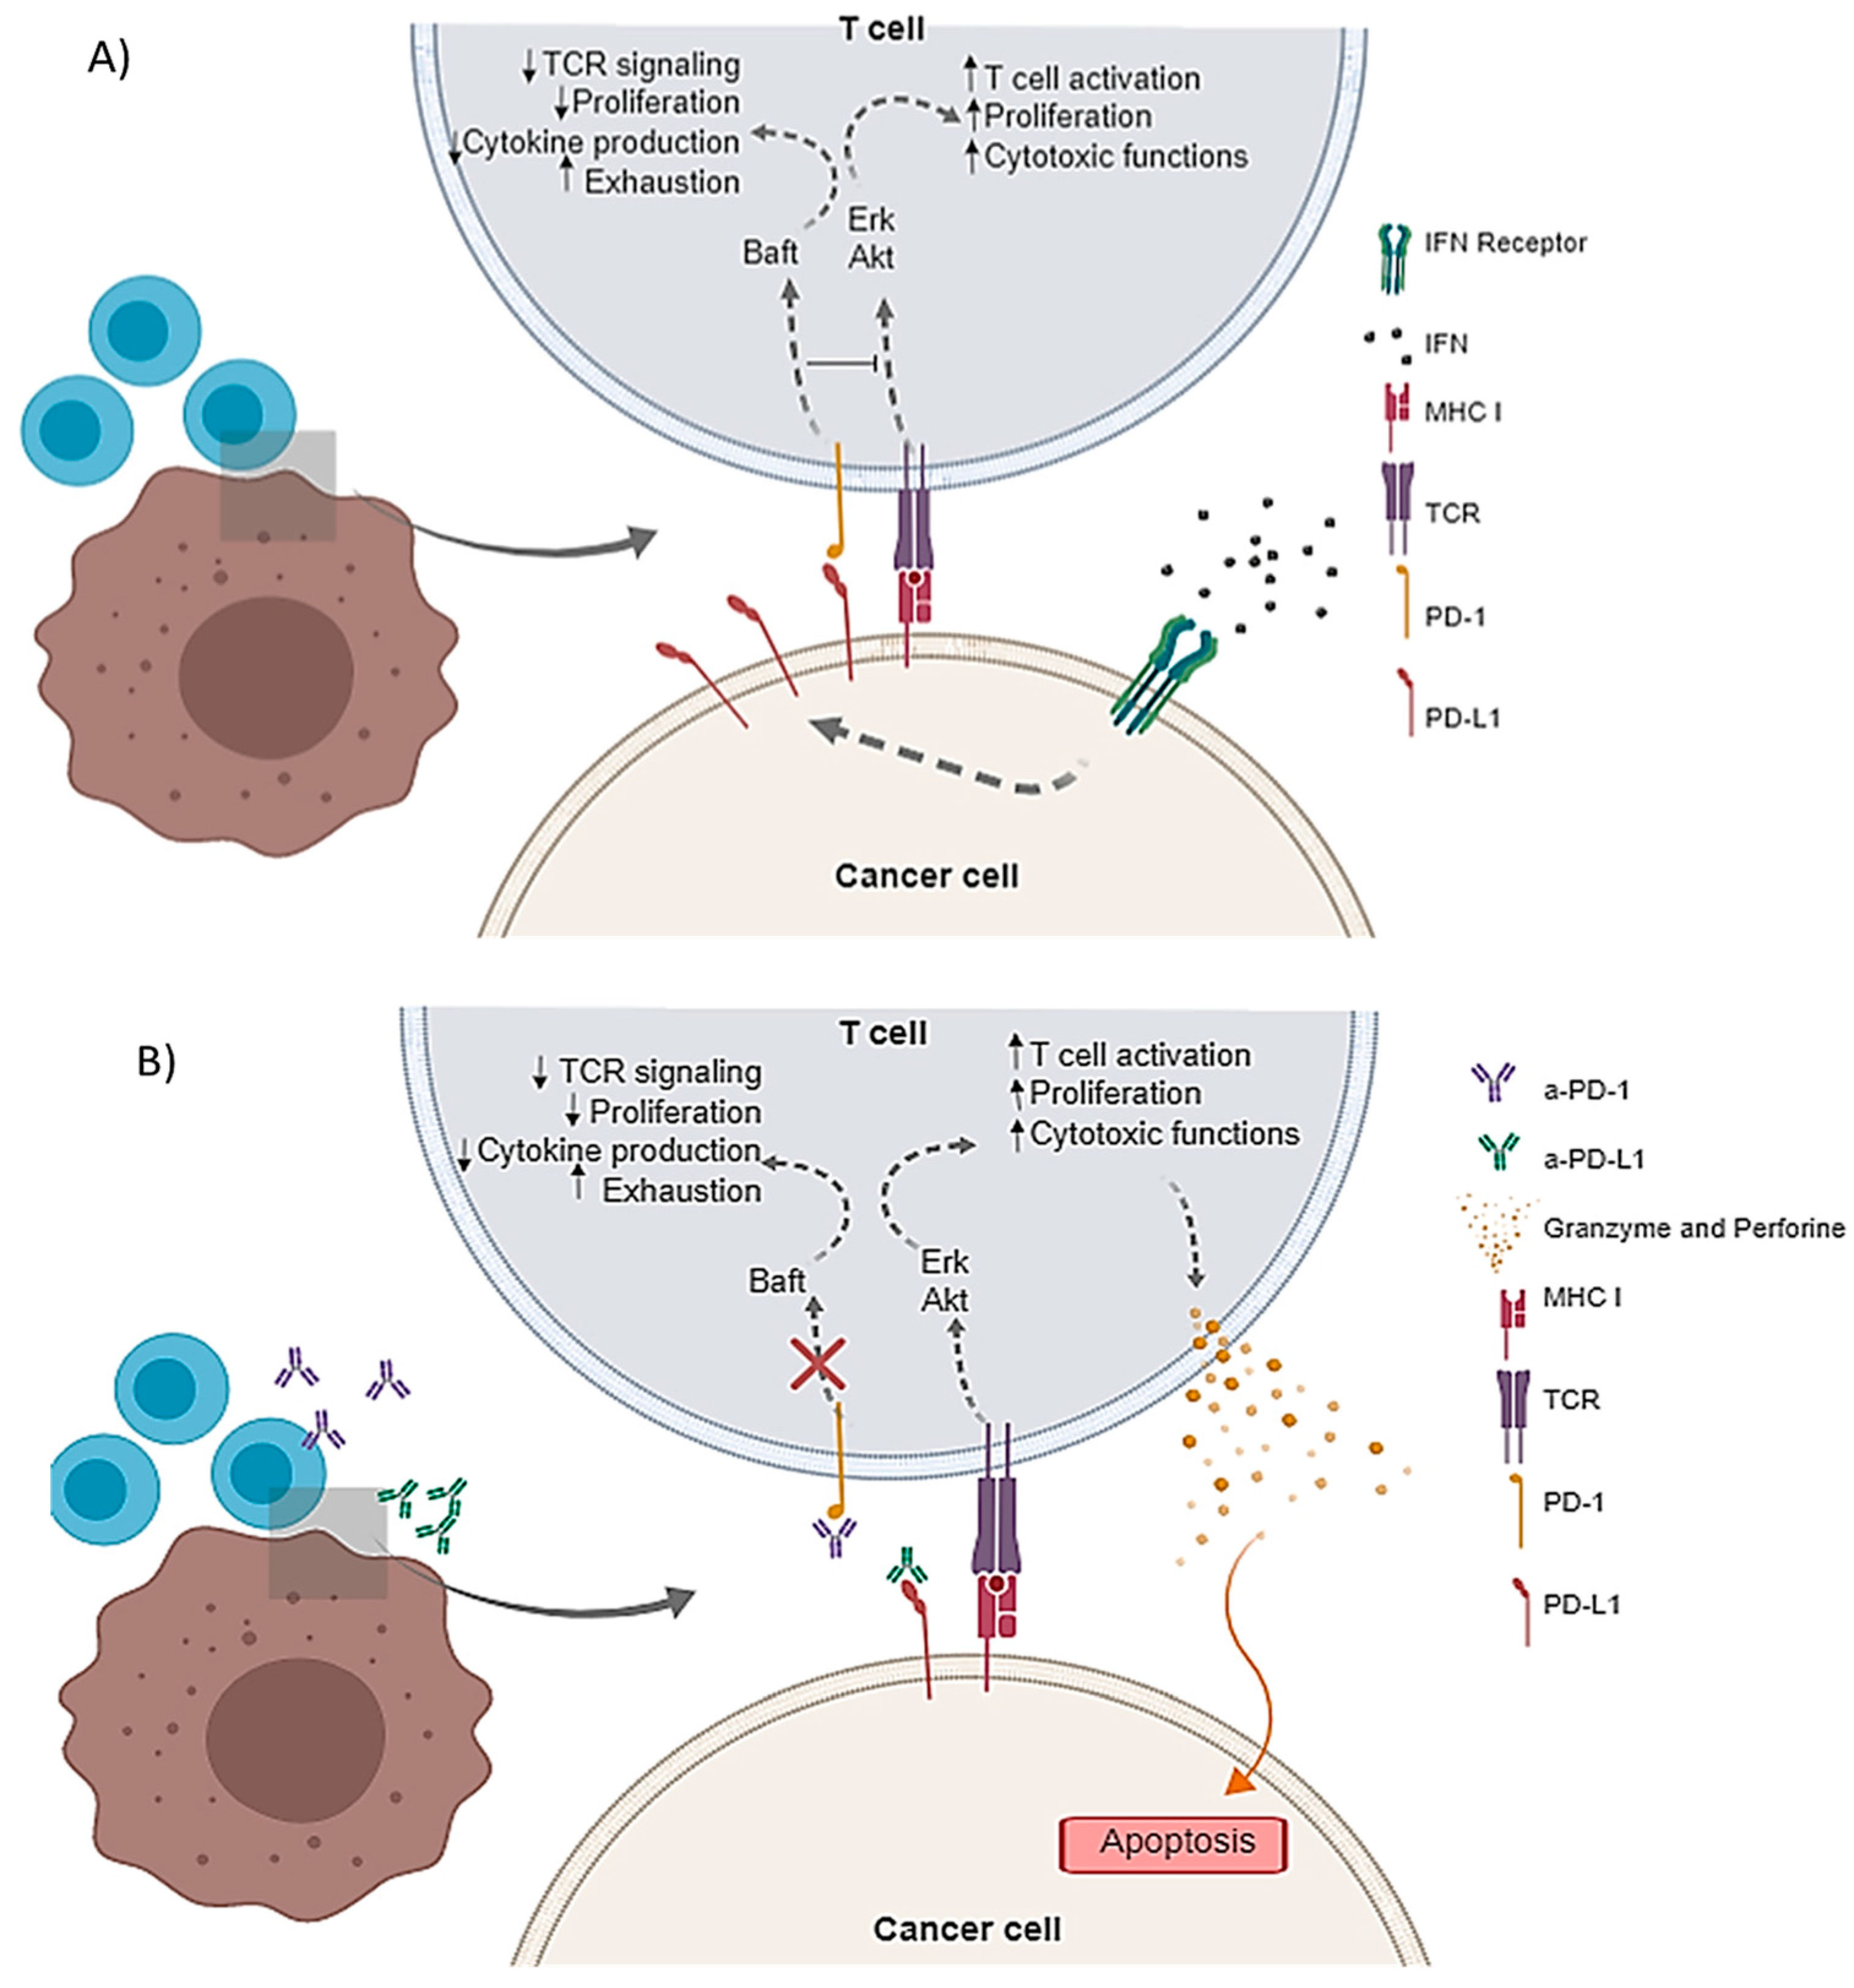
:1. Introduction
2. Materials and Methods
2.1. Materials
2.2. Methods
2.2.1. ELISA Development and Validation
Matrix Selection
Calibration Standard Curves
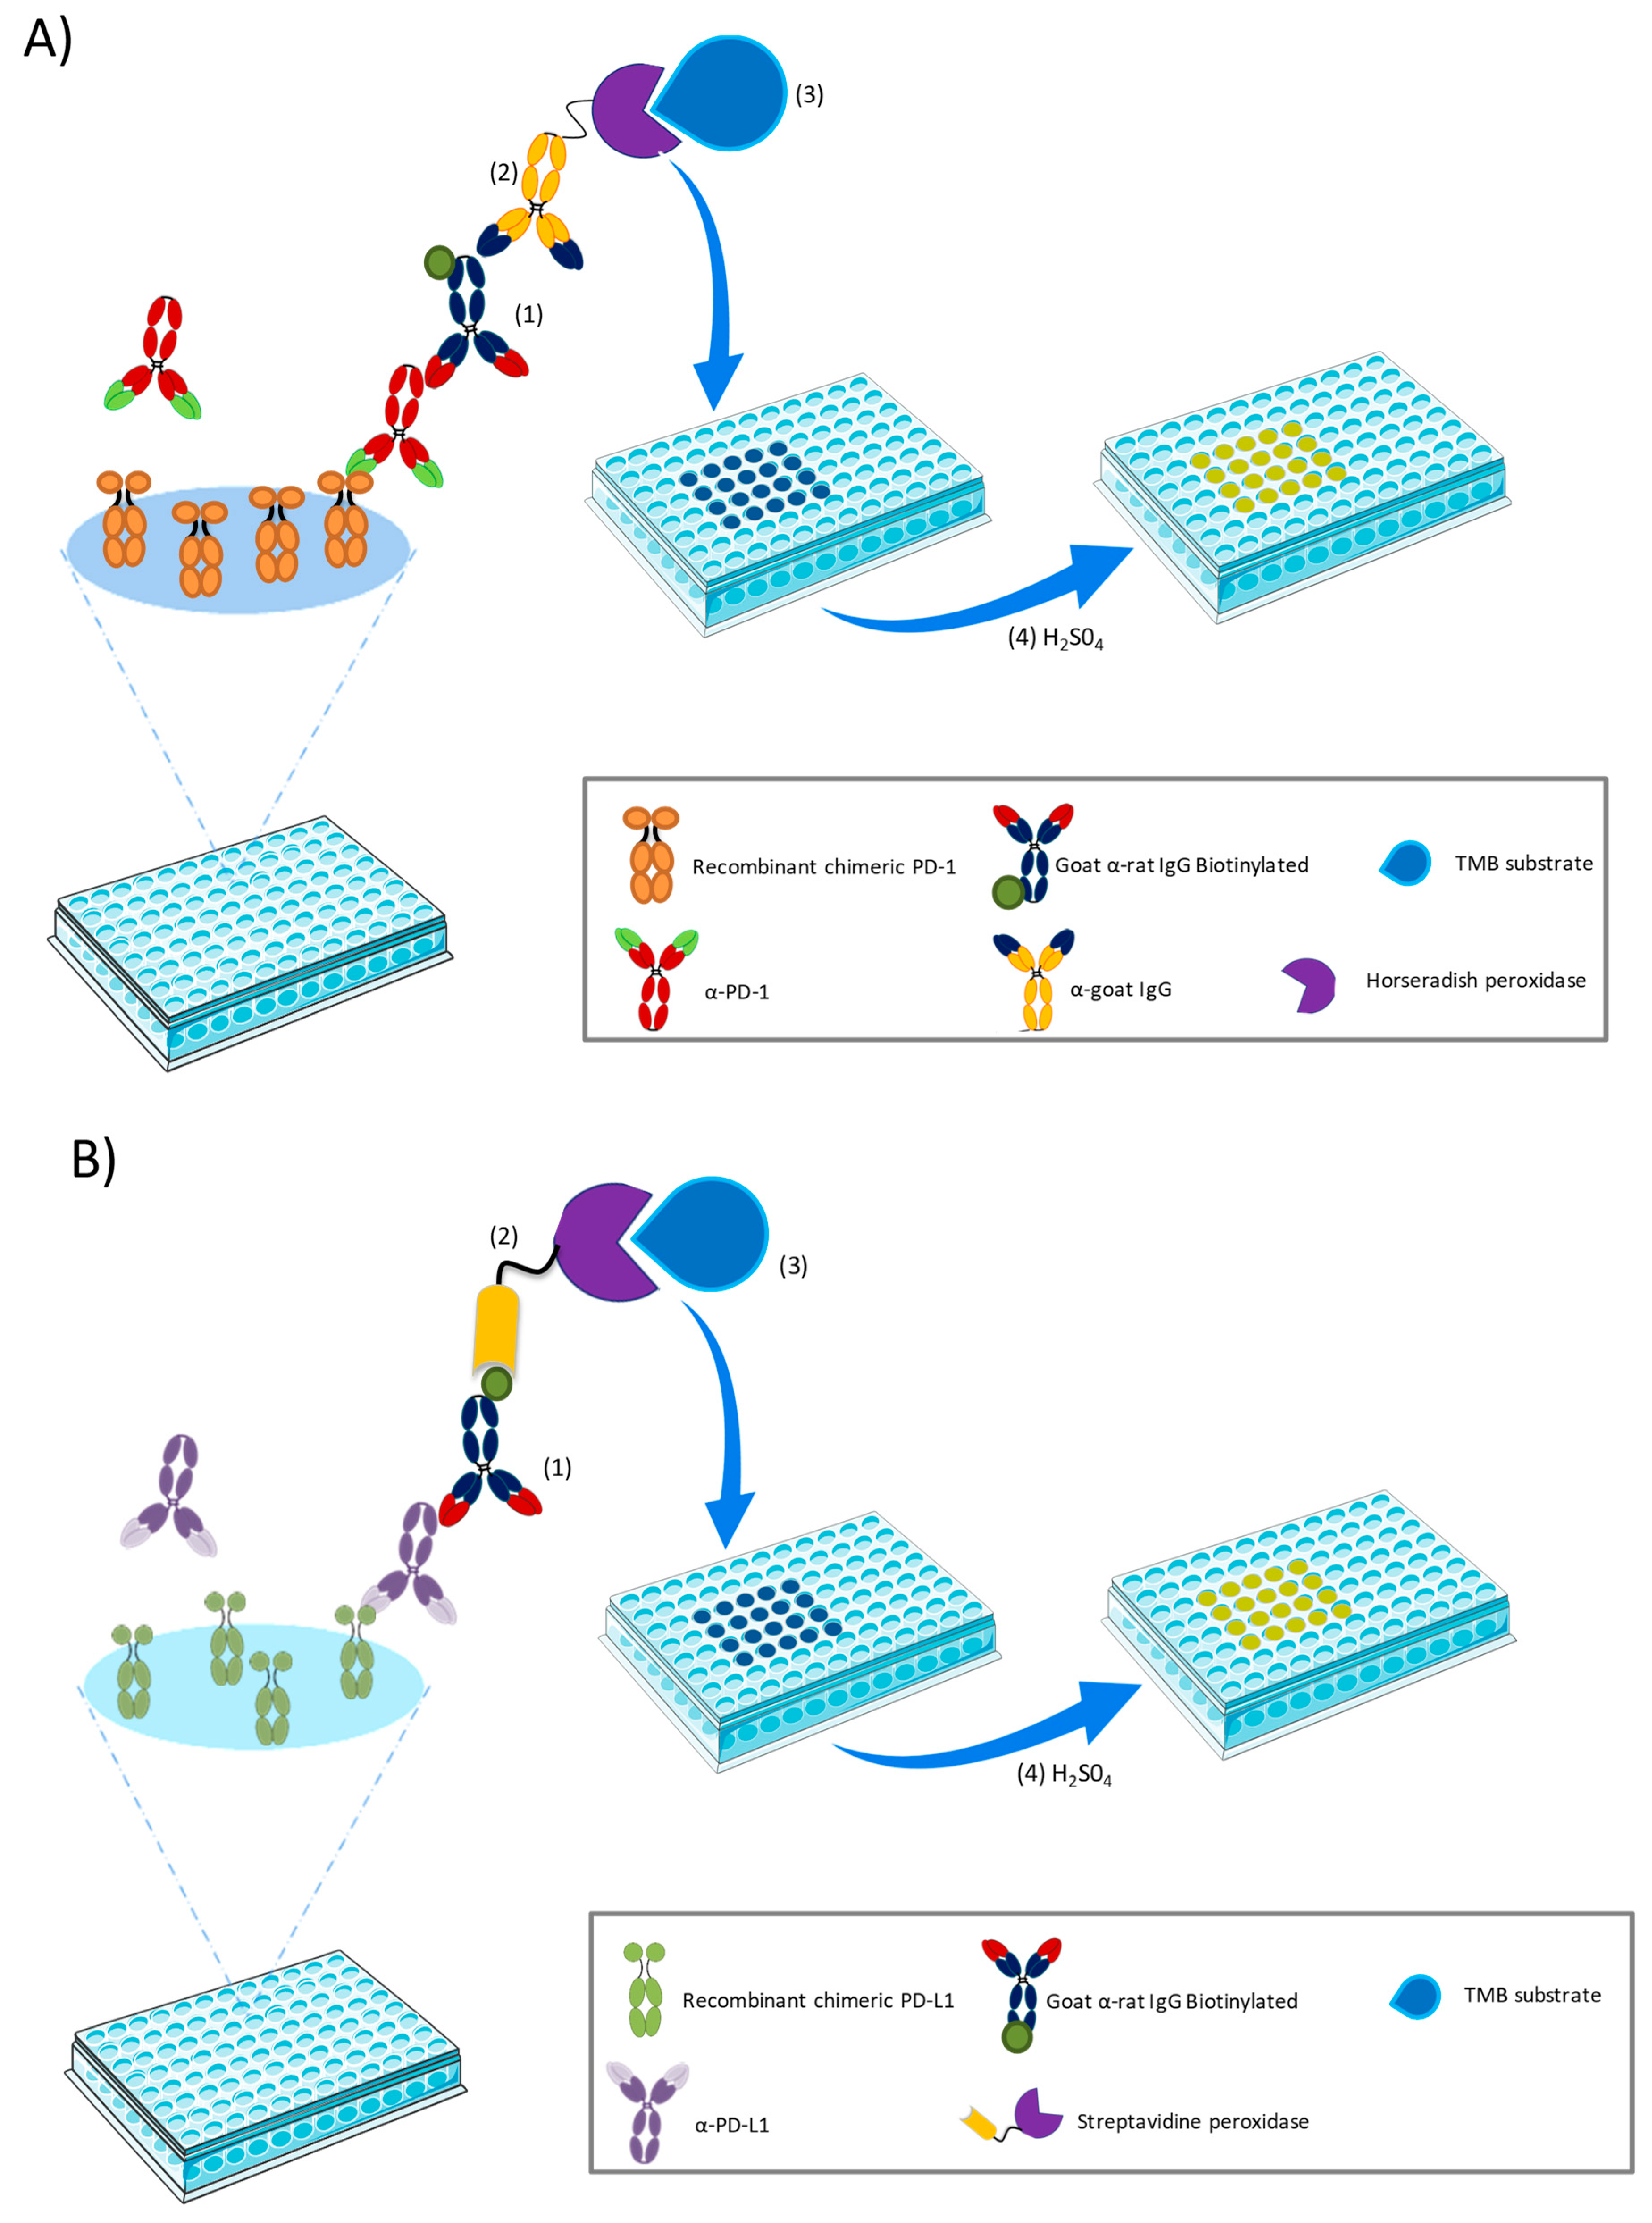
a-PD-1 ELISA
a-PD-L1 ELISA
2.2.2. ELISA Validation
Optimization of the Labeling Signal
Linear Range
Determination of the Limits of Quantification and Detection
Precision and Accuracy
Stability and Plate Drift
2.2.3. a-PD-1 and a-PD-L1 Pharmacokinetics
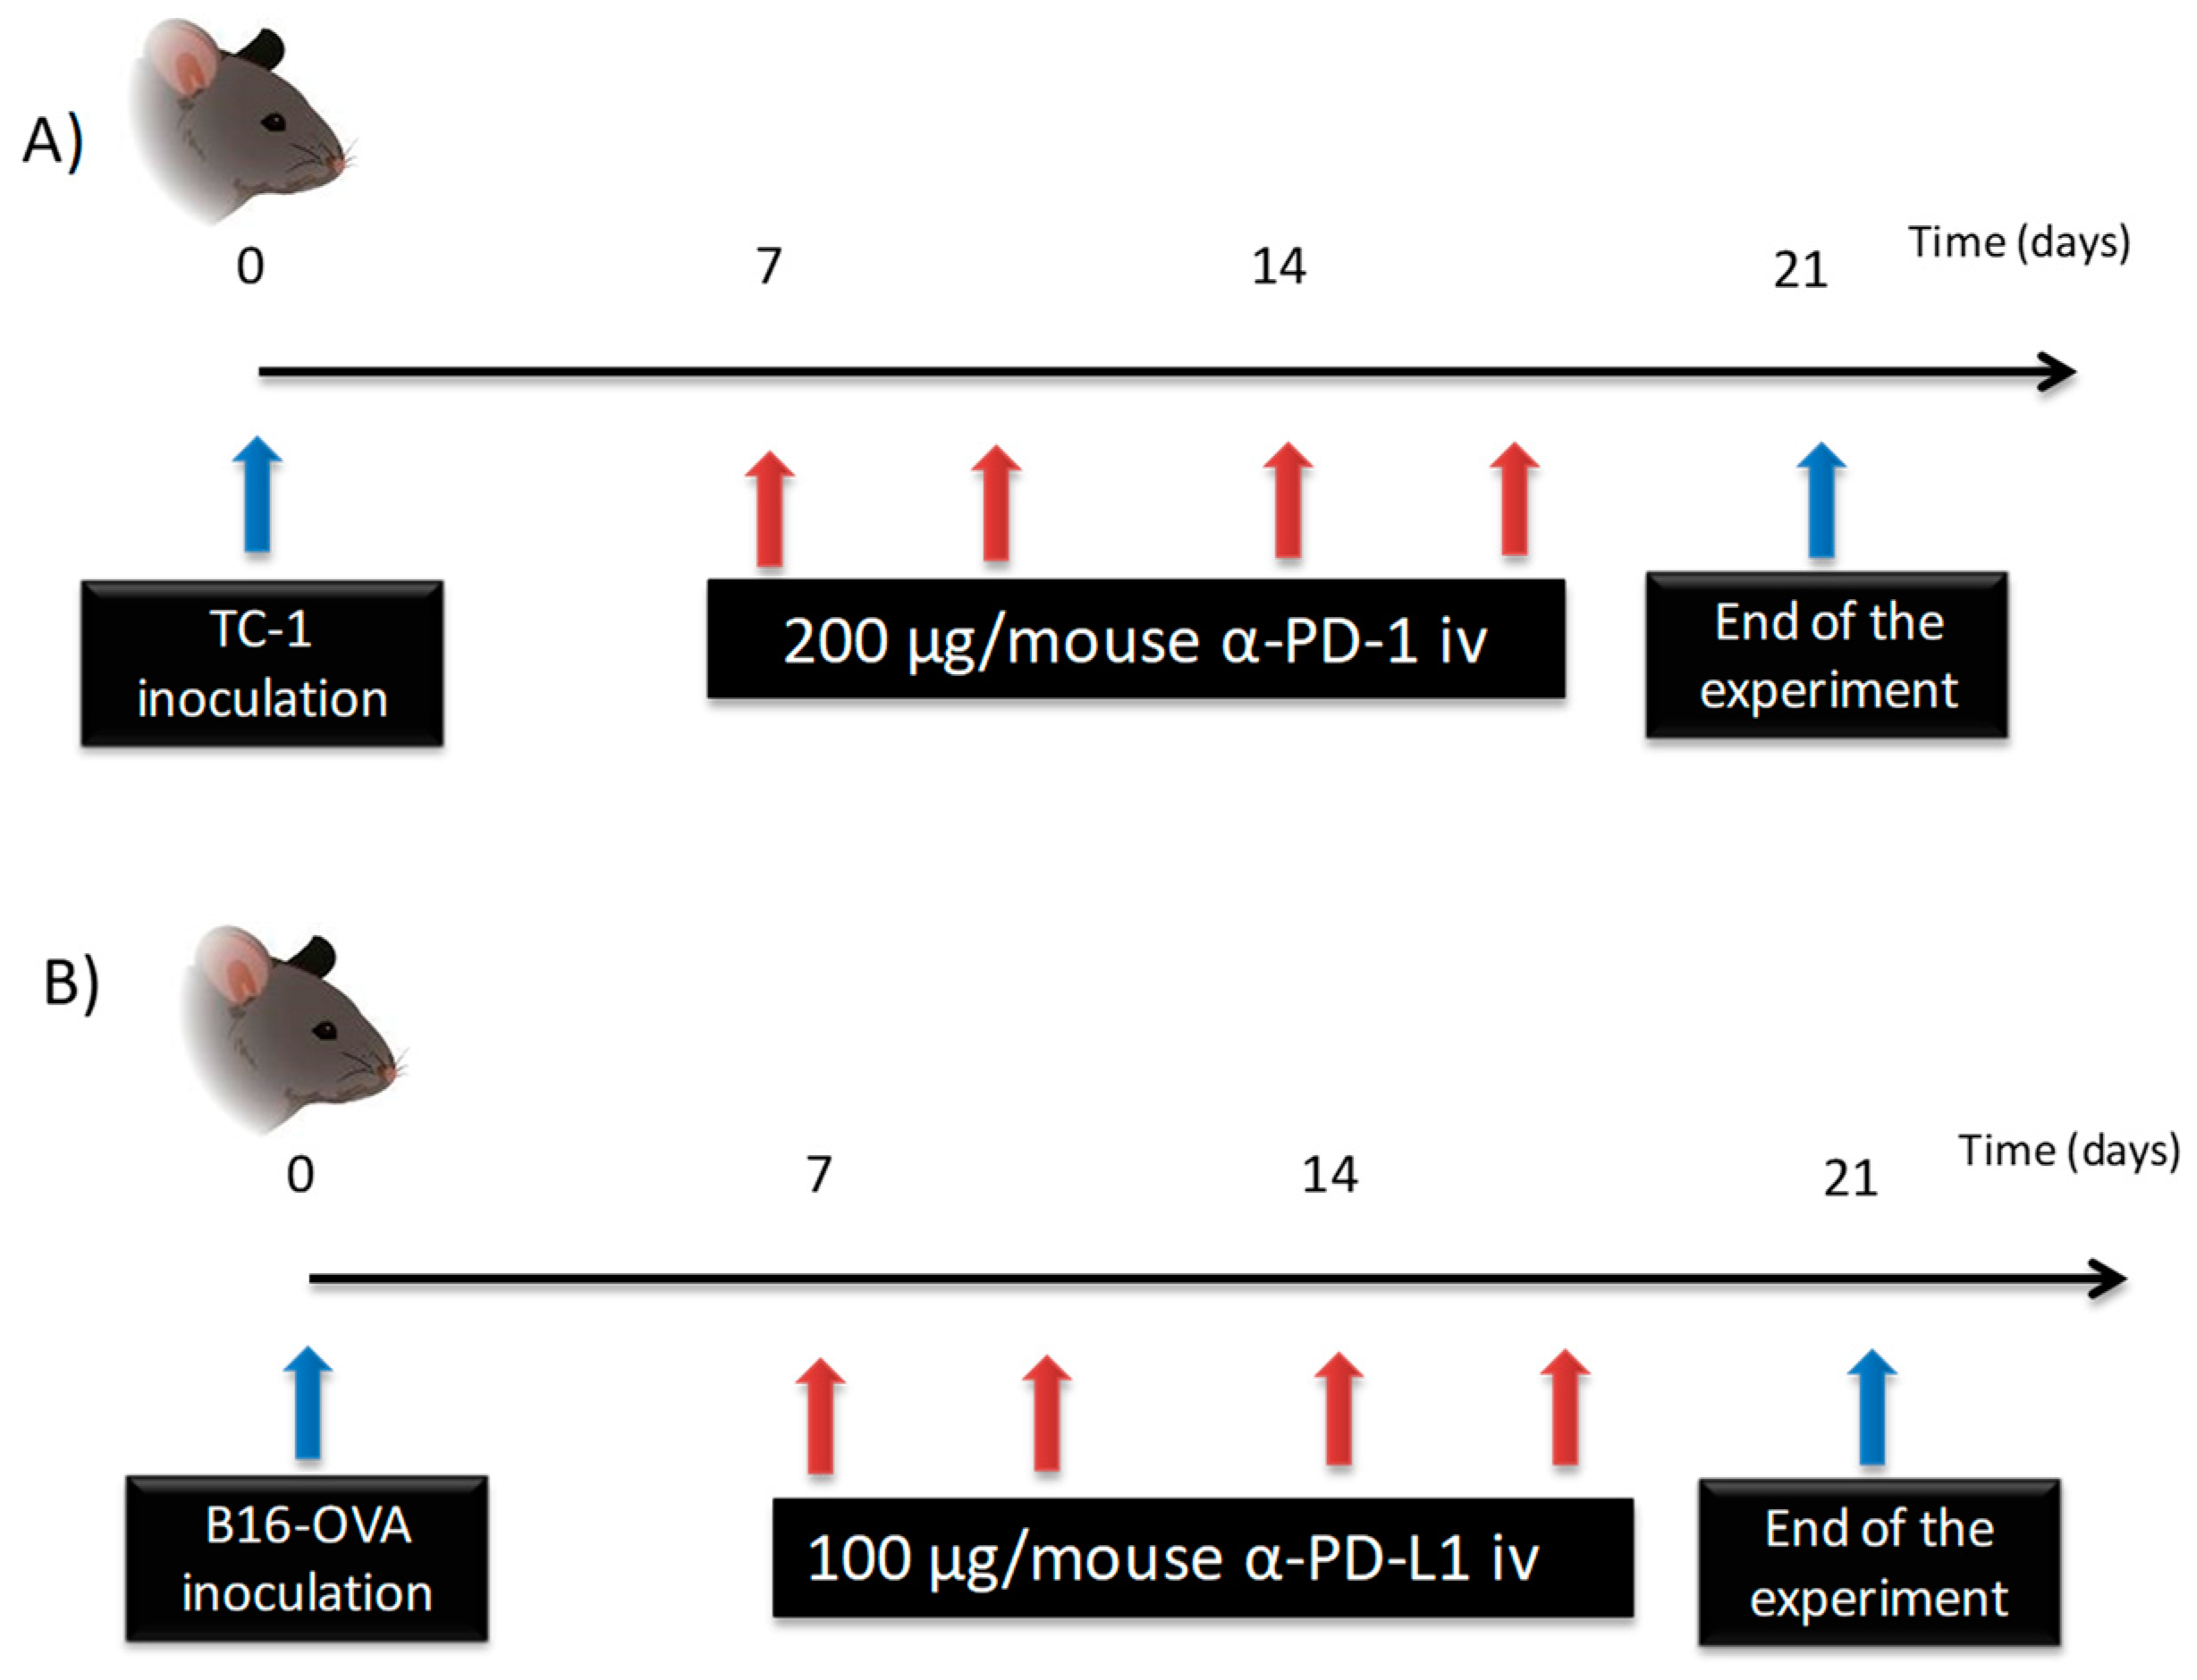
2.2.3.1. Characterization of a-PD-1 Pharmacokinetics
2.2.3.2. Characterization of a-PD-L1 in an In Vivo Model
2.2.4. Statistical Analysis
3. Results
3.1. ELISA Validation
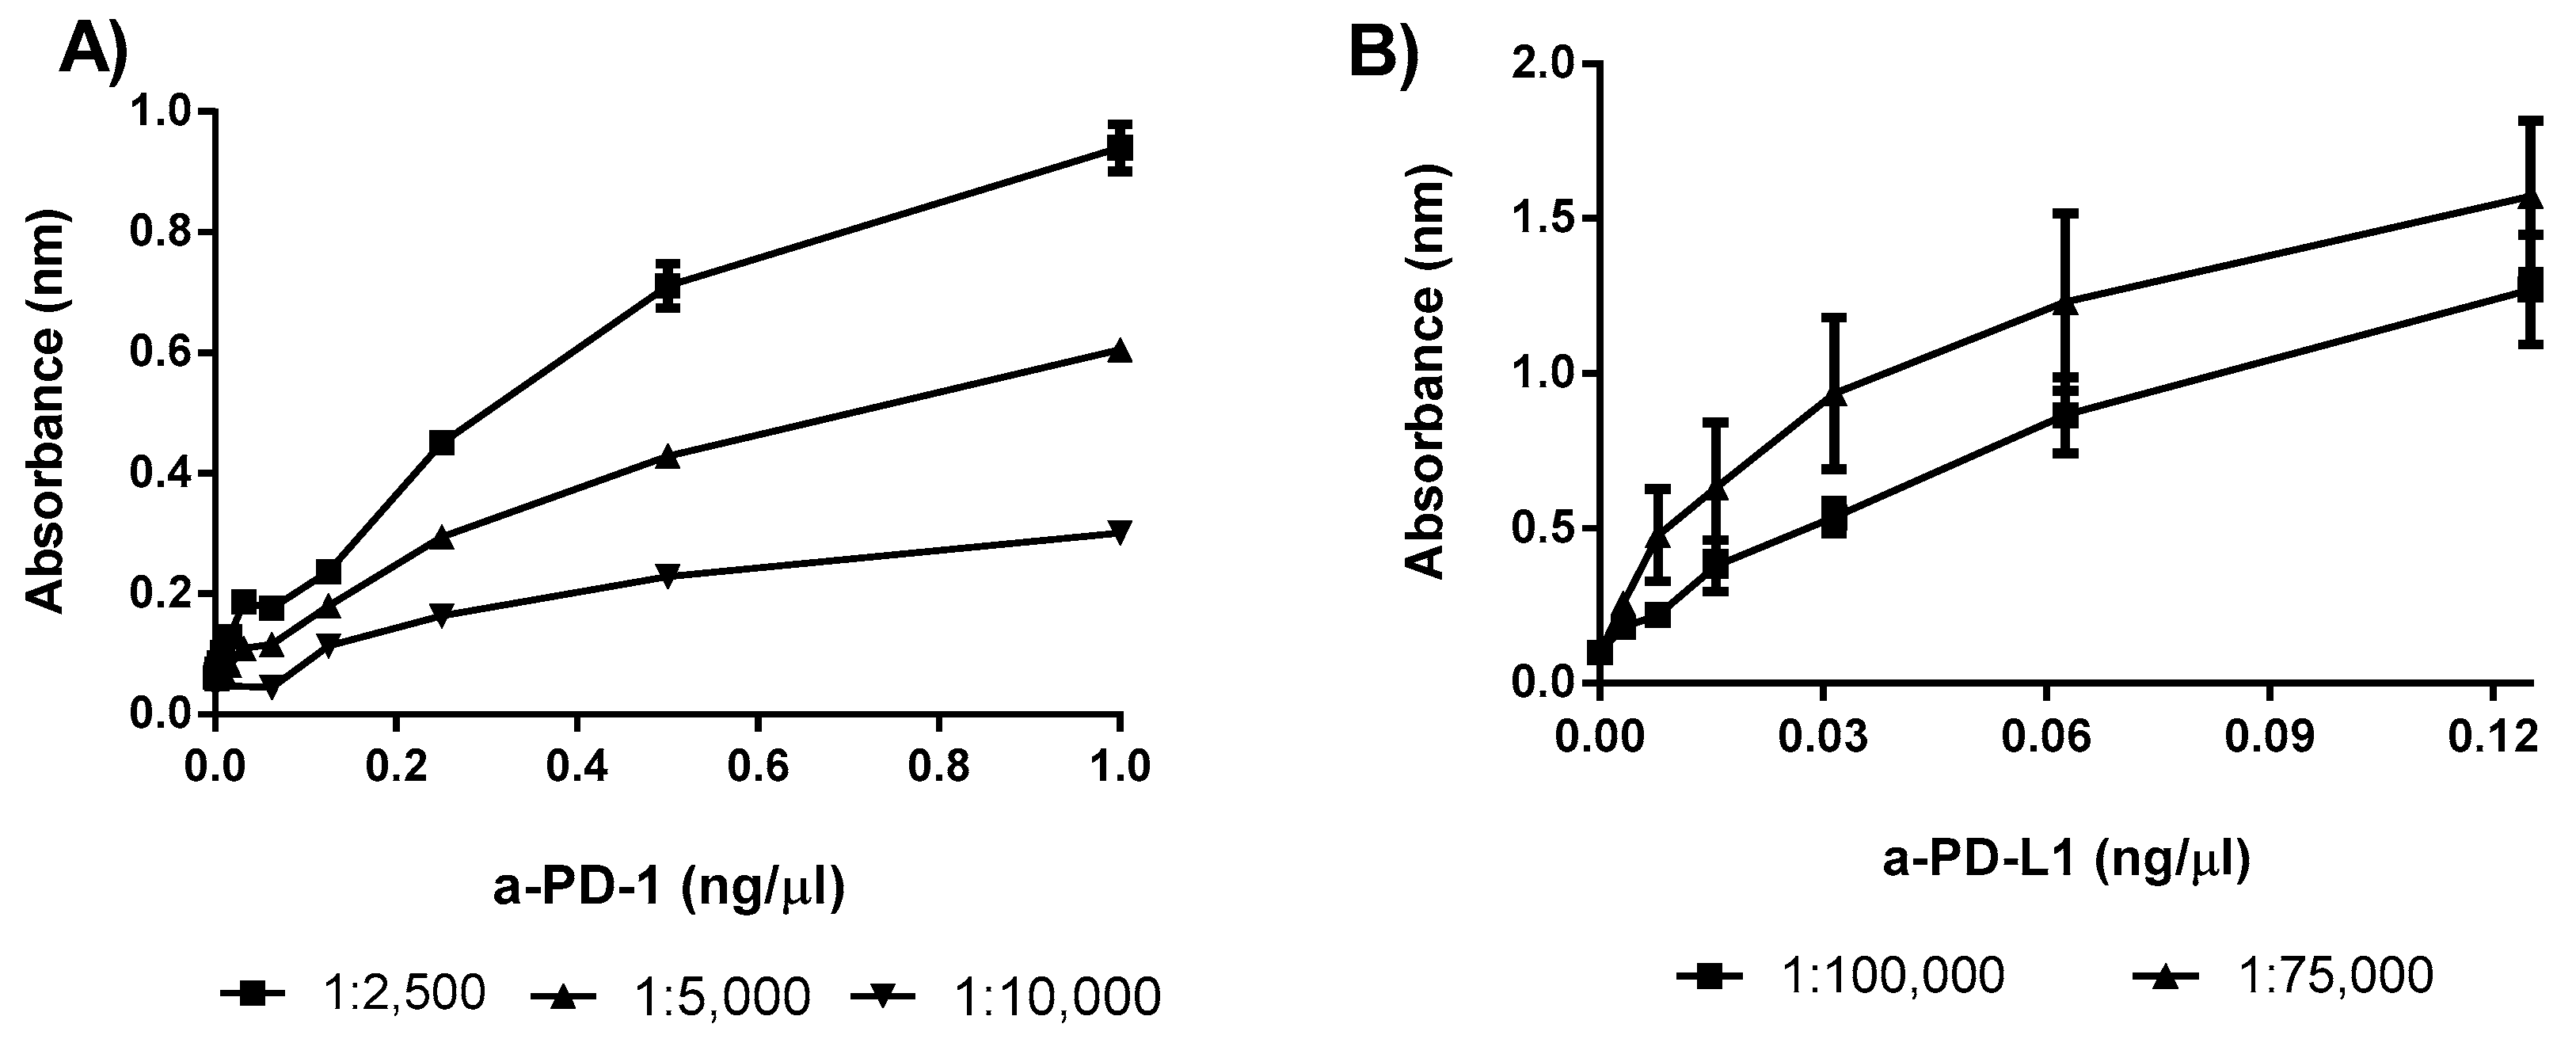
3.1.1. Optimization of the Secondary Antibody
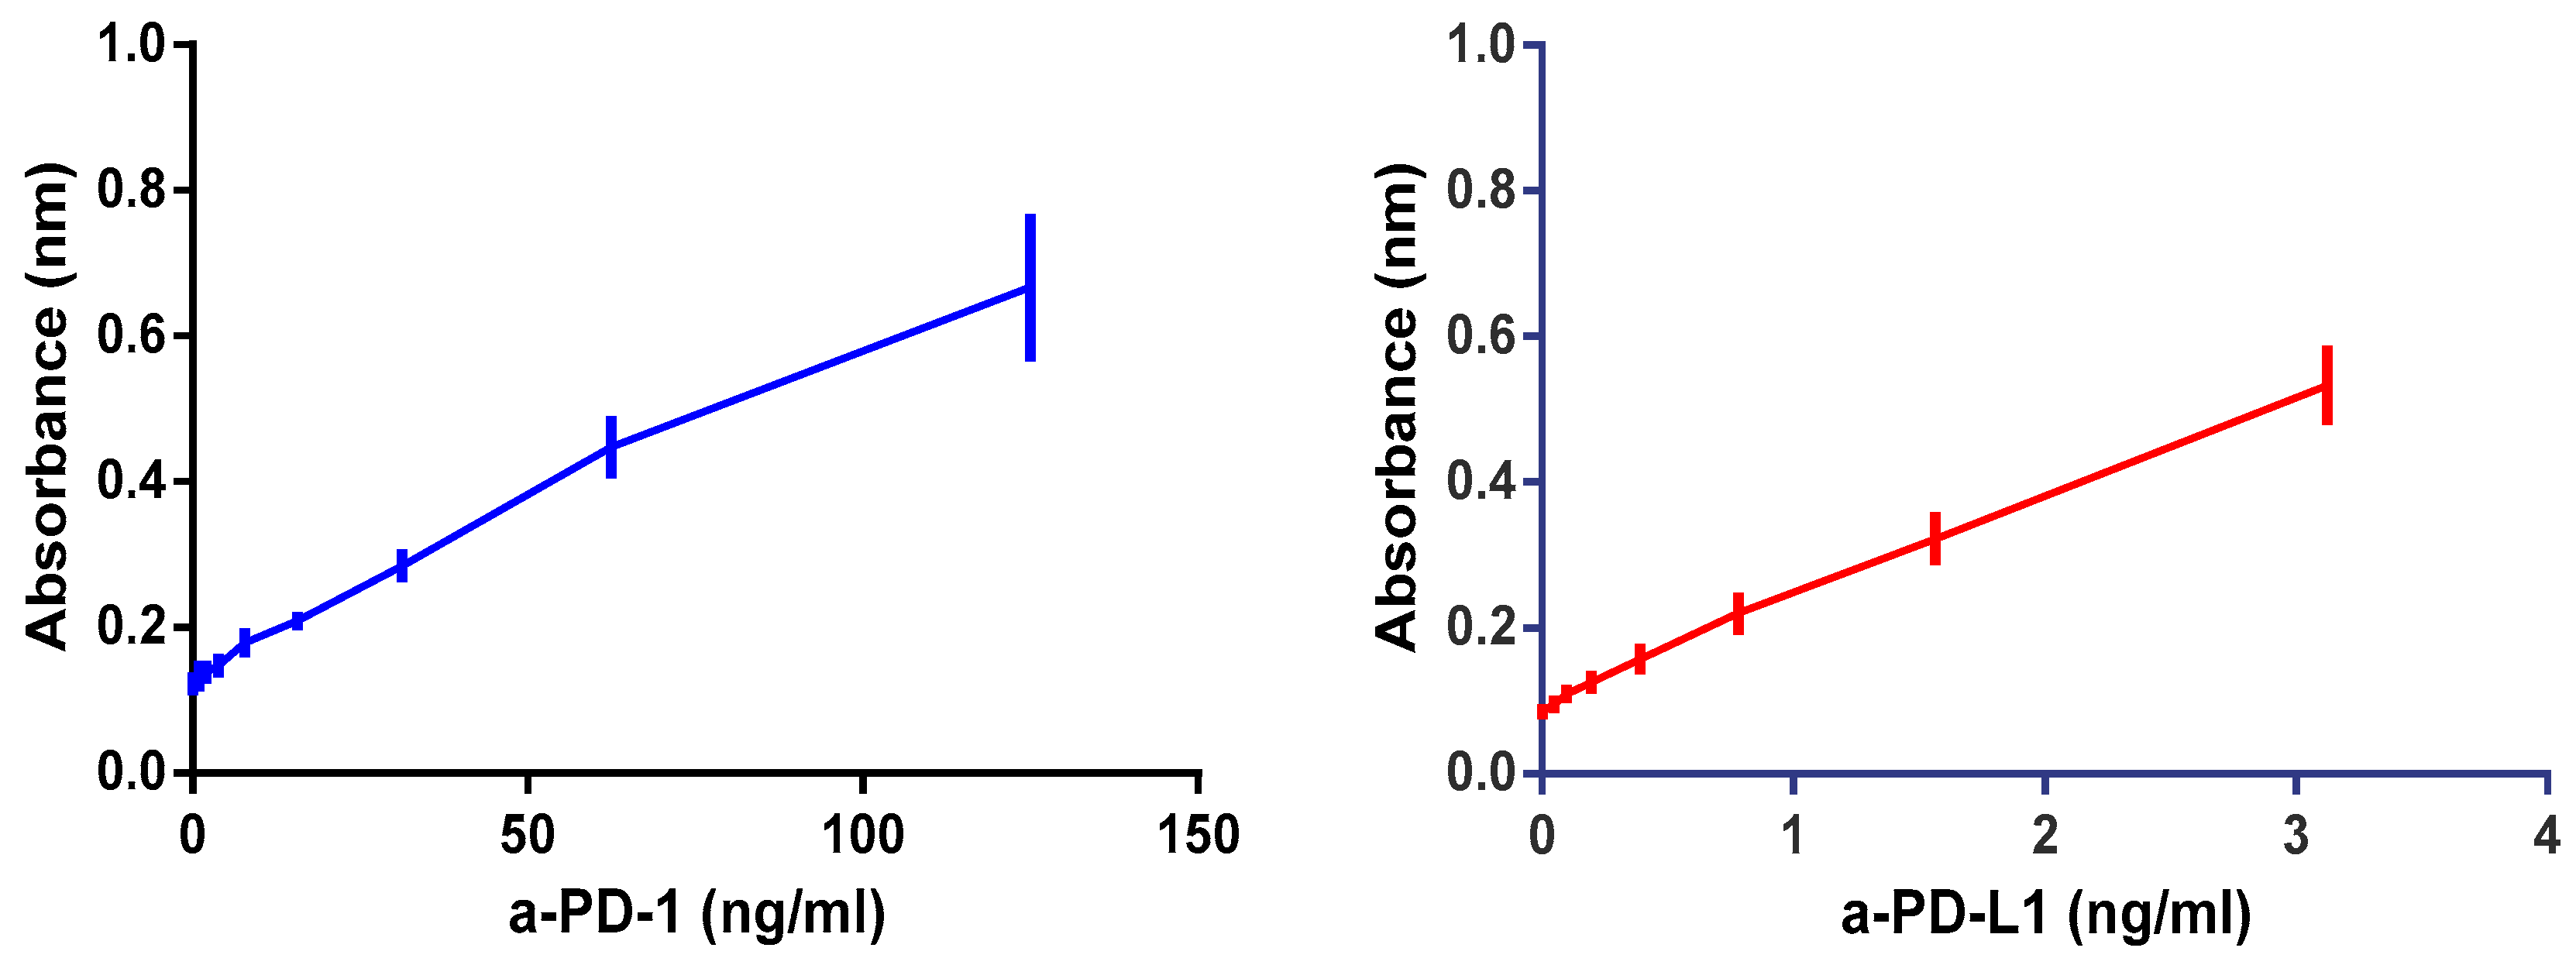
3.1.2. Linearity
3.1.3. LOQ and LOD
3.1.4. Precision and Accuracy
3.1.5. Stability and Plate Drift
3.2. InVivo Characterization of Plasma Immune Checkpoint Inhibitor Levels
3.2.1. a-PD-1 Plasma Time Course Profile
3.2.2. a-PD-L1 Plasma Time Profile
4. Discussion
Supplementary Materials
Author Contributions
Funding
Acknowledgments
Conflicts of Interest
References
- Singh, S.; Kumar, N.K.; Dwiwedi, P.; Charan, J.; Kaur, R.; Sidhu, P.; Chugh, V.K. Monoclonal antibodies: A review. Curr. Clin. Pharmacol. 2018, 13, 85–99. [Google Scholar] [CrossRef] [PubMed]
- Shuptrine, C.W.; Surana, R.; Weiner, L.M. Monoclonal antibodies for the treatment of cancer. Semin. Cancer Biol. 2012, 22, 3–13. [Google Scholar] [CrossRef] [PubMed] [Green Version]
- Sharma, P.; Allison, J.P. Immune checkpoint targeting in cancer therapy: Toward combination strategies with curative potential. Cell 2015, 161, 205–214. [Google Scholar] [CrossRef] [PubMed] [Green Version]
- Kon, E.; Benhar, I. Immune checkpoint inhibitor combinations: Current efforts and important aspects for success. Drug Resist. Updat. 2019, 45, 13–29. [Google Scholar] [CrossRef] [PubMed]
- Constantinidou, A.; Alifieris, C.; Trafalis, D.T. Targeting programmed cell death -1 (PD-1) and ligand (PD-L1): A new era in cancer active immunotherapy. Pharmacol. Ther. 2019, 194, 84–106. [Google Scholar] [CrossRef] [PubMed]
- Ceeraz, S.; Nowak, E.C.; Noelle, R.J. B7 family checkpoint regulators in immune regulation and disease. Trends Immunol. 2013, 34, 556–563. [Google Scholar] [CrossRef] [PubMed] [Green Version]
- Jiang, X.; Wang, J.; Deng, X.; Xiong, F.; Ge, J.; Xiang, B.; Wu, X.; Ma, J.; Zhou, M.; Li, X.; et al. Role of the tumor microenvironment in PD-L1/PD-1-mediated tumor immune escape. Mol. Cancer 2019, 18, 1–17. [Google Scholar] [CrossRef] [Green Version]
- Escors, D.; Gato-Cañas, M.; Zuazo, M.; Arasanz, H.; García-Granda, M.J.; Vera, R.; Kochan, G. The intracellular signalosome of PD-L1 in cancer cells. Signal Transduct. Target. Ther. 2018, 3, 26. [Google Scholar] [CrossRef] [Green Version]
- Inthagard, J.; Edwards, J.; Roseweir, A.K. Immunotherapy: Enhancing the efficacy of this promising therapeutic in multiple cancers. Clin. Sci. 2019, 133, 181–193. [Google Scholar] [CrossRef]
- Kyi, C.; Postow, M.A. Immune checkpoint inhibitor combinations in solid tumors: Opportunities and challenges. Immunotherapy 2016, 8, 821–837. [Google Scholar] [CrossRef] [Green Version]
- Thallinger, C.; Füreder, T.; Preusser, M.; Heller, G.; Müllauer, L.; Höller, C.; Prosch, H.; Frank, N.; Swierzewski, R.; Berger, W.; et al. Review of cancer treatment with immune checkpoint inhibitors: Current concepts, expectations, limitations and pitfalls. Wien. Klin. Wochenschr. 2018, 130, 85–91. [Google Scholar] [CrossRef] [PubMed] [Green Version]
- Hopkins, A.M.; Rowland, A.; Kichenadasse, G.; Wiese, M.D.; Gurney, H.; McKinnon, R.A.; Karapetis, C.S.; Sorich, M.J. Predicting response and toxicity to immune checkpoint inhibitors using routinely available blood and clinical markers. Br. J. Cancer 2017, 117, 913–920. [Google Scholar] [CrossRef] [PubMed]
- Venkatakrishnan, K.; Friberg, L.E.; Ouellet, D.; Mettet, J.T.; Stein, A.; Trocóniz, I.F.; Bruno, R.; Mehrotra, N.; Gobburu, J.; Mould, D.R. Optimizing oncology therapeutics through quantitative translational and clinical pharmacology: Challenges and opportunities. Clin. Pharmacol. Ther. 2015, 97, 37–54. [Google Scholar] [CrossRef] [PubMed]
- Kurino, T.; Matsuda, R.; Terui, A.; Suzuki, H.; Kokubo, T.; Uehara, T.; Arano, Y.; Hisaka, A.; Hatakeyama, H. Poor outcome with anti-programmed death-ligand 1 (PD-L1) antibody due to poor pharmacokinetic properties in PD-1/PD-L1 blockade-sensitive mouse models. J. Immunother. Cancer 2020, 8, e000400. [Google Scholar] [CrossRef] [Green Version]
- Xu, M.; Han, Y.; Liu, G.; Xu, Y.; Duan, D.; Liu, H.; Du, F.; Luo, P.; Liu, Z. Preclinical study of a fully human anti-PD-L1 antibody as a theranostic agent for cancer immunotherapy. Mol. Pharm. 2018, 15, 4426–4433. [Google Scholar] [CrossRef]
- Jagoda, E.M.; Vasalatiy, O.; Basuli, F.; Opina, A.C.L.; Williams, M.R.; Wong, K.; Lane, K.C.; Adler, S.; Ton, A.T.; Szajek, L.P.; et al. Immuno-PET imaging of the programmed cell death-1 ligand (PD-L1) using a zirconium-89 labeled therapeutic antibody, avelumab. Mol. Imaging 2019, 18, 18. [Google Scholar] [CrossRef] [Green Version]
- Lequin, R.M. Enzyme immunoassay (EIA)/enzyme-linked immunosorbent assay (ELISA). Clin. Chem. 2005, 51, 2415–2418. [Google Scholar] [CrossRef] [Green Version]
- FDA Method Validation Guide 2018. Available online: https://www.fda.gov/regulatory-information/search-fda-guidance-documents/bioanalytical-method-validation-guidance-industry (accessed on 20 May 2018).
- Puszkiel, A.; Noé, G.; Boudou-Rouquette, P.; Cossec, C.L.; Arrondeau, J.; Giraud, J.S.; Thomas-Schoemann, A.; Alexandre, J.; Vidal, M.; Goldwasser, F.; et al. Development and validation of an ELISA method for the quantification of nivolumab in plasma from non-small-cell lung cancer patients. J. Pharm. Biomed. Anal. 2017, 139, 30–36. [Google Scholar] [CrossRef]
- U.S. Department of Health and Human Services Food and Drug Administration. Guidance for Industry: Bioanalytical Method Validation; U.S. Department of Health and Human Services Food and Drug Administration: Rockville, MD, USA, May 2018; pp. 4–10. [Google Scholar]
- Belter, M.; Sajnóg, A.; Barałkiewicz, D. Over a century of detection and quantification capabilities in analytical chemistry—Historical overview and trends. Talanta 2014, 129, 606–616. [Google Scholar] [CrossRef]
- Xie, Q.; Deng, W.; Yuan, X.; Wang, H.; Ma, Z.; Wu, B.; Zhang, X. Selenium-functionalized liposomes for systemic delivery of doxorubicin with enhanced pharmacokinetics and anticancer effect. Eur. J. Pharm. Biopharm. 2018, 122, 87–95. [Google Scholar] [CrossRef]
- Shah, V.M.; Nguyen, D.X.; Alfatease, A.; Bracha, S.; Alani, A.W. Characterization of pegylated and non-pegylated liposomal formulation for the delivery of hypoxia activated vinblastine-N-oxide for the treatment of solid tumors. J. Control. Release 2017, 253, 37–45. [Google Scholar] [CrossRef] [PubMed]
- Lesniak, W.G.; Chatterjee, S.; Gabrielson, M.; Lisok, A.; Wharram, B.; Pomper, M.G.; Nimmagadda, S. PD-L1 detection in tumors using [64Cu]atezolizumab with PET. Bioconjugate Chem. 2016, 27, 2103–2110. [Google Scholar] [CrossRef] [PubMed] [Green Version]
- Pluim, D.; Ros, W.; van Bussel, M.T.J.; Brandsma, D.; Beijnen, J.H.; Schellens, J.H.M. Enzyme linked immunosorbent assay for the quantification of nivolumab and pembrolizumab in human serum and cerebrospinal fluid. J. Pharm. Biomed. Anal. 2019, 164, 128–134. [Google Scholar] [CrossRef]
- Fu, J.; Wang, F.; Dong, L.H.; Zhang, J.; Deng, C.L.; Wang, X.L.; Xie, X.Y.; Deng, R.X.; Zhang, L.B.; Wu, H.; et al. Preclinical evaluation of the efficacy, pharmacokinetics and immunogenicity of JS-001, a programmed cell death protein-1 (PD-1) monoclonal antibody. Acta Pharmacol. Sin. 2017, 38, 710–718. [Google Scholar] [CrossRef] [PubMed] [Green Version]
- Deng, R.; Bumbaca, D.; Pastuskovas, C.V.; Boswell, C.A.; West, D.; Cowan, K.J.; Chiu, H.; McBride, J.; Johnson, C.; Xin, Y.; et al. Preclinical pharmacokinetics, pharmacodynamics, tissue distribution, and tumor penetration of anti-PD-L1 monoclonal antibody, an immune checkpoint inhibitor. MAbs 2016, 8, 593–603. [Google Scholar] [CrossRef] [PubMed]
- Garcês, S.; Demengeot, J. The immunogenicity of biologic therapies. Curr. Probl. Dermatol. 2017, 53, 37–48. [Google Scholar] [PubMed]
- Liu, L. Pharmacokinetics of monoclonal antibodies and Fc-fusion proteins. Protein Cell 2018, 9, 15–32. [Google Scholar] [CrossRef]
- Zhu, A.Z. Quantitative translational modeling to facilitate preclinical to clinical efficacy & toxicity translation in oncology. Futur. Sci. OA 2018, 4, FSO306. [Google Scholar]


| PD-1 | PD-L1 | ||
|---|---|---|---|
| Curve Equation | r2 | Curve Equation | r2 |
| y = 0.005645x +0.1341 | 0.99 | y = 0.1403x + 0.10950 | 0.99 |
| y = 0.003423x + 0.1359 | 0.99 | y = 0.1386x + 0.09234 | 0.99 |
| y = 0.003899x + 0.1414 | 0.99 | y = 0.1473x + 0.09648 | 0.99 |
| y = 0.004170x + 0.1156 | 0.99 | y = 0.1382x + 0.08988 | 0.99 |
| y = 0.004084x + 0.1192 | 0.98 | y = 0.1476x + 0.11510 | 0.99 |
| y = 0.004636x + 0.1503 | 0.99 | y = 0.1551x +0.10730 | 0.99 |
| Average curve | Average curve | ||
| y = 0.004408x + 0.1367 | 0.99 | y = 0.1419x + 0.09598 | 0.99 |
| Antibodies | Slope | Intercept | Linear Range (ng/mL) | ||
|---|---|---|---|---|---|
| CI (95%) (ng/mL) | CV | CI (95%) (ng/mL) | CV | ||
| a-PD-1 | 0.00405–0.0047 | 10.89% | 0.1195–0.1539 | 9.95% | 125–2.5 |
| a-PD-L1 | 0.1347–0.1492 | 12.34% | 0.08672–0.105 | 10.20% | 3.125–0.11 |
| (A) | Intra-Day Variability | Inter-Day Variability | ||||
| 62.5 ng/mL | 15.62 ng/mL | 3.9 ng/mL | 62.5 ng/mL | 15.62 ng/mL | 3.9 ng/mL | |
| Average | 64.04 | 15.85 | 4.06 | 62.85 | 16.27 | 3.82 |
| SD | 1.24 | 2.32 | 0.52 | 2.74 | 2.22 | 0.53 |
| CV | 1.94% | 14.66% | 12.79% | 4.36% | 13.64% | 13.85% |
| Imprecision | 2.47% | 1.51% | 4.29% | 0.57% | 4.19% | −1.90% |
| (B) | Intra-Day Variability | Inter-Day Variability | ||||
| 3.12 ng/mL | 0.78 ng/mL | 0.19 ng/mL | 3.12 ng/mL | 0.78 ng/mL | 0.19 ng/mL | |
| Average | 2.721 | 0.90 | 0.19 | 2.95 | 0.90 | 0.21 |
| SD | 0.405 | 0.04 | 0.02 | 0.184 | 0.05 | 0.03 |
| CV | 14.87% | 4.87% | 9.98% | 6.21% | 5.36% | 16.54% |
| Imprecision | −12.93% | 15.46% | −4.63% | −5.33% | 15.84% | 7.17% |
| Antibodies | Dilutions | |||
|---|---|---|---|---|
| 1:1 | 1:2 | 1:4 | 1:8 | |
| a-PD-1 (62.5 ng/mL) | 58.71 ± 0.98 | 63.83 ± 13.86 | 64.04 ± 1.86 | 61.93 ± 4.66 |
| Imprecision | 6.06% | 2.13% | 2.46% | 0.91% |
| a-PD-L1 (3.25 ng/mL) | 3.14 ± 0.48 | 3.25 ± 0.51 | 3.39 ± 0.18 | 3.26 ± 1.06 |
| Imprecision | 3.38% | 0.00% | 4.31% | 0.31% |
| a-PD-1 | a-PD-L1 | ||||||
|---|---|---|---|---|---|---|---|
| ng/mL | Fresh Sample | Day 30 | p | ng/mL | Fresh Sample | Day 30 | p |
| 62.5 | 64.18 ± 8.38 | 61.81 ± 5.10 | ns | 3.125 | 3.53 ± 0.27 | 3.82 ± 0.44 | ns |
| 15.6 | 17.05 ± 3.65 | 16.69 ± 2.53 | ns | 0.781 | 0.90 ± 0.16 | 0.81 ± 0.03 | ns |
| 3.9 | 3.258 ± 1.25 | 3.464 ± 1.75 | ns | 0.195 | 0.189 ± 0.01 | 0.24 ± 0.04 | ns |
| AUC0−∞ (µg·h/mL) | t1/2(h) | Cl (mL/h) | Vd (mL) |
|---|---|---|---|
| 2427.35 | 22.3 | 0.0823 | 2.5 |
| AUC0−∞ (µg·h/mL) | t1/2 (h) | Cl (mL/h) | Vd (mL) |
|---|---|---|---|
| 1996.42 | 46.7 | 0.050 | 3.3 |
© 2020 by the authors. Licensee MDPI, Basel, Switzerland. This article is an open access article distributed under the terms and conditions of the Creative Commons Attribution (CC BY) license (http://creativecommons.org/licenses/by/4.0/).
Share and Cite
Zalba, S.; Contreras-Sandoval, A.M.; Martisova, E.; Debets, R.; Smerdou, C.; Garrido, M.J. Quantification of Pharmacokinetic Profiles of PD-1/PD-L1 Antibodies by Validated ELISAs. Pharmaceutics 2020, 12, 595. https://doi.org/10.3390/pharmaceutics12060595
Zalba S, Contreras-Sandoval AM, Martisova E, Debets R, Smerdou C, Garrido MJ. Quantification of Pharmacokinetic Profiles of PD-1/PD-L1 Antibodies by Validated ELISAs. Pharmaceutics. 2020; 12(6):595. https://doi.org/10.3390/pharmaceutics12060595
Chicago/Turabian StyleZalba, Sara, Ana M. Contreras-Sandoval, Eva Martisova, Reno Debets, Christian Smerdou, and María Jesús Garrido. 2020. "Quantification of Pharmacokinetic Profiles of PD-1/PD-L1 Antibodies by Validated ELISAs" Pharmaceutics 12, no. 6: 595. https://doi.org/10.3390/pharmaceutics12060595