Imbalance of Drug Transporter-CYP450s Interplay by Diabetes and Its Clinical Significance


Abstract
:
1. Introduction
2. Liver
2.1. OATPs
2.2. P-gp
2.3. BCRP
2.4. MRP2
2.5. CYP450s
2.6. Interplay of Transporter-CYP450s in Liver
- CLint,back is much smaller than the sum of CLint,bile and CLint,met, thus, CLint,all is equal to CLint,up; this is to say, CLint,all is only controlled by uptake clearance, which is mainly mediated by influx transporters. Typical drugs are statins.
- Sum of CLint,bile and CLint,met is much less than CLint,back. CLint,all = CLint,up × (CLint,bile + CLint,met)/CLint,back, indicating that CLint,all is determined by the net effect of CLint,up, CLint,back, CLint,bile and CLint,met.
- Some drugs (such as midazolam) are not substrates of transporters. These drugs also rapidly penetrate the sinusoidal membrane, i.e., CLint,up = CLint,back, thus, CLint,all = CLint,bile + CLint,met.
3. Intestine
3.1. P-gp
3.2. MRP2
3.3. BCRP
3.4. PepT1
3.5. MCT6
3.6. CYP450s
3.7. Transporter-CYP450 Interplay in Intestine
4. Kidney
4.1. OAT1 and OAT3
4.2. OCTs
4.3. Other Transporters
4.4. CYP450
4.5. Transporter Interplay in Kidney
5. Application of PBPK to Transporter-Enzyme Interplay
5.1. Atorvastatin
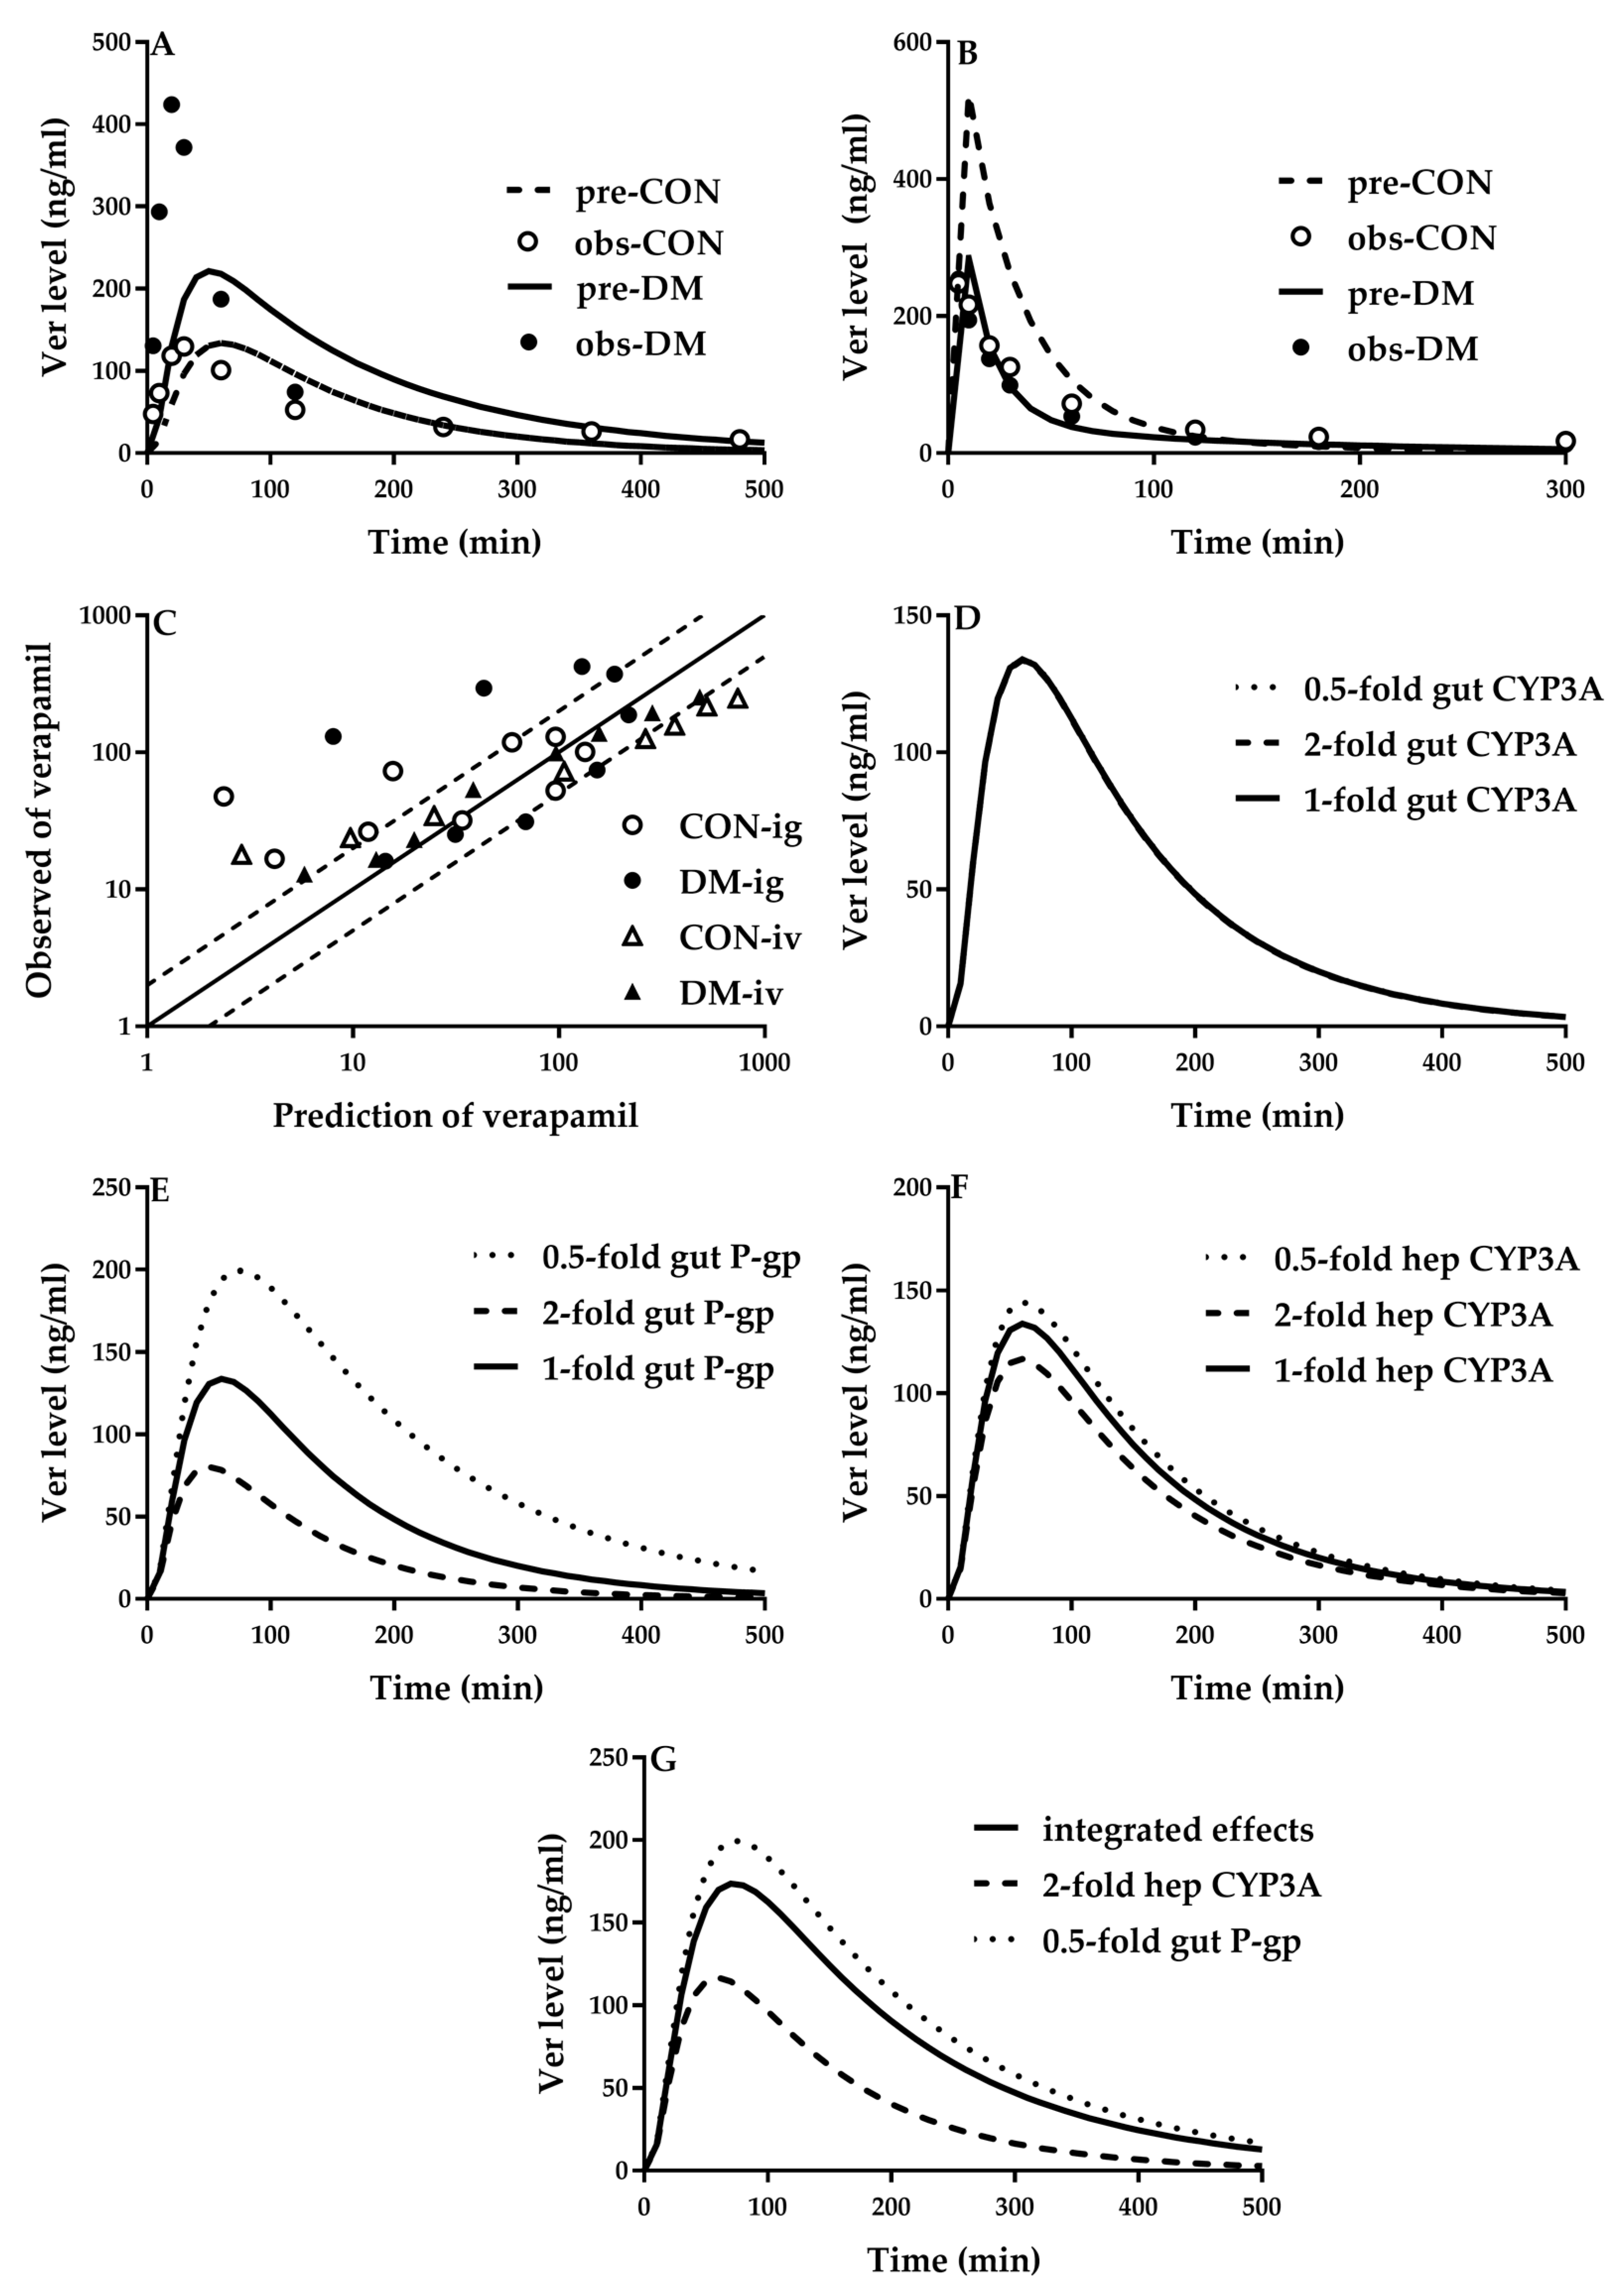
5.2. Verapamil
5.3. Furosemide
5.4. Metformin and Nisoldipine
6. Future Perspective
Author Contributions
Funding
Conflicts of Interest
Abbreviations
References
- Lu, C.; Di, L. In vitro and in vivo methods to assess pharmacokinetic drug–drug interactions in drug discovery and development. Biopharm. Drug Dispos. 2020, 41, 3–31. [Google Scholar] [CrossRef] [Green Version]
- Bteich, M.; Poulin, P.; Haddad, S. The potential protein-mediated hepatic uptake: Discussion on the molecular interactions between albumin and the hepatocyte cell surface and their implications for the in vitro-to-in vivo extrapolations of hepatic clearance of drugs. Expert Opin. Drug Metab. Toxicol. 2019, 15, 633–658. [Google Scholar] [CrossRef]
- Liu, X. SLC Family Transporters. Adv. Exp. Med. Biol. 2019, 1141, 101–202. [Google Scholar] [CrossRef] [PubMed]
- Park, J.E.; Kim, K.B.; Bae, S.K.; Moon, B.S.; Liu, K.H.; Shin, J.G. Contribution of cytochrome P450 3A4 and 3A5 to the metabolism of atorvastatin. Xenobiotica 2008, 38, 1240–1251. [Google Scholar] [CrossRef] [PubMed]
- Goosen, T.C.; Bauman, J.N.; Davis, J.A.; Yu, C.; Hurst, S.I.; Williams, J.A.; Loi, C.M. Atorvastatin glucuronidation is minimally and nonselectively inhibited by the fibrates gemfibrozil, fenofibrate, and fenofibric acid. Drug Metab. Dispos. 2007, 35, 1315–1324. [Google Scholar] [CrossRef] [PubMed]
- Li, J.; Volpe, D.A.; Wang, Y.; Zhang, W.; Bode, C.; Owen, A.; Hidalgo, I.J. Use of transporter knockdown Caco-2 cells to investigate the in vitro efflux of statin drugs. Drug Metab. Dispos. 2011, 39, 1196–1202. [Google Scholar] [CrossRef] [PubMed] [Green Version]
- Choi, M.K.; Shin, H.J.; Choi, Y.L.; Deng, J.W.; Shin, J.G.; Song, I.S. Differential effect of genetic variants of Na+-taurocholate co-transporting polypeptide (NTCP) and organic anion-transporting polypeptide 1B1 (OATP1B1) on the uptake of HMG-CoA reductase inhibitors. Xenobiotica 2011, 41, 24–34. [Google Scholar] [CrossRef]
- Keppler, D.; Konig, J. Hepatic secretion of conjugated drugs and endogenous substances. Semin. Liver Dis. 2000, 20, 265–272. [Google Scholar] [CrossRef]
- Shu, N.; Hu, M.; Liu, C.; Zhang, M.; Ling, Z.; Zhang, J.; Xu, P.; Zhong, Z.; Chen, Y.; Liu, L.; et al. Decreased exposure of atorvastatin in diabetic rats partly due to induction of hepatic Cyp3a and Oatp2. Xenobiotica 2016, 46, 875–881. [Google Scholar] [CrossRef]
- Li, F.; Ling, Z.L.; Wang, Z.J.; Zhong, Z.Y.; Shu, N.; Zhang, M.; Liu, C.; Liu, L.; Liu, X.D. Differential effects of pravastatin on the pharmacokinetics of paroxetine in normal and diabetic rats. Xenobiotica 2017, 47, 20–30. [Google Scholar] [CrossRef]
- Wang, Z.; Yang, H.; Xu, J.; Zhao, K.; Chen, Y.; Liang, L.; Li, P.; Chen, N.; Geng, D.; Zhang, X.; et al. Prediction of Atorvastatin Pharmacokinetics in High-Fat Diet and Low-Dose Streptozotocin-Induced Diabetic Rats Using a Semiphysiologically Based Pharmacokinetic Model Involving Both Enzymes and Transporters. Drug Metab. Dispos. 2019, 47, 1066–1079. [Google Scholar] [CrossRef] [PubMed]
- Xu, D.; Li, F.; Zhang, M.; Zhang, J.; Liu, C.; Hu, M.Y.; Zhong, Z.Y.; Jia, L.L.; Wang, D.W.; Wu, J.; et al. Decreased exposure of simvastatin and simvastatin acid in a rat model of type 2 diabetes. Acta Pharm. Sin. 2014, 35, 1215–1225. [Google Scholar] [CrossRef] [PubMed] [Green Version]
- Hasegawa, Y.; Kishimoto, S.; Shibatani, N.; Inotsume, N.; Takeuchi, Y.; Fukushima, S. The disposition of pravastatin in a rat model of streptozotocin-induced diabetes and organic anion transporting polypeptide 2 and multidrug resistance-associated protein 2 expression in the liver. Biol. Pharm. Bull. 2010, 33, 153–156. [Google Scholar] [CrossRef] [PubMed] [Green Version]
- Babalik, A.; Ulus, I.H.; Bakirci, N.; Kuyucu, T.; Arpag, H.; Dagyildizi, L.; Capaner, E. Plasma concentrations of isoniazid and rifampin are decreased in adult pulmonary tuberculosis patients with diabetes mellitus. Antimicrob. Agents Chemother. 2013, 57, 5740–5742. [Google Scholar] [CrossRef] [PubMed] [Green Version]
- Nijland, H.M.; Ruslami, R.; Stalenhoef, J.E.; Nelwan, E.J.; Alisjahbana, B.; Nelwan, R.H.; van der Ven, A.J.; Danusantoso, H.; Aarnoutse, R.E.; van Crevel, R. Exposure to rifampicin is strongly reduced in patients with tuberculosis and type 2 diabetes. Clin. Infect. Dis. 2006, 43, 848–854. [Google Scholar] [CrossRef]
- Kameyama, N.; Arisawa, S.; Ueyama, J.; Kagota, S.; Shinozuka, K.; Hattori, A.; Tatsumi, Y.; Hayashi, H.; Takagi, K.; Wakusawa, S. Increase in P-glycoprotein accompanied by activation of protein kinase Cα and NF- κB p65 in the livers of rats with streptozotocin-induced diabetes. Biochim. Biophys. Acta 2008, 1782, 355–360. [Google Scholar] [CrossRef] [Green Version]
- Lee, J.H.; Lee, A.; Oh, J.H.; Lee, Y.J. Comparative pharmacokinetic study of paclitaxel and docetaxel in streptozotocin-induced diabetic rats. Biopharm. Drug Dispos. 2012, 33, 474–486. [Google Scholar] [CrossRef]
- Zhang, L.L.; Lu, L.; Jin, S.; Jing, X.Y.; Yao, D.; Hu, N.; Liu, L.; Duan, R.; Liu, X.D.; Wang, G.J.; et al. Tissue-specific alterations in expression and function of P-glycoprotein in streptozotocin-induced diabetic rats. Acta Pharm. Sin. 2011, 32, 956–966. [Google Scholar] [CrossRef] [Green Version]
- zhang, L.L.; Jin, S.; Li, J.; Duan, R.; Liu, X.D. Tissue species damage in expression and function of breast cancer resistance protein streptotozocin-induced diabetic rats. J. China Pharmceut Unversit. 2011, 42, 544–550. [Google Scholar]
- He, L.; Yang, Y.; Guo, C.; Yao, D.; Liu, H.H.; Sheng, J.J.; Zhou, W.P.; Ren, J.; Liu, X.D.; Pan, G.Y. Opposite regulation of hepatic breast cancer resistance protein in type 1 and 2 diabetes mellitus. Eur. J. Pharm. 2014, 724, 185–192. [Google Scholar] [CrossRef]
- Aleksunes, L.M.; Xu, J.; Lin, E.; Wen, X.; Goedken, M.J.; Slitt, A.L. Pregnancy represses induction of efflux transporters in livers of type I diabetic mice. Pharm. Res. 2013, 30, 2209–2220. [Google Scholar] [CrossRef] [PubMed]
- van Waarde, W.M.; Verkade, H.J.; Wolters, H.; Havinga, R.; Baller, J.; Bloks, V.; Muller, M.; Sauer, P.J.; Kuipers, F. Differential effects of streptozotocin-induced diabetes on expression of hepatic ABC-transporters in rats. Gastroenterology 2002, 122, 1842–1852. [Google Scholar] [CrossRef] [PubMed]
- Mei, D.; Li, J.; Liu, H.; Liu, L.; Wang, X.; Guo, H.; Liu, C.; Duan, R.; Liu, X. Induction of multidrug resistance-associated protein 2 in liver, intestine and kidney of streptozotocin-induced diabetic rats. Xenobiotica 2012, 42, 709–718. [Google Scholar] [CrossRef] [PubMed]
- Nakashima, E.; Matsushita, R.; Takeda, M.; Nakanishi, T.; Ichimura, F. Comparative pharmacokinetics of cefoperazone and cephradine in untreated streptozotocin diabetic rats. Drug Metab. Dispos. 1992, 20, 730–735. [Google Scholar] [PubMed]
- Watkins, J.B.; Noda, H. Biliary excretion of organic anions in diabetic rats. J. Pharm. Exp. Ther. 1986, 239, 467–473. [Google Scholar]
- Shimojo, N.; Ishizaki, T.; Imaoka, S.; Funae, Y.; Fujii, S.; Okuda, K. Changes in amounts of cytochrome P450 isozymes and levels of catalytic activities in hepatic and renal microsomes of rats with streptozocin-induced diabetes. Biochem. Pharm. 1993, 46, 621–627. [Google Scholar] [CrossRef]
- Hu, N.; Xie, S.; Liu, L.; Wang, X.; Pan, X.; Chen, G.; Zhang, L.; Liu, H.; Liu, X.; Liu, X.; et al. Opposite effect of diabetes mellitus induced by streptozotocin on oral and intravenous pharmacokinetics of verapamil in rats. Drug Metab. Dispos. 2011, 39, 419–425. [Google Scholar] [CrossRef] [Green Version]
- Kim, Y.C.; Lee, A.K.; Lee, J.H.; Lee, I.; Lee, D.C.; Kim, S.H.; Kim, S.G.; Lee, M.G. Pharmacokinetics of theophylline in diabetes mellitus rats: Induction of CYP1A2 and CYP2E1 on 1,3-dimethyluric acid formation. Eur. J. Pharm. Sci. 2005, 26, 114–123. [Google Scholar] [CrossRef]
- Chen, G.M.; Hu, N.; Liu, L.; Xie, S.S.; Wang, P.; Li, J.; Xie, L.; Wang, G.J.; Liu, X.D. Pharmacokinetics of verapamil in diabetic rats induced by combination of high-fat diet and streptozotocin injection. Xenobiotica 2011, 41, 494–500. [Google Scholar] [CrossRef]
- Gawronska-Szklarz, B.; Musial, D.H.; Pawlik, A.; Paprota, B. Effect of experimental diabetes on pharmacokinetic parameters of lidocaine and MEGX in rats. Pol. J. Pharm. 2003, 55, 619–624. [Google Scholar]
- Wang, X.; Wang, F.; Zhang, Y.; Xiong, H.; Zhang, Y.; Zhuang, P.; Zhang, Y. Diabetic cognitive dysfunction is associated with increased bile acids in liver and activation of bile acid signaling in intestine. Toxicol. Lett. 2018, 287, 10–22. [Google Scholar] [CrossRef] [PubMed]
- Drolet, B.; Pilote, S.; Gelinas, C.; Kamaliza, A.D.; Blais-Boilard, A.; Virgili, J.; Patoine, D.; Simard, C. Altered Protein Expression of Cardiac CYP2J and Hepatic CYP2C, CYP4A, and CYP4F in a Mouse Model of Type II Diabetes-A Link in the Onset and Development of Cardiovascular Disease? Pharmaceutics 2017, 9, 44. [Google Scholar] [CrossRef] [PubMed] [Green Version]
- Bae, S.K.; Kim, J.Y.; Yang, S.H.; Kim, J.W.; Kim, T.; Lee, M.G. Pharmacokinetics of oltipraz in rat models of diabetes mellitus induced by alloxan or streptozotocin. Life Sci. 2006, 78, 2287–2294. [Google Scholar] [CrossRef] [PubMed]
- Lee, D.Y.; Lee, M.G.; Shin, H.S.; Lee, I. Changes in omeprazole pharmacokinetics in rats with diabetes induced by alloxan or streptozotocin: Faster clearance of omeprazole due to induction of hepatic CYP1A2 and 3A1. J. Pharm. Pharm. Sci. 2007, 10, 420–433. [Google Scholar] [CrossRef] [Green Version]
- Ueyama, J.; Wang, D.; Kondo, T.; Saito, I.; Takagi, K.; Takagi, K.; Kamijima, M.; Nakajima, T.; Miyamoto, K.; Wakusawa, S.; et al. Toxicity of diazinon and its metabolites increases in diabetic rats. Toxicol. Lett. 2007, 170, 229–237. [Google Scholar] [CrossRef]
- Maksymchuk, O.; Shysh, A.; Rosohatska, I.; Chashchyn, M. Quercetin prevents type 1 diabetic liver damage through inhibition of CYP2E1. Pharm. Rep. 2017, 69, 1386–1392. [Google Scholar] [CrossRef]
- Woodcroft, K.J.; Novak, R.F. Insulin effects on CYP2E1, 2B, 3A, and 4A expression in primary cultured rat hepatocytes. Chem. Biol. Interact. 1997, 107, 75–91. [Google Scholar] [CrossRef]
- Hu, N.; Hu, M.; Duan, R.; Liu, C.; Guo, H.; Zhang, M.; Yu, Y.; Wang, X.; Liu, L.; Liu, X. Increased levels of fatty acids contributed to induction of hepatic CYP3A4 activity induced by diabetes-in vitro evidence from HepG2 cell and Fa2N-4 cell lines. J. Pharm. Sci. 2014, 124, 433–444. [Google Scholar] [CrossRef] [Green Version]
- Elaidy, S.M.; Hussain, M.A.; El-Kherbetawy, M.K. Time-dependent therapeutic roles of nitazoxanide on high-fat diet/streptozotocin-induced diabetes in rats: Effects on hepatic peroxisome proliferator-activated receptor-gamma receptors. Can. J. Physiol. Pharm. 2018, 96, 485–497. [Google Scholar] [CrossRef] [Green Version]
- Zhang, C.; Deng, J.; Liu, D.; Tuo, X.; Xiao, L.; Lai, B.; Yao, Q.; Liu, J.; Yang, H.; Wang, N. Nuciferine ameliorates hepatic steatosis in high-fat diet/streptozocin-induced diabetic mice through a PPARα/PPARγ coactivator-1α pathway. Br. J. Pharm. 2018, 175, 4218–4228. [Google Scholar] [CrossRef]
- Ahmad, A.; Ali, T.; Kim, M.W.; Khan, A.; Jo, M.H.; Rehman, S.U.; Khan, M.S.; Abid, N.B.; Khan, M.; Ullah, R.; et al. Adiponectin homolog novel osmotin protects obesity/diabetes-induced NAFLD by upregulating AdipoRs/PPARα signaling in ob/ob and db/db transgenic mouse models. Metabolism 2019, 90, 31–43. [Google Scholar] [CrossRef] [PubMed]
- Shi, C.; Min, L.; Yang, J.; Dai, M.; Song, D.; Hua, H.; Xu, G.; Gonzalez, F.J.; Liu, A. Peroxisome Proliferator-Activated Receptor α Activation Suppresses Cytochrome P450 Induction Potential in Mice Treated with Gemfibrozil. Basic Clin. Pharm. Toxicol. 2017, 121, 169–174. [Google Scholar] [CrossRef] [PubMed]
- Liu, Y.; Nakagawa, Y.; Wang, Y.; Sakurai, R.; Tripathi, P.V.; Lutfy, K.; Friedman, T.C. Increased glucocorticoid receptor and 11β-hydroxysteroid dehydrogenase type 1 expression in hepatocytes may contribute to the phenotype of type 2 diabetes in db/db mice. Diabetes 2005, 54, 32–40. [Google Scholar] [CrossRef] [PubMed] [Green Version]
- Liu, Y.; Yan, C.; Wang, Y.; Nakagawa, Y.; Nerio, N.; Anghel, A.; Lutfy, K.; Friedman, T.C. Liver X receptor agonist T0901317 inhibition of glucocorticoid receptor expression in hepatocytes may contribute to the amelioration of diabetic syndrome in db/db mice. Endocrinology 2006, 147, 5061–5068. [Google Scholar] [CrossRef] [PubMed] [Green Version]
- Schuetz, E.G.; Schmid, W.; Schutz, G.; Brimer, C.; Yasuda, K.; Kamataki, T.; Bornheim, L.; Myles, K.; Cole, T.J. The glucocorticoid receptor is essential for induction of cytochrome P-4502B by steroids but not for drug or steroid induction of CYP3A or P-450 reductase in mouse liver. Drug Metab. Dispos. 2000, 28, 268–278. [Google Scholar] [PubMed]
- Gerbal-Chaloin, S.; Daujat, M.; Pascussi, J.M.; Pichard-Garcia, L.; Vilarem, M.J.; Maurel, P. Transcriptional regulation of CYP2C9 gene. Role of glucocorticoid receptor and constitutive androstane receptor. J. Biol. Chem. 2002, 277, 209–217. [Google Scholar] [CrossRef] [Green Version]
- Xu, F.; Zhu, L.; Qian, C.; Zhou, J.; Geng, D.; Li, P.; Xuan, W.; Wu, F.; Zhao, K.; Kong, W.; et al. Impairment of Intestinal Monocarboxylate Transporter 6 Function and Expression in Diabetic Rats Induced by Combination of High-Fat Diet and Low Dose of Streptozocin: Involvement of Butyrate-Peroxisome Proliferator-Activated Receptor-γ Activation. Drug Metab. Dispos. 2019, 47, 556–566. [Google Scholar] [CrossRef]
- Liu, H.; Liu, L.; Li, J.; Mei, D.; Duan, R.; Hu, N.; Guo, H.; Zhong, Z.; Liu, X. Combined contributions of impaired hepatic CYP2C11 and intestinal breast cancer resistance protein activities and expression to increased oral glibenclamide exposure in rats with streptozotocin-induced diabetes mellitus. Drug Metab. Dispos. 2012, 40, 1104–1112. [Google Scholar] [CrossRef]
- Kim, Y.C.; Oh, E.Y.; Kim, S.H.; Lee, M.G. Pharmacokinetics of diclofenac in rat model of diabetes mellitus induced by alloxan or steptozotocin. Biopharm. Drug Dispos. 2006, 27, 85–92. [Google Scholar] [CrossRef]
- Kim, Y.C.; Oh, E.Y.; Kim, S.H.; Lee, M.G. Pharmacokinetics and pharmacodynamics of intravenous torasemide in diabetic rats induced by alloxan or streptozotocin. Biopharm. Drug Dispos. 2005, 26, 371–378. [Google Scholar] [CrossRef]
- Kim, Y.C.; Kang, H.E.; Lee, M.G. Pharmacokinetics of phenytoin and its metabolite, 4’-HPPH, after intravenous and oral administration of phenytoin to diabetic rats induced by alloxan or streptozotocin. Biopharm. Drug Dispos. 2008, 29, 51–61. [Google Scholar] [CrossRef] [PubMed]
- Oh, S.J.; Choi, J.M.; Yun, K.U.; Oh, J.M.; Kwak, H.C.; Oh, J.G.; Lee, K.S.; Kim, B.H.; Heo, T.H.; Kim, S.K. Hepatic expression of cytochrome P450 in type 2 diabetic Goto-Kakizaki rats. Chem. Biol. Interact. 2012, 195, 173–179. [Google Scholar] [CrossRef] [PubMed]
- Shi, R.; Wu, J.; Meng, C.; Ma, B.; Wang, T.; Li, Y.; Ma, Y. Cyp3a11-mediated testosterone-6beta-hydroxylation decreased, while UGT1a9-mediated propofol O-glucuronidation increased, in mice with diabetes mellitus. Biopharm. Drug Dispos. 2016, 37, 433–443. [Google Scholar] [CrossRef] [PubMed]
- Lam, J.L.; Jiang, Y.; Zhang, T.; Zhang, E.Y.; Smith, B.J. Expression and functional analysis of hepatic cytochromes P450, nuclear receptors, and membrane transporters in 10-and 25-week-old db/db mice. Drug Metab. Dispos. 2010, 38, 2252–2258. [Google Scholar] [CrossRef]
- Park, S.Y.; Kim, C.H.; Lee, J.Y.; Jeon, J.S.; Kim, M.J.; Chae, S.H.; Kim, H.C.; Oh, S.J.; Kim, S.K. Hepatic expression of cytochrome P450 in Zucker diabetic fatty rats. Food Chem. Toxicol. 2016, 96, 244–253. [Google Scholar] [CrossRef]
- Patoine, D.; Petit, M.; Pilote, S.; Picard, F.; Drolet, B.; Simard, C. Modulation of CYP3a expression and activity in mice models of type 1 and type 2 diabetes. Pharm. Res. Perspect. 2014, 2, e00082. [Google Scholar] [CrossRef]
- Gravel, S.; Chiasson, J.L.; Turgeon, J.; Grangeon, A.; Michaud, V. Modulation of CYP450 Activities in Patients With Type 2 Diabetes. Clin. Pharm. Ther. 2019, 106, 1280–1289. [Google Scholar] [CrossRef]
- Gade, C.; Dalhoff, K.; Petersen, T.S.; Riis, T.; Schmeltz, C.; Chabanova, E.; Christensen, H.R.; Mikus, G.; Burhenne, J.; Holm, J.C.; et al. Higher chlorzoxazone clearance in obese children compared with nonobese peers. Br. J. Clin. Pharm. 2018, 84, 1738–1747. [Google Scholar] [CrossRef] [Green Version]
- Dostalek, M.; Court, M.H.; Yan, B.; Akhlaghi, F. Significantly reduced cytochrome P450 3A4 expression and activity in liver from humans with diabetes mellitus. Br. J. Pharm. 2011, 163, 937–947. [Google Scholar] [CrossRef] [Green Version]
- Marques, M.P.; Coelho, E.B.; Dos Santos, N.A.; Geleilete, T.J.; Lanchote, V.L. Dynamic and kinetic disposition of nisoldipine enantiomers in hypertensive patients presenting with type-2 diabetes mellitus. Eur. J. Clin. Pharm. 2002, 58, 607–614. [Google Scholar] [CrossRef]
- Moises, E.C.; Duarte Lde, B.; Cavalli Rde, C.; Marques, M.P.; Lanchote, V.L.; Duarte, G.; da Cunha, S.P. Pharmacokinetics of lidocaine and its metabolite in peridural anesthesia administered to pregnant women with gestational diabetes mellitus. Eur. J. Clin. Pharm. 2008, 64, 1189–1196. [Google Scholar] [CrossRef] [PubMed]
- Filgueira, G.C.O.; Filgueira, O.A.S.; Carvalho, D.M.; Marques, M.P.; Moises, E.C.D.; Duarte, G.; Lanchote, V.L.; Cavalli, R.C. Effect of type 2 diabetes mellitus on the pharmacokinetics and transplacental transfer of nifedipine in hypertensive pregnant women. Br. J. Clin. Pharm. 2017, 83, 1571–1579. [Google Scholar] [CrossRef] [PubMed]
- Antunes Nde, J.; Cavalli, R.C.; Marques, M.P.; Moises, E.C.; Lanchote, V.L. Influence of gestational diabetes on the stereoselective pharmacokinetics and placental distribution of metoprolol and its metabolites in parturients. Br. J. Clin. Pharm. 2015, 79, 605–616. [Google Scholar] [CrossRef] [PubMed] [Green Version]
- Adithan, C.; Srinivas, B.; Indhiresan, J.; Shashindran, C.H.; Bapna, J.S.; Thakur, L.C.; Swaminathan, R.P. Influence of type I and type II diabetes mellitus on phenytoin steady-state levels. Int. J. Clin. Pharm. Ther. Toxicol. 1991, 29, 310–313. [Google Scholar]
- Akhlaghi, F.; Dostalek, M.; Falck, P.; Mendonza, A.E.; Amundsen, R.; Gohh, R.Y.; Asberg, A. The concentration of cyclosporine metabolites is significantly lower in kidney transplant recipients with diabetes mellitus. Ther. Drug Monit. 2012, 34, 38–45. [Google Scholar] [CrossRef]
- Mendonza, A.E.; Gohh, R.Y.; Akhlaghi, F. Blood and plasma pharmacokinetics of ciclosporin in diabetic kidney transplant recipients. Clin. Pharm. 2008, 47, 733–742. [Google Scholar] [CrossRef]
- Wadhawan, S.; Jauhari, H.; Singh, S. Cyclosporine trough levels in diabetic and nondiabetic renal transplant patients. Transplant. Proc. 2000, 32, 1683–1684. [Google Scholar] [CrossRef]
- Jamwal, R.; de la Monte, S.M.; Ogasawara, K.; Adusumalli, S.; Barlock, B.B.; Akhlaghi, F. Nonalcoholic Fatty Liver Disease and Diabetes Are Associated with Decreased CYP3A4 Protein Expression and Activity in Human Liver. Mol. Pharm. 2018, 15, 2621–2632. [Google Scholar] [CrossRef]
- Matzke, G.R.; Frye, R.F.; Early, J.J.; Straka, R.J.; Carson, S.W. Evaluation of the influence of diabetes mellitus on antipyrine metabolism and CYP1A2 and CYP2D6 activity. Pharmacotherapy 2000, 20, 182–190. [Google Scholar] [CrossRef]
- Korrapati, M.R.; Vestal, R.E.; Loi, C.M. Theophylline metabolism in healthy nonsmokers and in patients with insulin-dependent diabetes mellitus. Clin. Pharm. Ther. 1995, 57, 413–418. [Google Scholar] [CrossRef]
- Adithan, C.; Danda, D.; Shashindran, C.H.; Bapna, J.S.; Swaminathan, R.P.; Chandrasekar, S. Differential effect of type I and type II diabetes mellitus on antipyrine elimination. Methods Find. Exp. Clin. Pharm. 1989, 11, 755–758. [Google Scholar]
- Zysset, T.; Wietholtz, H. Differential effect of type I and type II diabetes on antipyrine disposition in man. Eur. J. Clin. Pharm. 1988, 34, 369–375. [Google Scholar] [CrossRef] [PubMed]
- Sotaniemi, E.A.; Pelkonen, O.; Arranto, A.J.; Tapanainen, P.; Rautio, A.; Pasanen, M. Diabetes and elimination of antipyrine in man: An analysis of 298 patients classified by type of diabetes, age, sex, duration of disease and liver involvement. Pharm. Toxicol. 2002, 90, 155–160. [Google Scholar] [CrossRef] [PubMed]
- Urry, E.; Jetter, A.; Landolt, H.P. Assessment of CYP1A2 enzyme activity in relation to type-2 diabetes and habitual caffeine intake. Nutr. Metab. (Lond.) 2016, 13, 66. [Google Scholar] [CrossRef] [PubMed] [Green Version]
- Porazka, J.; Szalek, E.; Polom, W.; Czajkowski, M.; Grabowski, T.; Matuszewski, M.; Grzeskowiak, E. Influence of Obesity and Type 2 Diabetes Mellitus on the Pharmacokinetics of Tramadol After Single Oral Dose Administration. Eur. J. Drug Metab. Pharm. 2019, 44, 579–584. [Google Scholar] [CrossRef] [PubMed] [Green Version]
- Shu, N.; Hu, M.; Ling, Z.; Liu, P.; Wang, F.; Xu, P.; Zhong, Z.; Sun, B.; Zhang, M.; Li, F.; et al. The enhanced atorvastatin hepatotoxicity in diabetic rats was partly attributed to the upregulated hepatic Cyp3a and SLCO1B1. Sci. Rep. 2016, 6, 33072. [Google Scholar] [CrossRef] [Green Version]
- Brunner, L.J.; Iyer, L.V.; Vadiei, K.; Weaver, W.V.; Luke, D.R. Cyclosporine pharmacokinetics and effect in the type I diabetic rat model. Eur. J. Drug Metab. Pharm. 1989, 14, 287–292. [Google Scholar] [CrossRef]
- Neuman, M.G.; Cameron, R.G.; Haber, J.A.; Katz, G.G.; Malkiewicz, I.M.; Shear, N.H. Inducers of cytochrome P450 2E1 enhance methotrexate-induced hepatocytoxicity. Clin. Biochem. 1999, 32, 519–536. [Google Scholar] [CrossRef]
- Malatjalian, D.A.; Ross, J.B.; Williams, C.N.; Colwell, S.J.; Eastwood, B.J. Methotrexate hepatotoxicity in psoriatics: Report of 104 patients from Nova Scotia, with analysis of risks from obesity, diabetes and alcohol consumption during long term follow-up. Can. J. Gastroenterol. Hepatol. 1996, 10, 369–375. [Google Scholar] [CrossRef] [Green Version]
- Liu, X. ABC Family Transporters. Adv. Exp. Med. Biol. 2019, 1141, 13–100. [Google Scholar] [CrossRef]
- Zeng, X.Y.; Dong, S.; He, N.N.; Jiang, C.J.; Dai, Y.; Xia, Y.F. Comparative pharmacokinetics of arctigenin in normal and type 2 diabetic rats after oral and intravenous administration. Fitoterapia 2015, 105, 119–126. [Google Scholar] [CrossRef] [PubMed]
- Yu, S.; Yu, Y.; Liu, L.; Wang, X.; Lu, S.; Liang, Y.; Liu, X.; Xie, L.; Wang, G. Increased plasma exposures of five protoberberine alkaloids from Coptidis Rhizoma in streptozotocin-induced diabetic rats: Is P-GP involved? Planta Med. 2010, 76, 876–881. [Google Scholar] [CrossRef] [PubMed] [Green Version]
- Novak, A.; Godoy, Y.C.; Martinez, S.A.; Ghanem, C.I.; Celuch, S.M. Fructose-induced metabolic syndrome decreases protein expression and activity of intestinal P-glycoprotein. Nutrition 2015, 31, 871–876. [Google Scholar] [CrossRef] [PubMed]
- Watanabe, M.; Kobayashi, M.; Ogura, J.; Takahashi, N.; Yamaguchi, H.; Iseki, K. Alteration of pharmacokinetics of grepafloxacin in type 2 diabetic rats. J. Pharm. Pharm. Sci. 2014, 17, 25–33. [Google Scholar] [CrossRef] [PubMed]
- Nawa, A.; Fujita-Hamabe, W.; Kishioka, S.; Tokuyama, S. Decreased expression of intestinal P-glycoprotein increases the analgesic effects of oral morphine in a streptozotocin-induced diabetic mouse model. Drug Metab. Pharm. 2011, 26, 584–591. [Google Scholar] [CrossRef]
- Joshi, S.D.; Santani, D.D.; Sheth, J.J.; Mehta, H.C.; Dave, K.C.; Goyal, R.K. Investigation into the possible mechanisms involved in altered digoxin levels in diabetic patients. Indian J. Physiol. Pharm. 1996, 40, 65–69. [Google Scholar]
- Gitanjali, B.; Adithan, C.; Raveendran, R.; Shashindran, C.H.; Chandrasekar, S. Pharmacokinetics of single dose oral digoxin in patients with uncomplicated type II diabetes mellitus. Int. J. Clin. Pharm. Ther. Toxicol. 1992, 30, 113–116. [Google Scholar]
- Nawa, A.; Fujita-Hamabe, W.; Tokuyama, S. Involvement of ubiquitination in the decrease of intestinal P-glycoprotein in a streptozotocin-induced diabetic mouse model. Drug Metab. Pharm. 2012, 27, 548–552. [Google Scholar] [CrossRef]
- Nawa, A.; Fujita-Hamabe, W.; Tokuyama, S. Regulatory action of nitric oxide synthase on ileal P-glycoprotein expression under streptozotocin-induced diabetic condition. Biol. Pharm. Bull. 2011, 34, 436–438. [Google Scholar] [CrossRef] [Green Version]
- Nawa, A.; Fujita-Hamabe, W.; Tokuyama, S. Altered intestinal P-glycoprotein expression levels in a monosodium glutamate-induced obese mouse model. Life Sci. 2011, 89, 834–838. [Google Scholar] [CrossRef]
- Nawa, A.; Fujita Hamabe, W.; Tokuyama, S. Inducible nitric oxide synthase-mediated decrease of intestinal P-glycoprotein expression under streptozotocin-induced diabetic conditions. Life Sci. 2010, 86, 402–409. [Google Scholar] [CrossRef] [PubMed]
- Duan, R.; Hu, N.; Liu, H.Y.; Li, J.; Guo, H.F.; Liu, C.; Liu, L.; Liu, X.D. Biphasic regulation of P-glycoprotein function and expression by NO donors in Caco-2 cells. Acta Pharm. Sin. 2012, 33, 767–774. [Google Scholar] [CrossRef] [PubMed] [Green Version]
- Zhang, J.; Xie, Q.; Kong, W.; Wang, Z.; Wang, S.; Zhao, K.; Chen, Y.; Liu, X.; Liu, L. Short-chain fatty acids oppositely altered expressions and functions of intestinal cytochrome P4503A and P-glycoprotein and affected pharmacokinetics of verapamil following oral administration to rats. J. Pharm. Pharm. 2020, 72, 448–460. [Google Scholar] [CrossRef] [PubMed]
- Al-Salami, H.; Butt, G.; Tucker, I.; Skrbic, R.; Golocorbin-Kon, S.; Mikov, M. Probiotic Pre-treatment Reduces Gliclazide Permeation (ex vivo) in Healthy Rats but Increases It in Diabetic Rats to the Level Seen in Untreated Healthy Rats. Arch. Drug Inf. 2008, 1, 35–41. [Google Scholar] [CrossRef] [PubMed] [Green Version]
- Mikov, M.; Al-Salami, H.; Golocorbin-Kon, S.; Skrbic, R.; Raskovic, A.; Fawcett, J.P. The influence of 3alpha,7alpha-dihydroxy-12-keto-5beta-cholanate on gliclazide pharmacokinetics and glucose levels in a rat model of diabetes. Eur. J. Drug Metab. Pharm. 2008, 33, 137–142. [Google Scholar] [CrossRef] [PubMed]
- Xie, Q.S.; Zhang, J.X.; Liu, M.; Liu, P.H.; Wang, Z.J.; Zhu, L.; Liang, L.; Jin, M.M.; Liu, X.N.; Liu, L.; et al. Short-chain fatty acids down-regulate expression and function of p-glycoprotein but up-regulate expression and function of breast cancer resistance protein in intestine of rats. Acta Pharm. Sin. 2020, in press. [Google Scholar]
- Hindlet, P.; Bado, A.; Farinotti, R.; Buyse, M. Long-term effect of leptin on H+-coupled peptide cotransporter 1 activity and expression in vivo: Evidence in leptin-deficient mice. J. Pharm. Exp. Ther. 2007, 323, 192–201. [Google Scholar] [CrossRef] [Green Version]
- Bikhazi, A.B.; Skoury, M.M.; Zwainy, D.S.; Jurjus, A.R.; Kreydiyyeh, S.I.; Smith, D.E.; Audette, K.; Jacques, D. Effect of diabetes mellitus and insulin on the regulation of the PepT 1 symporter in rat jejunum. Mol. Pharm. 2004, 1, 300–308. [Google Scholar] [CrossRef]
- Liang, L.M.; Zhou, J.J.; Xu, F.; Li, X.W.; Liu, P.H.; Qin, L.; Liu, L.; Liu, X.D. Diabetes downregulates peptide transporter 1 in rat jejunum: Possible involvement of cholate-induced FXR activation. Acta Pharm. Sin. 2020, in press. [Google Scholar]
- Der-Boghossian, A.H.; Saad, S.R.; Perreault, C.; Provost, C.; Jacques, D.; Kadi, L.N.; Issa, N.G.; Sibai, A.M.; El-Majzoub, N.W.; Bikhazi, A.B. Role of insulin on jejunal PepT1 expression and function regulation in diabetic male and female rats. Can. J. Physiol. Pharm. 2010, 88, 753–759. [Google Scholar] [CrossRef]
- Watanabe, K.; Terada, K.; Jinriki, T.; Sato, J. Effect of insulin on cephalexin uptake and transepithelial transport in the human intestinal cell line Caco-2. Eur. J. Pharm. Sci. 2004, 21, 87–95. [Google Scholar] [CrossRef] [PubMed]
- Thamotharan, M.; Bawani, S.Z.; Zhou, X.; Adibi, S.A. Hormonal regulation of oligopeptide transporter pept-1 in a human intestinal cell line. Am. J. Physiol. 1999, 276, C821–C826. [Google Scholar] [CrossRef] [PubMed]
- Kohyama, N.; Shiokawa, H.; Ohbayashi, M.; Kobayashi, Y.; Yamamoto, T. Characterization of monocarboxylate transporter 6: Expression in human intestine and transport of the antidiabetic drug nateglinide. Drug Metab. Dispos. 2013, 41, 1883–1887. [Google Scholar] [CrossRef] [PubMed]
- Murakami, Y.; Kohyama, N.; Kobayashi, Y.; Ohbayashi, M.; Ohtani, H.; Sawada, Y.; Yamamoto, T. Functional characterization of human monocarboxylate transporter 6 (SLC16A5). Drug Metab. Dispos. 2005, 33, 1845–1851. [Google Scholar] [CrossRef] [PubMed]
- Park, J.H.; Lee, W.I.; Yoon, W.H.; Park, Y.D.; Lee, J.S.; Lee, M.G. Pharmacokinetic and pharmacodynamic changes of furosemide after intravenous and oral administration to rats with alloxan-induced diabetes mellitus. Biopharm. Drug Dispos. 1998, 19, 357–364. [Google Scholar] [CrossRef]
- Park, K.J.; Yoon, W.H.; Shin, W.G.; Lee, M.G. Pharmacokinetics and pharmacodynamics of azosemide after intravenous and oral administration to rats with alloxan-induced diabetes mellitus. J. Pharm. Pharm. 1996, 48, 1093–1097. [Google Scholar] [CrossRef] [PubMed]
- Borbas, T.; Benko, B.; Dalmadi, B.; Szabo, I.; Tihanyi, K. Insulin in flavin-containing monooxygenase regulation. Flavin-containing monooxygenase and cytochrome P450 activities in experimental diabetes. Eur J. Pharm. Sci. 2006, 28, 51–58. [Google Scholar] [CrossRef]
- Kudo, T.; Toda, T.; Ushiki, T.; Ohi, K.; Ikarashi, N.; Ochiai, W.; Sugiyama, K. Differences in the pharmacokinetics of Cyp3a substrates in TSOD and streptozotocin-induced diabetic mice. Xenobiotica 2010, 40, 282–290. [Google Scholar] [CrossRef]
- Zhang, S.; Pan, X.; Jeong, H. GW4064, an agonist of farnesoid X receptor, represses CYP3A4 expression in human hepatocytes by inducing small heterodimer partner expression. Drug Metab. Dispos. 2015, 43, 743–748. [Google Scholar] [CrossRef] [Green Version]
- Ourlin, J.C.; Lasserre, F.; Pineau, T.; Fabre, J.M.; Sa-Cunha, A.; Maurel, P.; Vilarem, M.J.; Pascussi, J.M. The small heterodimer partner interacts with the pregnane X receptor and represses its transcriptional activity. Mol. Endocrinol. 2003, 17, 1693–1703. [Google Scholar] [CrossRef] [Green Version]
- Ogata, M.; Iizuka, Y.; Murata, R.; Hikichi, N. Effect of streptozotocin-induced diabetes on cyclosporin A disposition in rats. Biol. Pharm. Bull. 1996, 19, 1586–1590. [Google Scholar] [CrossRef] [PubMed] [Green Version]
- Ando, T.; Kusuhara, H.; Merino, G.; Alvarez, A.I.; Schinkel, A.H.; Sugiyama, Y. Involvement of breast cancer resistance protein (ABCG2) in the biliary excretion mechanism of fluoroquinolones. Drug Metab. Dispos. 2007, 35, 1873–1879. [Google Scholar] [CrossRef] [PubMed] [Green Version]
- Jiang, S.; Zhao, W.; Chen, Y.; Zhong, Z.; Zhang, M.; Li, F.; Xu, P.; Zhao, K.; Li, Y.; Liu, L.; et al. Paroxetine decreased plasma exposure of glyburide partly via inhibiting intestinal absorption in rats. Drug Metab. Pharm. 2015, 30, 240–246. [Google Scholar] [CrossRef] [PubMed]
- Liu, X. Overview: Role of Drug Transporters in Drug Disposition and Its Clinical Significance. Adv. Exp. Med. Biol. 2019, 1141, 1–12. [Google Scholar] [CrossRef]
- Phatchawan, A.; Chutima, S.; Varanuj, C.; Anusorn, L. Decreased renal organic anion transporter 3 expression in type 1 diabetic rats. Am. J. Med. Sci. 2014, 347, 221–227. [Google Scholar] [CrossRef]
- Thongnak, L.; Pongchaidecha, A.; Jaikumkao, K.; Chatsudthipong, V.; Chattipakorn, N.; Lungkaphin, A. The additive effects of atorvastatin and insulin on renal function and renal organic anion transporter 3 function in diabetic rats. Sci. Rep. 2017, 7, 13532. [Google Scholar] [CrossRef] [Green Version]
- Babelova, A.; Burckhardt, B.C.; Wegner, W.; Burckhardt, G.; Henjakovic, M. Sex-differences in renal expression of selected transporters and transcription factors in lean and obese Zucker spontaneously hypertensive fatty rats. J. Diabetes Res. 2015, 2015, 483238. [Google Scholar] [CrossRef]
- Sharma, K.; Karl, B.; Mathew, A.V.; Gangoiti, J.A.; Wassel, C.L.; Saito, R.; Pu, M.; Sharma, S.; You, Y.H.; Wang, L.; et al. Metabolomics reveals signature of mitochondrial dysfunction in diabetic kidney disease. J. Am. Soc. Nephrol. 2013, 24, 1901–1912. [Google Scholar] [CrossRef]
- Vallon, V.; Rieg, T.; Ahn, S.Y.; Wu, W.; Eraly, S.A.; Nigam, S.K. Overlapping in vitro and in vivo specificities of the organic anion transporters OAT1 and OAT3 for loop and thiazide diuretics. Am. J. Physiol. Renal. Physiol. 2008, 294, F867–F873. [Google Scholar] [CrossRef] [Green Version]
- Eraly, S.A.; Vallon, V.; Vaughn, D.A.; Gangoiti, J.A.; Richter, K.; Nagle, M.; Monte, J.C.; Rieg, T.; Truong, D.M.; Long, J.M.; et al. Decreased renal organic anion secretion and plasma accumulation of endogenous organic anions in OAT1 knock-out mice. J. Biol. Chem. 2006, 281, 5072–5083. [Google Scholar] [CrossRef] [Green Version]
- Cunha, F.M.; Pereira, J.; Marques, P.; Ribeiro, A.; Bettencourt, P.; Lourenco, P. Diabetic patients need higher furosemide doses: A report on acute and chronic heart failure patients. J. Cardiovasc. Med. (Hagerstown) 2020, 21, 21–26. [Google Scholar] [CrossRef] [PubMed]
- Fu, Y.; Breljak, D.; Onishi, A.; Batz, F.; Patel, R.; Huang, W.; Song, P.; Freeman, B.; Mayoux, E.; Koepsell, H.; et al. Organic anion transporter OAT3 enhances the glucosuric effect of the SGLT2 inhibitor empagliflozin. Am. J. Physiol. Renal. Physiol. 2018, 315, F386–F394. [Google Scholar] [CrossRef] [PubMed]
- Jinnouchi, H.; Nozaki, K.; Watase, H.; Omiya, H.; Sakai, S.; Samukawa, Y. Impact of Reduced Renal Function on the Glucose-Lowering Effects of Luseogliflozin, a Selective SGLT2 Inhibitor, Assessed by Continuous Glucose Monitoring in Japanese Patients with Type 2 Diabetes Mellitus. Adv. Ther. 2016, 33, 460–479. [Google Scholar] [CrossRef] [PubMed] [Green Version]
- Nowicki, M.T.; Aleksunes, L.M.; Sawant, S.P.; Dnyanmote, A.V.; Mehendale, H.M.; Manautou, J.E. Renal and hepatic transporter expression in type 2 diabetic rats. Drug Metab. Lett. 2008, 2, 11–17. [Google Scholar] [CrossRef] [PubMed]
- Grover, B.; Buckley, D.; Buckley, A.R.; Cacini, W. Reduced expression of organic cation transporters rOCT1 and rOCT2 in experimental diabetes. J. Pharm. Exp. Ther. 2004, 308, 949–956. [Google Scholar] [CrossRef]
- Thomas, M.C.; Tikellis, C.; Burns, W.C.; Thallas, V.; Forbes, J.M.; Cao, Z.; Osicka, T.M.; Russo, L.M.; Jerums, G.; Ghabrial, H.; et al. Reduced tubular cation transport in diabetes: Prevented by ACE inhibition. Kidney Int. 2003, 63, 2152–2161. [Google Scholar] [CrossRef] [Green Version]
- Thomas, M.C.; Tikellis, C.; Kantharidis, P.; Burns, W.C.; Cooper, M.E.; Forbes, J.M. The role of advanced glycation in reduced organic cation transport associated with experimental diabetes. J. Pharm. Exp. Ther. 2004, 311, 456–466. [Google Scholar] [CrossRef] [Green Version]
- Lee, M.G.; Choi, Y.H.; Lee, I. Effects of diabetes mellitus induced by alloxan on the pharmacokinetics of metformin in rats: Restoration of pharmacokinetic parameters to the control state by insulin treatment. J. Pharm. Pharm. Sci. 2008, 11, 88–103. [Google Scholar] [CrossRef] [PubMed] [Green Version]
- Tucker, G.T.; Casey, C.; Phillips, P.J.; Connor, H.; Ward, J.D.; Woods, H.F. Metformin kinetics in healthy subjects and in patients with diabetes mellitus. Br. J. Clin. Pharm. 1981, 12, 235–246. [Google Scholar] [CrossRef]
- Bergagnini-Kolev, M.C.; Hebert, M.F.; Easterling, T.R.; Lin, Y.S. Pregnancy Increases the Renal Secretion of N(1)-methylnicotinamide, an Endogenous Probe for Renal Cation Transporters, in Patients Prescribed Metformin. Drug Metab. Dispos. 2017, 45, 325–329. [Google Scholar] [CrossRef] [Green Version]
- Liao, M.Z.; Flood Nichols, S.K.; Ahmed, M.; Clark, S.; Hankins, G.D.; Caritis, S.; Venkataramanan, R.; Haas, D.; Quinney, S.K.; Haneline, L.S.; et al. Effects of Pregnancy on the Pharmacokinetics of Metformin. Drug Metab. Dispos. 2020. [Google Scholar] [CrossRef] [PubMed]
- Hughes, R.C.; Gardiner, S.J.; Begg, E.J.; Zhang, M. Effect of pregnancy on the pharmacokinetics of metformin. Diabet. Med. 2006, 23, 323–326. [Google Scholar] [CrossRef] [PubMed]
- Cacini, W.; Singh, Y. Renal metallothionein and platinum levels in diabetic and nondiabetic rats injected with cisplatin. Proc. Soc. Exp. Biol. Med. 1991, 197, 285–289. [Google Scholar] [CrossRef] [PubMed]
- Cacini, W.; Harden, E.A.; Skau, K.A. Reduced renal accumulation and toxicity of cisplatin in experimental galactosemia. Proc. Soc. Exp. Biol. Med. 1993, 203, 348–353. [Google Scholar] [CrossRef]
- Scott, L.A.; Madan, E.; Valentovic, M.A. Attenuation of cisplatin nephrotoxicity by streptozotocin-induced diabetes. Toxicol. Sci. 1989, 12, 530–539. [Google Scholar] [CrossRef]
- da Silva Faria, M.C.; Santos, N.A.; Carvalho Rodrigues, M.A.; Rodrigues, J.L.; Barbosa Junior, F.; Santos, A.C. Effect of diabetes on biodistribution, nephrotoxicity and antitumor activity of cisplatin in mice. Chem. Biol. Interact. 2015, 229, 119–131. [Google Scholar] [CrossRef] [Green Version]
- Valentovic, M.A.; Scott, L.A.; Madan, E.; Yokel, R.A. Renal accumulation and urinary excretion of cisplatin in diabetic rats. Toxicology 1991, 70, 151–162. [Google Scholar] [CrossRef]
- Tramonti, G.; Xie, P.; Wallner, E.I.; Danesh, F.R.; Kanwar, Y.S. Expression and functional characteristics of tubular transporters: P-glycoprotein, PEPT1, and PEPT2 in renal mass reduction and diabetes. Am. J. Physiol. Renal. Physiol. 2006, 291, F972–F980. [Google Scholar] [CrossRef] [Green Version]
- Yeh, S.Y.; Pan, H.J.; Lin, C.C.; Kao, Y.H.; Chen, Y.H.; Lin, C.J. Hyperglycemia induced down-regulation of renal P-glycoprotein expression. Eur. J. Pharm. 2012, 690, 42–50. [Google Scholar] [CrossRef]
- Maximos, S.; Chamoun, M.; Gravel, S.; Turgeon, J.; Michaud, V. Tissue Specific Modulation of cyp2c and cyp3a mRNA Levels and Activities by Diet-Induced Obesity in Mice: The Impact of Type 2 Diabetes on Drug Metabolizing Enzymes in Liver and Extra-Hepatic Tissues. Pharmaceutics 2017, 9, 40. [Google Scholar] [CrossRef] [Green Version]
- Del Villar, E.; Gaule, C.; Vega, P. Kidney drug metabolizing activities in streptozotocin diabetic rats. Gen. Pharm. 1995, 26, 137–141. [Google Scholar] [CrossRef]
- Ding, S.; Huang, J.; Qiu, H.; Chen, R.; Zhang, J.; Huang, B.; Cheng, O.; Jiang, Q. Effects of PPARs/20-HETE on the renal impairment under diabetic conditions. Exp. Cell Res. 2019, 382, 111455. [Google Scholar] [CrossRef] [PubMed]
- Park, J.M.; Moon, C.H.; Lee, M.G. Pharmacokinetic changes of methotrexate after intravenous administration to streptozotocin-induced diabetes mellitus rats. Res. Commun. Mol. Pathol. Pharm. 1996, 93, 343–352. [Google Scholar]
- Kim, S.H.; Kim, W.B.; Lee, M.G. Pharmacokinetics of a new carbapenem, DA-1131, after intravenous administration to rats with alloxan-induced diabetes mellitus. Biopharm. Drug Dispos. 1998, 19, 303–308. [Google Scholar] [CrossRef]
- Valentovic, M.A.; Ball, J.G.; Rogers, B.A. Comparison of cephaloridine renal accumulation and urinary excretion between normoglycemic and diabetic animals. Toxicology 1996, 108, 93–99. [Google Scholar] [CrossRef]
- Kong, W.M.; Sun, B.B.; Wang, Z.J.; Zheng, X.K.; Zhao, K.J.; Chen, Y.; Zhang, J.X.; Liu, P.H.; Zhu, L.; Xu, R.J.; et al. Physiologically based pharmacokinetic-pharmacodynamic modeling for prediction of vonoprazan pharmacokinetics and its inhibition on gastric acid secretion following intravenous/oral administration to rats, dogs and humans. Acta Pharm. Sin. 2020. [Google Scholar] [CrossRef]
- Yusuksawad, M.; Chaiyabutr, N. Restoration of renal hemodynamics and functions during black cumin (Nigella sativa) administration in streptozotocin-induced diabetic rats. J. Exp. Pharm. 2012, 4, 1–7. [Google Scholar] [CrossRef] [Green Version]
- Kitani, M.; Ozaki, Y.; Katayama, K.; Kakemi, M.; Koizumi, T. A kinetic study on drug distribution: furosemide in rats. Chem. Pharm. Bull. (Tokyo) 1988, 36, 1053–1062. [Google Scholar] [CrossRef] [Green Version]
- Varma, M.V.; Sarkar, M.; Kapoor, N.; Panchagnula, R. PH-dependent functional activity of P-glycoprotein in limiting intestinal absorption of protic drugs 1. Simultaneous determination of quinidine and permeability markers in rat in situ perfusion samples. J. Chromatogr. B Analyt. Technol. Biomed. Life Sci. 2005, 816, 243–249. [Google Scholar] [CrossRef]
- Choi, D.H.; Chang, K.S.; Hong, S.P.; Choi, J.S.; Han, H.K. Effect of atorvastatin on the intravenous and oral pharmacokinetics of verapamil in rats. Biopharm. Drug Dispos. 2008, 29, 45–50. [Google Scholar] [CrossRef]
- Ruark, C.D.; Hack, C.E.; Robinson, P.J.; Mahle, D.A.; Gearhart, J.M. Predicting passive and active tissue:plasma partition coefficients: Interindividual and interspecies variability. J. Pharm. Sci. 2014, 103, 2189–2198. [Google Scholar] [CrossRef] [PubMed]
- Yang, K.H.; Choi, Y.H.; Lee, U.; Lee, J.H.; Lee, M.G. Effects of cytochrome P450 inducers and inhibitors on the pharmacokinetics of intravenous furosemide in rats: Involvement of CYP2C11, 2E1, 3A1 and 3A2 in furosemide metabolism. J. Pharm. Pharm. 2009, 61, 47–54. [Google Scholar] [CrossRef]
- Li, J.; Guo, H.F.; Liu, C.; Zhong, Z.; Liu, L.; Liu, X.D. Prediction of drug disposition in diabetic patients by means of a physiologically based pharmacokinetic model. Clin. Pharm. 2015, 54, 179–193. [Google Scholar] [CrossRef] [PubMed]
- Sumida, A.; Kinoshita, K.; Fukuda, T.; Matsuda, H.; Yamamoto, I.; Inaba, T.; Azuma, J. Relationship between mRNA levels quantified by reverse transcription-competitive PCR and metabolic activity of CYP3A4 and CYP2E1 in human liver. Biochem. Biophys. Res. Commun. 1999, 262, 499–503. [Google Scholar] [CrossRef]


| Parameters | Unit | Control Rats | Diabetic Rats |
|---|---|---|---|
| Gastric emptying rate | h−1 | 20.8 | 20.8 |
| Duodenum transit time | h−1 | 28.74 | 28.74 |
| Jejunum transit time | h−1 | 4.2 | 4.2 |
| Ileum transit time | h−1 | 0.789 | 0.789 |
| Intestinal radius | cm | 0.2 | 0.2 |
| Duodenum wall volume | mL | 1.08 | 1.08 |
| Jejunum wall volume | mL | 9.94 | 9.94 |
| Ileum wall volume | mL | 0.32 | 0.32 |
| Portal vein volume | mL | 0.25 | 0.25 |
| Liver volume | mL | 10 | 10 |
| Renal volume | mL | 1.83 [146] | 1.83 |
| Duodenum wall blood flow | mL/min | 0.972 | 2.223 |
| Jejunum wall blood flow | mL/min | 9.125 | 20.877 |
| Ileum wall blood flow | mL/min | 0.253 | 0.580 |
| Portal vein blood flow | mL/min | 16.043 | 23.68 |
| Hepatic artery blood flow | mL/min | 2.243 | 11.914 |
| Liver blood flow | mL/min | 18.286 | 35.594 |
| Renal blood flow | ml/min | 11.7 [146] | 4.10a |
| Hepatic microsomal protein | mg/g liver | 44.8 | 44.8 |
| Intestinal microsomal protein | mg/g intestine | 25.9 | 25.9 |
| Liver weight | g/kg body weight | 40 | 36 |
| Parameter | Unit | Furosemide | Verapamil | ||
|---|---|---|---|---|---|
| CON rats | DM rats | CON rats | DM rats | ||
| Vc | L/kg | 0.127 [148] | 0.127 | 0.505 a | 0.505 |
| k21 | h−1 | 0.835 [148] | 0.835 | 11.880 a | 11.88 |
| k12 | h−1 | 0.989 [148] | 0.989 | 10.740 a | 10.74 |
| fu | % | 10.4 [105] | 10.4 [89] | 0.05 [93] | 0.05 |
| Kt:p | Liver | 0.33 [148] | 0.33 | 8.20 b | 8.20 |
| Kt:p | Intestine | 0.517 [148] | 0.517 | 319.39 b | 319.39 |
| Kt:p | Kidney | 1.36 [148] | 1.36 | / | / |
| Papp,A-B (caco-2) | cm/s × 10−6 | 6.90 [149] | 3.45 c | 13.8 | 13.8 |
| Papp,B-A (caco-2) | cm/s × 10−6 | / | / | 24.84 | 14.90 d |
| CLkidney | mL/min/kg | 4.33 [105] | / | ||
| CLliver | mL/min/kg | 2.20 [105] | / | ||
| Fu × CLint,liver | mL/min/250 g | 0.60 e | 0.75 f | / | / |
| Fu × CLint,kidney | mL/min/250 g | 1.19 e | 0.48 g | / | / |
| Microsomes | |||||
| Liver | |||||
| Vmax | nmol/(min/mg prot) | / | / | 1.60 [27] | 2.38 [27] |
| Km | μM | / | / | 13.21 [27] | 16.09 [27] |
| Intestine | |||||
| Vmax | pmol/(min/mg prot) | / | / | 49.04 [27] | 22.70 [27] |
| Km | μM | / | / | 34.06 [27] | 55.37 [27] |
© 2020 by the authors. Licensee MDPI, Basel, Switzerland. This article is an open access article distributed under the terms and conditions of the Creative Commons Attribution (CC BY) license (http://creativecommons.org/licenses/by/4.0/).
Share and Cite
Yang, Y.; Liu, X. Imbalance of Drug Transporter-CYP450s Interplay by Diabetes and Its Clinical Significance. Pharmaceutics 2020, 12, 348. https://doi.org/10.3390/pharmaceutics12040348
Yang Y, Liu X. Imbalance of Drug Transporter-CYP450s Interplay by Diabetes and Its Clinical Significance. Pharmaceutics. 2020; 12(4):348. https://doi.org/10.3390/pharmaceutics12040348
Chicago/Turabian StyleYang, Yiting, and Xiaodong Liu. 2020. "Imbalance of Drug Transporter-CYP450s Interplay by Diabetes and Its Clinical Significance" Pharmaceutics 12, no. 4: 348. https://doi.org/10.3390/pharmaceutics12040348