Article

Influence of Inter- and Intra-Batch Variability on the Sample Size Required for Demonstration of Equivalent Microstructure of Semisolid Dosage Forms

by
Zhengguo Xu
1,†,
Víctor Mangas-Sanjuán
1,2,†,
Matilde Merino-Sanjuán
1,2,*,
Virginia Merino
1,2 and
Alfredo García-Arieta
3
1
Departamento de Farmacia y Tecnología Farmacéutica y Parasitología, Facultad de Farmacia, Universitat de València, Av. Vicente Andrés Estellés s/n, Burjassot, 46100 Valencia, Spain
2
Instituto Interuniversitario de Investigación de Reconocimiento Molecular y Desarrollo Tecnológico (IDM), Universitat Politècnica de València, Universitat de València, 46100 Valencia, Spain
3
División de Farmacología y Evaluación Clínica, Departamento de Medicamentos de Uso Humano, Agencia Española de Medicamentos y Productos Sanitarios, Calle Campezo 1, Edificio 8, 28022 Madrid, Spain
*
Author to whom correspondence should be addressed.
These authors contributed equally to this paper.
Pharmaceutics 2020, 12(12), 1159; https://doi.org/10.3390/pharmaceutics12121159
Submission received: 1 November 2020 / Revised: 21 November 2020 / Accepted: 25 November 2020 / Published: 28 November 2020

Abstract

:
Inter- and intra-batch variability of the quality attributes contribute to the uncertainty for demonstrating equivalent microstructure of post-approval changes and generic/hybrids of semisolid topical products. Selecting a representative sample size to describe accurately the in vitro properties of semisolids and to reach enough statistical power to demonstrate similarity between two semisolid topical products is currently challenging. The objective of this work is to establish the number of batches and units per batch to be compared based on different inter-batch and intra-batch variability to demonstrate equivalence in the physical characteristics of the products that ensure a similar microstructure of the semisolid. This investigation shows that the minimum number of batches to be compared of each product is 3 and the minimum number of units per batch could be 6 in the case of low intra- and inter-batch variability. If the products are not identical, i.e., 2.5–5% differences that are expected due to differences in the manufacturing process or the suppliers of excipients, 12 units and 6 batches are needed. If intra- or inter-batch variability is larger than 10%, the number of batches and/or the number of units needs to be increased. As the interplay between inter- and intra-batch variability is complex, the sample size required for each combination of inter- and intra-batch variability and expected difference between products can be obtained in the attached tables.

Graphical Abstract

1. Introduction

The draft guideline on the quality and equivalence of topical products released by the European Medicines Agency (EMA) [1] states that the demonstration of therapeutic equivalence of two products requires comparison of their qualitative and quantitative composition, as well as a comparison of their physical properties, e.g., in case of post-approval changes or generic/hybrid products. According to this document: (1) the comparison of the physical properties should be conducted in at least three batches of the reference product and three batches of the test product with at least 12 replicates per batch, and (2) to consider equivalence for quantitative quality characteristics, the 90% confidence interval (CI) for the difference of means of the test and comparator products should be contained within the acceptance criteria of ±10% of the comparator product mean, assuming normal distribution of data.
The demonstration of equivalence by in vitro testing, alone or in combinations with other studies, with at least 3 batches of test and 3 batches of reference is recommended also by the U.S. FDA in some product specific guidance for topical products (e.g., acyclovir ointment, fluorescein sodium and benoxinate hydrochloride solution, benzyl alcohol lotion, bexarotene gel, clindamycine phosphate foam and gels, clindamycin phosphate and tretinoin gels, crisaborole ointment, dapsone gels, docosanol cream, doxepin HCl cream, efinaconazole solution, glycopyrronium tosylate cloth, hydrogen peroxide solution, ivermectin cream and lotion, loteprednol etabonate gel and ointment, luliconazole cream, metronidazole creams and gel, oxymetazoline HCl cream, ozenoxacin cream, penciclovir cream, pimecrolimus cream, silver sulfadiazine cream, tacrolimus ointments, tobramycin ointment), where a population bioequivalence approach is recommended for the comparison of relevant physical and chemical properties such as the particle size distribution of suspensions [2,3,4,5,6]. In the case of other dosage forms, no fewer than 10 units from each batch are required (e.g., injectable emulsions, nasal and inhalation products), but a minimum number of replicates is not defined for these topical products [7,8].
Sample size calculation is necessary for a correct demonstration of in vitro equivalence when a waiver of in vivo studies is applied. This comparability exercise has to be based on a protocol, where the objective of the comparison is defined (i.e., to obtain a biowaiver), as well as the in vitro tests to be conducted to conclude in vitro similarity, the statistical methods to be employed in the comparisons, and the acceptance range, which is 10% by default in some of the EMA guidelines, unless otherwise justified [9,10]. Unfortunately, it is observed too frequently that these comparisons are conducted in an exploratory manner as part of the pharmaceutical development. Those preliminary investigations could be considered as pilot studies from which the sponsor can obtain the expected difference between test and reference and the estimations of the expected intra-batch and inter-batch variability of test and reference product. Importantly, small pilot studies are known to underestimate the variance in clinical trials [11] and the upper boundary of the confidence interval of the variance estimation has been proposed for the sample size calculation [12]. Thereafter, a confirmatory study should be conducted with a protocol and a proper sample size calculation.
Rheological parameters, among others, are representative of the microstructure of topical products [13]. The EMA draft guideline specifies that when a product has non-Newtonian rheological behavior the complete flow curve (viscosity or shear stress versus shear rate) and the linear viscoelastic response (creep-recovery tests or oscillatory measurements at different frequencies) have to be characterized. From these, assessment parameters as viscosities at specified shear rates, yield stress values, thixotropic relative area, elastic and viscous moduli, or loss tangent can be calculated.
In a previous work [14,15] all these parameters were tested in ten batches of a reference topical product (Daivobet ointment containing 50 μg/g of calcipotriol and 0.5 mg/g of betamethasone dipropionate), in order to evaluate the feasibility to show equivalence between batches of the reference product within the limits proposed in the draft guideline with 12 replicates per batch and it was observed that the limits established in the guideline are too restrictive in case of rheological parameters with variability higher than 9.5%, even when 5 batches of each product under comparison, instead of 3, are tested. Equivalent microstructure between batches cannot be demonstrated with a reasonable sample size when the acceptance range was set at ±10%, since several rheological parameters exhibit inter-batch variability >10%. Therefore, either a wider fixed acceptance range or an acceptance range widened based on the inter-batch variability of the reference product were proposed as alternatives.
The objectives of this work are (i) to investigate the scenarios where the minimum sample size defined in the draft guideline is adequate and whether a smaller sample size might be acceptable in some cases, and (ii) to establish the number of batches and replicates per batch to be compared based on several scenarios of differences between test and reference products, inter-batch and intra-batch variability.

2. Materials and Methods
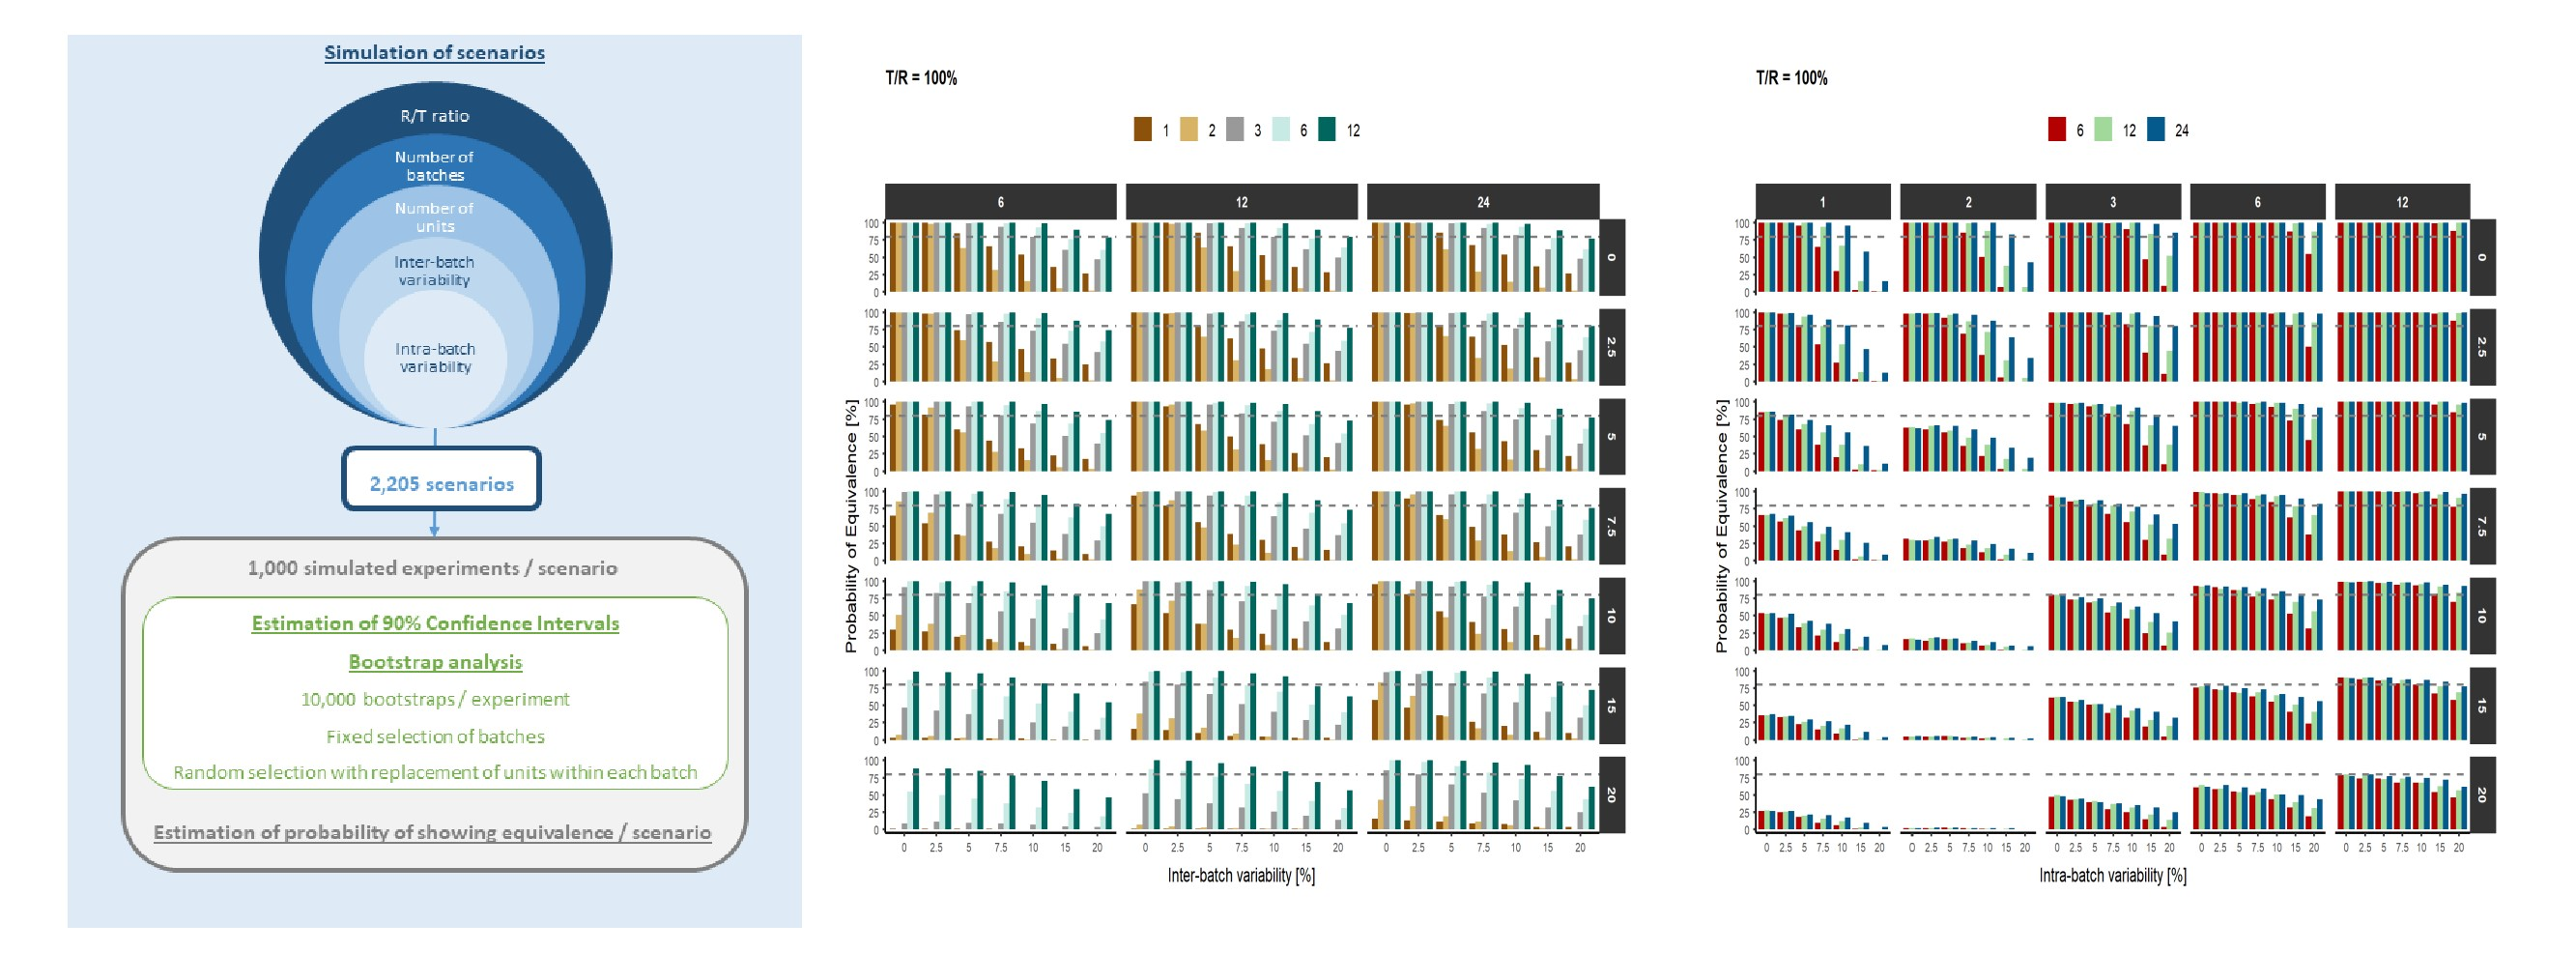
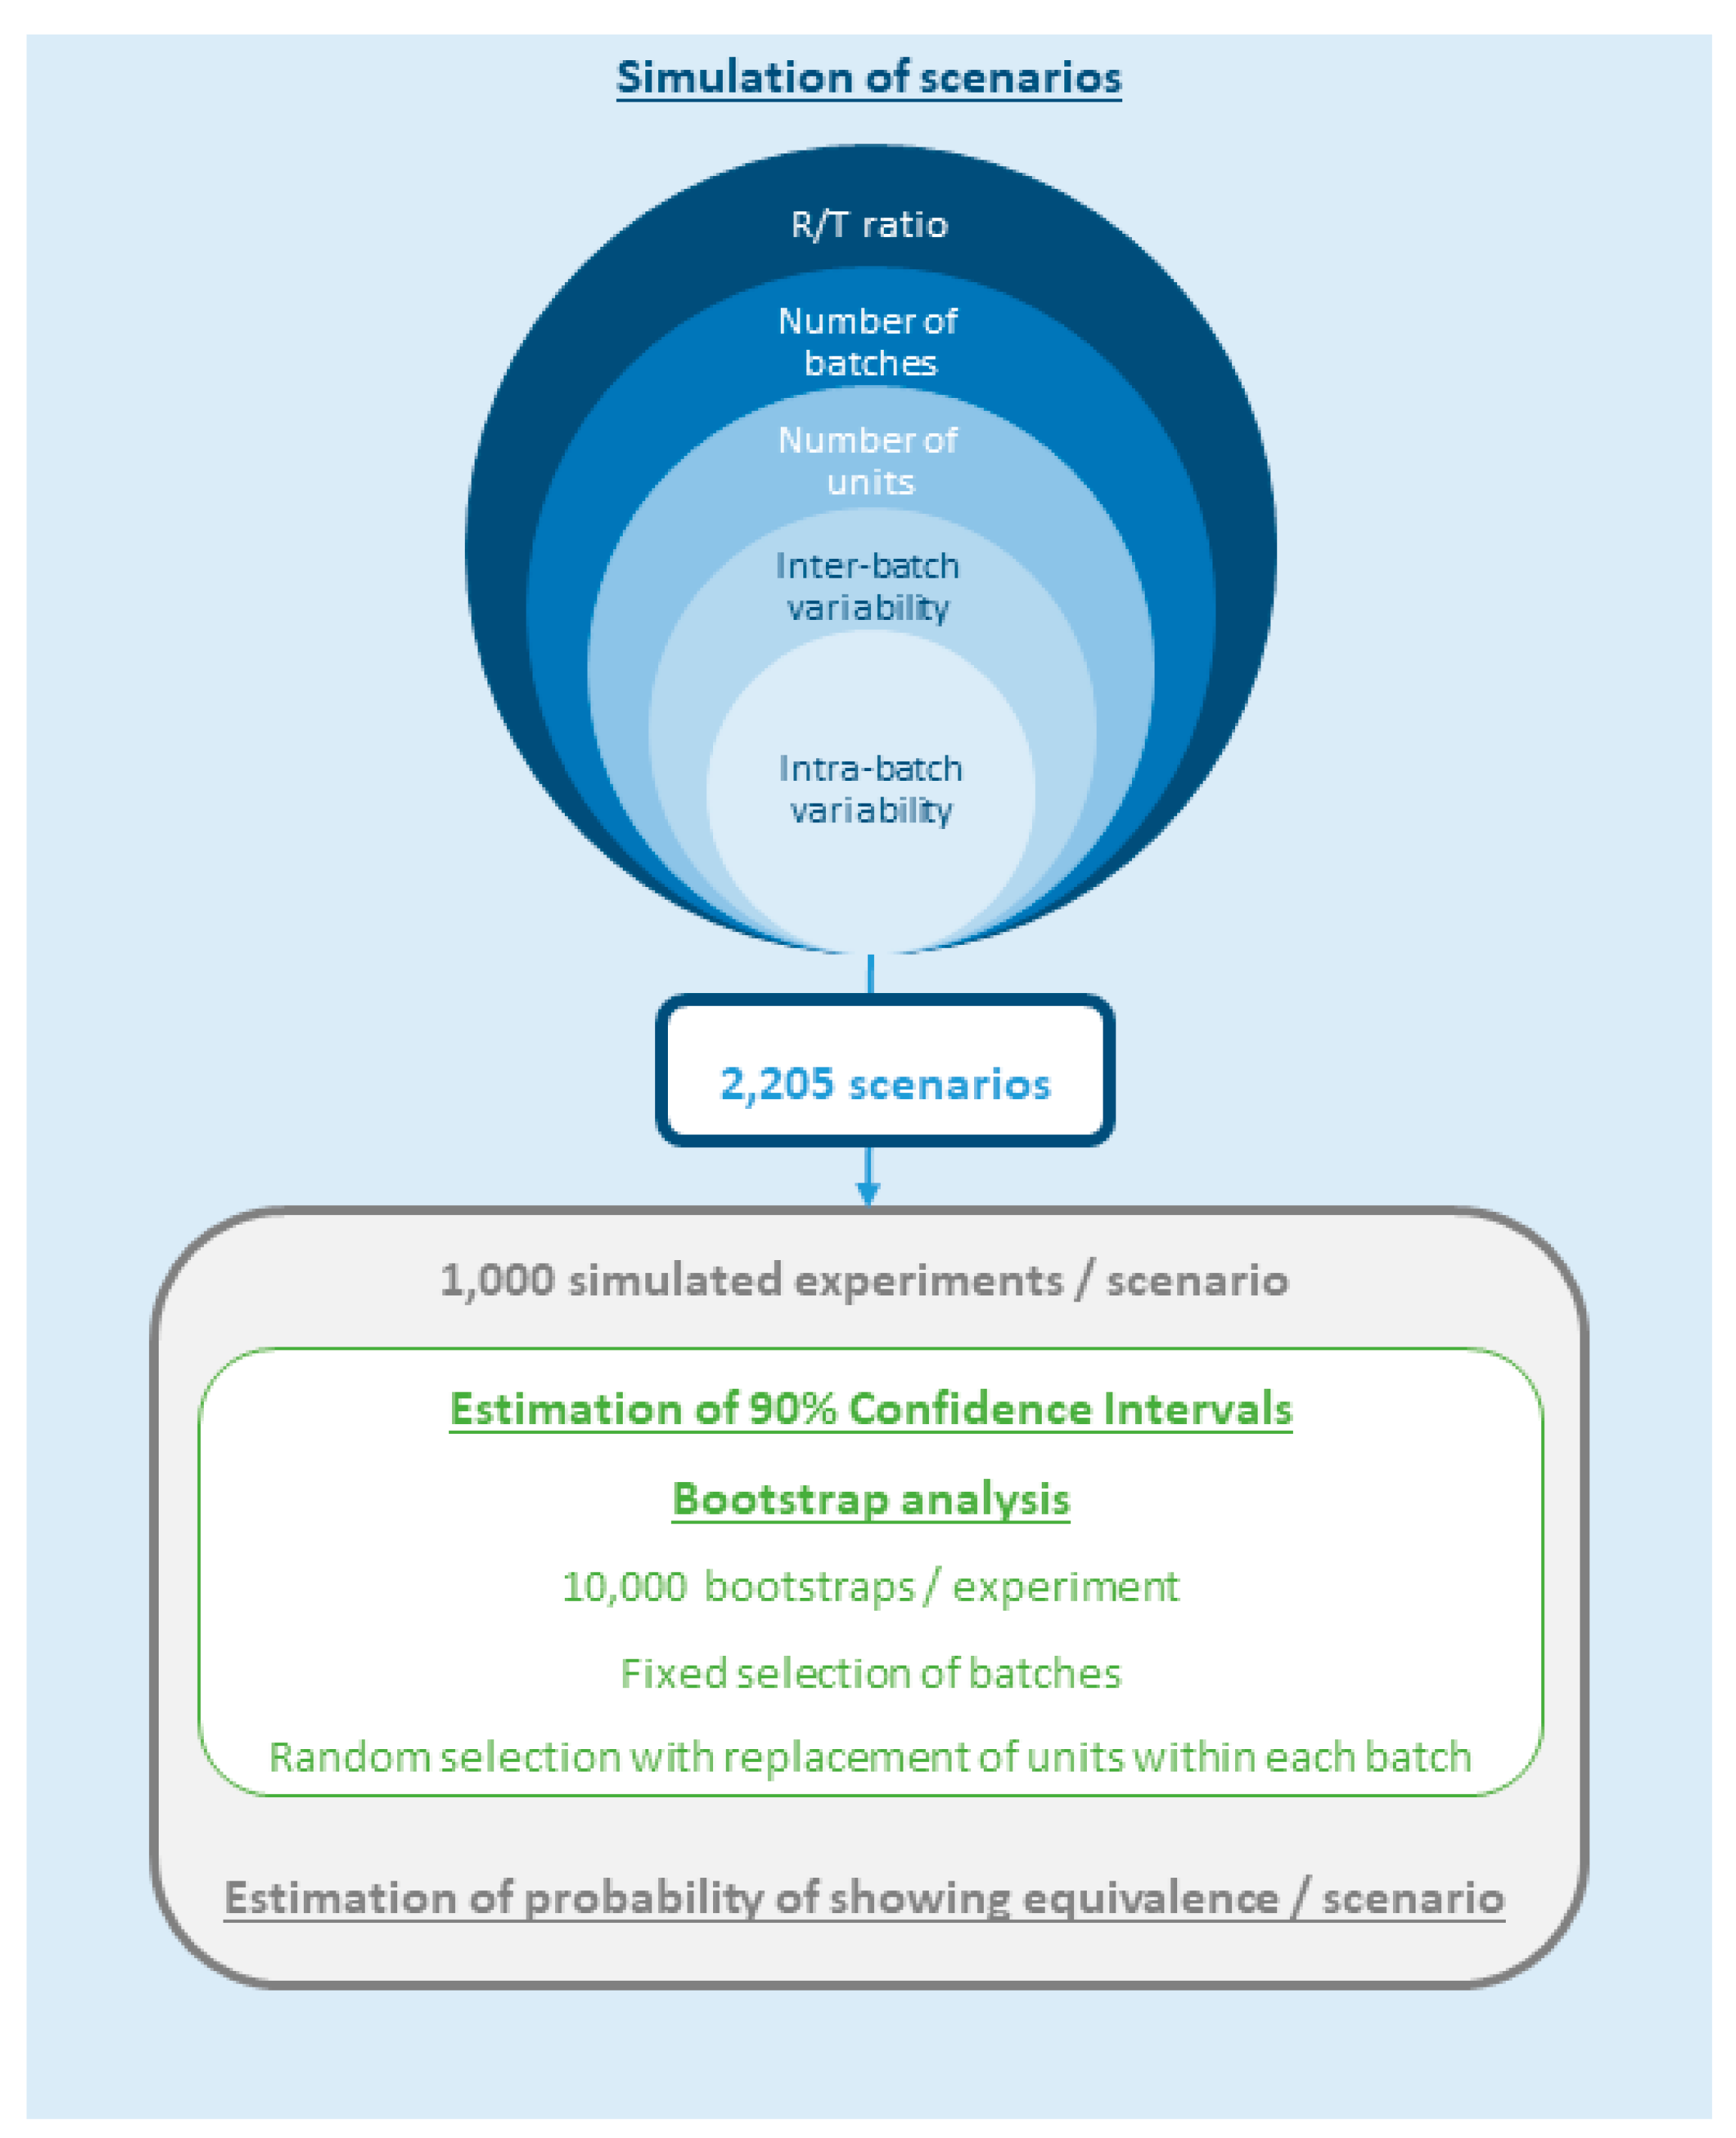
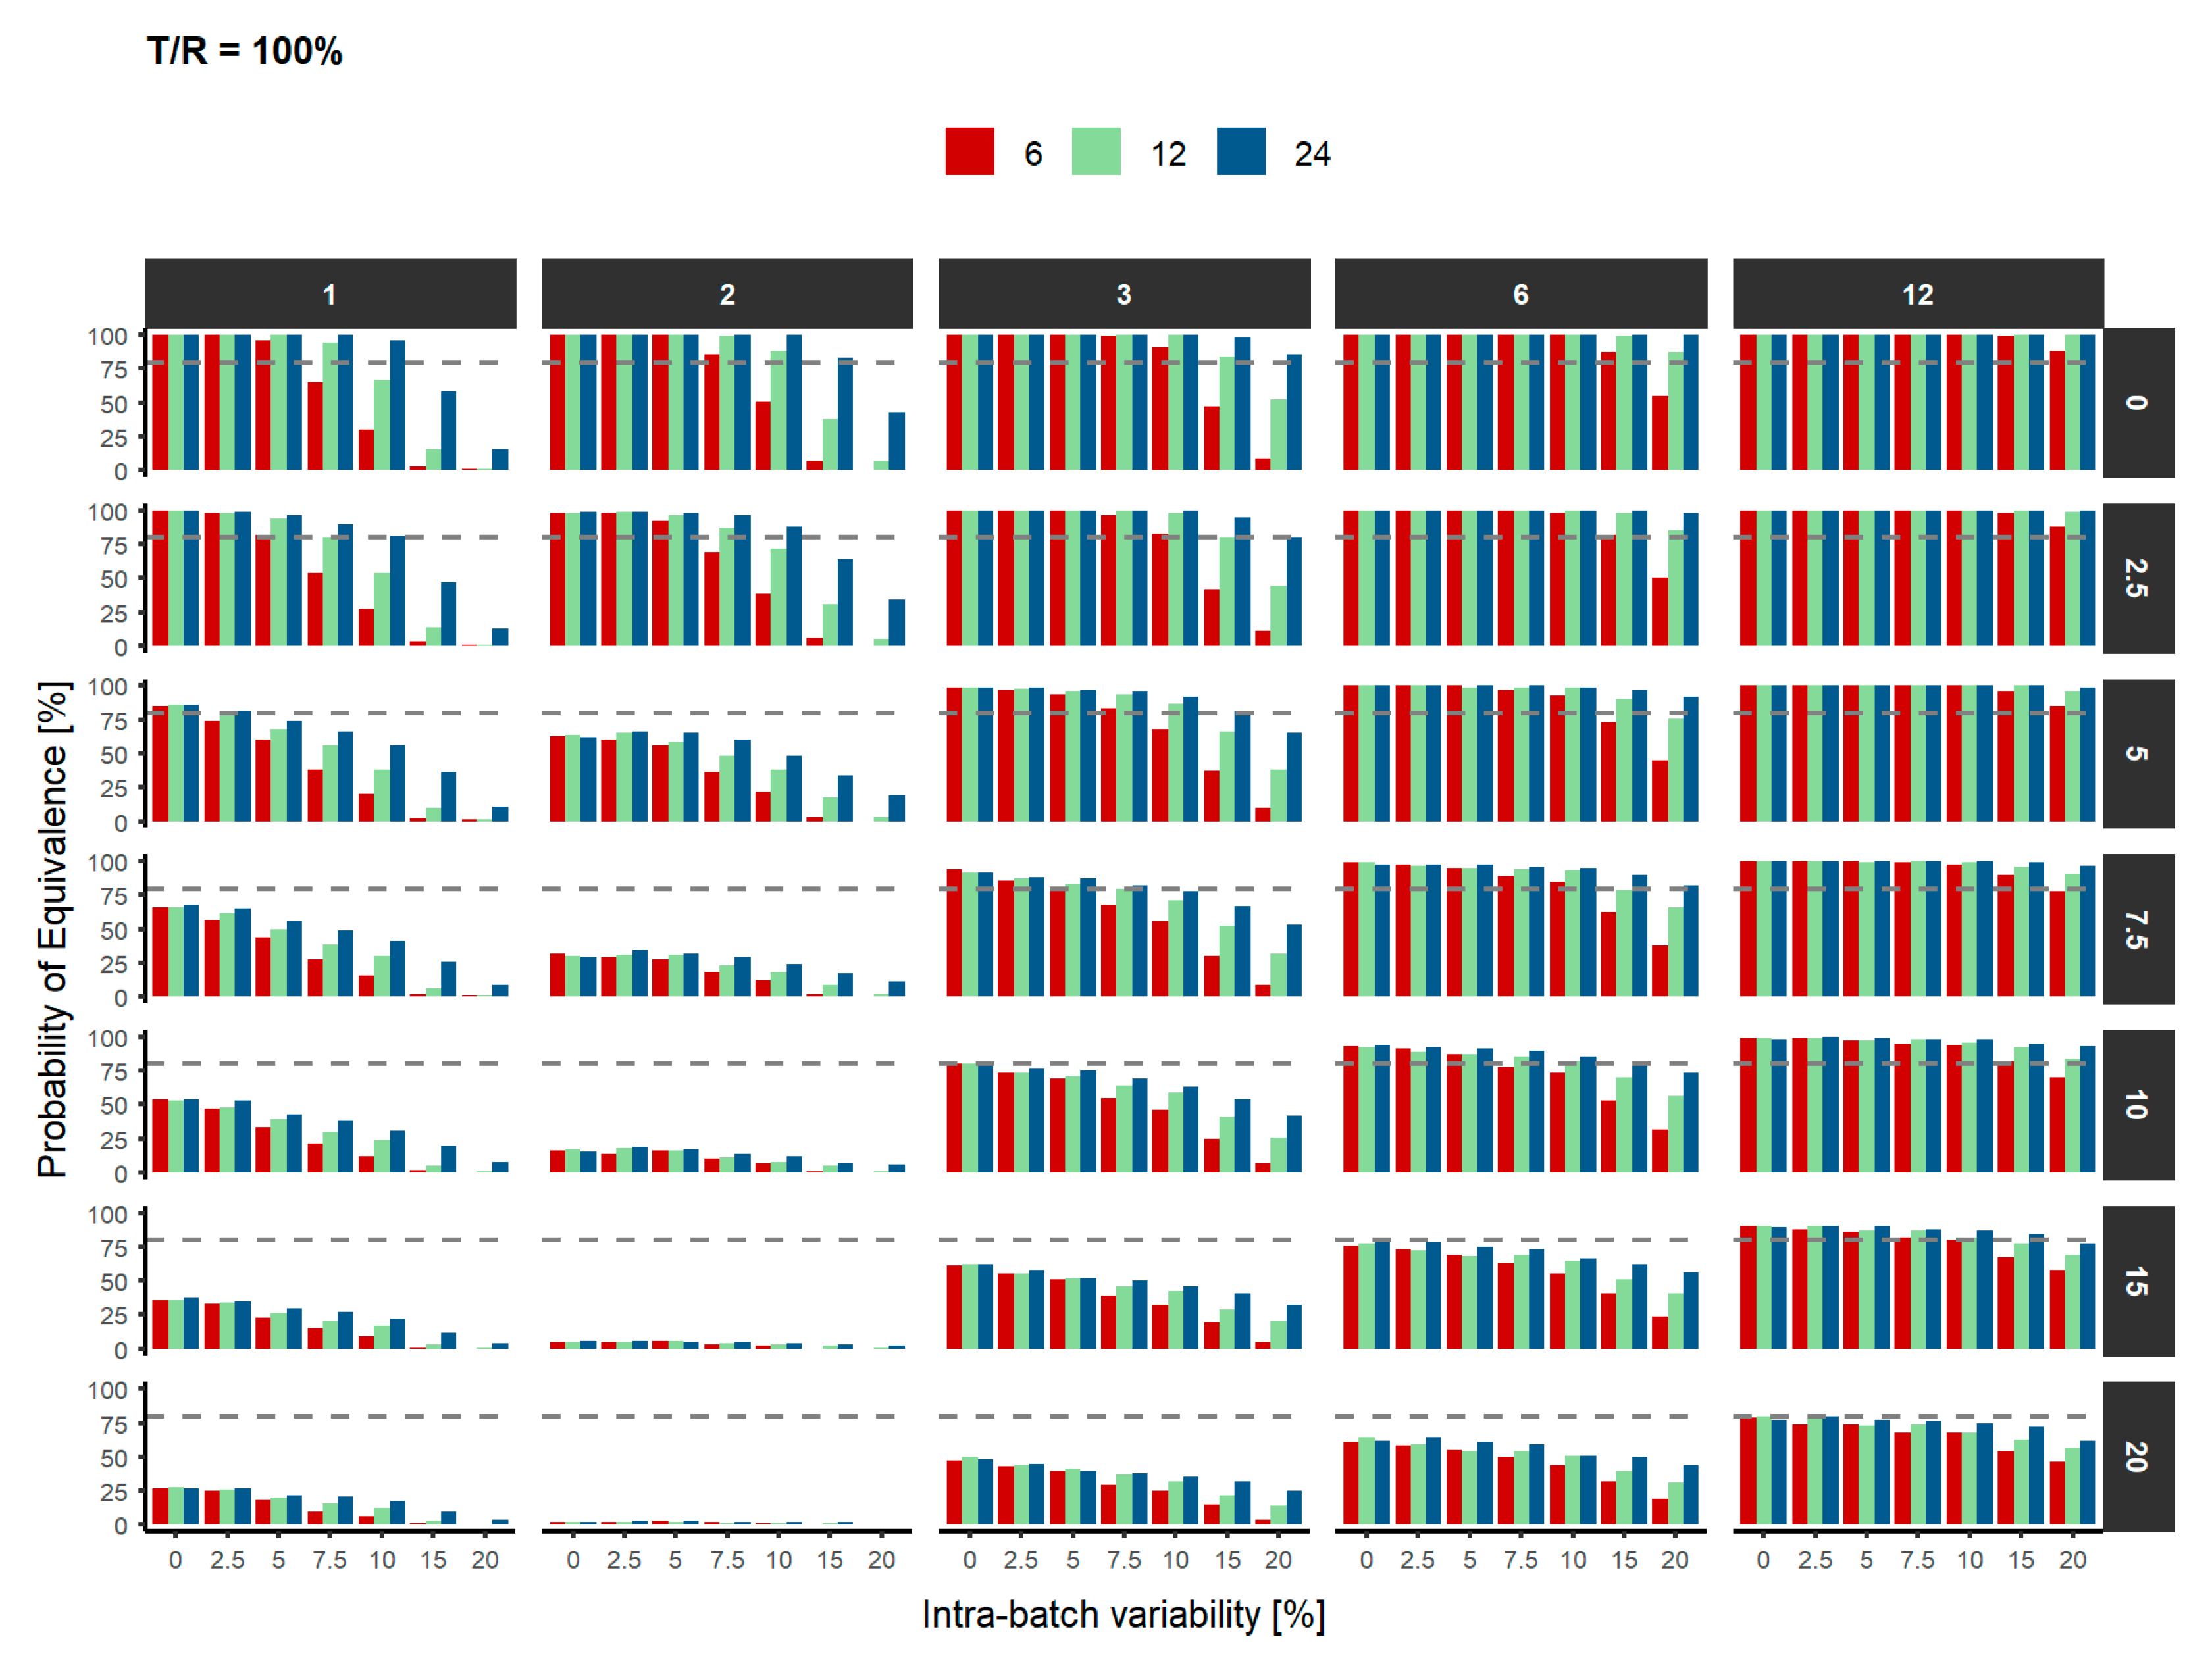
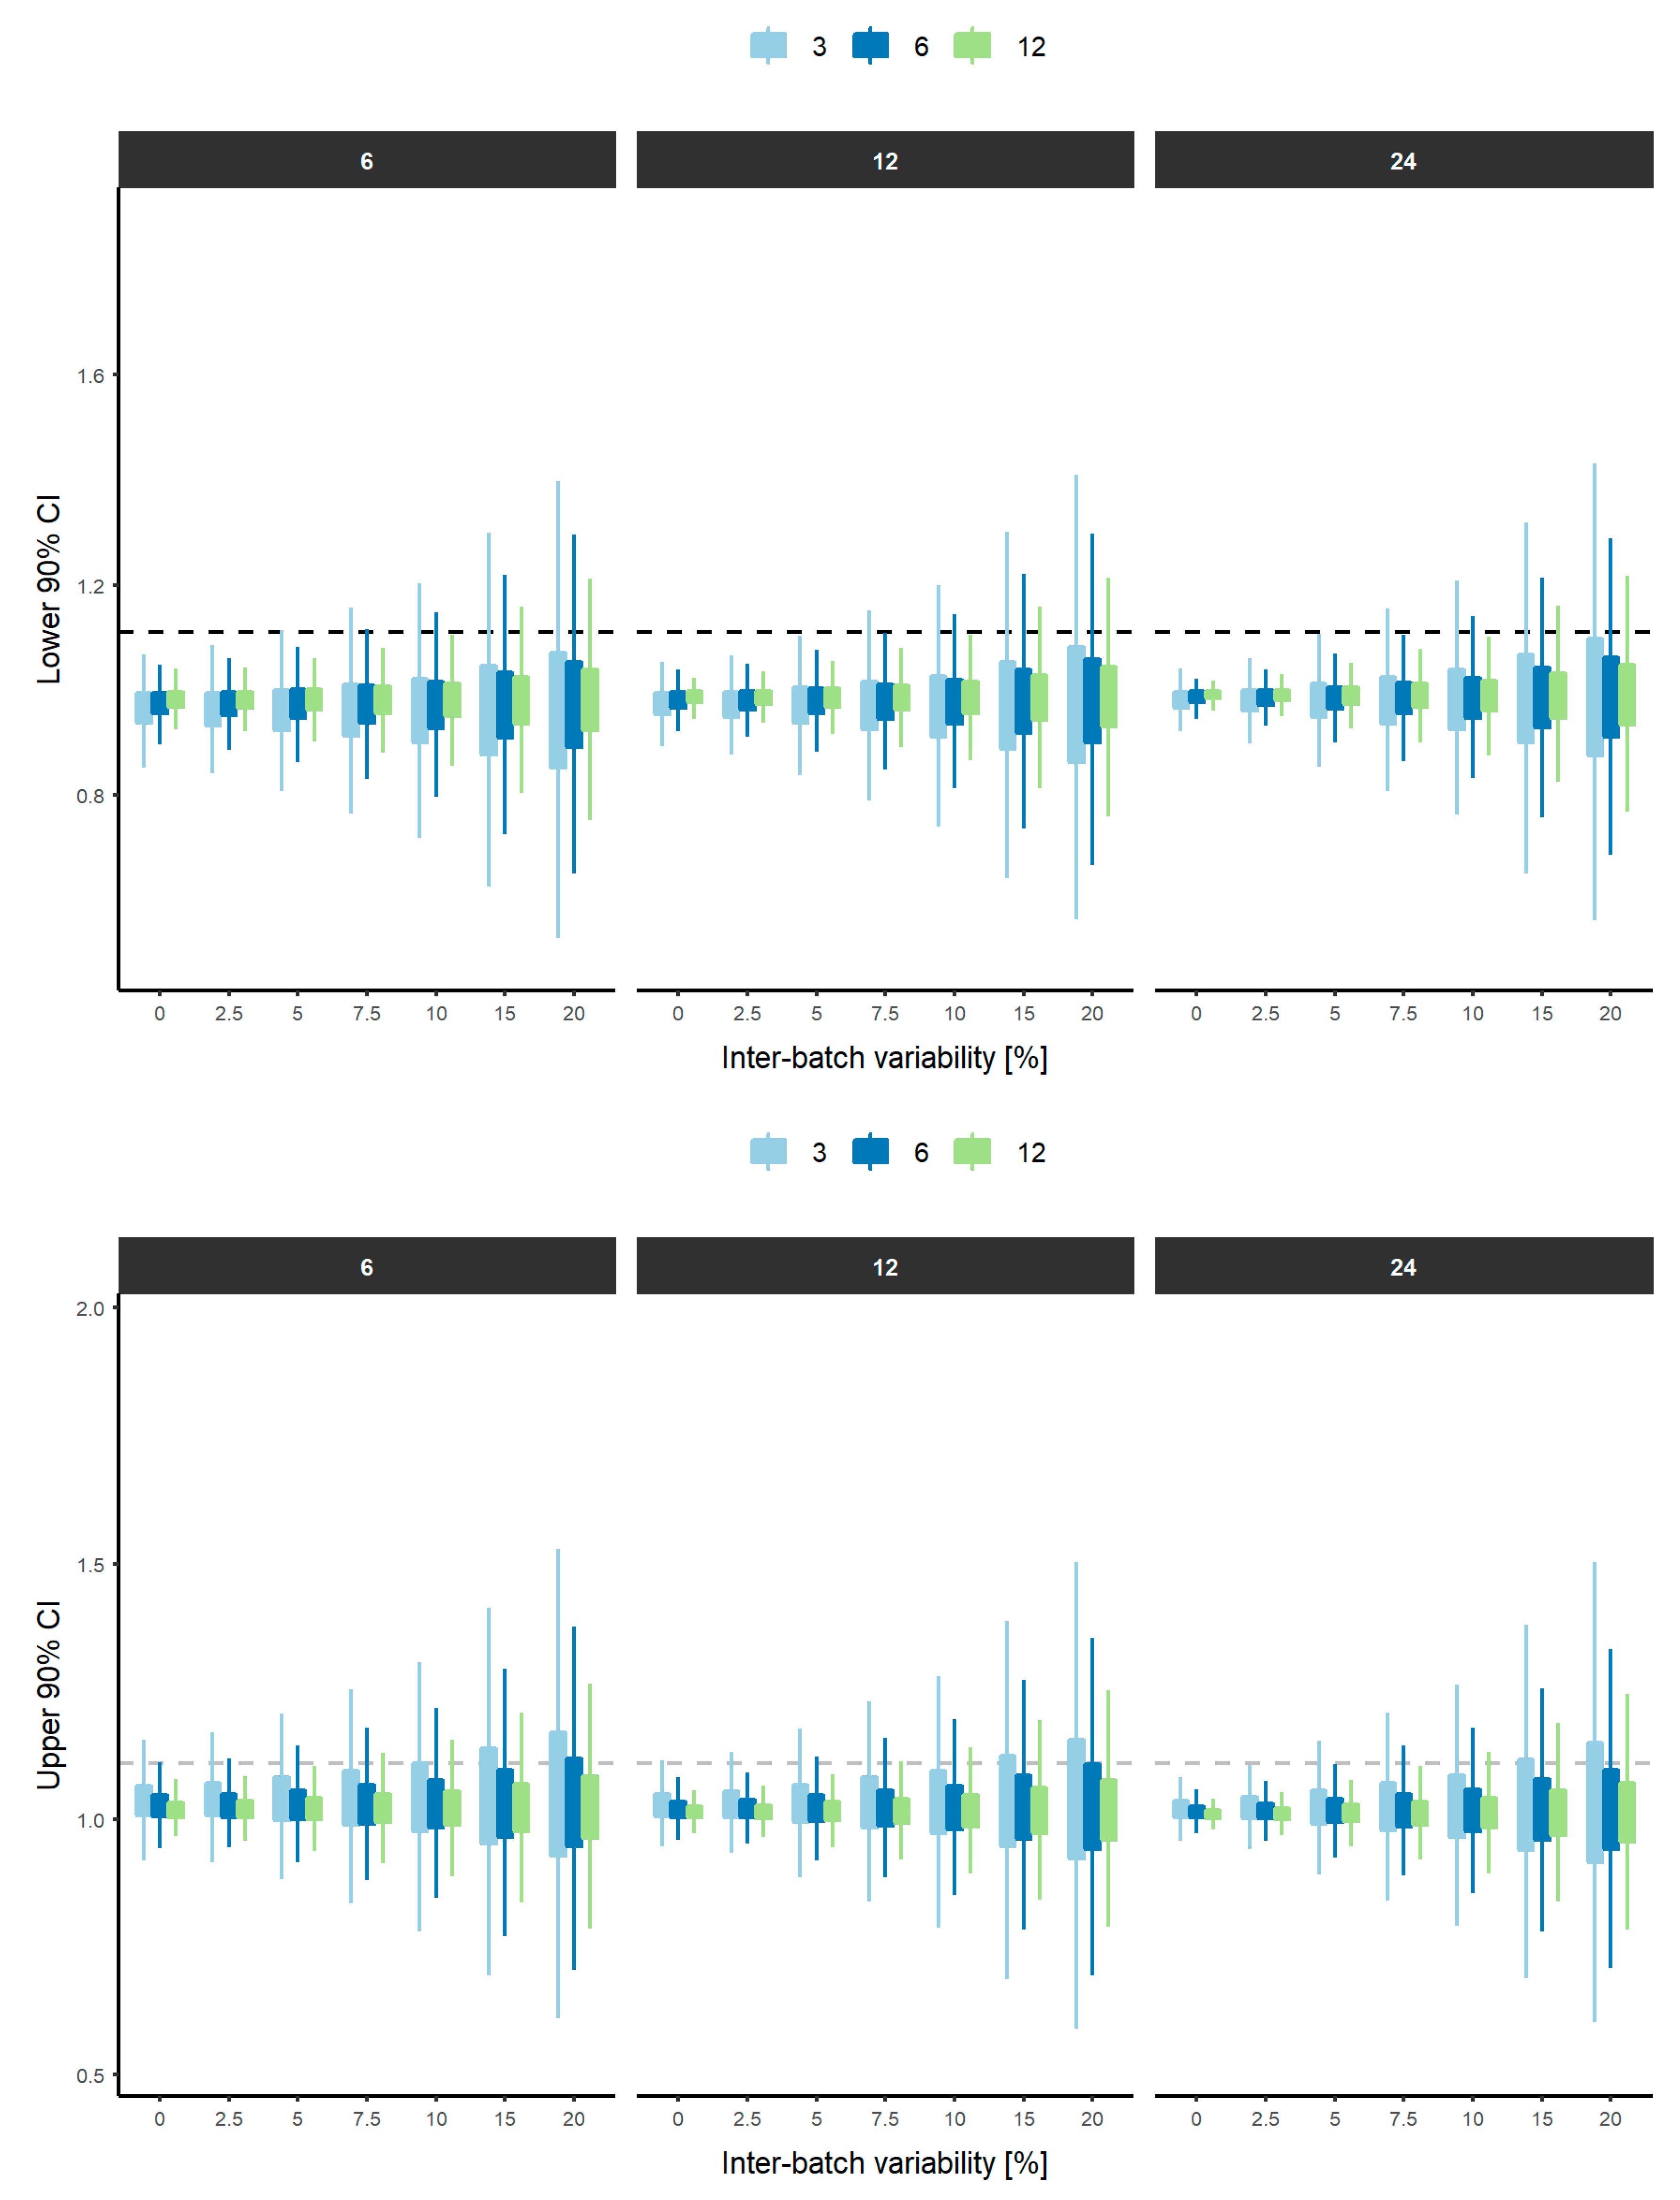
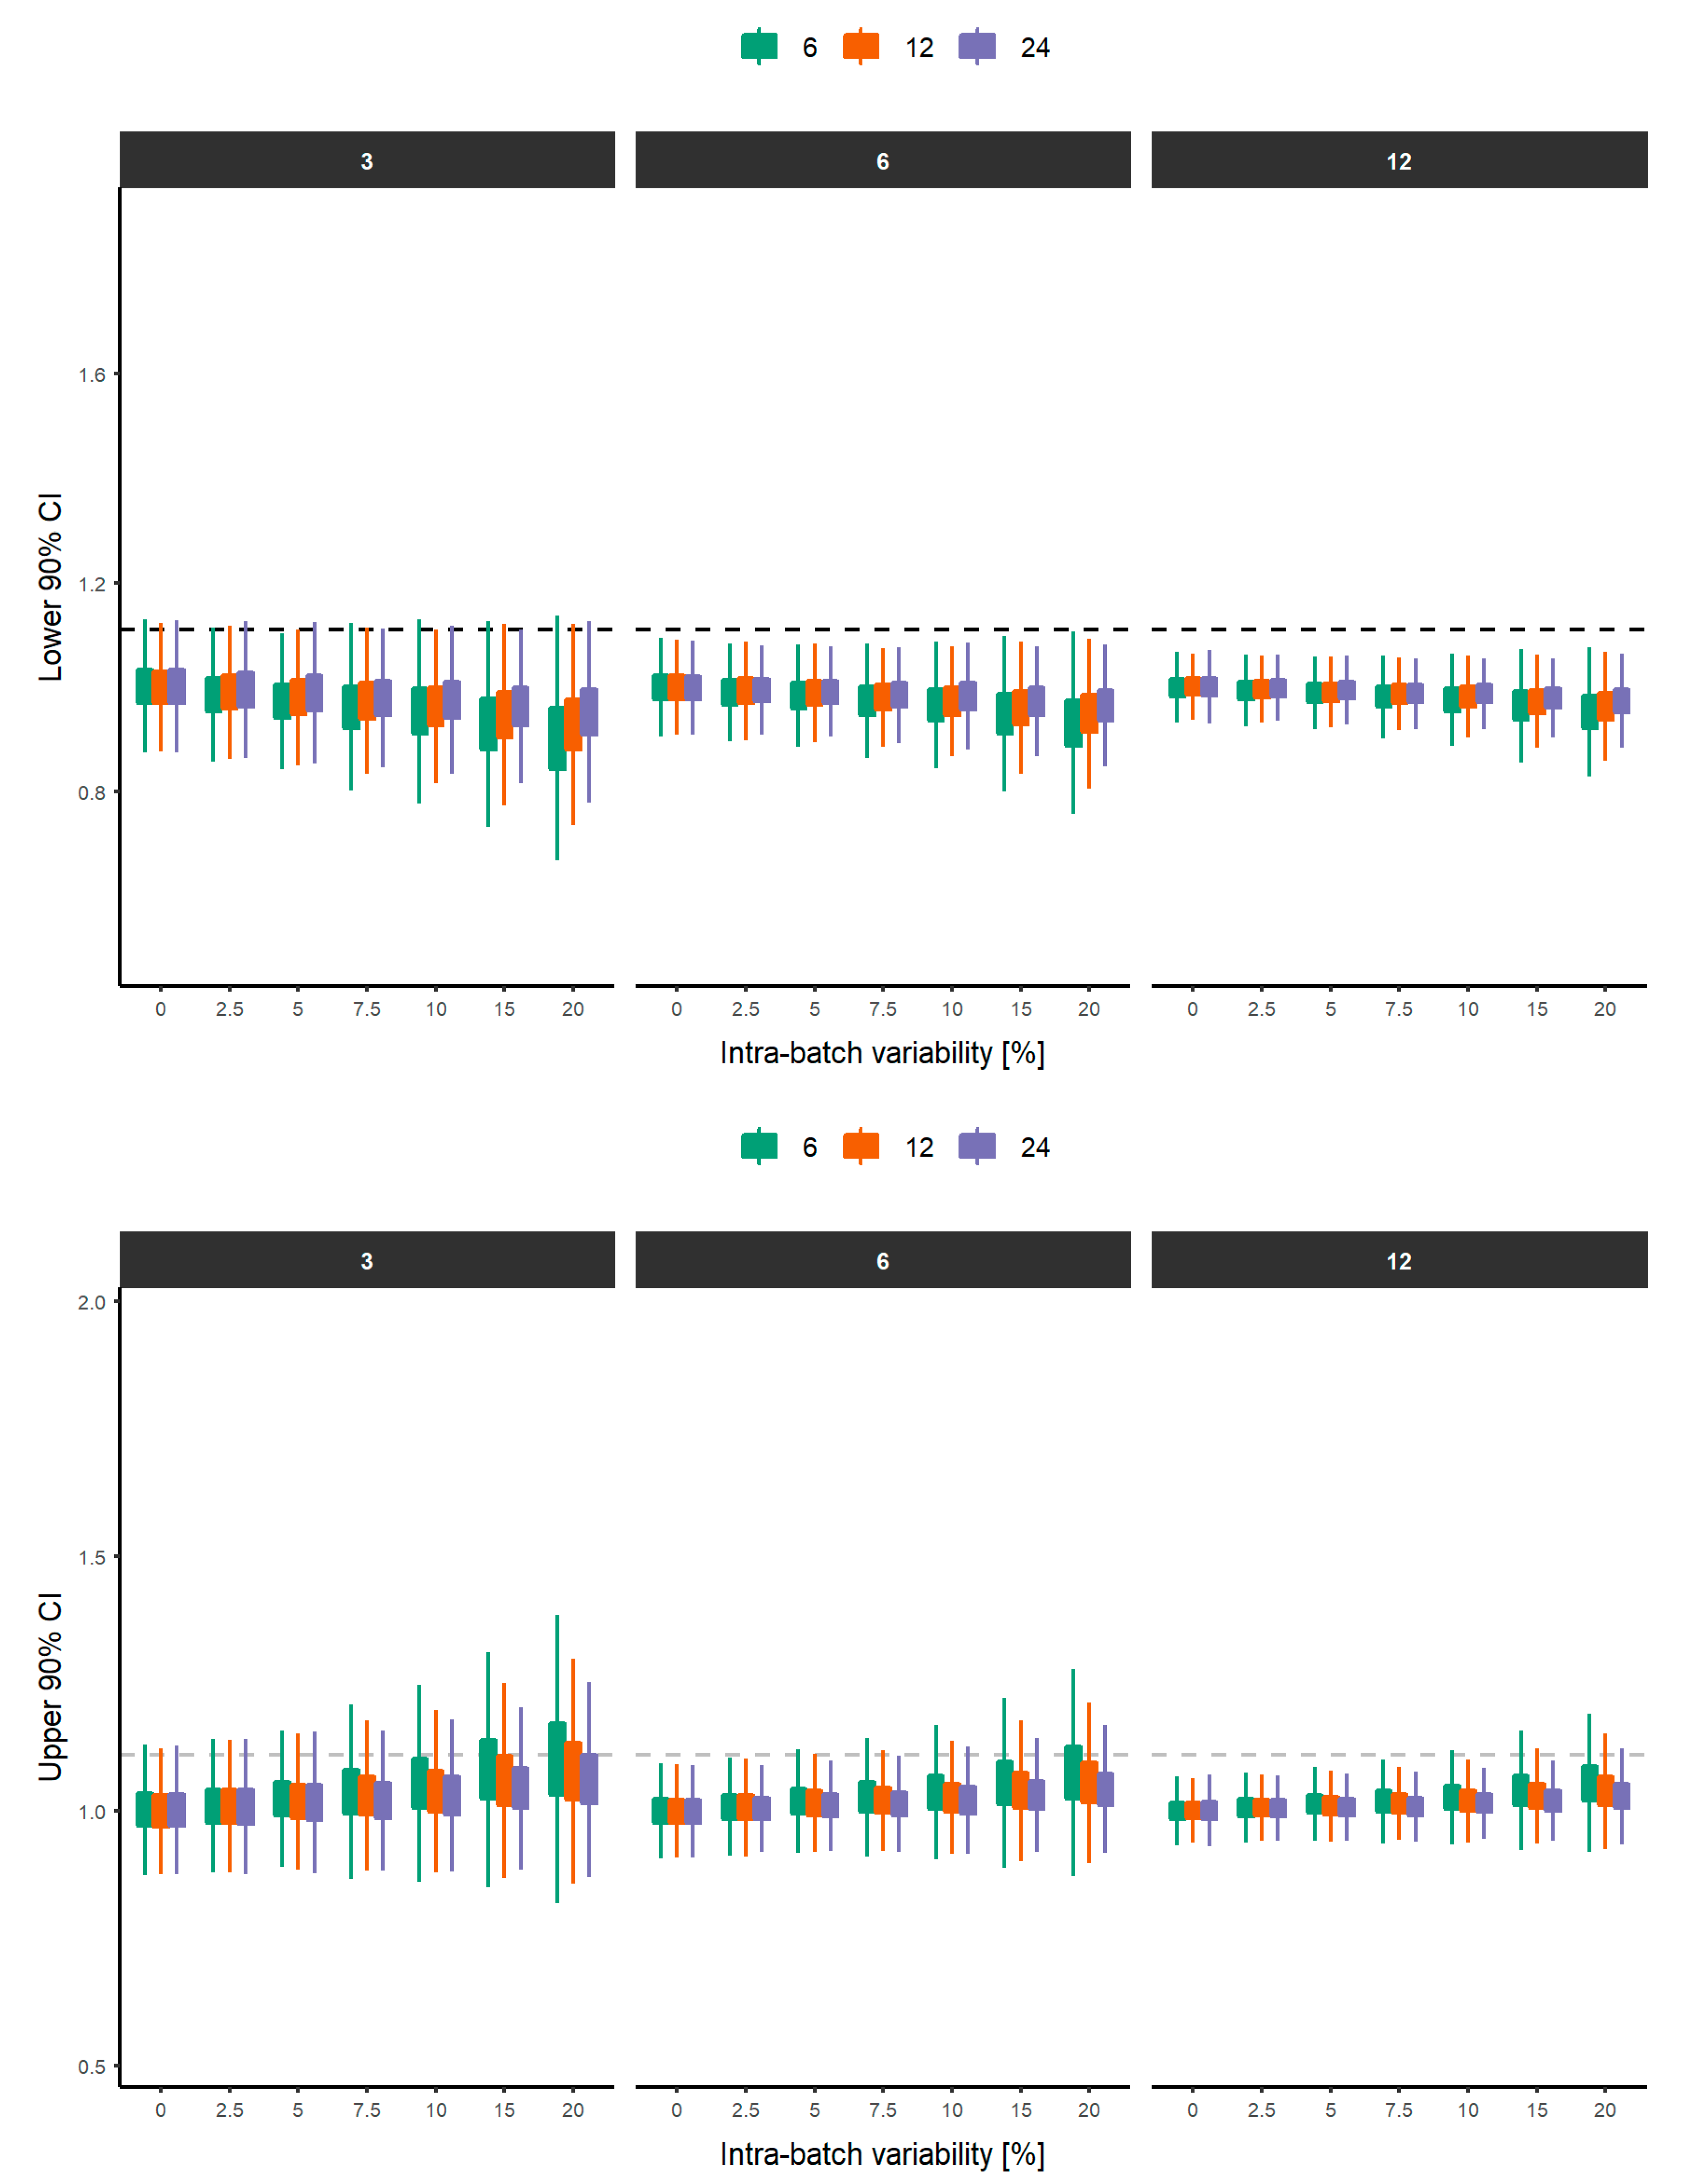
2.1. Study Design

The simulated scenarios were generated from the combination of the different variables specified below:
  • T/R: Test/Reference ratio (%): 100 (no difference), 97.5 (2.5% difference) and 95 (5% difference)
  • NB: Number of batches per product: 1, 2, 3, 6 and 12
  • NU: Number of units/replicates per batch: 6, 12 and 24
  • IBV: Inter-batch variability (%): 0, 2.5, 5, 7.5, 10, 15 and 20
  • ABV: Intra-batch variability (%): 0, 2.5, 5, 7.5, 10, 15 and 20
A total of 2205 scenarios were simulated, assuming 3 levels of T/R, 5 levels of NB (1, 2, 3, 6 and 12), 3 levels of NU (6, 12 and 24), 7 levels of IBV (0, 2.5, 5, 7.5, 10, 15 and 20), and 7 levels of ABV (0, 2.5, 5, 7.5, 10, 15 and 20). All study design conditions were arbitrary selected, but they were aimed to describe frequently observed experimental conditions. In addition, some of these scenarios provided the same total number of observations (e.g., 3 batches and 24 replicates per batch, 6 batches and 12 replicates per batch and 12 batches and 6 replicates per batch = 72 observations) to assess the better way to address the inter- and the intra-batch variability. The inter-batch and intra-batch variability encompass both low and high variability conditions observed in the literature [14,16,17,18,19] in order to evaluate the impact of variability on the probability to show equivalence depending on the simulated scenarios of difference between products and the number of batches and replicates.

2.2. Data Simulation

The simulation of a single experiment started with obtaining the population parameters of each product. The population value of the reference product (TVPR) was fixed to a value of 1 and the population value for the test product (TVPT) was established based on the T/R ratio considered in the simulation settings.
Then, parameter values for each batch of each product were randomly selected based on an exponential error model as follows:
P j k = T V P j · e η I B V
where j represents the reference or test product and k represents batch, P j k is the parameter value for kth batch of reference or test product; and η I B V is the inter-batch variability, with mean zero value and variance ω I B V 2 ( η I B V N ( 0 , ω I B V 2 ) ). The inter-batch variance was derived from the coefficient of variation established for the IBV using the following equation:
ω I B V 2 = ( C V I B V 100 ) 2
Individual rheological parameters ( P j k i ) for each batch were simulated also assuming an exponential model as follows:
P i j k = P j k · e η A B V
where i represents individual unit within batch k for product j; η A B V is the intra-batch variability, with mean zero value and variance ω A B V 2 ( η A B V = N ( 0 , ω A B V 2 ) . The intra-batch variance was derived from the coefficient of variation established for the ABV using the following equation:
ω A B V 2 = ( C V A B V 100 ) 2
This process was repeated until 1000 experiments were simulated for each scenario in order to calculate the probability of similarity per scenario.

2.3. Bootstrap Analysis

A non-parametric bootstrap (n = 10,000) with replacement was conducted on each experiment per scenario based on the simulated data in order establish the bootstrap distribution of the parameter for each experiment of each scenario. Ninety percent non-parametric confidence intervals were calculated from the bootstrap distribution of the geometric mean ratios using the percentile method. Given the bootstrap distribution of the parameters, θ(*1), θ(*2),…,θ(*B), the percentile confidence interval is the interval between the 100·α and 100·(1 − α) quantiles of the bootstrap distribution, where α is the nominal type I error. Similarity was concluded when the non-parametric 90% confidence interval for the ratio test/reference was within the ±10% acceptance range (90.00–111.11%).

2.4. Software

R (V. 4.0.3, http://cran.r-project.org, GNU project) and R-studio (V.1.3.1093, Boston, MA, USA, 2019) were used for the bootstrap analyses and graphical display, respectively. All the analyses were performed on a Linux server from the University of Valencia (LluisVives) with Xeon 7500 series hexacore at 2.67 GHz and 2048 GB RAM.

3. Results

Figure 1 depicts the simulation workflow followed to generate firstly the 2205 scenarios through the combination of different factors (T/R, NB, NU, IBV and ABV), and secondly, the estimation of the probability of showing equivalence through the stochastic simulation of 1000 experiments per scenario, including 10,000 bootstraps on each simulation in order to calculate the 90% CI of the T/R ratio.
Table 1, Table 2 and Table 3 summarize the probability of concluding similarity for each scenario, assuming different T/R ratios, NB, NU, IBV and ABV. These tables include the possibility of zero inter- and intra-batch variability, although not realistic, to show that bioequivalence is always shown in the absence of variability since the simulated differences are lower than 10%. These scenarios might represent scenarios with extremely low variability (<0.5%). In such cases, the sample size (i.e., NB and NU) could be extremely low.
These simulations show that with the conditions required in the draft guideline (3 batches and 12 replicates), there is statistical power to conclude similarity only if the IBV and ABV does not exceed 7.5% if the products are equal, and 5% if the products are 2.5 or 5% different, which a usual assumption when calculating the sample size. If the IBV is low (e.g., 2.5%) there is at least 80% power in scenarios of more ABV (e.g., 15% if products are identical, 10% if the products differ only 2.5%, and 7.5% if the products differ 5%). Similarly, if the ABV is only 5%, there is at least 80% power to show similarity for IBV of 7.5% when the products differ 2.5%, but 5% IBV if the products differ 5% in their mean values. Therefore, the number of batches or the number of replicates have to be increased when the variabilities are higher than 7.5%, or even 5% if the products are not identical.
Table 1, Table 2 and Table 3 also show the probability of success when only one or two batches are tested. Importantly, the investigation of only one batch of test and one batch of reference and 6 units per batch is reasonable only where the products are identical, the ABV is ≤5% and the IBV is ≤2.5%. If the products differ 2.5%, the ABV and the IBV cannot exceed 2.5%. If 12 units are tested per batch, 80% power is achieved in the case of 7.5% intra- and 2.5% inter-batch variability, which illustrates that the ABV has to be compensated by increasing the number of units per batch, and 81% power is achieved in case of 5% of IBV and 2.5% ABV, which illustrates that the increase in the total sample size is also useful to compensate the increase in IBV.
Figure 2 represents the probability of declaring similarity when the T/R ratio is equal to 100% based on the IBV. The results are stratified by the number of units and the ABV considered.
Figure 3 summarizes the probability of declaring similarity when the T/R ratio is equal to 100% based on the ABV. The results are stratified by the number of batches and the IBV considered.
The distribution of the lower and upper limits of the 90% CI derived from the bootstrap analysis (n = 10,000) for each scenario, assuming a T/R = 100% in the rheological parameter between test and reference products and stratified by NB and NU are depicted in Figure 4 and Figure 5, respectively.
Distributions of the lower and upper limits of the 90% CI narrow as the number of batches increases for the same conditions of IBV. Furthermore, from 2.5% IBV, the differences in the distributions are evident from selecting 3, 6 and 12 batches. This is due to the fact that it is more complex to control the variability in a very small sample (1–3 batches), while if the sample is increased (6–12 batches), a more precise characterization of the variability can be obtained. This trend is independent of the NU, demonstrating that IBV is only dependent on the NB considered. This behavior is also visible when ABV and units (6, 12 and 24) are assessed (Figure 5). As long as the ABV increases, a narrower distribution of the 5th and 95th percentiles were obtained when higher NU was considered. As expected, when low ABV exists, a similar distribution of the 5th and 95th percentiles were achieved with 6, 12 and 24 units per batch. However, differences in the distribution start to appear when ABV is equal or greater than 10%, suggesting that 6 units per batch is insufficient to obtain a precise and reliable estimation of the equivalence between two products. This clearly indicates that the influence of ABV can be partially addressed by increasing the number of units per batch, since less variable 5th and 95th percentiles are expected, and therefore, the conclusion of equivalence is less influenced by the sample size. The distributions of the 5th and 95th percentiles with 1 or 2 batches are not shown for simplicity. A similar behavior is observed when differences in the rheological parameter between the test and reference products increase to ±2.5 and ±5% (Supplementary Figures S1 and S2).

4. Discussion

This investigation provides the number of batches and the number of replicates per batch required to have enough (>80%) statistical power to show equivalence within a 10% acceptance range where multiple batches are included in the comparison (e.g., for in vitro parameters), in contrast to those comparisons where only batch is tested (e.g., in vivo bioequivalence study). In the case of in vivo studies, it is assumed that the in vivo response (e.g., pharmacokinetic, pharmacodynamic or clinical) would be the same in all manufactured batches, therefore only one batch needs to be tested, but for in vitro parameters (i.e., critical quality attributes) several batches need to be tested because the in vitro outcome varies from batch to batch and between units of a given batch. Importantly, this investigation is not limited to in vitro properties of semisolid dosage forms, but can be applied to any comparison of in vitro parameters that can be assumed to follow a normal/log-normal distribution and where several batches of each product are tested and more than 1 determination is conducted per batch.
In addition, this study also addresses the adequacy of the frequent requirement of testing 3 batches and 12 replicates per batch. As can be seen in Table 1, when the test and reference product are identical (T/R = 1), with 3 batches and 12 replicates per batch there is enough power to show equivalence when IBV is ≤7.5% and ABV is ≤7.5% (≥80% power). In case of higher ABV (e.g., 10%), the IBV should be only 5% to achieve 87% power, and if the ABV is 15%, the IBV should be 2.5% to achieve 80% power. Otherwise, this minimum requirement of 3 batches and 12 replicates per batch would be insufficient, since it only applies to conditions of low IBV and ABV. It is important to highlight that intra- and inter-batch variability higher than 10% has been described in 4 out of 10 rheological parameters that were compared in a previous work, in which ten batches of the reference bethametasone/calcipotriol cream were compared [15,16], and in 2 of the 8 rheological parameters of two oil-in-water emulgels with the same qualitative and quantitative composition containing 2% diclofenac diethylamine, for which 3 and 4 batches were analyzed [19]. In one of these parameters, the observed variability ranged between 25% and 30%, and the droplet diameter exhibited even higher variability.
Furthermore, the comparison of the combination of batches and replicates that produce the same total number of observations (i.e., 3 batches and 24 replicates vs. 6 batches and 12 replicates vs. 12 batches and 6 replicates), shows that 12 batches and 6 replicates are successful in a larger number of scenarios independently of the difference between products. A general recommendation for moderate-to-high variability (≥10%) scenarios (IBV and/or ABV) could be to use 6 batches and 12 units per batch or, in case there is not sufficient number of batches available, 3 batches with 24 units per batch.
The evaluation of the probability of showing equivalence where it is not possible to use three batches because fewer batches are on the market shows that the use of two batches is surprisingly counter-productive. The use of only one batch is impractical, unless the inter-batch variability is known to be very low through the investigation of multiple batches during the pharmaceutical development, since testing only one batch does not allow the characterization of the inter-batch variability. The obtained estimations of the mean would be only accurate if the inter-batch variability were extremely low. When the variability is so low any selected batch can be considered to be representative of future batches to be manufactured for the test product and for any other batch of the reference product in the market. This same assumption is employed when conducting in vivo bioequivalence studies, where it is expected that all batches of the same manufacturer have consistently the same bioavailability. Testing only one batch of test and reference in products with known low inter-batch variability (<2.5%) could be feasible if a large number of replicates per batch were tested. In case of 24 replicates, enough power is achieved for scenarios with 2.5% inter-batch variability only and intra-batch variability of 10% if the ratio between products is 100%, 7.5% intra-batch variability if the ratio is 97.5%, and 5% if the ratio is 95%.
This study also confirms the fact that increases in IBV must be addressed by increasing the number of batches. This trend is irrespective of the T/R ratio simulated (100%, 97.5% and 95%) and the number of units (6, 12 and 24) considered, but only visible when an appropriate characterization of the IBV occurs (i.e., ≥3 batches). For example, in case of identical products or differences of 2.5% or 5%, and ABV of up to 10%, the increase of IBV from 5 to 10% requires testing 6 instead of 3 batches to achieve 80% power to show similarity. This conclusion is supported in Figure 4, since a wider distribution of the 5th and 95th percentiles occurs when 3 batches were considered vs. 6–12 batches, leading to a smaller number of simulations concluding equivalence when both products are actually equivalent (T/R = 100%). This reinforces the fact that IBV cannot be adequately captured when three batches are considered and at least six batches should be used to properly reduce the influence of IBV in the assessment of equivalence between two products. Consequently, the recommendation of the draft guideline [1] to use a minimum of three batches must be interpreted as a minimum to be applied when the inter-batch variability is really low and it must be understood that even in that case it is not estimating the actual inter-batch variability accurately.
Table 1, Table 2 and Table 3 show that in the case of high ABV and IBV, equal to or higher than 20%, there is less than 80% power to show equivalence within an acceptance range of 10%, even if the 12 batches and 24 replicates per batch are tested. The use of more than 24 replicates per batch is possible, but the use of more than 12 batches may be unfeasible, since such a large number of batches may not be available in the European market. Therefore, a widening of the acceptance range is proposed for those cases where there is less than 80% power to show equivalence with a reasonable sample size (e.g., 10–12 batches and 30–50 replicates per batch) even when products are identical. This widening could be applied in the same way as it is applied in pharmacokinetic bioequivalence studies for Cmax in the case of highly variable drugs with intra-subject CV for the reference product higher than 30% [19]. However, in this case the widening should be based on the total variability of the reference, which is the variability to which a patient treated chronically with the reference product is exposed. As in this case the acceptance range is 10%, instead of 20%, the proportionality constant should be different. This proportionality constant would depend on the value of CV where widening starts to be applied, since SR, where the limits start to be widened, and S0, which defines the scaling proportionality constant, are the same in the Guideline on the investigation of bioequivalence [20]. If it were applied in those cases where the total variability is 10%, the acceptance limits in log-scale would be widened with a proportionality constant of 1.056. If it were applied when the total variability is 20%, the proportionality constant would be 0.532 and if the total CV were 30%, the proportionality constant would be 0.3589, which is similar to the 0.36 value defined by Wellek as a strict one [21]. Further simulation work is necessary to define the proportionality constant for widening of the acceptance range, but for the time being, a proportionality of 0.3589 seems conservative enough.
The magnitude of the IBV and ABV as well as the difference between test and reference differ in the multiple in vitro parameters under comparison. For this reason, the calculation of sample size could be based either individually for each parameter according to the expected variability and the expected difference between products for that parameter, or globally for all parameters based on the maximum sample size required for the parameter that presents greater variability and/or difference. Those decisions can be conditioned by the cost of the analysis and the availability of batches and units. Additionally, as the sponsor has to compare multiple in vitro parameters, multiplicity may cause that some comparison may be non-equivalent simply by chance. The higher number of in vitro parameters, the higher probability to conclude that one of them is not able to show equivalence. Therefore, it would be wise to use the maximum global sample size if affordable. In addition, the multiplicity can be compensated with the possibility to repeat the studies with a higher sample size to achieve conclusive results. In such case, the whole evidence from inconclusive and conclusive studies should be combined to demonstrate consistency.

5. Conclusions

In conclusion, this simulation-based analysis shows the influence of inter- and intra-batch variability on the sample size required to conclude on the equivalence between the in vitro characteristics assuming test/reference ratios of 100%, 97.5% and 95%. This work confirms that the influence of inter-batch variability should be addressed by increasing the number of batches and the intra-batch variability could be solved by increasing the number of units/replicates per batch. Testing 3 batches with 12 units per batch seems to be insufficient unless the inter-batch variability is known to be low. Testing 6 batches with 12 units per batch or 3 batches with 24 units per batch would be sufficient to declare the equivalence in most variability scenarios with up to 5% difference between test and reference products.

Supplementary Materials

The following are available online at https://www.mdpi.com/1999-4923/12/12/1159/s1, Figure S1: Distribution of the lower (top) and upper (bottom) 90% confidence intervals from each experiment (n = 1000), stratified by the number of units (top) when the T/R ratio is 97.5%. Figure S2: Distribution of the lower (top) and upper (bottom) 90% confidence intervals from each experiment (n = 1000), stratified by the number of batches (top) when the T/R ratio is 97.5%. Figure S3: Distribution of the lower (top) and upper (bottom) 90% confidence intervals from each experiment (n = 1000), stratified by the number of units (top) when the T/R ratio is 95%. Figure S4: Distribution of the lower (top) and upper (bottom) 90% confidence intervals from each experiment (n = 1000), stratified by the number of batches (top) when the T/R ratio is 95%.

Author Contributions

Conceptualization, V.M.-S., M.M.-S., V.M. and A.G.-A.; methodology, Z.X., V.M.-S. and A.G.-A.; software, Z.X. and V.M.-S.; formal analysis, Z.X., V.M.-S.; data curation, Z.X., V.M.-S.; writing—original draft preparation, V.M.-S., and A.G.-A.; writing—review and editing, Z.X. and V.M.-S., M.M.-S., V.M. and A.G.-A. All authors have read and agreed to the published version of the manuscript.

Funding

This research received no external funding.

Conflicts of Interest

The authors declare no conflict of interest.

References

  1. Committee for Medicinal Products for Human Use (CHMP). Draft Guideline on Quality and Equivalence of Topical Product. CHMP/QWP/708282/2018. Available online: https://www.ema.europa.eu/en/quality-equivalence-topical-products (accessed on 25 September 2020).
  2. Food and Drug Administration. Draft Guidance on Acyclovir. Available online: https://www.accessdata.fda.gov/drugsatfda_docs/psg/PSG_018604.pdf (accessed on 28 October 2020).
  3. Food and Drug Administration. Draft Guidance on Dapsone. Available online: https://www.accessdata.fda.gov/drugsatfda_docs/psg/PSG_207154.pdf (accessed on 28 October 2020).
  4. Food and Drug Administration. Draft Guidance on Silver Sulfadiazine. Available online: https://www.accessdata.fda.gov/drugsatfda_docs/psg/Silver%20sulfadiazine_topical%20cream_NDA%20017381_RC05-17.pdf (accessed on 28 October 2020).
  5. Food and Drug Administration. Draft Guidance on Benzyl alcohol. Available online: https://www.accessdata.fda.gov/drugsatfda_docs/psg/Benzyl_alcohol_lot_022129_RC12-14.pdf (accessed on 28 October 2020).
  6. Food and Drug Administration. Draft Guidance on Ivermectin. Available online: https://www.accessdata.fda.gov/drugsatfda_docs/psg/Ivermectin%20Topical%20Cream%201%20NDA%20206255%20PSG%20Page%20RV%20May%202019.pdf (accessed on 28 October 2020).
  7. Food and Drug Administration. Draft Guidance on Propofol. Available online: https://www.accessdata.fda.gov/drugsatfda_docs/psg/Propofol_injectable%20injection_RLD%2019627_RC06-16.pdf (accessed on 28 October 2020).
  8. Food and Drug Administration. Draft Guidance on Budesonide. Available online: https://www.accessdata.fda.gov/drugsatfda_docs/psg/PSG_020746.pdf (accessed on 28 October 2020).
  9. Committee for Medicinal Products for Human Use (CHMP); EMA. Guideline on Equivalence Studies for the Demonstration of Therapeutic Equivalence for Locally Applied, Locally Acting Products in the Gastrointestinal Tract. CPMP/EWP/239/95 Rev. 1, Corr.1. Available online: https://www.ema.europa.eu/en/documents/scientific-guideline/guideline-equivalence-studies-demonstration-therapeutic-equivalence-locally-applied-locally-acting_en.pdf (accessed on 28 October 2020).
  10. Committee for Medicinal Products for Human Use (CHMP). Guideline on the Requirements for Clinical Documentation for Orally Inhaled Products (OIP) Including the Requirements for Demonstration of Therapeutic Equivalence between Two Inhaled Products for Use in the Treatment of Asthma and Chronic Obstructive Pulmonary Disease (COPD) in Adults and for Use in the Treatment of Asthma in Children and Adolescents. CPMP/EWP/4151/00 Rev. 1. Available online: https://www.ema.europa.eu/en/documents/scientific-guideline/guideline-requirements-clinical-documentation-orally-inhaled-products-oip-including-requirements_en.pdf (accessed on 28 October 2020).
  11. Hertzog, M.A. Considerations in Determining Sample Size for Pilot Studies. Res. Nurs. Health 2008, 31, 180–191. [Google Scholar] [CrossRef] [PubMed]
  12. Browne, R.H. On the Use of a Pilot Sample for Sample Size Determination. Stat. Med. 1995, 14, 1933–1940. [Google Scholar] [CrossRef] [PubMed]
  13. Chang, R.-K.; Raw, A.; Lionberger, R.; Yu, L. Generic Development of Topical Dermatologic Products, Part II: Quality by Design for Topical Semisolid Products. AAPS J. 2013, 15, 674–683. [Google Scholar] [CrossRef] [PubMed] [Green Version]
  14. Mangas-Sanjuán, V.; Pleguezuelos-Villa, M.; Merino-Sanjuán, M.; Hernández, M.J.; Nácher, A.; García-Arieta, A.; Peris, D.; Hidalgo, I.; Soler, L.; Sallan, M.; et al. Assessment of the Inter-Batch Variability of Microstructure Parameters in Topical Semisolids and Impact on the Demonstration of Equivalence. Pharmaceutics 2019, 11, 503. [Google Scholar] [CrossRef] [PubMed] [Green Version]
  15. Ocaña, J.; Monleón-Getino, T.; Merino, V.; Peris, D.; Soler, L. Statistical Methods for Quality Equivalence of Topical Products. 0.5 Mg/g Betamethasone Ointment as a Case-Study. Pharmaceutics 2020, 12, 318. [Google Scholar] [CrossRef] [PubMed] [Green Version]
  16. Kryscio, D.R.; Sathe, P.M.; Lionberger, R.; Yu, L.; Bell, M.A.; Jay, M.; Hilt, J.Z. Spreadability Measurements to Assess Structural Equivalence (Q3) of Topical Formulations--a Technical Note. AAPS PharmSciTech 2008, 9, 84–86. [Google Scholar] [CrossRef] [PubMed] [Green Version]
  17. Simões, A.; Miranda, M.; Cardoso, C.; Veiga, F.; Vitorino, C. Rheology by Design: A Regulatory Tutorial for Analytical Method Validation. Pharmaceutics 2020, 12, 820. [Google Scholar] [CrossRef] [PubMed]
  18. Miranda, M.; Cova, T.; Augusto, C.; Pais, A.A.C.C.; Cardoso, C.; Vitorino, C. Diving into Batch-to-Batch Variability of Topical Products-a Regulatory Bottleneck. Pharm. Res. 2020, 37, 218. [Google Scholar] [CrossRef] [PubMed]
  19. Pleguezuelos-Villa, M.; Merino-Sanjuán, M.; Hernández, M.J.; Nácher, A.; Peris, D.; Hidalgo, I.; Soler, L.; Sallan, M.; Merino, V. Relationship between Rheological Properties, in Vitro Release and in Vivo Equivalency of Topical Formulations of Diclofenac. Int. J. Pharm. 2019, 572, 118755. [Google Scholar] [CrossRef] [PubMed]
  20. Committee for Medicinal Products for Human Use (CHMP). Guideline on the Investigation of Bioequivalence. CPMP/EWP/QWP/1401/98 Rev. 1/ Corr **. Available online: https://www.ema.europa.eu/en/documents/scientific-guideline/guideline-investigation-bioequivalence-rev1_en.pdf (accessed on 28 October 2020).
  21. Stefan, W. Chapter 1. Introduction. In Testing Statistical Hypothesis of Equivalence; Chapman & Hall/CRC: Boca Raton, FL, USA, 2003; pp. 12–24. [Google Scholar]
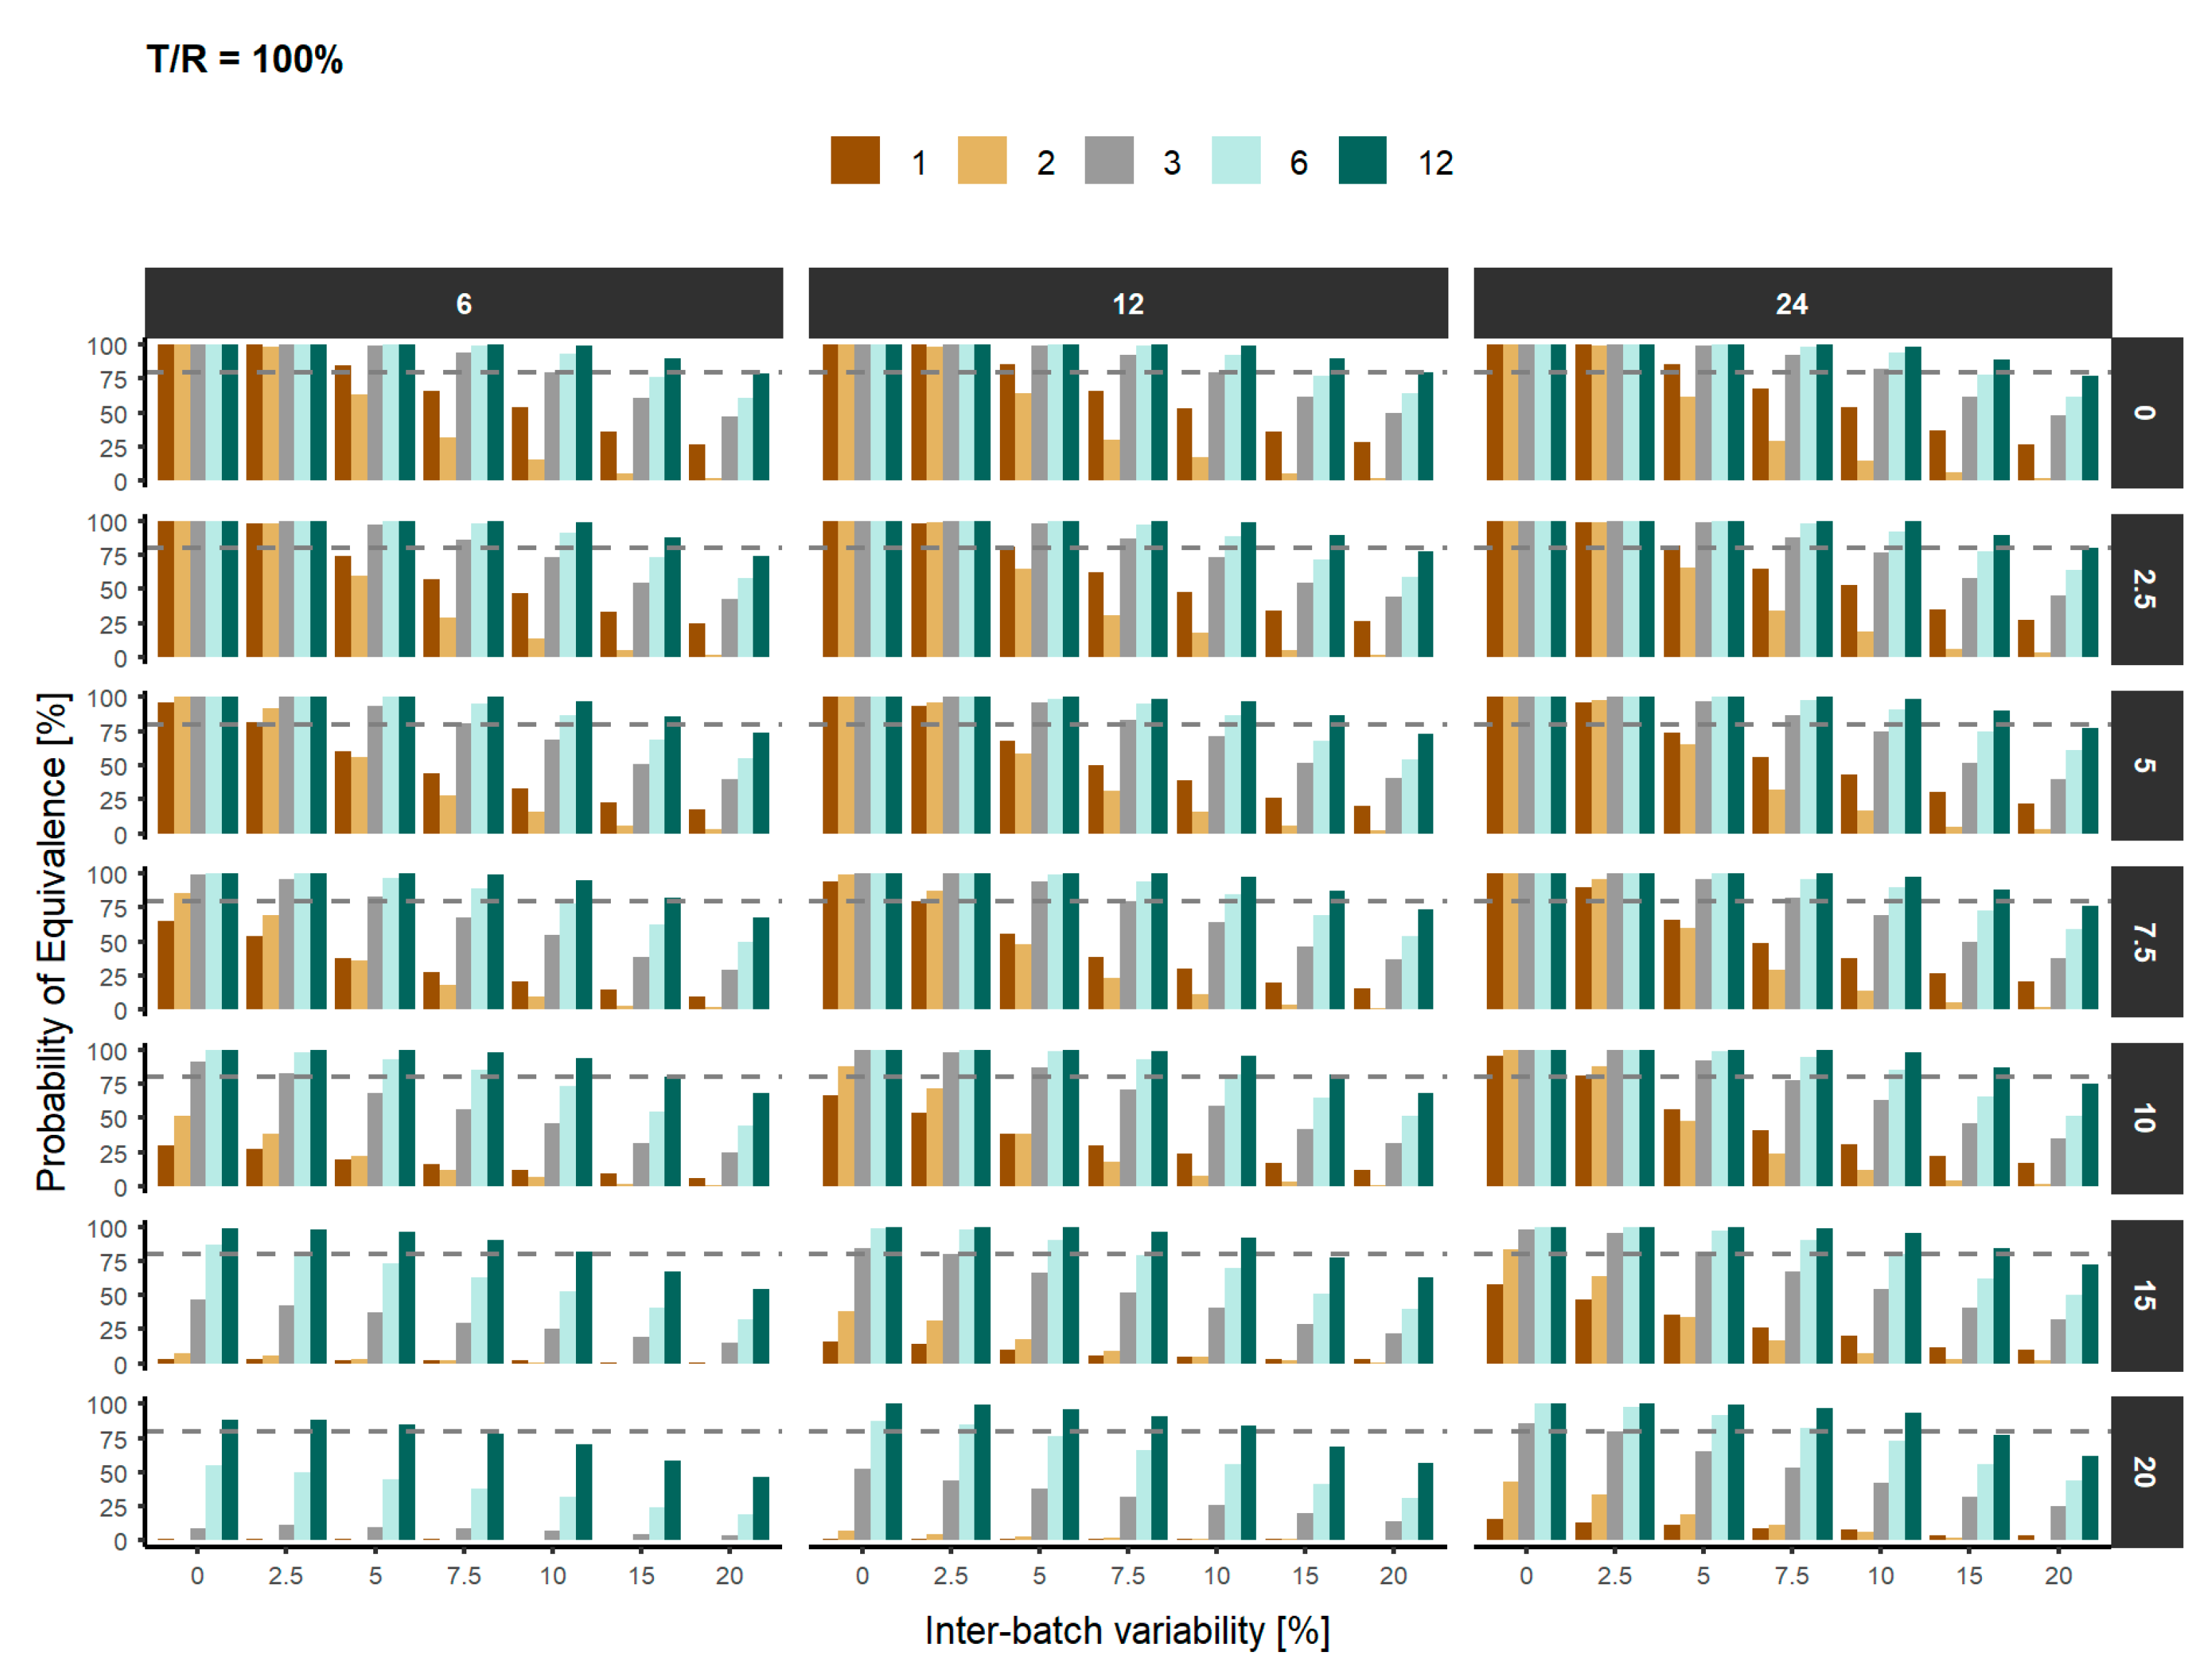
Figure 1. The simulation workflow applied to (i) simulate the scenarios, and (ii) estimate the probability of declaring equivalence per scenario.
Pharmaceutics 12 01159 g001
Figure 2. Probability of declaring similarity based on the inter-batch variability and the number of batches (brown: 1, gold: 2, grey: 3, light green: 6 and dark green: 12). Top panels represent the number of units and right panels represent the intra-batch variability. The grey dashed line represents the statistical power to declare equivalence between both products (80%).
Pharmaceutics 12 01159 g002
Figure 3. Probability of declaring similarity based on the intra-batch variability and the number of units (red: 6, green: 12 and blue: 24). Top panels represent the number of batches and right panels represent the inter-batch variability. The grey dashed line represents the statistical power to declare equivalence between both products (80%).
Pharmaceutics 12 01159 g003
Figure 4. Distribution of the lower (top) and upper (bottom) 90% confidence intervals from each experiment (n = 1000), stratified by the number of units (top) when the T/R ratio is 100%. Light blue, blue and green boxplots represent the lower and upper 90% CI when 3, 6 and 12 batches were considered, respectively. The box represents the interquartile range (IQR: Q1–Q3) and lines represent 1.5*IQR. Dashed grey lines represent the lower (0.9) and upper (1.11) limit of the regulatory acceptance range.
Pharmaceutics 12 01159 g004
Figure 5. Distribution of the lower (top) and upper (bottom) 90% confidence intervals from each experiment (n = 1000), stratified by the number of batches (top). Green, orange and purple boxplots represent the lower and upper 90% CI when 6, 12 and 24 units were considered, respectively. The box represents the interquartile range (IQR: Q1–Q3) and lines represent 1.5*IQR. Dashed grey line represent the lower (0.9) and upper (1.11) limit of the regulatory acceptance range.
Pharmaceutics 12 01159 g005
Table 1. Probability of similarity when the population difference between reference and test products is 0 (T/R = 100%). Number of batches and inter-batch variability are depicted in the left margin and number of replicates and intra-batch variability at the top of the table. In red are outlined the scenarios with a probability lower than 80%.
T/R = 100%
Number of Units
61224
Intra-Batch Variability (%)
02.557.510152002.557.510152002.557.5101520
Number of batches1Inter-batch variability (%)0100100966530311001001009467161100100100100965816
2.5100988254273110098948054141100999690814713
5857460382021868168563810186827466563611
7.56657442816216662503930616865564941269
105447332112205348393024515453433831208
15363323159103634262017313735302722124
20272518106102826201612302727222117104
2010010010086517010010010099883871001001001001008343
2.5989892693860989996877231599999896886434
5636056362230646559483818362666560483419
7.532292818122030313123189229343229241711
101614161071017181611851151917141276
15556320055643216655432
20223210022211102332220
30100100100999147910010010010010084521001001001001009886
2.5100100100968342111001001001009880441001001001001009580
5999794836837109998969487663899999796928265
7.594868168563099287838071523292888782786753
1080736955462578073716459412682777569635442
1561555139321956255524642292062585250464132
2047434029251545044413732221448454038353225
6010010010010010087551001001001001009987100100100100100100100
2.5100100100100988250100100100100100988510010010010010010098
5100100100979373451001009999999076100100100100999792
7.5999895898563389997959493796698989896959082
10939187787353329289878582705694929190858073
15767369635541247772686965514178787573666256
20615855504432196459545451403162646159515044
1201001001001001009988100100100100100100100100100100100100100100
2.5100100100100100988810010010010010010099100100100100100100100
510010010010010096851001001001001001009610010010010010010099
7.510010010099989078100100991009996911001001001001009997
109999979594827099999798969284981009998989593
15908886828067589090878782776989909088878477
20797474686854468078737468635777807776757262
Table 2. Probability of similarity when the population difference between reference and test products is 2.5%. Number of batches and inter-batch variability are depicted in the left margin and number of replicates and intra-batch variability on the top of the table. In red are outlined the scenarios with a probability lower than 80%.
T/R = 97.5%
Number of Units
61224
Intra-Batch Variability (%)
02.557.510152002.557.510152002.557.5101520
Number of batches1Inter-batch variability (%)01001008959263110010099836017010010010098885216
2.5989278482231999587745214099979486754513
5837258371921837763523910082807164533410
7.56657432715216560493828716664544939268
105245322212105249373023615450423832216
15363222159103634262017413636292722146
20272416107002826181514312728232117103
20100100967246701001001009577326100100100100977238
2.5979384593760969792816426496979590815830
5605650332040576056443416359626056473219
7.53127271610203032292316922833302722159
10151515971016161613852151815131286
15556320065743205764432
20223220022311103321121
3010010010096824391001001001009775441001001001001009476
2.510010099917437101001001009892704110010010099978969
598949178643389895928881583598969492877761
7.588837965542988984807468483090868479736349
1078736754442578073696257382680757166625242
1560545138332066155524441271961575248453931
2048424029241544942413532221448443838343125
60100100100100987749100100100100100947810010010010010010096
2.51001001009994734410010010010010092771001001001001009892
510099989387674110099989796857099999999989486
7.5979692877859369794929089766297979494918578
10908883787153329187828381655491908887837668
15747265615340247572676663524176767372636054
20625852494231186258535450403363646058504742
120100100100100100958010010010010010010097100100100100100100100
2.5100100100100100937710010010010010010096100100100100100100100
51001001009998887410010010010010098911001001001001009997
7.510010099979483701009998989692869910099100999793
10979694928877649797969492877997969797959287
15888583797664548986848480766688878685838273
20787471686552457775717266635676767473727161
Table 3. Probability of similarity when the population difference between reference and test products is 5%. Number of batches and inter-batch variability are depicted in the left margin and number of replicates and intra-batch variability on the top of the table. In red are outlined the scenarios with a probability lower than 80%.
T/R = 95%
Number of Units
61224
Intra-Batch Variability (%)
02.557.510152002.557.510152002.557.5101520
Number of batches1Inter-batch variability (%)010099684219201001008959421211001009982633713
2.5937962382131948770554210194908071573511
576654932162076695746341017672645847299
7.56152392514106357443727806258484537257
104943312012205247362922605049403730207
15353022158103733252116503536282522155
20262416117102826191613302727222117114
201001007748306010010096725122410010010094784526
2.5847861422430838370564417382848071593920
5504642271620465045372813246514642372413
7.52625241510102627272116812728262318147
10141213861015141511951131613131075
15555320065744205754332
20233120032322103322111
3010010097785628910010010094794830100100100100957352
2.510098897152288100989485734931100999794856850
590857863502879285827265472992888480736048
7.580767057472678277726457422681787271645441
1072676250412467469645650362472686461554737
1558525038311945852494338261857534946423630
2046414129221444643393330201446443837343023
60100100100958352341001001001009674541001001001001009477
2.51001009888755533100100999692725410010010099988870
5979590817051329895918882685297979492887964
7.5898681746348329187808075625090908684787160
10817973675844308480747269564683838076716555
15706659544937246966626057453772696865585347
20595649463932185956525148372961595656474539
120100100100100967758100100100100100947810010010010010010096
2.5100100100999472531001001001009990761001001001001009992
5100999793867052100999898948572991009999989485
7.5969491867966529695929086786896959494918878
10918784817462509288868480736391888887848272
15817875716554458177757469645680787676747163
20716865625647407167666661565070706868666254
Publisher’s Note: MDPI stays neutral with regard to jurisdictional claims in published maps and institutional affiliations.

