Influence of High, Disperse API Load on Properties along the Fused-Layer Modeling Process Chain of Solid Dosage Forms


Abstract
: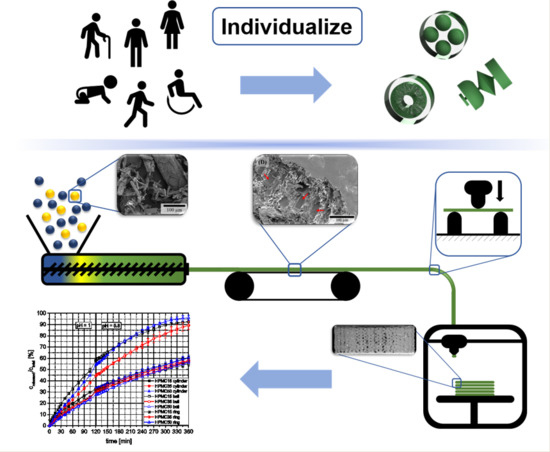
1. Introduction
2. Materials and Methods
2.1. Materials
2.2. Methods
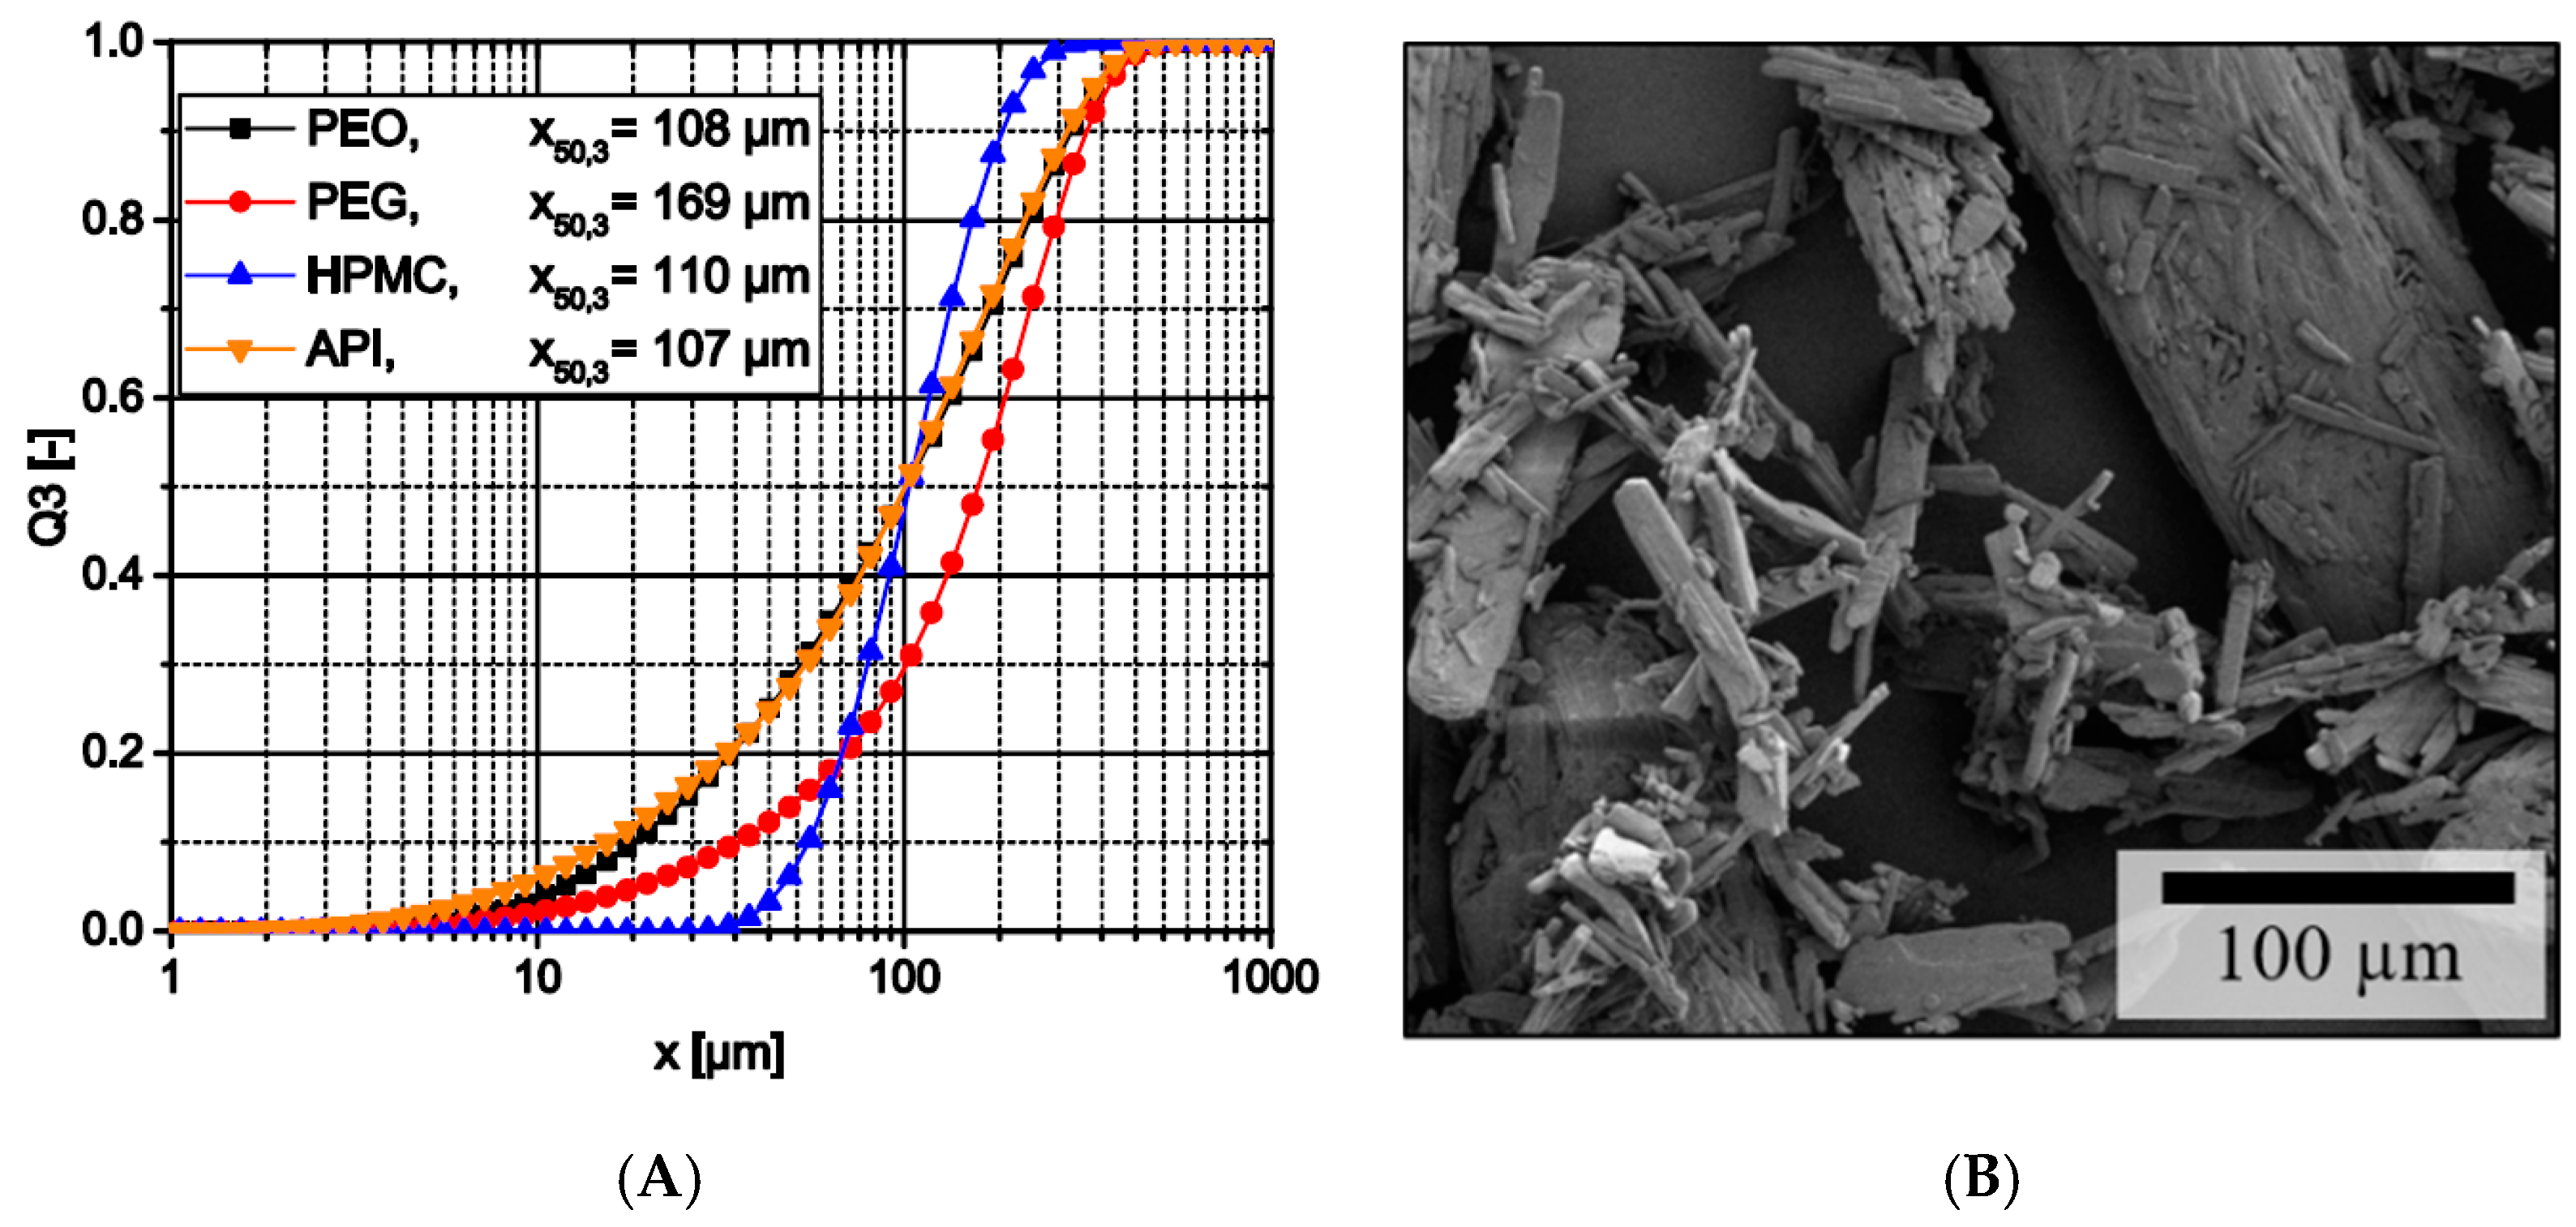
2.2.1. Analysis of Particle Size Distributions
2.2.2. Preparation of Theophylline-Loaded Filaments
2.2.3. Content Uniformity (CU) of Filaments and 3D Prints
2.2.4. He-Pycnometry
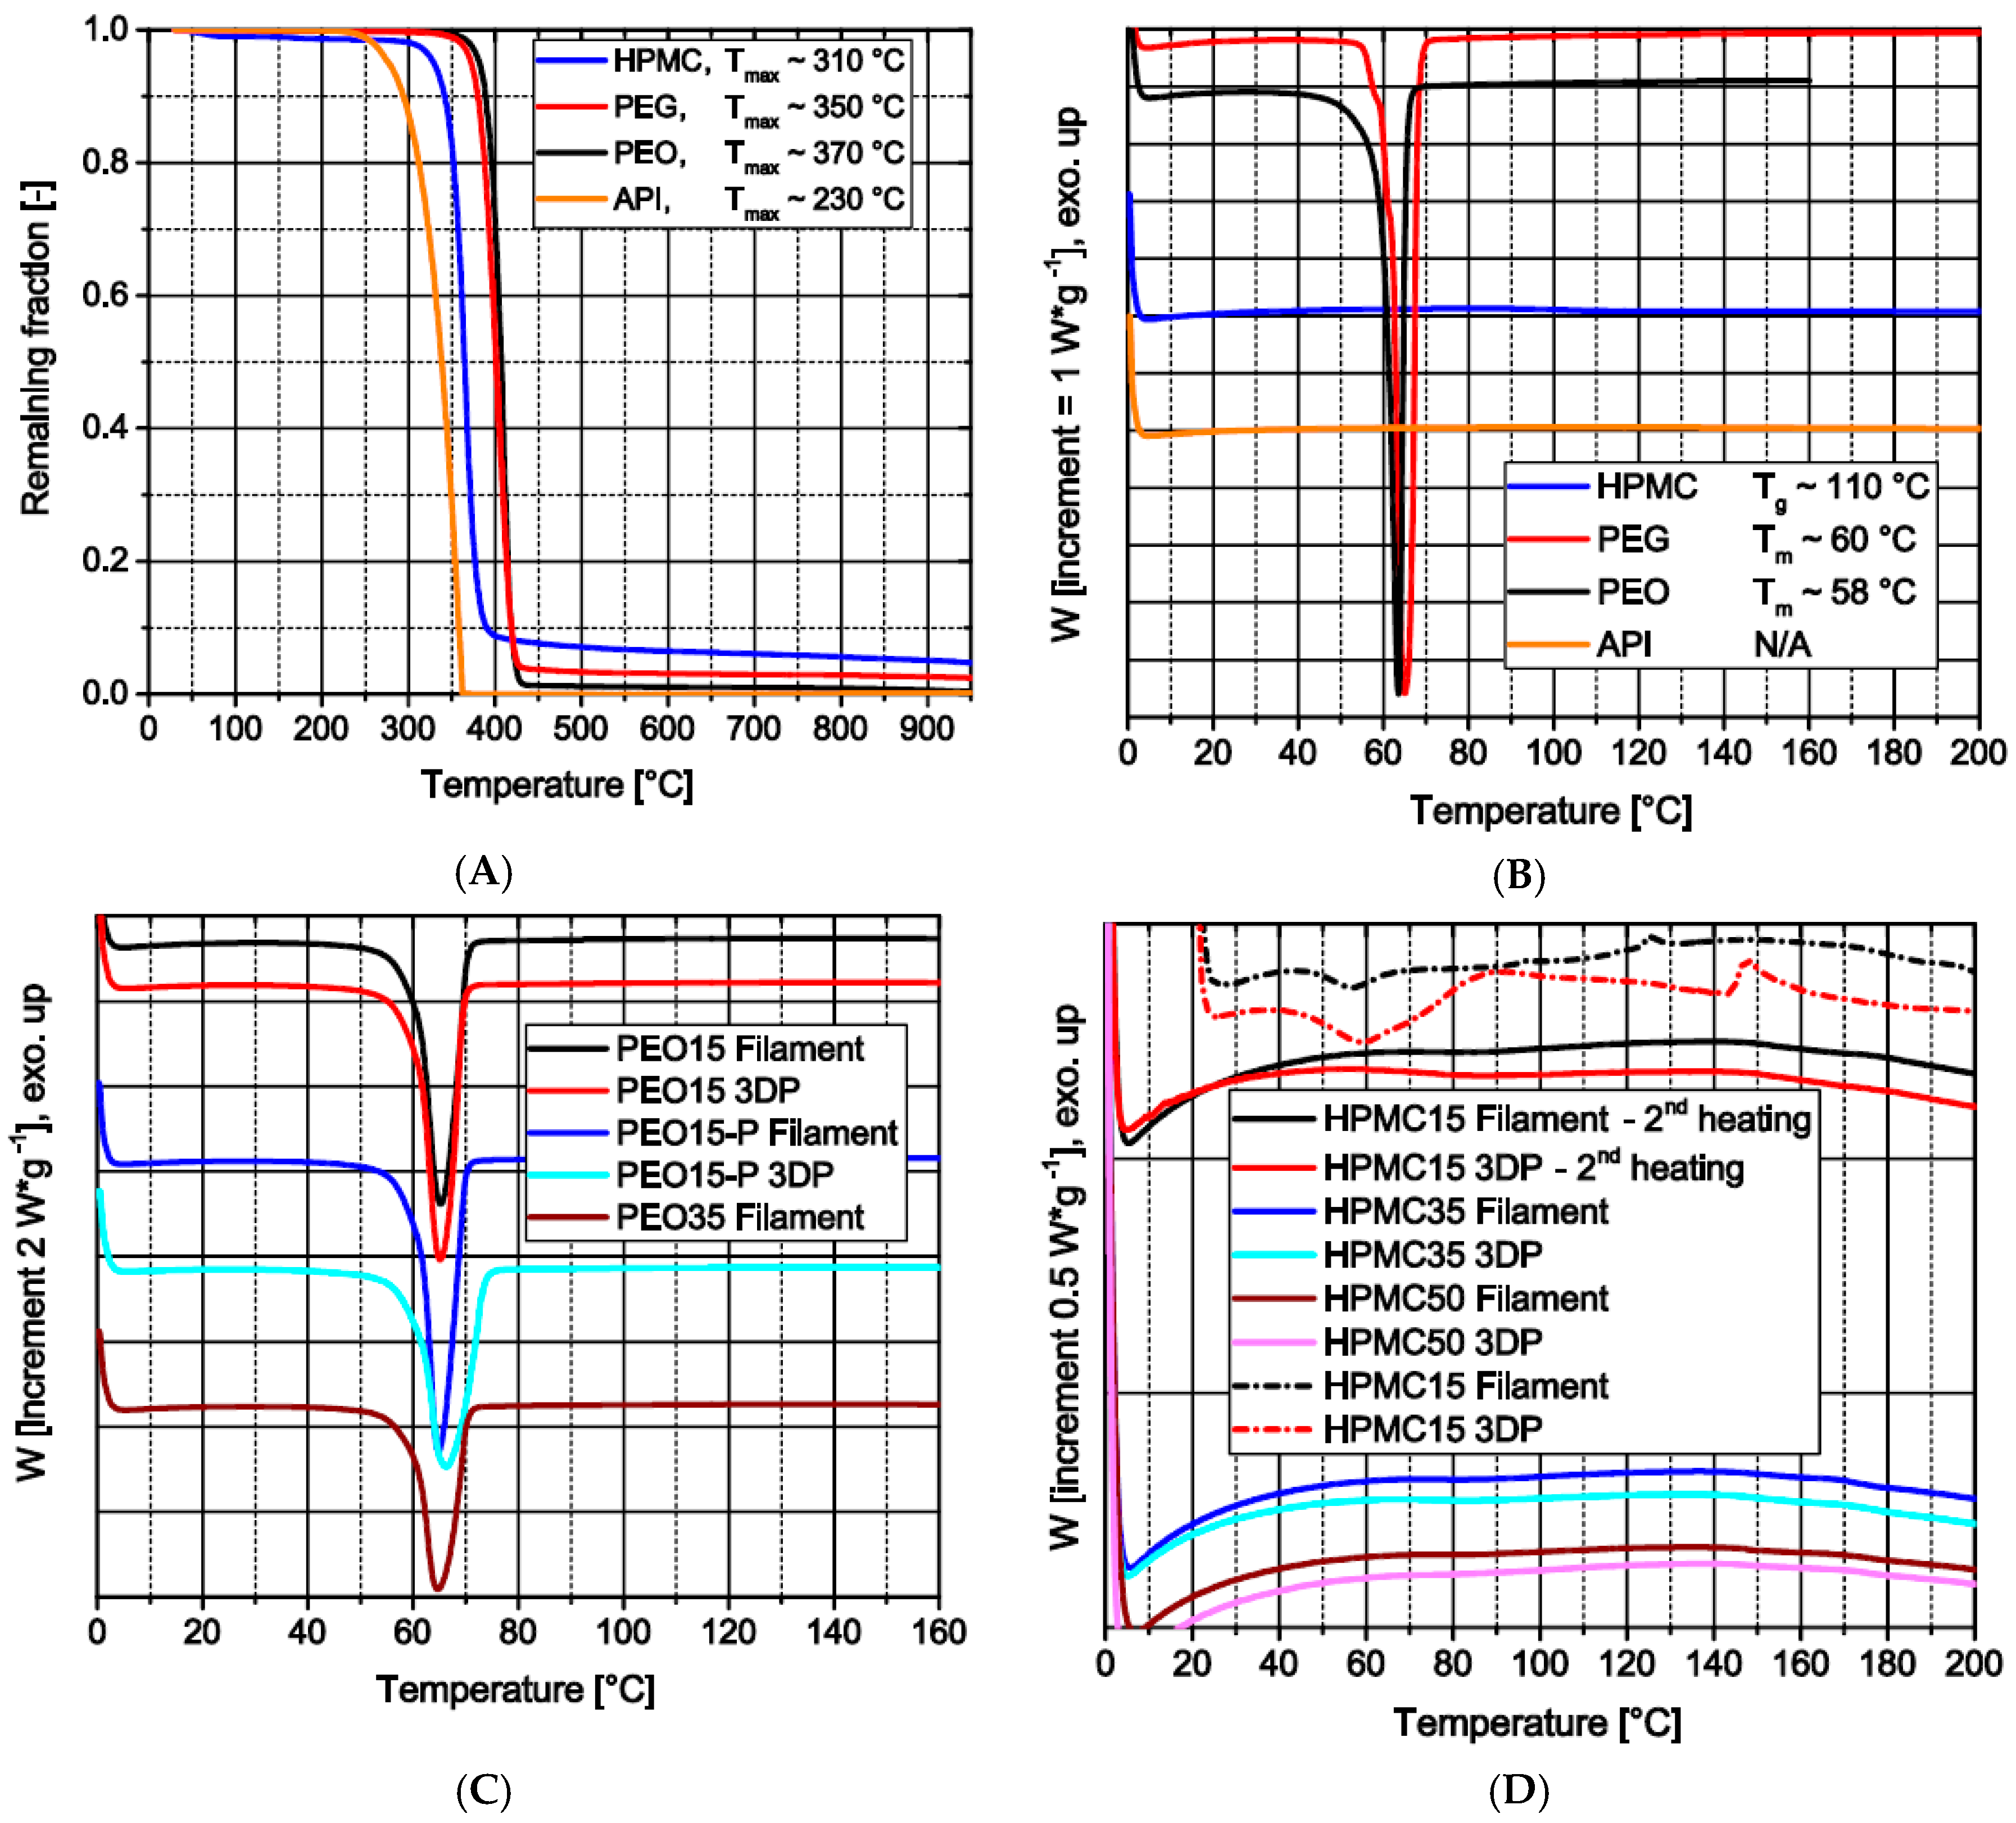
2.2.5. Differential Scanning Calorimetry (DSC) and Thermogravimetric Analysis (TGA)
2.2.6. Additive Manufacturing of Solid Dosage Forms
2.2.7. Oscillatory Rheology
2.2.8. Mechanical Testing (Three-Point Bending and Brazilian Test)
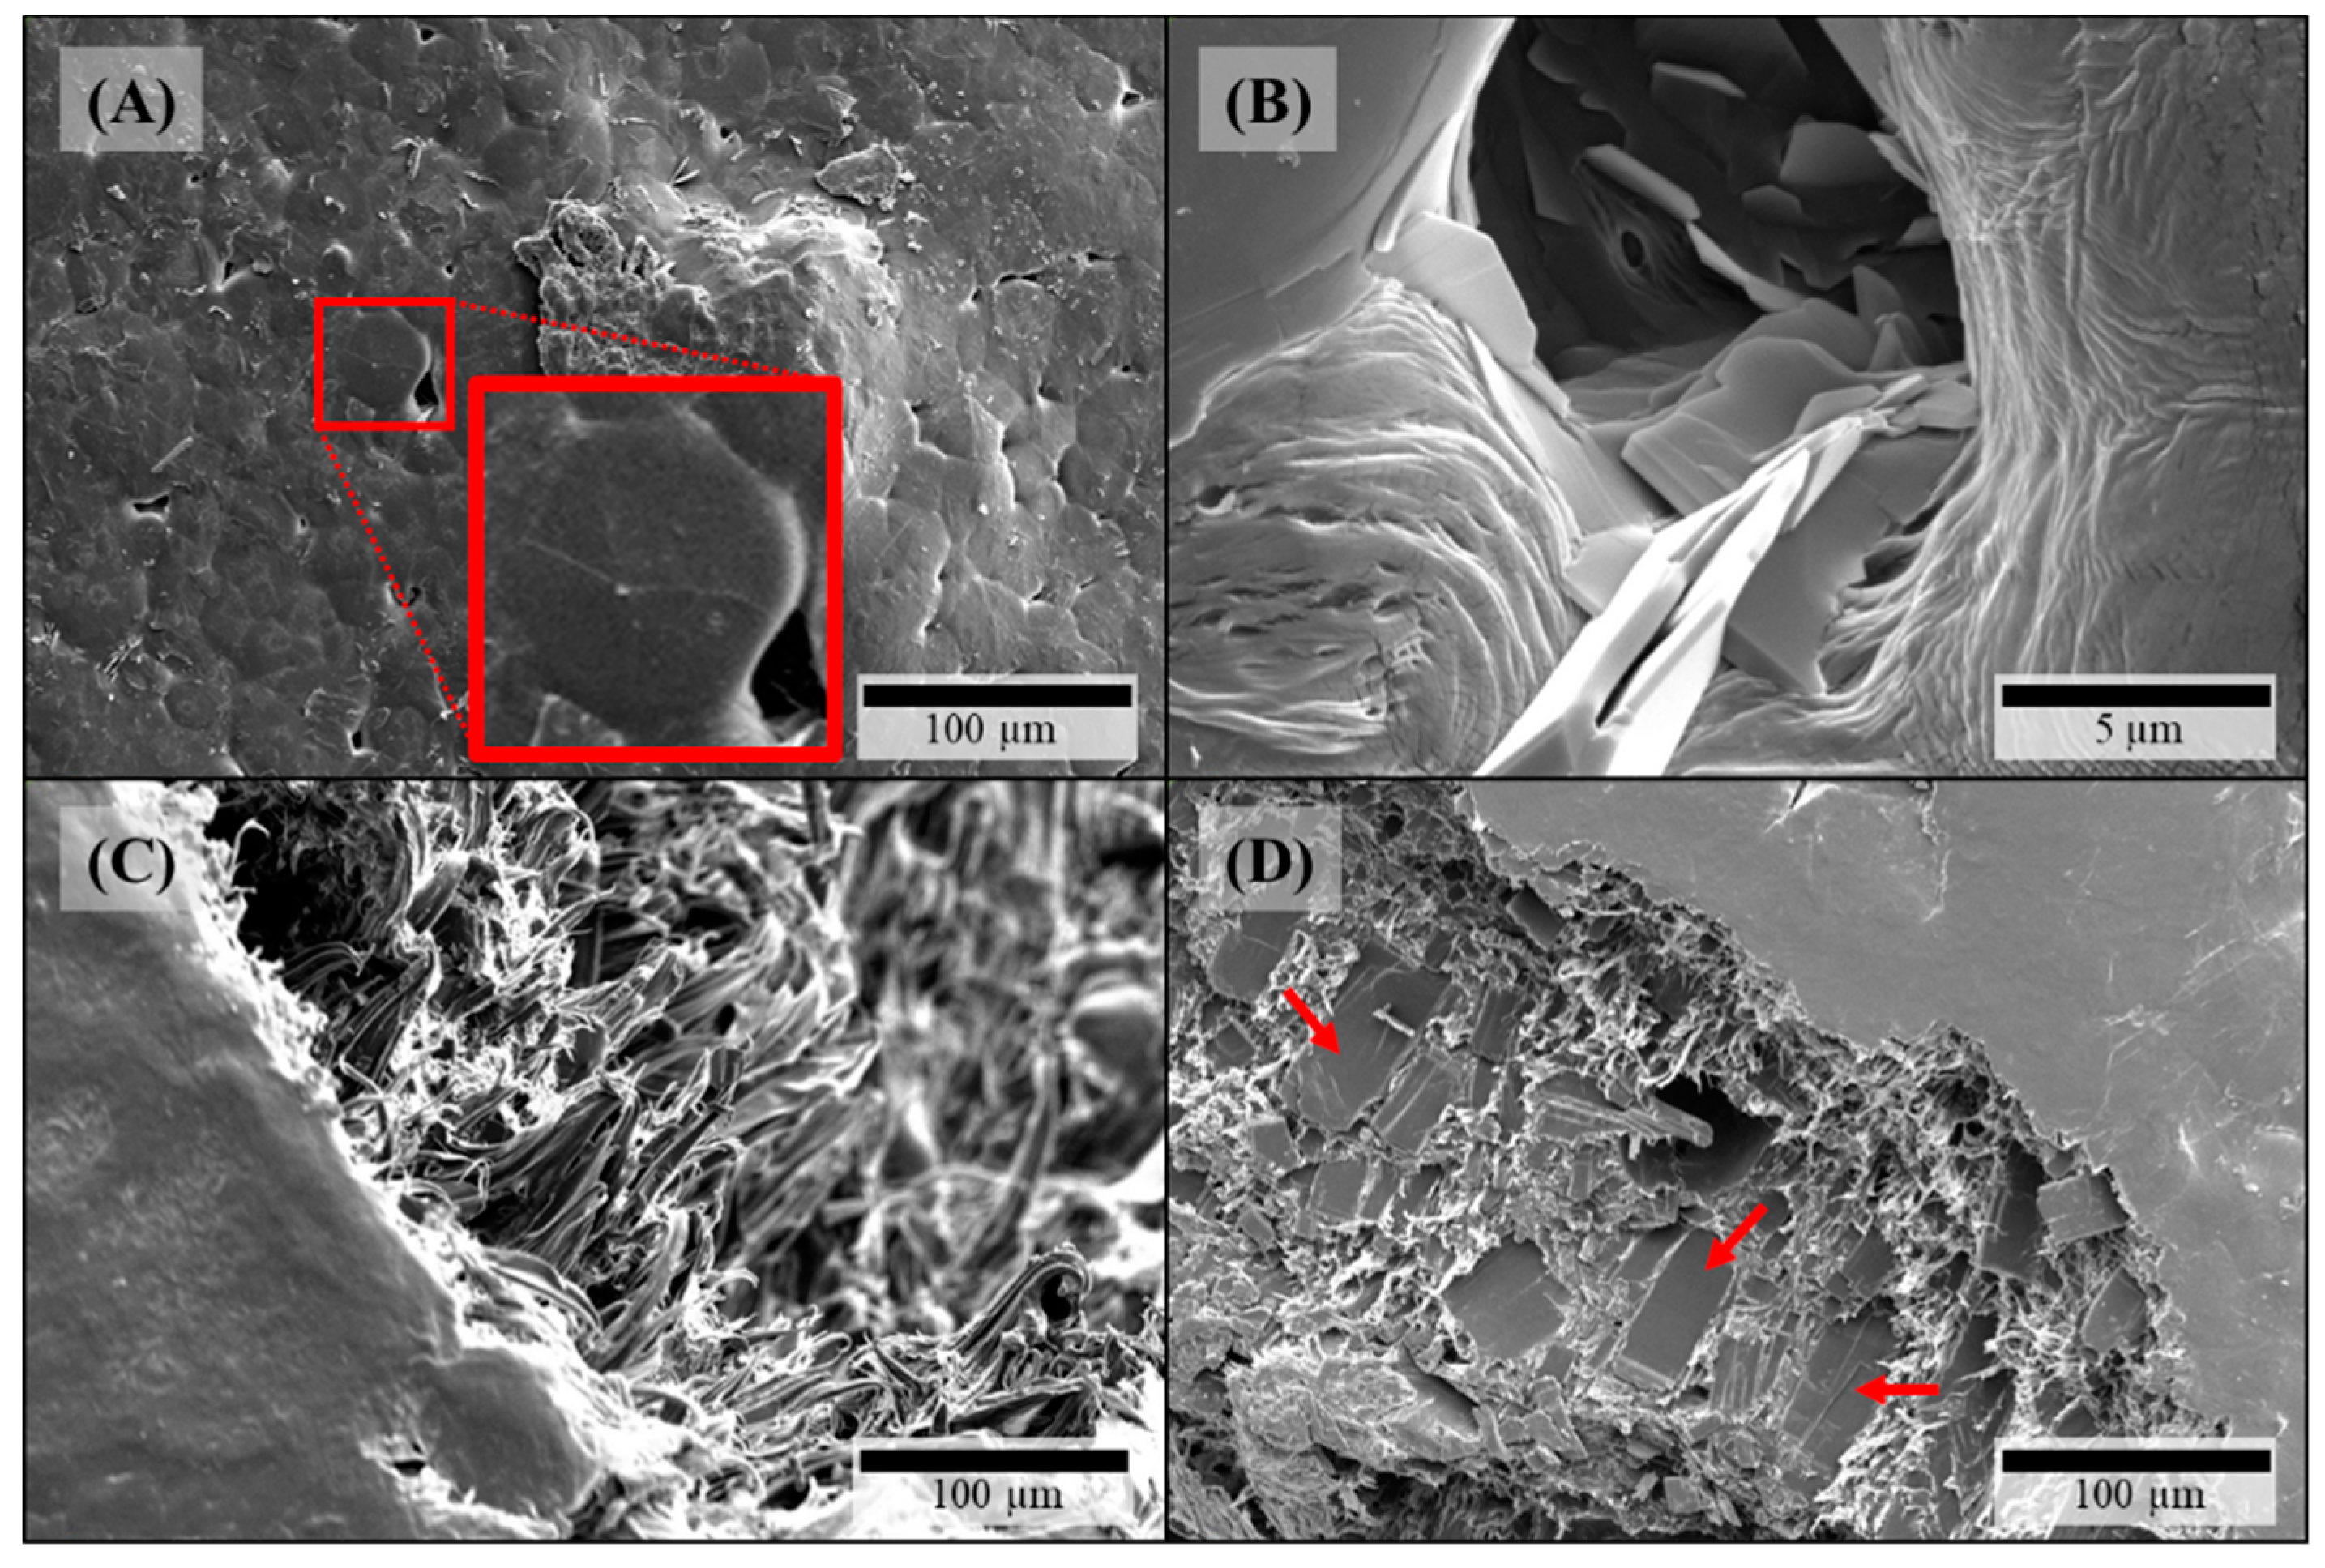
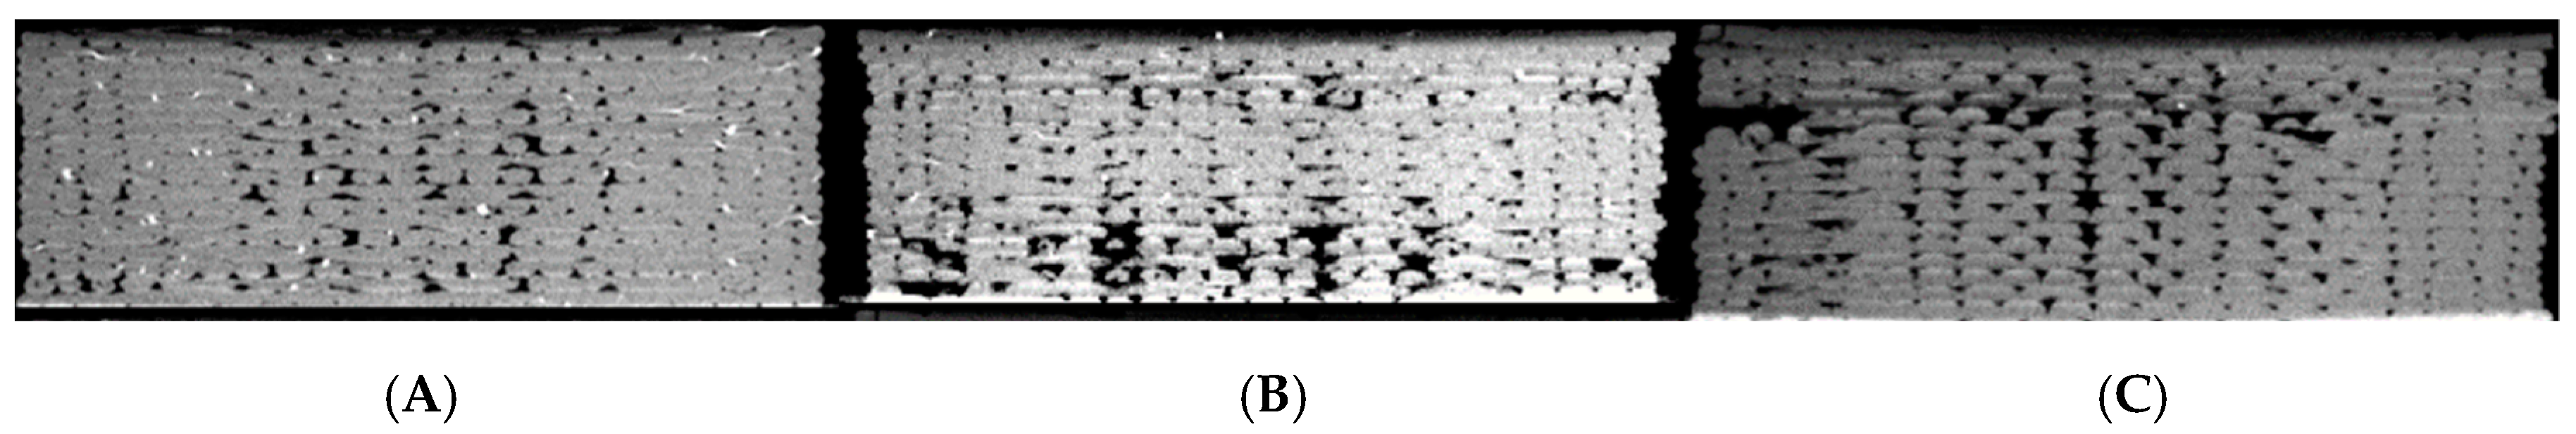
2.2.9. Microstructural Investigation via Micro-Computer Tomography (µCT) and SEM
2.2.10. Disintegration Behavior and Dissolution Testing of Dosage Forms
3. Results and Discussion
3.1. Filament Characteristics
3.1.1. Raw Material Particle Characteristics
3.1.2. Development of True Densities along the Process Chain
3.1.3. Microstructure of Filaments
3.1.4. Thermal Analysis along the Process Chain
3.1.5. Theophylline Content and Distribution in Filaments
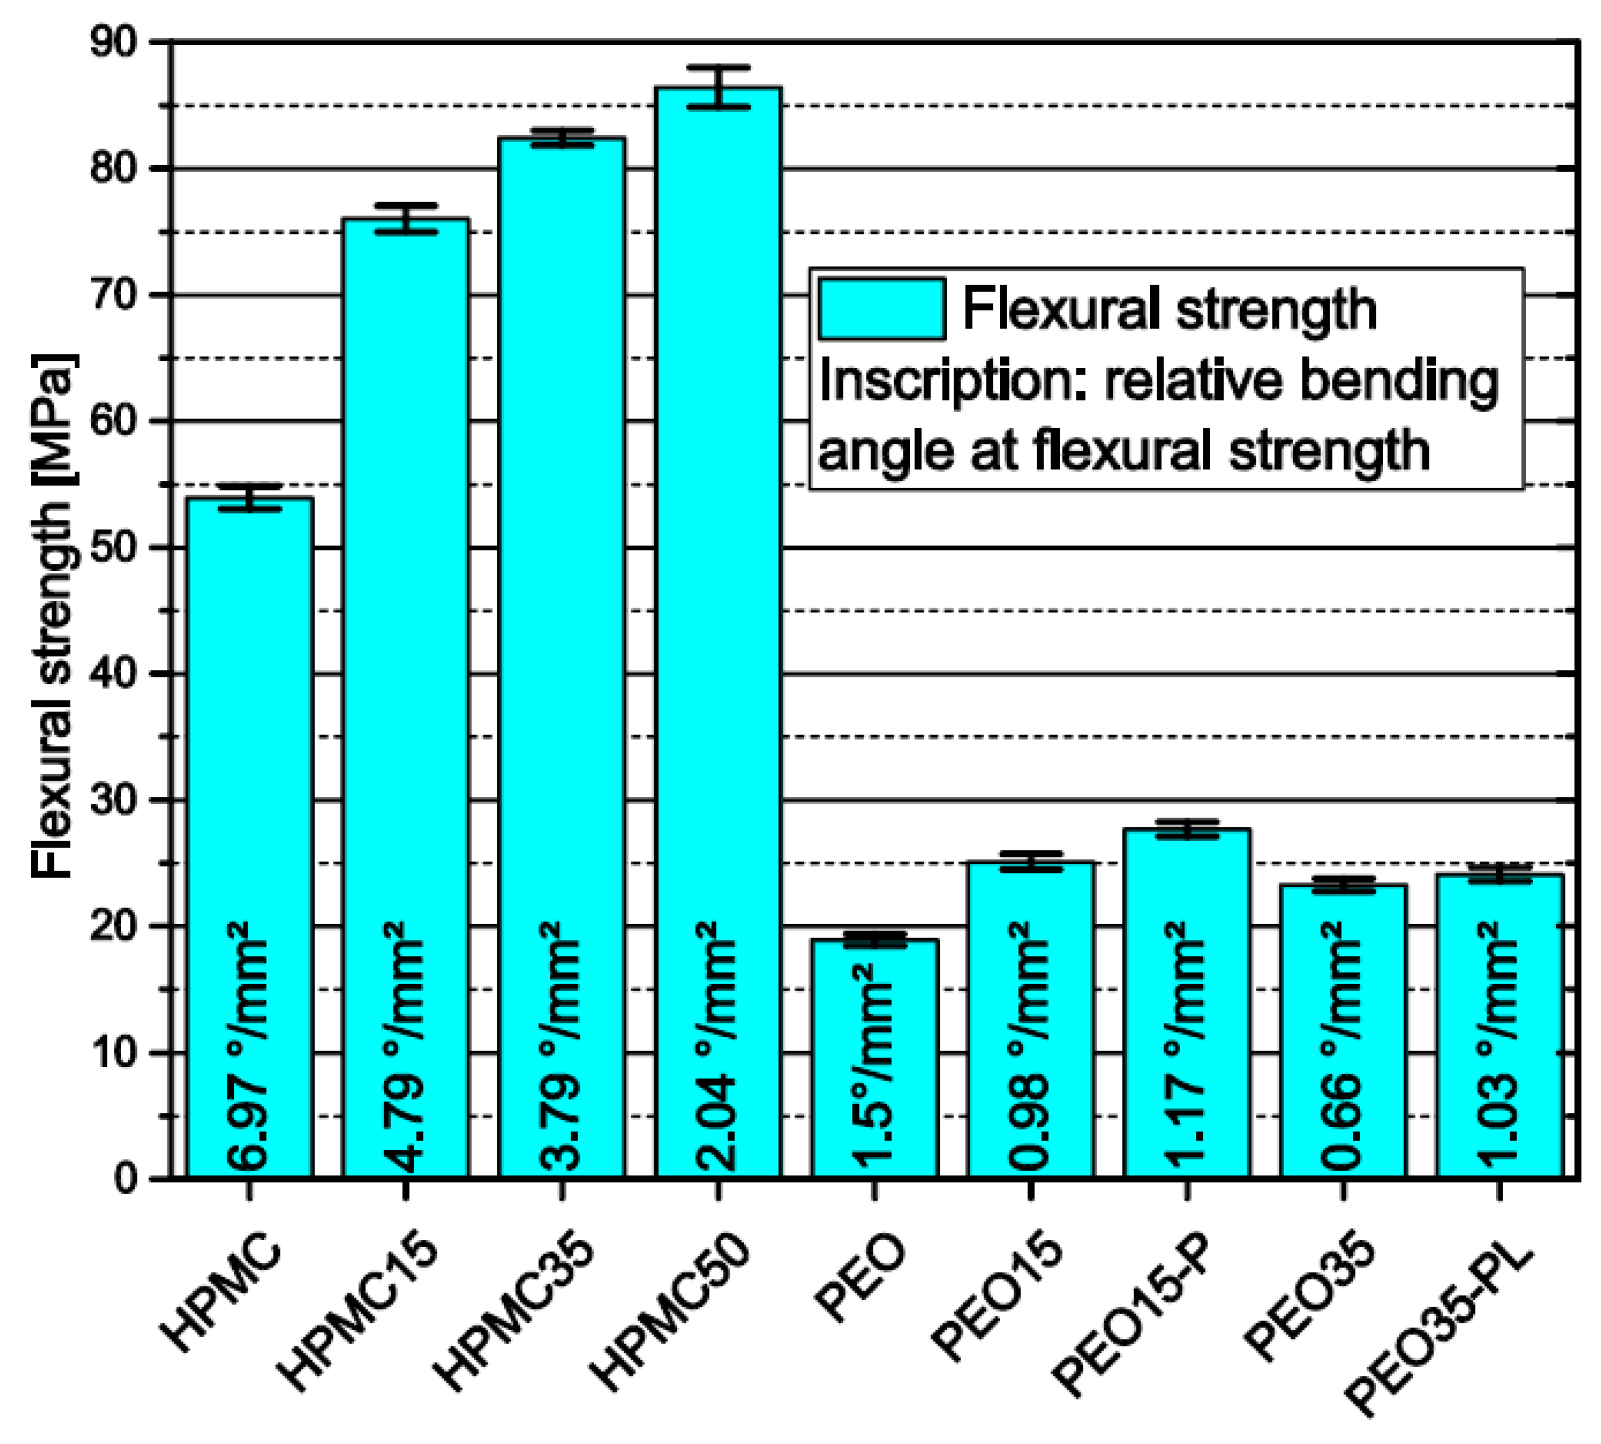
3.1.6. Influence of Polymer Matrix and Theophylline Load on Flexural Strength of Filaments
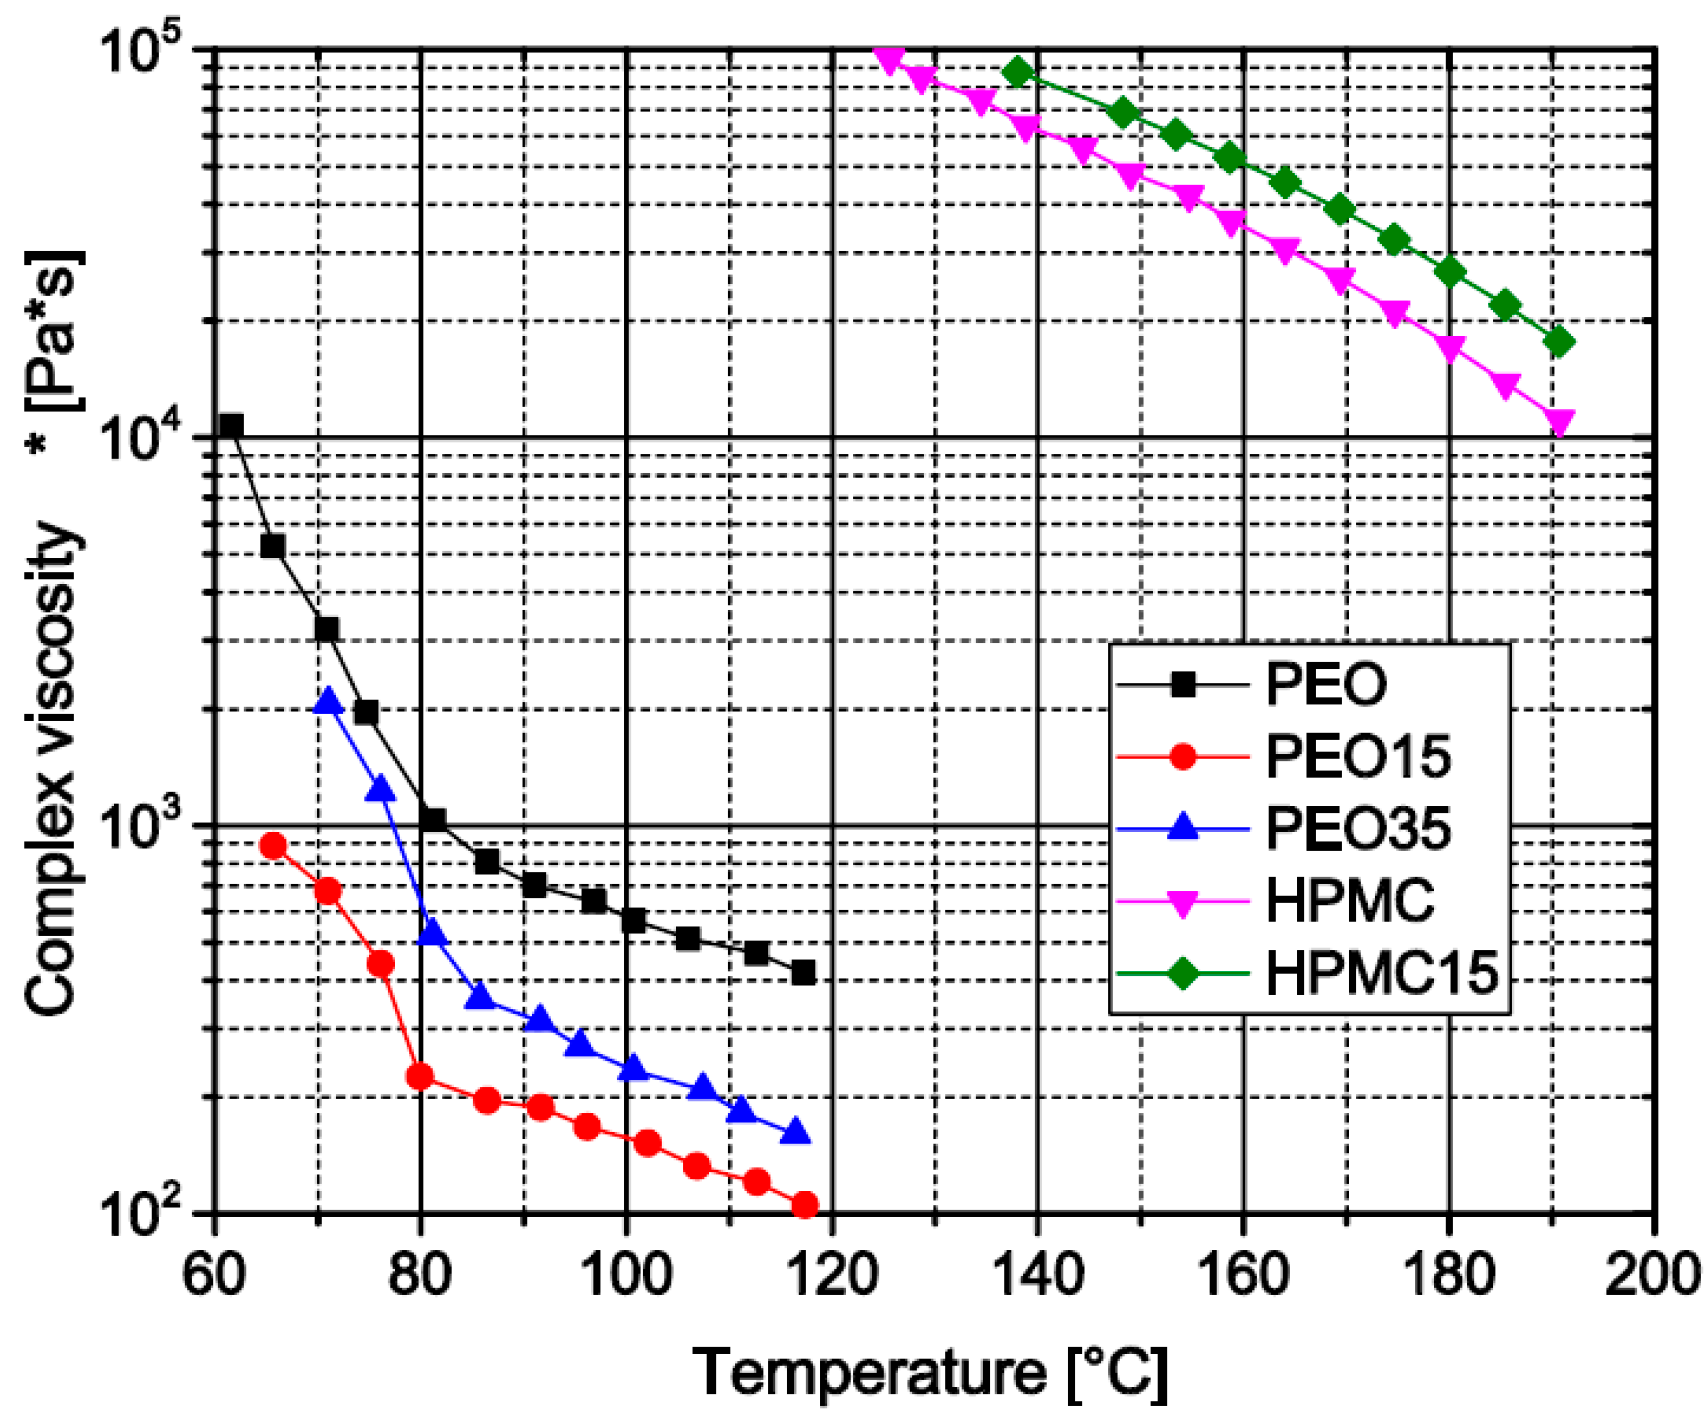
3.1.7. Influence of Theophylline Load on Melt Viscosity of Prepared Filament Formulations
3.2. Characteristics of 3D-Printed Dosage Forms
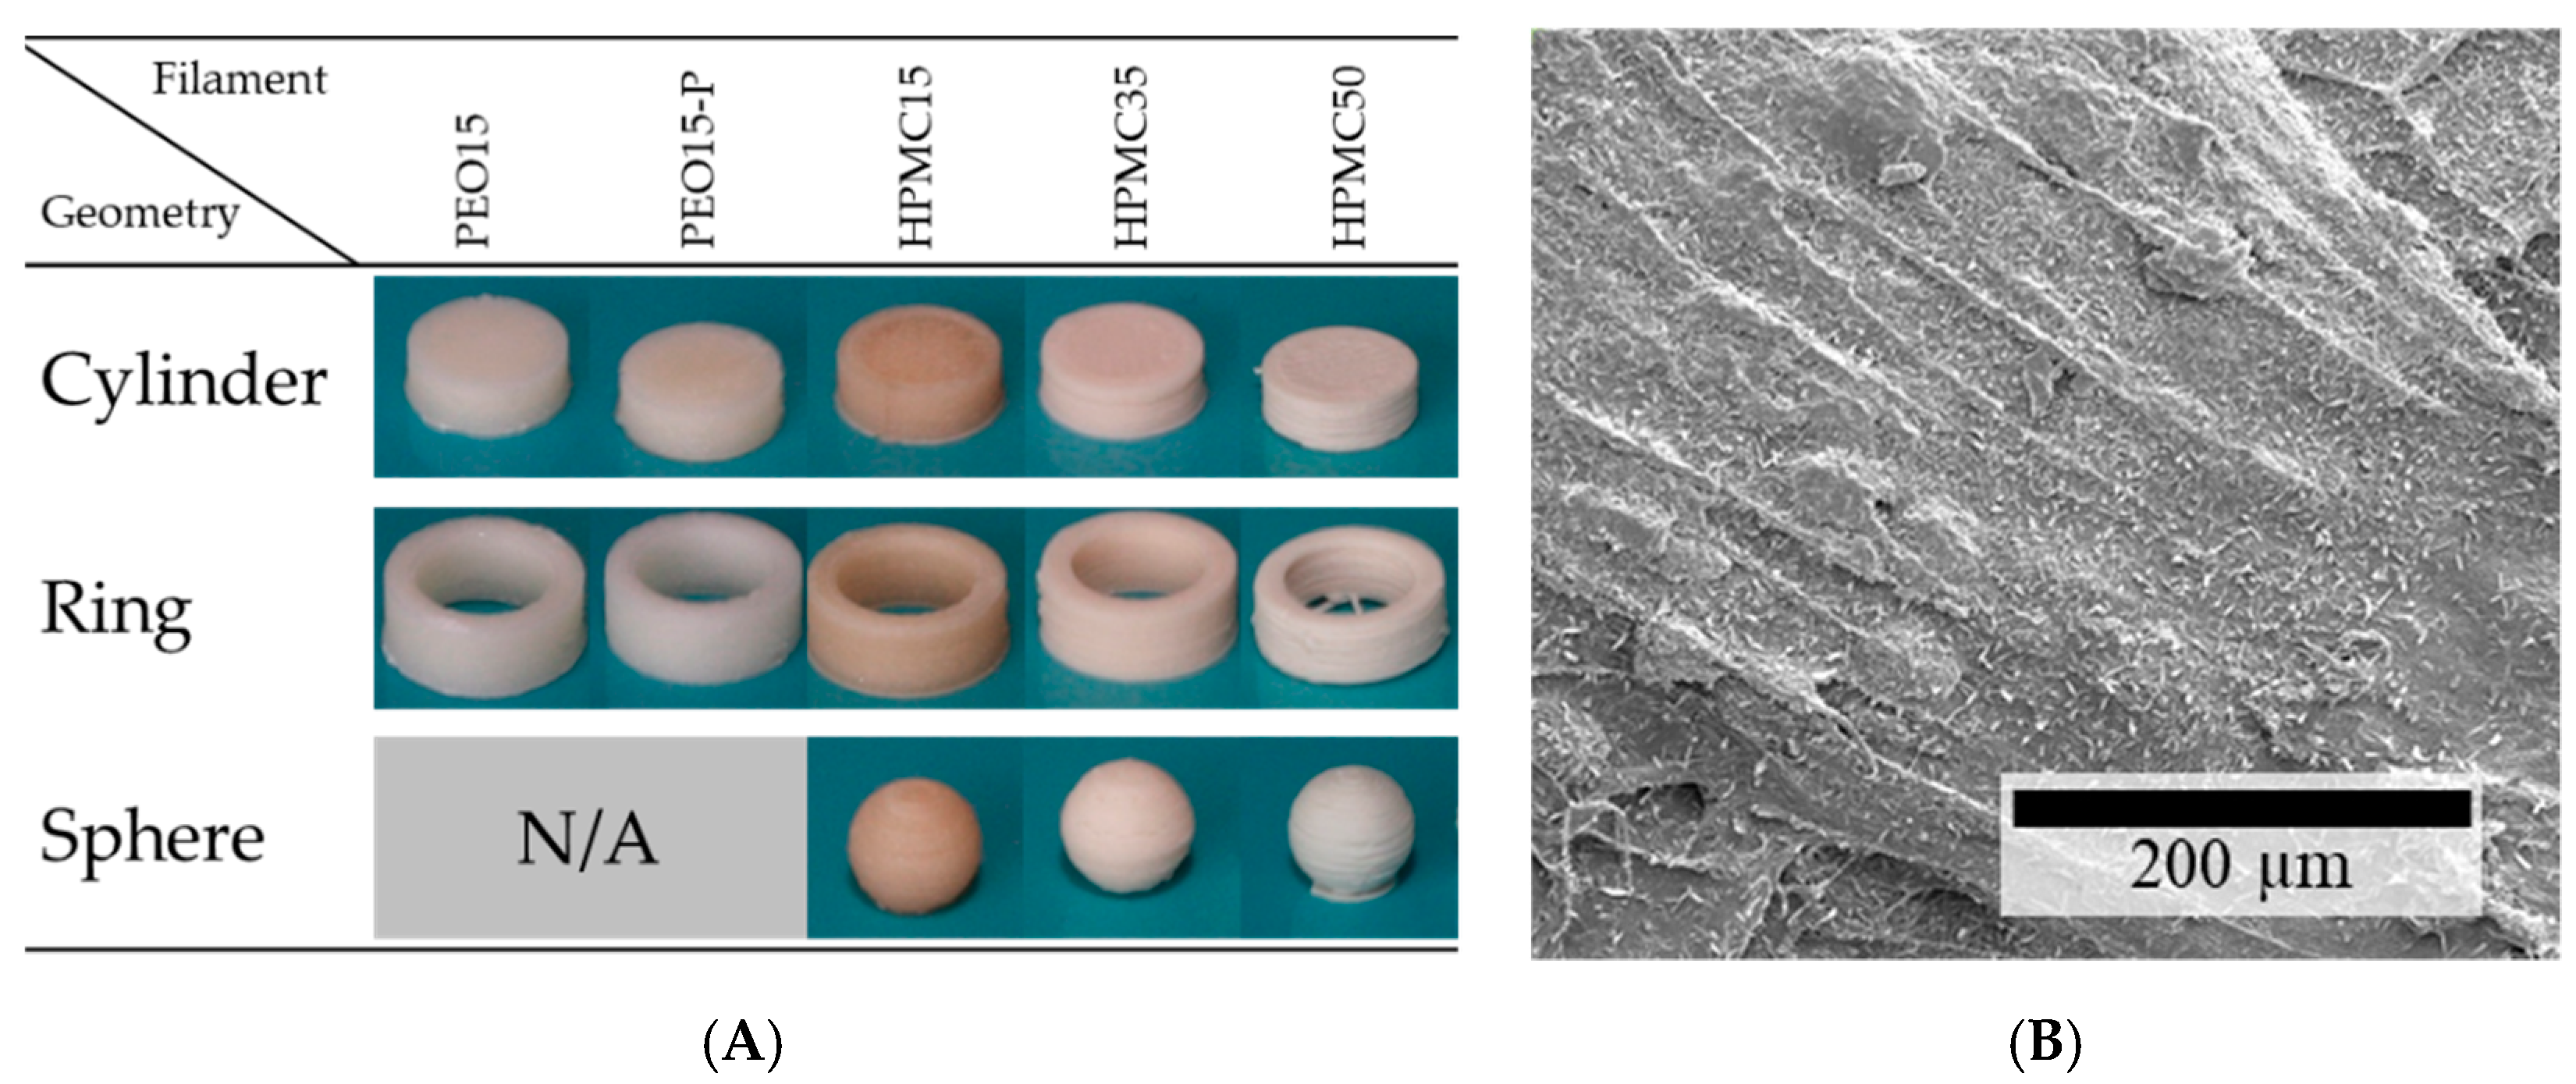
3.2.1. Feasibility of the Additive Production of Dosage Forms and their Mass and Content Uniformity
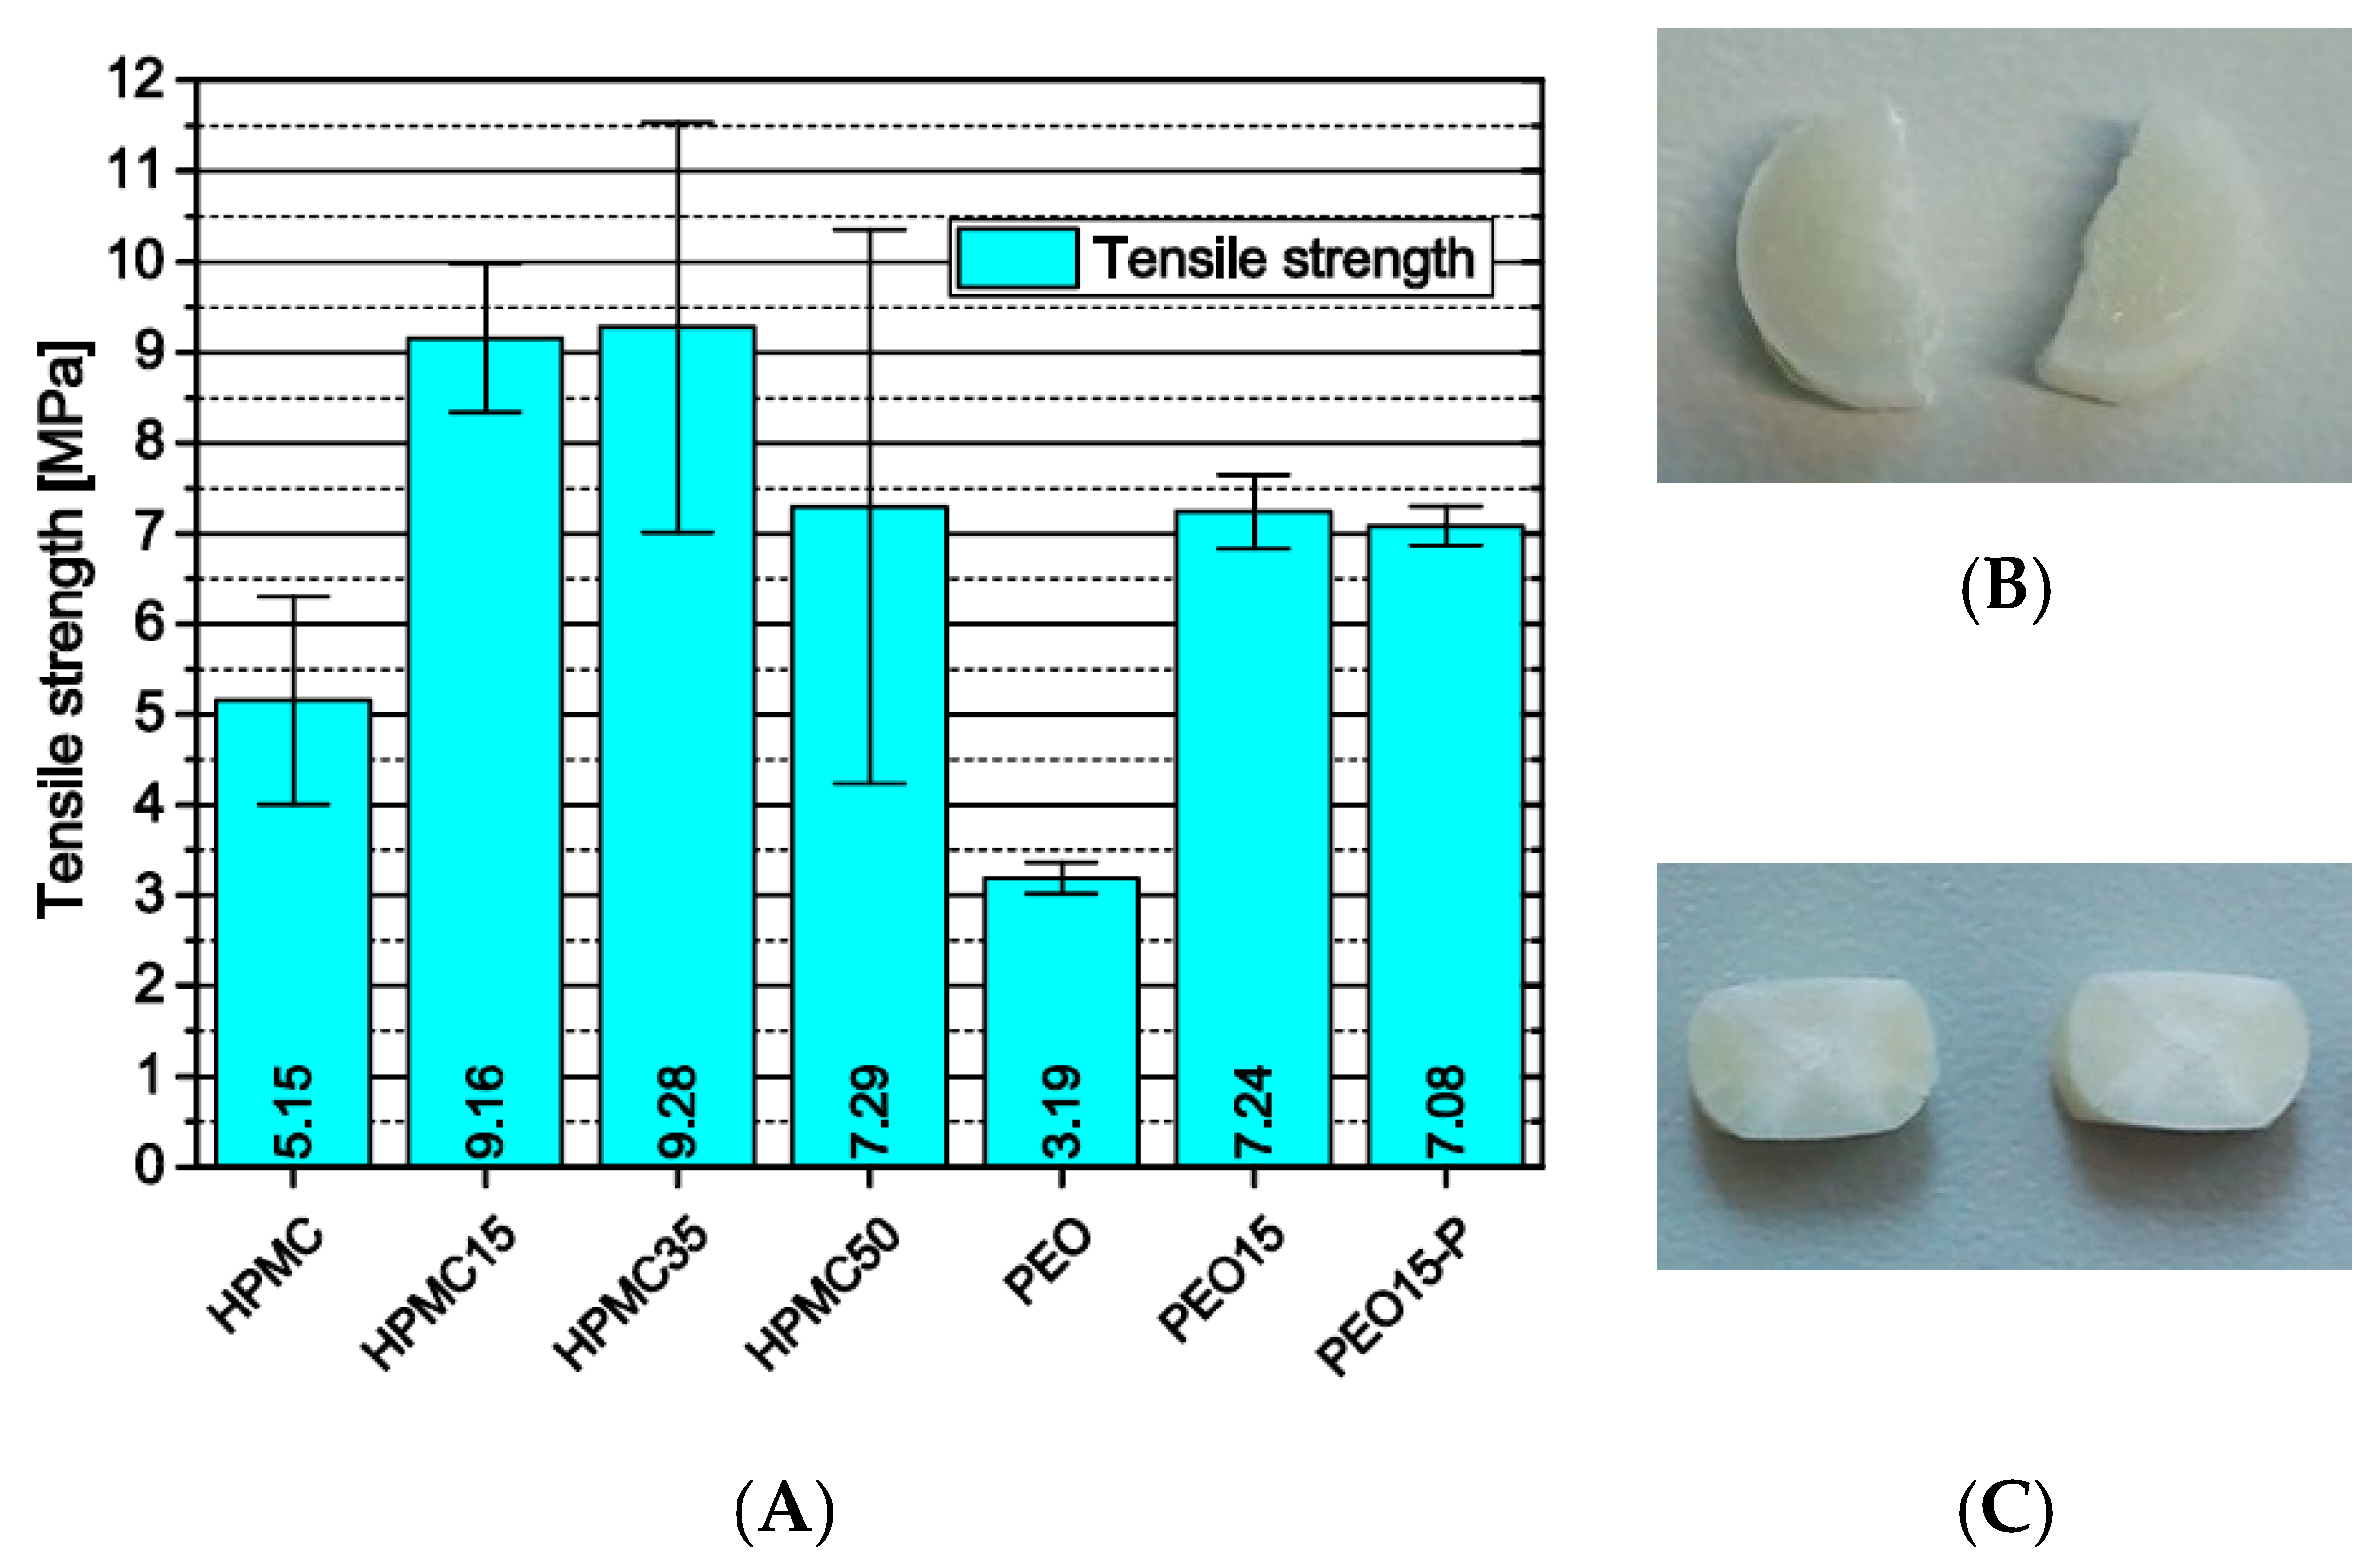
3.2.2. Influence of Formulation and Production on the Tensile Strength of 3D-Printed Cylinders
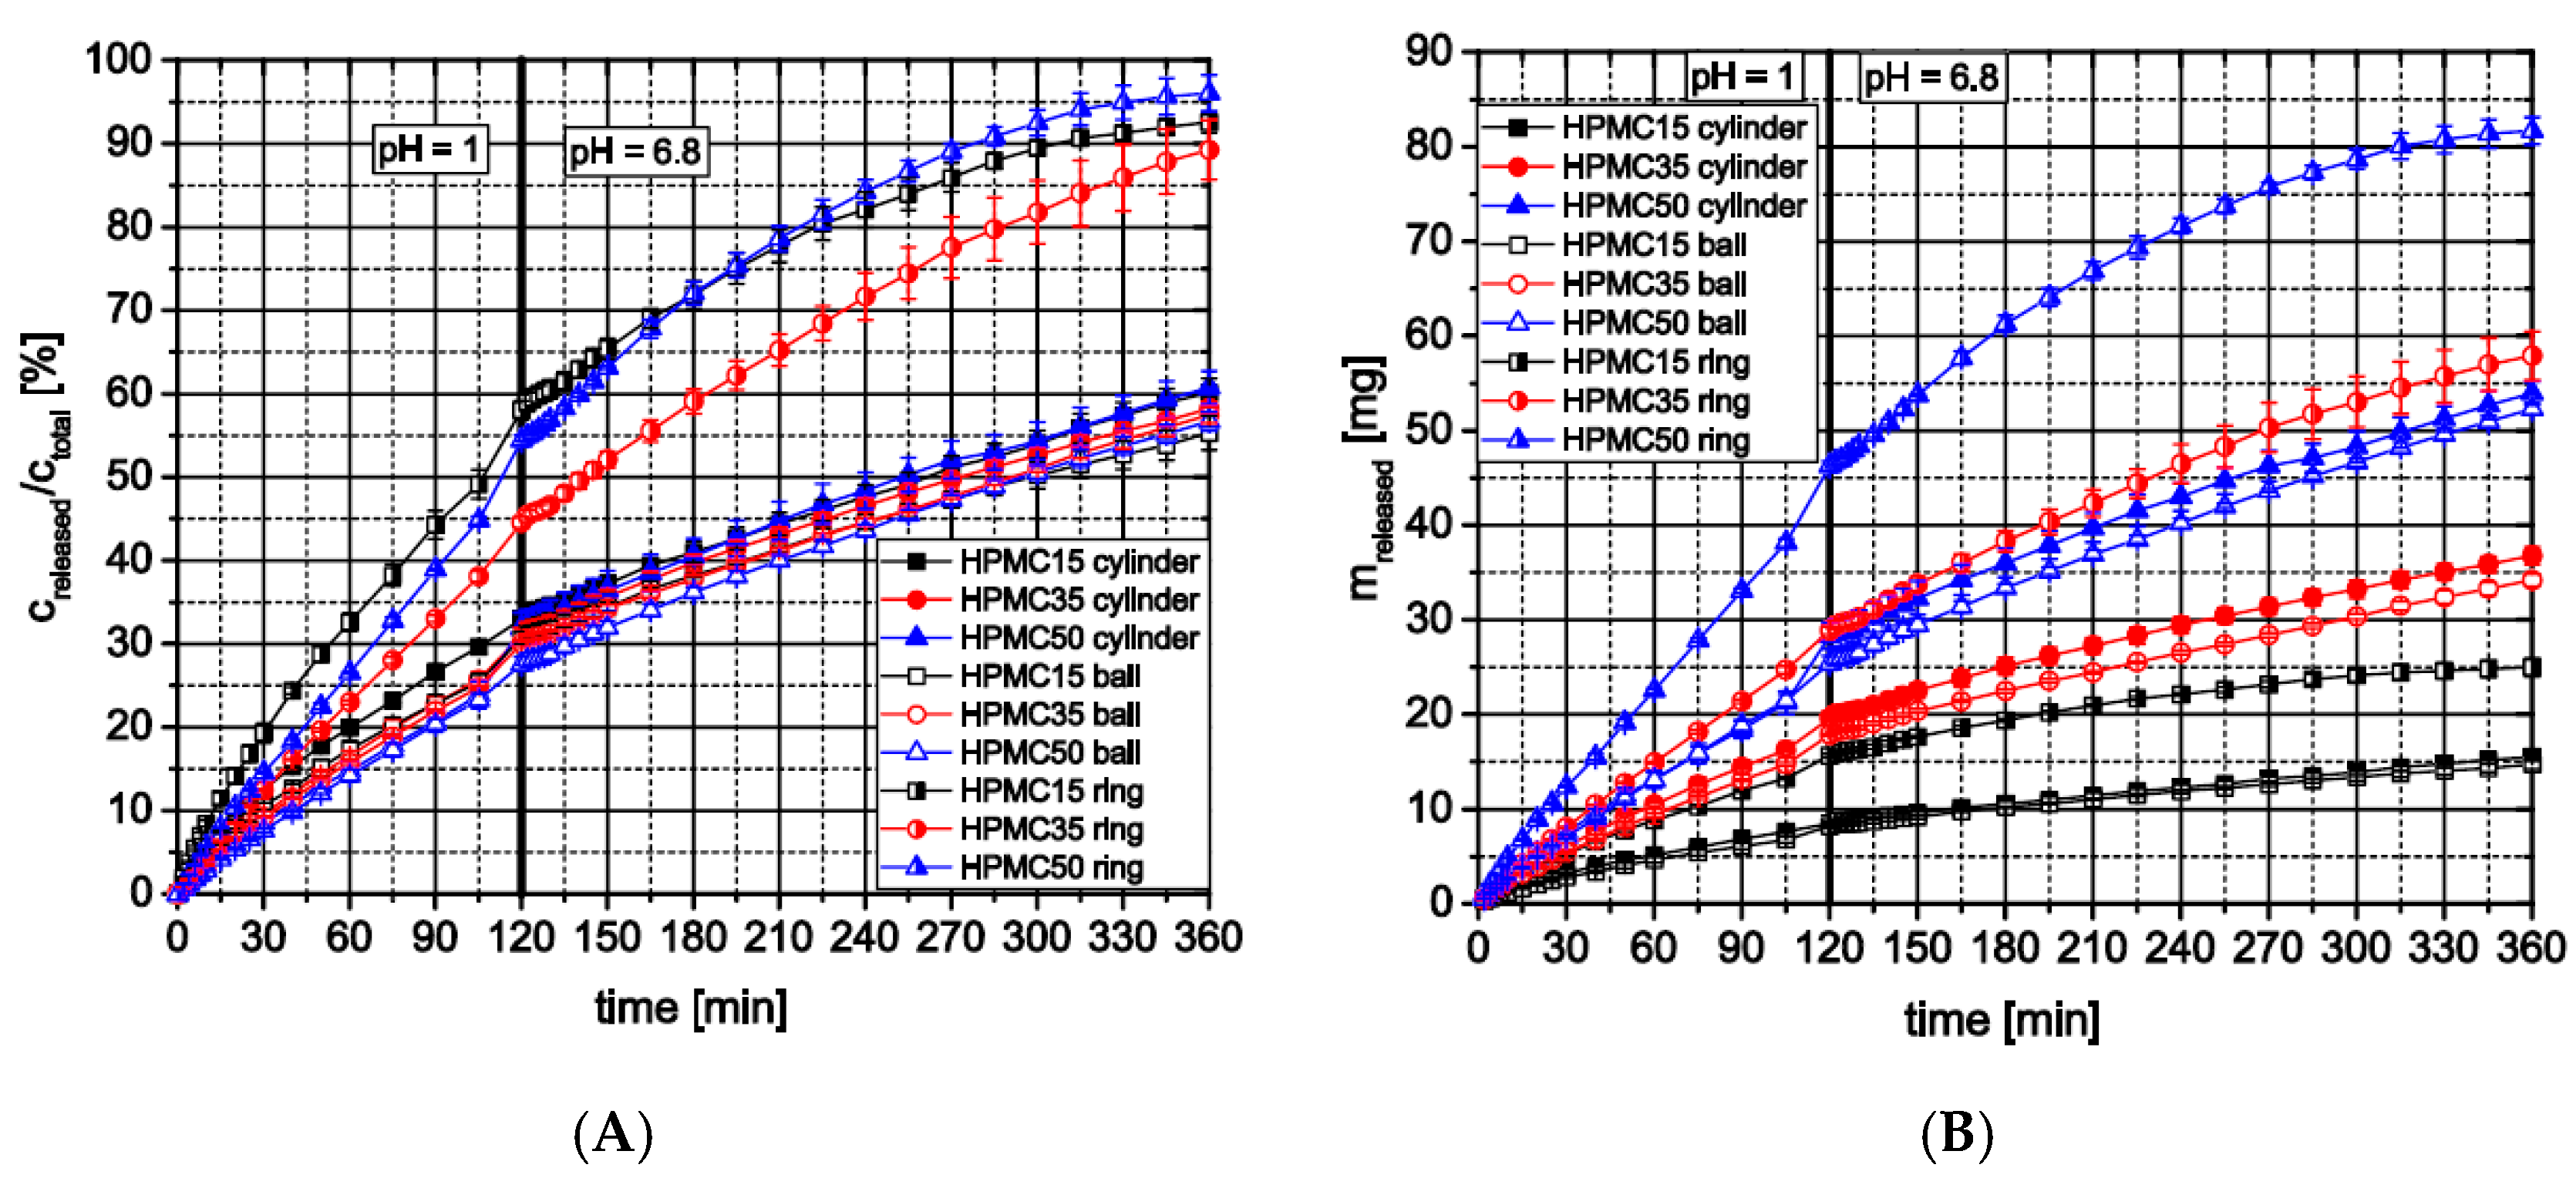
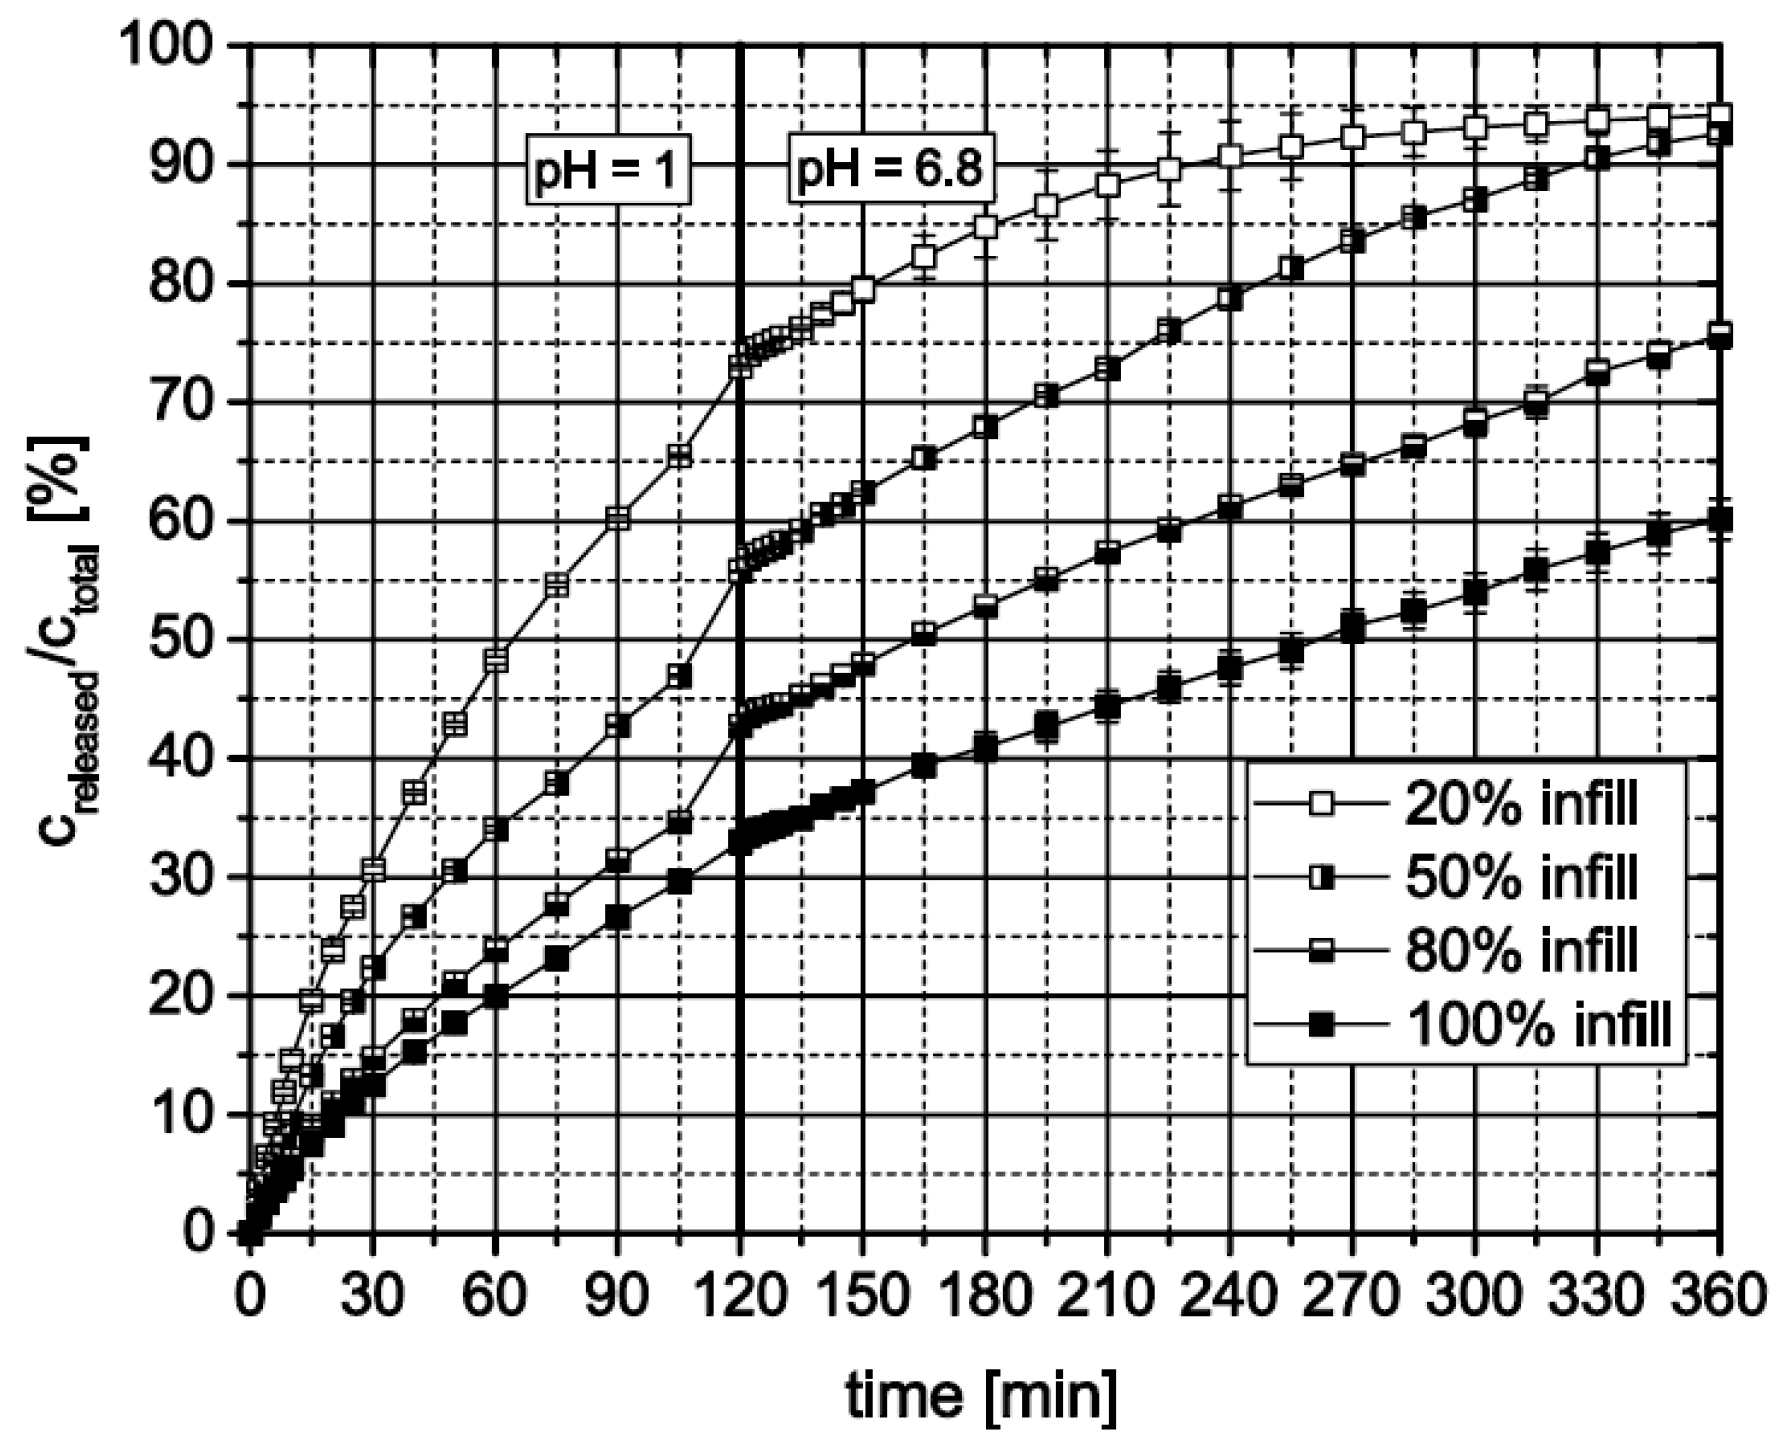
3.2.3. Influence of Formulation and Geometry on Dissolution Profiles and Release Kinetics
4. Conclusions
Supplementary Materials
Author Contributions
Funding
Acknowledgments
Conflicts of Interest
References
- Hsiao, W.-K.; Lorber, B.; Reitsamer, H.; Khinast, J. 3D printing of oral drugs: A new reality or hype? Expert Opin. Drug Deliv. 2018, 15, 1–4. [Google Scholar] [CrossRef]
- Norman, J.; Madurawe, R.D.; Moore, C.M.V.; Khan, M.A.; Khairuzzaman, A. A new chapter in pharmaceutical manufacturing: 3D-printed drug products. Adv. Drug Deliv. Rev. 2017, 108, 39–50. [Google Scholar] [CrossRef] [PubMed]
- Verein Deutscher Ingenieure. Additive Fertigungsverfahren Grundlagen, Begriffe, Verfahrensbeschreibungen. VDI 3405; ICS 25.020 (VDI 3405); Beuth Verlag GmbH: Berlin, Germany, 2014. [Google Scholar]
- Spritam®. Available online: https://www.spritam.com (accessed on 10 November 2018).
- Fina, F.; Madla, C.M.; Goyanes, A.; Zhang, J.; Gaisford, S.; Basit, A.W. Fabricating 3D printed orally disintegrating printlets using selective laser sintering. Int. J. Pharm. 2018, 541, 101–107. [Google Scholar] [CrossRef] [PubMed]
- Fina, F.; Goyanes, A.; Madla, C.M.; Awad, A.; Trenfield, S.J.; Kuek, J.M.; Patel, P.; Gaisford, S.; Basit, A.W. 3D printing of drug-loaded gyroid lattices using selective laser sintering. Int. J. Pharm. 2018, 547, 44–52. [Google Scholar] [CrossRef]
- Khaled, S.A.; Burley, J.C.; Alexander, M.R.; Roberts, C.J. Desktop 3D printing of controlled release pharmaceutical bilayer tablets. Int. J. Pharm. 2014, 461, 105–111. [Google Scholar] [CrossRef] [Green Version]
- Khaled, S.A.; Burley, J.C.; Alexander, M.R.; Yang, J.; Roberts, C.J. 3D printing of tablets containing multiple drugs with defined release profiles. Int. J. Pharm. 2015, 494, 643–650. [Google Scholar] [CrossRef] [PubMed]
- Khaled, S.A.; Burley, J.C.; Alexander, M.R.; Yang, J.; Roberts, C.J. 3D printing of five-in-one dose combination polypill with defined immediate and sustained release profiles. J. Control. Release 2015, 217, 308–314. [Google Scholar] [CrossRef] [Green Version]
- Shor, L.; Güçeri, S.; Chang, R.; Gordon, J.; Kang, Q.; Hartsock, L.; An, Y.; Sun, W. Precision extruding deposition (PED) fabrication of polycaprolactone (PCL) scaffolds for bone tissue engineering. Biofabrication 2009, 1, 15003. [Google Scholar] [CrossRef] [PubMed]
- Lee, S.-H.; Cho, Y.S.; Hong, M.W.; Lee, B.-K.; Park, Y.; Park, S.-H.; Kim, Y.Y.; Cho, Y.-S. Mechanical properties and cell-culture characteristics of a polycaprolactone kagome-structure scaffold fabricated by a precision extruding deposition system. Biomed. Mater. 2017, 12, 55003. [Google Scholar] [CrossRef] [Green Version]
- Goyanes, A.; Buanz, A.B.M.; Basit, A.W.; Gaisford, S. Fused-filament 3D printing (3DP) for fabrication of tablets. Int. J. Pharm. 2014, 476, 88–92. [Google Scholar] [CrossRef] [Green Version]
- Goyanes, A.; Buanz, A.B.M.; Hatton, G.B.; Gaisford, S.; Basit, A.W. 3D printing of modified-release aminosalicylate (4-ASA and 5-ASA) tablets. Eur. J. Pharm. Biopharm. 2015, 89, 157–162. [Google Scholar] [CrossRef] [PubMed] [Green Version]
- Almeida, A.; Claeys, B.; Remon, J.P.; Vervaet, C. Hot-melt Extrusion Developments in the Pharmaceutical Industry. In Hot-Melt Extrusion: Pharmaceutical Applications; Douroumis, D., Ed.; Wiley: Chichester, UK; West Sussex, UK, 2012; pp. 43–70. [Google Scholar]
- Crowley, M.M.; Zhang, F.; Repka, M.A.; Thumma, S.; Upadhye, S.B.; Battu, S.K.; McGinity, J.W.; Martin, C. Pharmaceutical applications of hot-melt extrusion: Part I. Drug Dev. Ind. Pharm. 2007, 33, 909–926. [Google Scholar] [CrossRef] [PubMed]
- Pirayavaraporn, C.; Rades, T.; Tucker, I.G. Determination of moisture content in relation to thermal behaviour and plasticization of Eudragit RLPO. Int. J. Pharm. 2012, 422, 68–74. [Google Scholar] [CrossRef] [PubMed]
- Crowley, M.M.; Zhang, F.; Koleng, J.J.; McGinity, J.W. Stability of polyethylene oxide in matrix tablets prepared by hot-melt extrusion. Biomaterials 2002, 23, 4241–4248. [Google Scholar] [CrossRef]
- Zhang, Y.; Luo, R.; Chen, Y.; Ke, X.; Hu, D.; Han, M. Application of carrier and plasticizer to improve the dissolution and bioavailability of poorly water-soluble baicalein by hot melt extrusion. AAPS Pharmscitech. 2014, 15, 560–568. [Google Scholar] [CrossRef] [PubMed]
- De Brabander, C.; van den Mooter, G.; Vervaet, C.; Remon, J.P. Characterization of ibuprofen as a nontraditional plasticizer of ethyl cellulose. J. Pharm. Sci. 2002, 91, 1678–1685. [Google Scholar] [CrossRef] [PubMed]
- Wu, C. Non-traditional plasticization of polymeric films. Int. J. Pharm. 1999, 177, 15–27. [Google Scholar] [CrossRef]
- Van Renterghem, J.; Vervaet, C.; de Beer, T. Rheological Characterization of Molten Polymer-Drug Dispersions as a Predictive Tool for Pharmaceutical Hot-Melt Extrusion Processability. Pharm. Res. 2017, 34, 2312–2321. [Google Scholar] [CrossRef]
- Yang, M.; Wang, P.; Suwardie, H.; Gogos, C. Determination of acetaminophen’s solubility in poly(ethylene oxide) by rheological, thermal and microscopic methods. Int. J. Pharm. 2011, 403, 83–89. [Google Scholar] [CrossRef]
- Goyanes, A.; Chang, H.; Sedough, D.; Hatton, G.B.; Wang, J.; Buanz, A.; Gaisford, S.; Basit, A.W. Fabrication of controlled-release budesonide tablets via desktop (FDM) 3D printing. Int. J. Pharm. 2015, 496, 414–420. [Google Scholar] [CrossRef] [Green Version]
- Melocchi, A.; Parietti, F.; Maroni, A.; Foppoli, A.; Gazzaniga, A.; Zema, L. Hot-melt extruded filaments based on pharmaceutical grade polymers for 3D printing by fused deposition modeling. Int. J. Pharm. 2016, 509, 255–263. [Google Scholar] [CrossRef] [PubMed]
- Alhijjaj, M.; Belton, P.; Qi, S. An investigation into the use of polymer blends to improve the printability of and regulate drug release from pharmaceutical solid dispersions prepared via fused deposition modeling (FDM) 3D printing. Eur. J. Pharm. Biopharm. 2016, 108, 111–125. [Google Scholar] [CrossRef] [PubMed] [Green Version]
- Goyanes, A.; Robles Martinez, P.; Buanz, A.; Basit, A.W.; Gaisford, S. Effect of geometry on drug release from 3D printed tablets. Int. J. Pharm. 2015, 494, 657–663. [Google Scholar] [CrossRef] [PubMed] [Green Version]
- Kempin, W.; Domsta, V.; Grathoff, G.; Brecht, I.; Semmling, B.; Tillmann, S.; Weitschies, W.; Seidlitz, A. Immediate Release 3D-Printed Tablets Produced Via Fused Deposition Modeling of a Thermo-Sensitive Drug. Pharm. Res. 2018, 35, 124. [Google Scholar] [CrossRef] [PubMed]
- Boetker, J.; Water, J.J.; Aho, J.; Arnfast, L.; Bohr, A.; Rantanen, J. Modifying release characteristics from 3D printed drug-eluting products. Eur. J. Pharm. Sci. 2016, 90, 47–52. [Google Scholar] [CrossRef]
- Genina, N.; Holländer, J.; Jukarainen, H.; Mäkilä, E.; Salonen, J.; Sandler, N. Ethylene vinyl acetate (EVA) as a new drug carrier for 3D printed medical drug delivery devices. Eur. J. Pharm. Sci. 2016, 90, 53–63. [Google Scholar] [CrossRef]
- Zhang, J.; Feng, X.; Patil, H.; Tiwari, R.V.; Repka, M.A. Coupling 3D printing with hot-melt extrusion to produce controlled-release tablets. Int. J. Pharm. 2017, 519, 186–197. [Google Scholar] [CrossRef] [PubMed]
- Verstraete, G.; Samaro, A.; Grymonpré, W.; Vanhoorne, V.; van Snick, B.; Boone, M.N.; Hellemans, T.; van Hoorebeke, L.; Remon, J.P.; Vervaet, C. 3D printing of high drug loaded dosage forms using thermoplastic polyurethanes. Int. J. Pharm. 2018, 536, 318–325. [Google Scholar] [CrossRef]
- Goyanes, A.; Wang, J.; Buanz, A.; Martínez-Pacheco, R.; Telford, R.; Gaisford, S.; Basit, A.W. 3D Printing of Medicines: Engineering Novel Oral Devices with Unique Design and Drug Release Characteristics. Mol. Pharm. 2015, 12, 4077–4084. [Google Scholar] [CrossRef] [Green Version]
- Gioumouxouzis, C.I.; Katsamenis, O.L.; Bouropoulos, N.; Fatouros, D.G. 3D printed oral solid dosage forms containing hydrochlorothiazide for controlled drug delivery. J. Drug Deliv. Sci. Technol. 2017, 40, 164–171. [Google Scholar] [CrossRef] [Green Version]
- Okwuosa, T.C.; Pereira, B.C.; Arafat, B.; Cieszynska, M.; Isreb, A.; Alhnan, M.A. Fabricating a Shell-Core Delayed Release Tablet Using Dual FDM 3D Printing for Patient-Centred Therapy. Pharm. Res. 2017, 34, 427–437. [Google Scholar] [CrossRef]
- Pietrzak, K.; Isreb, A.; Alhnan, M.A. A flexible-dose dispenser for immediate and extended release 3D printed tablets. Eur. J. Pharm. Biopharm. 2015, 96, 380–387. [Google Scholar] [CrossRef]
- Takahashi, Y.; Tadokoro, H. Structural Studies of Polyethers, (-(CH2)m-O-)n. X. Crystal Structure of Poly(ethylene oxide). Macromolecules 1973, 6, 672–675. [Google Scholar] [CrossRef]
- The United States Pharmacopeial Convention. Hypromellose; The United States Pharmacopeial Convention: Rockville, MD, USA, 2015. [Google Scholar]
- Korte, C.; Quodbach, J. Formulation development and process analysis of drug-loaded filaments manufactured via hot-melt extrusion for 3D-printing of medicines. Pharm. Dev. Technol. 2018, 23, 1117–1127. [Google Scholar] [CrossRef]


| Designation | Formulation in Fractions [wt.%] | Extrusion Temperatures [°C] | ||||
|---|---|---|---|---|---|---|
| HPMC | PEG | PEO | PEO-L | Theoph. | ||
| HPMC * | 95.00 | 5.00 | - | - | - | 150 * |
| HPMC15 | 81.53 | 4.08 | - | - | 14.38 | 160 |
| HPMC35 | 62.95 | 3.15 | - | - | 33.90 | 160 |
| HPMC50 ** | 48.78 | 2.44 | - | - | 48.78 | 170 ** |
| PEO | - | - | 100.00 | - | - | 120 |
| PEO15 | - | - | 85.00 | - | 15.00 | 120 |
| PEO15-P | - | 4.08 | 81.53 | - | 14.38 | 120 |
| PEO35 | - | - | 65.00 | - | 35.00 | 120 |
| PEO35-PL | - | - | 59.09 | 9.09 | 31.82 | 120 |
| Designation | Aberration from Standard Generic PLA Profile (Cura 2.7) |
|---|---|
| HPMC | Retraction distance: 8 mm; printing temperature: 220 °C |
| HPMC15 | Retraction distance: 8 mm |
| HPMC35 | Retraction distance: 8 mm; buildplate temperature: 70 °C |
| HPMC50 | Retraction distance: 8 mm; buildplate temperature: 80 °C; printing temperature: 210 °C; print cooling: disabled |
| PEO/PEO15 | Retraction distance: 8 mm; buildplate temperature: 55 °C; printing temperature: 110 °C; print cooling: 100% fanspeed at 1st layer; print speed: 40 mm/s |
| PEO15-P | |
| PEO35 | Not printable |
| PEO35-PL |
| Flowrate [mL/min] | Samples |
|---|---|
| 4 | HPMC15 samples (including cylinders with open porosity) HPMC35 samples |
| 8 | HPMC50 samples |
| 16 | PEO15 samples PEO15-P samples |
| Designation | Theoretical Density * [g/cm3] | Filament Density [g/cm3] | Density Deviation Filament [%] | 3D-Print Density [g/cm3] | Density Deviation 3D-Print [%] |
|---|---|---|---|---|---|
| HPMC | 1.255 | 1.192 | −5.29 | 1.182 | −6.18 |
| HPMC15 | 1.289 | 1.268 | −1.66 | 1.237 | −4.00 |
| HPMC35 | 1.335 | 1.300 | −2.63 | 1.309 | −1.95 |
| HPMC50 | 1.371 | 1.342 | −2.12 | 1.356 | −1.04 |
| PEO | 1.250 | 1.202 | −3.99 | 1.207 | −3.56 |
| PEO15 | 1.286 | 1.251 | −2.78 | 1.275 | −0.90 |
| PEO15-P | 1.278 | 1.244 | −2.63 | 1.256 | −1.71 |
| PEO35 | 1.335 | 1.277 | −4.36 | N/A | N/A |
| PEO35-PL | 1.328 | 1.253 | −5.67 | N/A | N/A |
| Designation | Theoretical API Content [wt.%] | API Content First End [wt.%] | API Content Second End [wt.%] | API Content Average [wt.%] |
|---|---|---|---|---|
| HPMC15 | 14.38 | 14.71 ± 0.28 | 16.54 ± 0.22 | 15.62 ± 0.95 |
| HPMC35 | 33.90 | 33.09 ± 0.28 | 34.79 ± 0.33 | 33.94 ± 0.90 |
| HPMC50 | 48.78 | 49.02 ± 0.53 | 49.70 ± 0.43 | 49.36 ± 0.59 |
| PEO15 | 15.00 | 14.17 ± 0.17 | 16.03 ± 0.24 | 15.10 ± 0.95 |
| PEO15-P | 14.38 | 15.34 ± 0.15 | 15.76 ± 0.15 | 15.55 ± 0.26 |
| PEO35 * | N/A * | N/A * | N/A * | N/A * |
| PEO35-PL | 31.82 | 32.27 ± 0.42 | 32.76 ± 0.45 | 32.52 ± 0.50 |
| Design | mtheor. [mg] | mcylinder [mg] | mring [mg] | msphere [mg] | Cylinder Theophylline Content [mg] | |
|---|---|---|---|---|---|---|
| Theoretic * | Measured | |||||
| HPMC | 189.18 | 175.37 ± 1.48 | 190.08 ± 0.37 | 183.23 ± 0.37 | N/A | N/A |
| HPMC15 | 186.60 | 176.01 ± 1.56 | 183.47 ± 4.78 | 178.70 ± 1.18 | 27.89 ± 1.70 | 25.59 ± 0.51 |
| HPMC35 | 197.44 | 180.14 ± 6.41 | 191.10 ± 0.85 | 174.87 ± 0.66 | 62.76 ± 3.72 | 63.53 ± 3.44 |
| HPMC50 | 204.55 | 176.64 ± 6.50 | 172.33 ± 0.90 | 186.20 ± 1.85 | 88.83 ± 1.99 | 86.92 ± 2.61 |
| PEO | 188.50 | 162.97 ± 4.47 | 174.28 ± 1.61 | N/A | N/A | N/A |
| PEO15 | 185.27 | 176.91 ± 1.46 | 188.37 ± 1.77 | N/A | 26.69 ± 1.69 | 29.10 ± 0.10 |
| PEO15-P | 192.22 | 171.52 ± 1.68 | 182.18 ± 3.16 | N/A | 27.15 ± 0.92 | 27.55 ± 0.78 |
© 2019 by the authors. Licensee MDPI, Basel, Switzerland. This article is an open access article distributed under the terms and conditions of the Creative Commons Attribution (CC BY) license (http://creativecommons.org/licenses/by/4.0/).
Share and Cite
Tidau, M.; Kwade, A.; Finke, J.H. Influence of High, Disperse API Load on Properties along the Fused-Layer Modeling Process Chain of Solid Dosage Forms. Pharmaceutics 2019, 11, 194. https://doi.org/10.3390/pharmaceutics11040194
Tidau M, Kwade A, Finke JH. Influence of High, Disperse API Load on Properties along the Fused-Layer Modeling Process Chain of Solid Dosage Forms. Pharmaceutics. 2019; 11(4):194. https://doi.org/10.3390/pharmaceutics11040194
Chicago/Turabian StyleTidau, Marius, Arno Kwade, and Jan Henrik Finke. 2019. "Influence of High, Disperse API Load on Properties along the Fused-Layer Modeling Process Chain of Solid Dosage Forms" Pharmaceutics 11, no. 4: 194. https://doi.org/10.3390/pharmaceutics11040194