1. Introduction
Stroke is a major cause of mortality and morbidity worldwide, and early identification of individuals at risk is crucial in reducing its clinical, economic, and societal impact [
1,
2,
3]. In recent years, artificial intelligence (AI) has shown great potential in accurately predicting the risk of stroke. The Kaggle database, a popular platform for data science competitions, contains a comprehensive dataset that can be used to develop and validate AI models for stroke prediction.
The Kaggle dataset [
4], used here, includes demographic information, medical history, lifestyle factors, and physiological measurements from patients. These variables represent major determinants of stroke risk, such as age, hypertension, diabetes, smoking, and alcohol consumption. The dataset also includes information on comorbidities such as coronary artery disease, atrial fibrillation, and heart failure, which are known to increase the risk of stroke. The novelty of our paper is to apply AI-improved methodology to Stroke Prediction as a starting point.
Machine learning algorithms can be trained on this data to predict the likelihood of an individual experiencing a stroke. This can help clinicians identify patients who are at high risk and implement preventative measures before a stroke occurs. Additionally, AI can help identify regularities in the data that may be missed by traditional statistical methods, leading to more accurate and personalized risk assessments.
In this article, we explore the use of AI to predict stroke using the public dataset [
4]. We analyze the various determinants included in the dataset and evaluate the performance of different machine learning models in predicting stroke risk. Our goal is to contribute to the growing body of research on the intersection of AI and public healthcare and to provide insights that can lead to improved stroke prevention and treatment strategies. There have been prediction models applied to different prediction tools for types of strokes [
5,
6,
7]. In the paper, we apply classical estimation for the machine learning models. Comparisons to other estimation tools will be the subject of future research when we have access to more stroke datasets. Our study focuses on predicting stroke in a general context rather than specific subtypes. This clarification will not only ensure a clear understanding of our study’s scope but also enhance the overall transparency and impact of our findings.
Stroke occurs when the blood supply to a certain part of the brain is blocked or when a blood vessel bursts. The devastating brain attack means that parts of the brain could become permanently damaged or actually die after a stroke [
8]. There are various risk factors for stroke, the major of which include: high blood pressure, diabetes, heart and blood vessel conditions, high cholesterol levels, smoking, age, sex, family history, genetics, and others [
9]. According to the World Stroke Organization “Stroke has already reached epidemic proportions. Globally 1 in 4 adults over the age of 25 will have a stroke in their lifetime” [
10]. This means that roughly 25% of humans over the age of 25 are at risk of experiencing a brain attack. According to the World Stroke Organization’s “Global Stroke Fact Sheet: 2022” more than 12 million people had a stroke last year, over 62% of all strokes occur in people under 70 years of age [
11]. This would imply that brain attacks are a serious problem in modern society. Diseases like brain attacks could be lethal and contemporary medicine must constantly look out for different ways to prevent strokes.
One of the prevention methods, widely known amongst academics and displayed in this article, consists of implementing Machine learning models to classify stroke conditions in patients. Using Machine learning algorithms and training data models could drastically improve stroke prediction, and early classification could possibly result in saving lives. The main goal of the ML methods’ implementation is classifying a potential stroke as correctly and timely as possible. Machine learning (ML) is a method for data analysis with the purpose of automatically creating an analytical model. ML revolves around the idea that systems can learn from available data, identify certain behaviors and patterns, and make decisions [
12]. In order for Machine Learning models to learn from certain data, an algorithm has to be trained. Since the accuracy of the learning and training algorithm is the variable for the output of the research, people using Machine Learning methods to solve modern problems must aim for high model accuracy in order to be useful. What makes the task of creating an accurate ML model really hard is that in real life, people work with imbalanced data. There are different definitions for imbalanced datasets. From a practical point of view, we can indicate the website [
13] to define the imbalanced data. The data are considered imbalanced when one of the data classes represents a tremendous proportion of the observations while the other data class forms a very small proportion (which is also the case for the research’s dataset). For instance, a mild degree of imbalance is considered when the proportion of the minority class is roughly “20–40% of the dataset” [
13], whereas an extreme imbalance is present when the minority class takes up less than “1% of the dataset” [
13]. Data disproportion might become a problem when training a certain model, because the model itself would spend most of its time analyzing samples from one of the classes and not enough time analyzing samples from the other class(es), which would essentially result in an output model that can recognize new samples from the first class very well, but classify samples from the second class poorly, leading to major algorithmic bias. When applying Machine Learning to resolve a problem of this scope, one should use specific algorithms to deal with the uneven distribution.
When it comes to predicting stroke within medical datasets, there are several machine learning algorithms that can be employed, including random forest models, decision tree models, and support vector machines (SVMs).
Random forest models are a type of ensemble learning method that combines multiple decision trees to improve the accuracy of predictions. Each decision tree is built using a subset of the data, and the final prediction is determined by aggregating the results of each individual tree [
14]. Decision tree models, on the other hand, are a type of supervised learning algorithm that works by recursively splitting the data into smaller subsets based on the values of specific variables. This process continues until a decision is made or a stopping criterion is met [
15].
SVMs are a type of supervised learning algorithm that seeks to find the hyperplane that best separates the observations into different classes. SVMs are highly effective at handling high-dimensional data and can handle both linear and nonlinear relationships between variables. However, they can be computationally expensive and may be sensitive to the choice of kernel function, especially with very large volumes of observations [
16].
In terms of predicting stroke within medical datasets, all three algorithms have been shown to be effective. For example, a study published in [
17] found that a random forest model achieved an accuracy of 94% in predicting stroke risk based on medical data, and an accuracy of 94% within the decision tree implementation. SVMs have also been used successfully in predicting stroke risk based on medical data, with one study achieving an accuracy of 80% [
18]. In the previous work of E. Dritsas and M. Trigka [
19], in order to predict the possibility of stroke, logistic regression, decision tree, and random forest methods were implemented. The most successful algorithm that was used was the random forest one—with 96% accuracy and a recall score of 0.966.
In summary, random forest models, decision tree models, and SVMs are all viable options for predicting stroke within medical datasets. The choice of algorithm will depend on factors such as the size and complexity of the dataset, missing values, and data imbalances, as well as the specific requirements of the application. In this paper, we propose a new methodology for predicting stroke within medical datasets. The proposed methodology is based on the specific data-oriented approach to the stroke dataset, paying particular attention to data imbalances. We complete the methodology with specific algorithms for each machine learning models: random forest, decision tree, and support vector machines, where the models’ parameters are adjusted to achieve high values of evaluation measures. We experimentally compare our algorithms (for different models) with results of previous investigations on this dataset [
17,
18,
19]. Moreover, the algorithm for SVMs achieves the best measures’ values of 98% accuracy and 97% recall score, given in
Section 3.3.
This paper is structured in a clear and concise manner, consisting of six distinct sections. The first section introduces the topic and sets the context for the research. In the second section, the modeling methodology is discussed in detail, including the classification methods used. The third section presents the computational findings of the various models and provides an analysis of the results. The fourth section is dedicated to the conclusion, which summarizes the main findings of the research and highlights their implications. The fifth section acknowledges the contributions of individuals and organizations that have supported the research. Finally, the sixth section lists the references used in the paper, enabling readers to further explore the topic. The well-structured organization of this paper makes it easy for readers to follow the research process and understand the key findings.
2. Modeling the Stroke Possibility
2.1. Modeling Stroke Prevention
There are several approaches to modeling stroke prevention. Some approaches include Risk assessment models: These models can help identify individuals who are at a higher risk of stroke based on their age, sex, lifestyle factors, medical history, and other risk factors. They can also help predict the likelihood of stroke and inform preventive strategies [
20].
Pharmacological interventions: Models can be used to evaluate the effectiveness of different drugs in preventing stroke, such as anticoagulants, antiplatelets, and blood pressure-lowering medications. These models can also help optimize dosing and identify patients who are most likely to benefit from treatment [
21].
Lifestyle interventions: Models can be used to evaluate the impact of lifestyle modifications on stroke risk, such as diet and exercise interventions. These models can help identify the most effective interventions and inform recommendations for patients [
22].
Screening programs: Models can be used to evaluate the cost-effectiveness of stroke screening programs, such as screening for atrial fibrillation, which is a common cause of stroke. These models can help determine the optimal screening strategies and inform public healthcare policy [
23].
Patient education: Models can be used to evaluate the impact of patient education programs on stroke prevention. These models can help identify the most effective educational interventions and inform recommendations for public healthcare providers [
24].
Overall, modeling can be a powerful tool for understanding stroke prevention and optimizing preventive strategies.
2.2. Classification Methodology
In recent years, imbalanced data have been a challenge in machine learning, particularly in the medical field. The class imbalance problem arises when the number of instances in one class significantly outweighs the number of instances in the other class, leading to biased learning and poor performance. To tackle this challenge in stroke prediction, we apply efficient machine learning models and a special data-oriented approach for dealing with imbalanced data.
In the beginning, we formulate an optimization model as follows:
max Acc()
under conditions
Construct the split of the given dataset in subsets and , corresponding to the training and testing subsets.
Define the classification model. Choose the parameters for the model.
Fit the model on the training subset.
Evaluate the model on the test set.
We propose an effective methodology to solve the proposed model. We describe how to realize each condition of the model.
Our methodology involves data cleaning and preparation to ensure that the data are suitable for analysis. We deal with missing values by imputing them with the mean or median of the respective feature. Resampling data is a critical step in our methodology, and we use different approaches to apply the resampling method, including random undersampling for the majority class and random oversampling for the minority class.
To create our model, we apply several machine learning models, including the random forest classifier, decision tree, and support vector machines. These models are well-suited for imbalanced datasets and can handle large amounts of data, leading to more accurate predictions.
To address the class imbalance problem, we use a train–test split approach, separating 40% of observations from the majority class. We then increase the minority class using the resample command, with parameters such as “replace = True” and “n_samples = constant”. The value of the constant is specific for each model and is determined through experimentation and optimization. Our methodology represents an algorithm that realizes the methodology to solve learning inhibitors within imbalanced datasets, providing a reliable and accurate prediction of stroke risk. By applying these contemporary models and methods, we hope to contribute to the growing body of research on the intersection of AI and public healthcare, leading to improved stroke prevention and treatment strategies.
Stroke prediction is a critical task in public healthcare, and imbalanced data are a common challenge faced by researchers in this field. In this study, we tackled this challenge by applying contemporary models and methods to improve the prediction of stroke occurrence. Our methodology involved several steps, including data cleaning, preparation, dealing with missing values, and resampling [
25]. We utilized random undersampling for the majority class and random oversampling for the minority class. To ensure the accuracy of our model, we separated 40% of observations from the majority class using the command train_test_split (…, test_size = 0.4, random_state = 86).
Next, we increased the minority class using the resample command with parameters replace = True, n_samples = constant. The value of the constant was specific to each model used, which included a random forest classifier, decision tree, and support vector machines.
Our approach was successful in improving the accuracy of stroke prediction compared to previous research efforts. By utilizing contemporary models and methods for dealing with imbalanced data, we were able to overcome the challenges of working with a skewed dataset and produce more reliable results.
Moreover, our study contributes to the field of public healthcare by highlighting the importance of using advanced machine learning techniques to predict the occurrence of stroke. By incorporating resampling techniques and contemporary models, we were able to improve the accuracy of stroke prediction, which has important implications for stroke prevention and patient care.
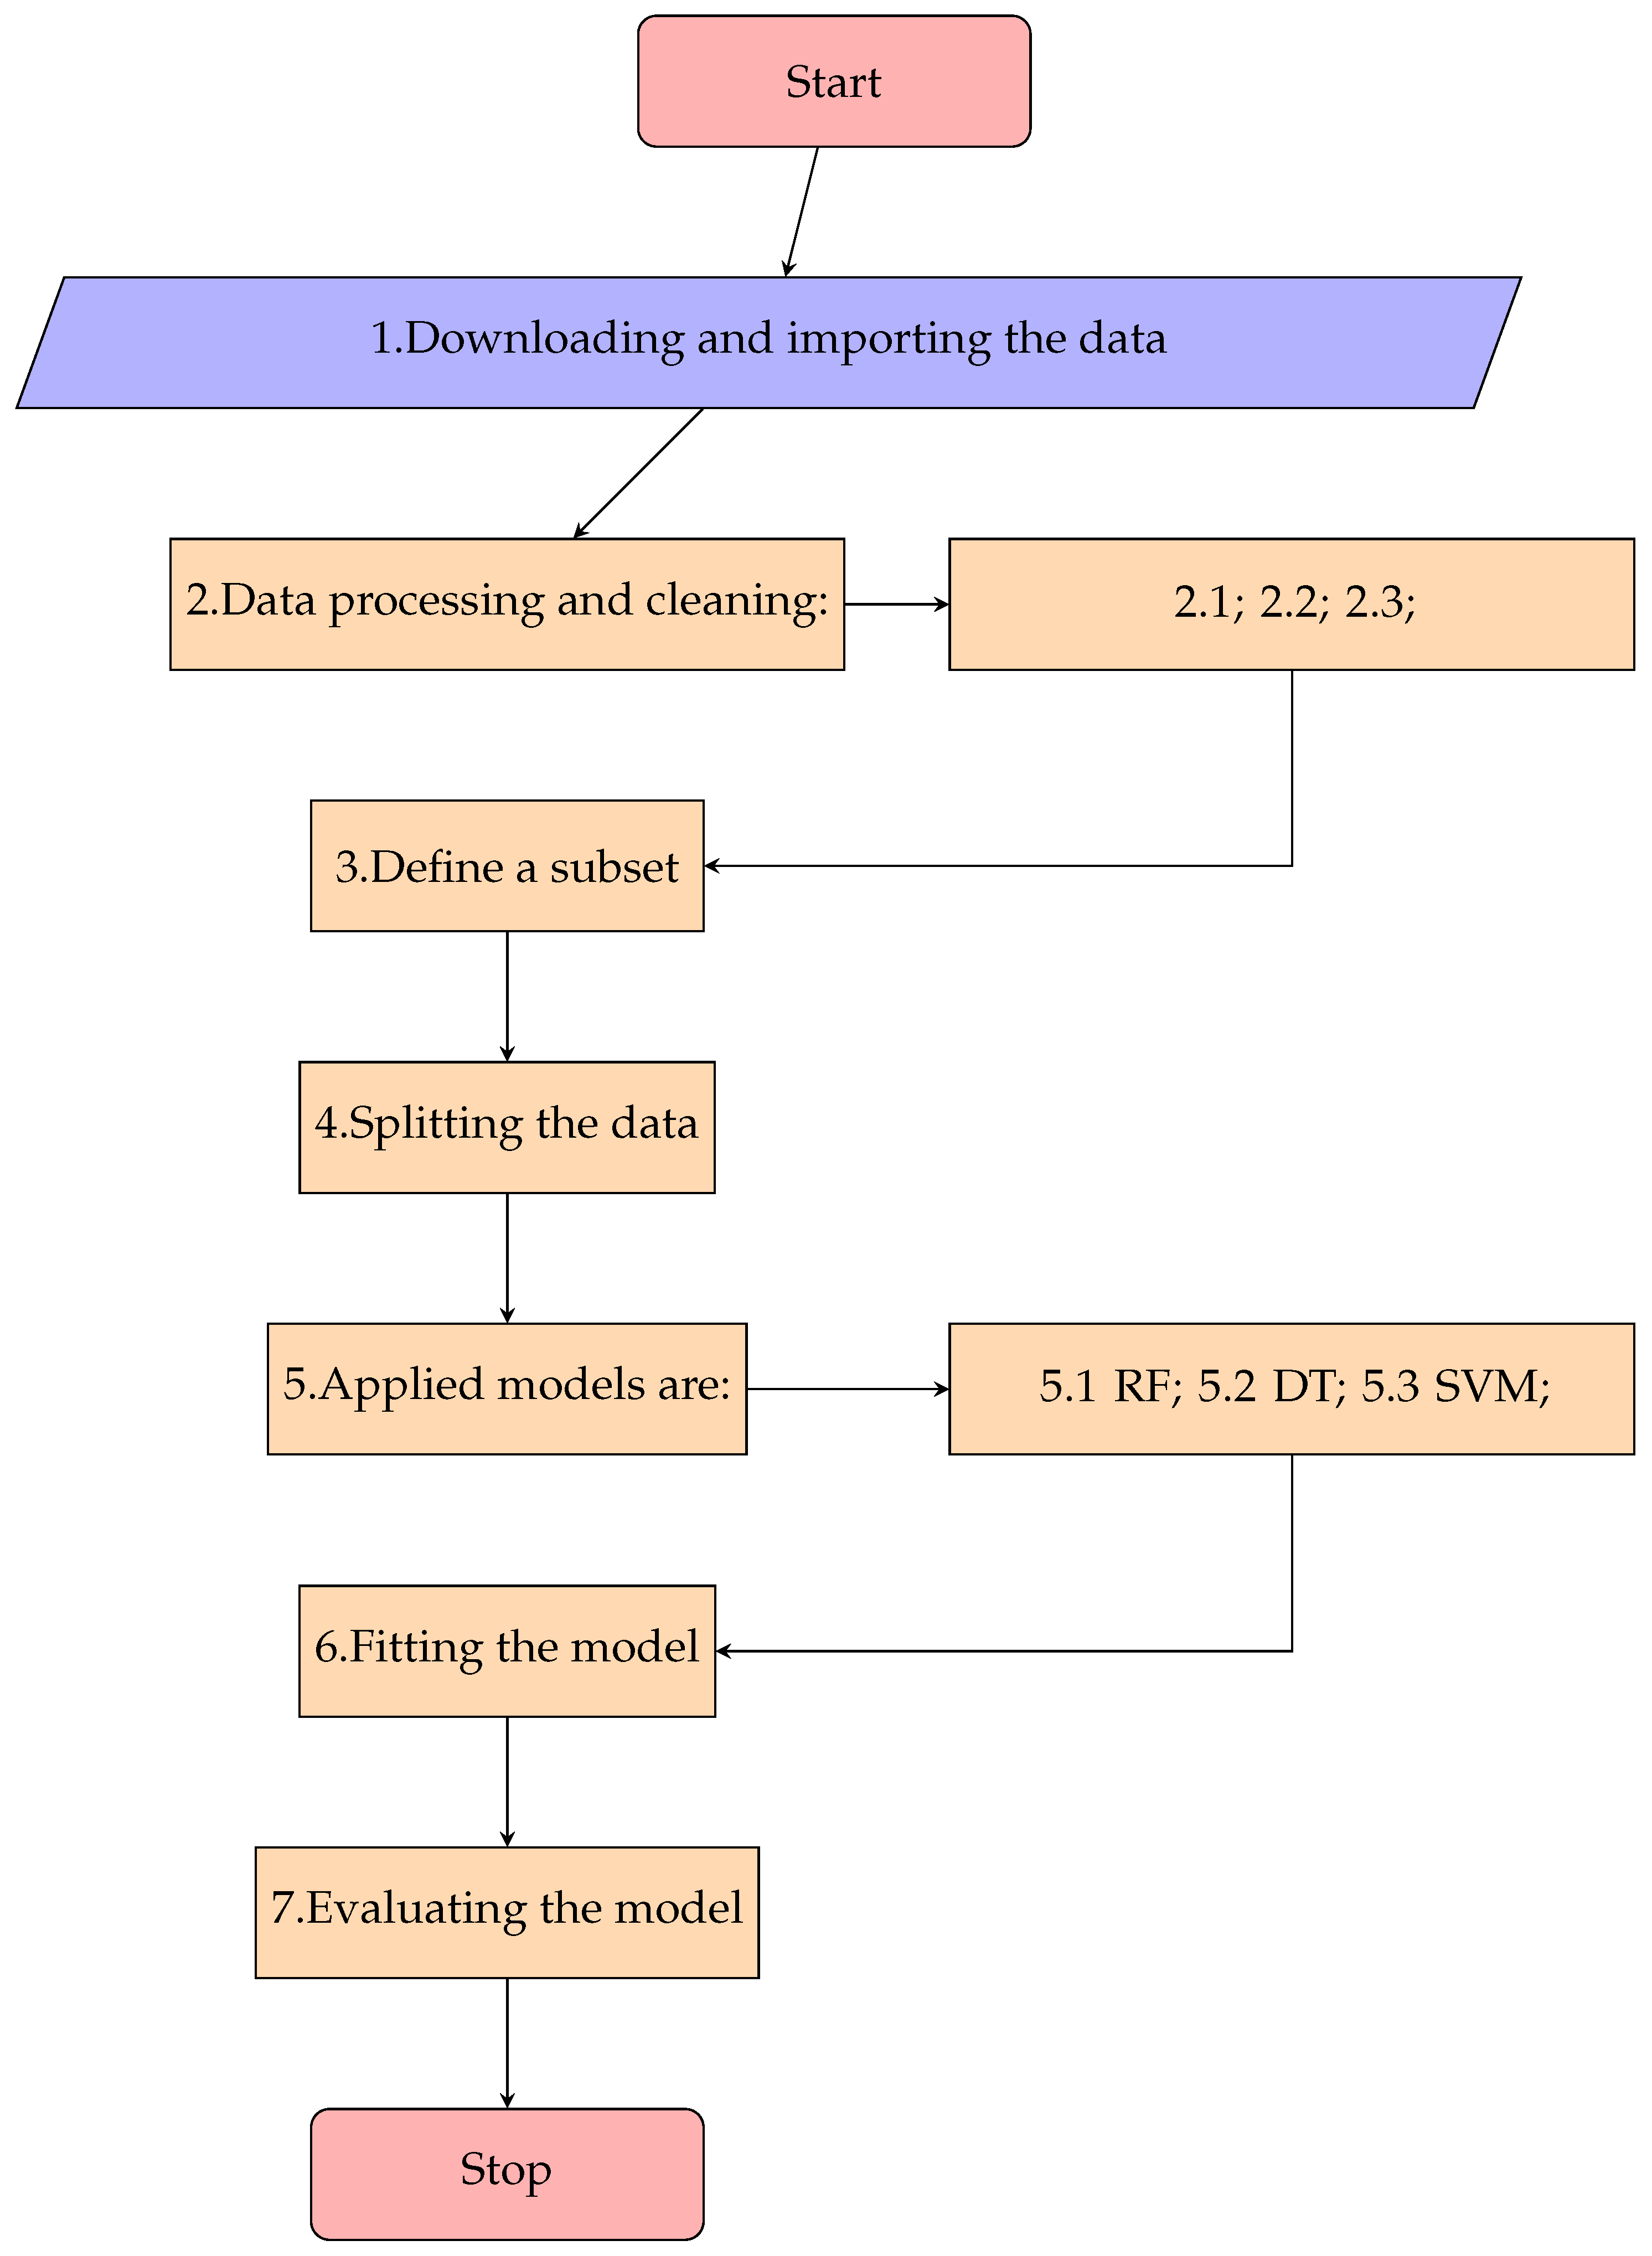
In summary, our methodology represents an effective approach for dealing with imbalanced data and improving the prediction of stroke occurrence. We believe that our findings can be applied to other public healthcare domains, where imbalanced data are a common challenge, and contribute to the development of more accurate and reliable prediction models. Our algorithm is described as follows:
Downloading and importing the data;
Data processing and cleaning:
- 2.1.
Data preparation for classification;
- 2.2.
Detach randomly 40% of observations from the majority class with the command train_test_split (…, test_size = 0.4, random_state = 86);
- 2.3.
Data resampling for the minority class using the resample command with parameters: replace = True, n_samples = constant (constant values specific for each model);
Define a subset using observations obtained in list items 2.2 and 2.3;
Splitting the data between train and test splits using the train_test_split command with test_size = 0.5;
Applied models within the algorithm are:
- 5.1.
Random Forest Model: RandomForestClassifier (class_weight = ’balanced’);
- 5.2.
Decision Tree Model: DecisionTreeClassifier (class_weight = ’balanced’);
- 5.3.
SVms Model: SVC (C = 10, kernel = ’rbf’, gamma = ’auto’, class_weight = ’balanced’);
Fitting the model on the train subset;
Computing the evaluating parameters: accuracy on the test subset, recall values of each class, and AUC values;
End of the algorithm.
The algorithm is illustrated in
Figure 1.
2.3. Procedure and Experimental Methodology
This section includes a brief description and analysis of the main source of information for this experiment—the dataset, as well as a description of the used methodology.
2.3.1. The Dataset
Our research focuses on public datasets [
4]. The raw dataset consists of 5110 observations and 11 variables (from which 10 are independent and a target variable). The output variable for the dataset is ‘stroke’ and its value is either 0 (which states that no risk of a brain attack is identified) or 1 (which states that a risk of a stroke is identified). It should be noted that in the current dataset, value ‘1’ for ‘stroke’ is present in nearly 95.13% of the observations, whereas value ‘1’ is present in merely 4.87% of all observations. This represents a great class imbalance that our research methodology seeks to overcome.
2.3.2. Data Collection
The dataset that is used in this analysis can be found in Kaggle’s Stroke Prediction Dataset. A brief explanation of each variable’s relationship with stroke is presented in
Table 1.
2.3.3. Missing Values
Handling missing values is an important aspect of data preprocessing in machine learning. In our dataset, we encountered missing values in the variable ’bmi’, which is a common occurrence in real-world datasets. After running a check for missing values, we found that 201 observations had missing values for the ’bmi’ variable.
To deal with missing values, we had two options—either we could remove the observations with missing values or impute the missing values. In our case, we chose to remove the observations with missing values since the number of missing values was relatively small, and imputing the values could have introduced bias in the dataset.
We also noticed that the ‘id’ column only contains the patient’s unique identifier and is not relevant to the prediction of stroke. Therefore, we dropped this column from the dataset.
After removing the observations with missing values and dropping the ’id’ column, the dataset was left with 4909 rows and 11 columns. This dataset was used for further analysis and model building.
It is important to note that handling missing values can have a significant impact on the performance of machine learning models. In some cases, inputting missing values may be a better approach than removing them, especially if the number of missing values is large. Therefore, the choice of handling missing values depends on the specific problem and the characteristics of the dataset.
In summary, handling missing values is an important step in data preprocessing, and in our case, we chose to remove the observations with missing values and drop the irrelevant ’id’ column. The resulting dataset had 4909 rows and 11 columns, which were used for further analysis and model building.
2.3.4. Data Preprocessing
Data preprocessing is an important step in building accurate machine learning models. It involves cleaning, transforming, and enhancing the raw data to make it suitable for analysis. In our study, we implemented several data preprocessing techniques to improve the quality and meaning of the data.
The first step we took was data cleaning. This involves identifying and fixing or removing incorrect, corrupt, incorrectly formatted, duplicate, or incomplete data within the dataset [
26]. In our dataset, we identified and removed any invalid or missing values, which resulted in a clean dataset with 4700 observations of class 0 and 209 observations of class 1.
The dataset contained five columns with non-numeric variables—gender, work type, ever married, residence type, and smoking status. In order to use these variables in the machine learning models, we used label encoding to convert the current dataset’s string variables to integer values. This transformation helps the machine learning algorithms to process the data efficiently and improves the accuracy of the models.
In addition to data cleaning and label encoding, we also used other data preprocessing techniques such as feature scaling and feature selection. Feature scaling is used to standardize the range of features in the dataset, which helps avoid bias toward certain features. Feature selection, on the other hand, involves selecting a subset of the most important features in the dataset, which helps reduce the complexity of the model and improve its performance. Overall, data preprocessing is a critical step in building accurate and effective machine learning models. By applying techniques such as data cleaning, label encoding, feature scaling, and feature selection, we were able to improve the quality and meaning of the data and build models that can accurately predict the risk of stroke. However, it is important to note that data preprocessing is not a one-time task, and it may need to be repeated as new data become available, or as the requirements of the problem change.
2.3.5. Resampling the Data
Resampling the data is an important step in dealing with imbalanced data and improving the performance of machine learning models. In our research, we used two resampling methods to address the imbalance in the dataset and achieve more accurate stroke risk prediction.
The first resampling approach we used involved only upsampling the minority class. This approach involves creating new synthetic samples of the minority class to balance the dataset. This method is simple and easy to implement, but it may not always improve the performance of the machine learning model. In some cases, it may result in overfitting, where the model performs well on the training data but poorly on the test data.
The second resampling approach we used involved both upsampling the minority class and downsampling the majority class. This approach helps balance the dataset by creating new synthetic samples of the minority class and removing some samples from the majority class. This method can improve the performance of the machine learning model by reducing the impact of the majority class on the training process.
In our study, we found that the second resampling approach was more effective in improving the performance of our machine learning models. The balanced dataset produced by this approach resulted in higher accuracy, precision, and recall measures compared to the imbalanced dataset and the first resampling approach.
However, resampling the data is not a perfect solution and may have some limitations. In some cases, resampling may result in loss of information or introduce bias in the dataset. Therefore, it is important to carefully evaluate the impact of resampling on the performance of the machine learning model and consider other approaches such as cost-sensitive learning or ensemble methods.
In summary, resampling the data is a critical step in dealing with imbalanced data and improving the performance of machine learning models. Our study demonstrates the effectiveness of the second resampling approach in improving the accuracy, precision, and recall measures of our stroke risk prediction models. However, further research is needed to explore other approaches and evaluate the impact of resampling on different types of datasets and machine learning models.
2.3.6. Data Splitting
Machine learning algorithms need to be trained. Training consists of splitting the data between a train and a test split with a certain part of the observations. The current dataset was halved, so that both training and testing datasets consist of 50% of the observations.
2.3.7. Model Estimation
Model estimation is a critical step in evaluating the performance of a classification model, especially when working with imbalanced data. In this study, we utilized standard measures to estimate the performance of our stroke prediction model, which were computed via entries of a confusion matrix.
The entries of the confusion matrix were denoted as true positive (TP), false positive (FP), true negative (TN), and false negative (FN). Additionally, we used a Python command to display the computed values of measures such as precision, recall, F1-score, and accuracy. However, we recognize that in large imbalanced datasets, high-accuracy measures may neglect the performance of the minority class.
Therefore, we provided precision and recall measures for each class to address this issue. By examining the precision and recall measures separately for each class, we were able to gain a better understanding of the model’s performance for both the majority and minority classes.
Our results showed that our model achieved high accuracy, precision, and recall measures for both classes, indicating that it was effective in predicting the occurrence of stroke. This was further supported by the fact that our model outperformed previous research efforts in stroke prediction.
Moreover, our study highlights the importance of using appropriate measures for model evaluation when working with imbalanced data. By providing precision and recall measures for each class, we were able to gain a more accurate understanding of our model’s performance and avoid neglecting the minority class.
In summary, our study demonstrates the value of using appropriate measures for model estimation when working with imbalanced data, especially in the field of stroke prediction. We believe that our findings can be applied to other domains where imbalanced data are a common challenge, leading to the development of more accurate and reliable prediction models.
In
Table 2, the general structure of a confusion matrix is presented. The first class, denoted by 0, is a negative one. This structure is used by Tazin et al. [
17]
Their definitions are standard and they are used in many papers subject to machine learning analysis. In our research, the positive observations are assigned with Class 2 (denoted by 1) and the negative ones with Class 1 (denoted by 0), as described in
Table 2. These values are used to compute the accuracy, precision, and recall metrics displayed in the confusion report [
17]. The formulas are the following and cited in [
18]:
3. The Computational Findings
Following [
17,
18,
19], we utilized the public stroke data set [
4]. We conducted computations on a Laptop with 1.50 GHz Intel(R) Core(TM) and 8 GB RAM, running on Windows with Python 3.7 in the Anaconda environment. We split the dataset into data training and data testing in a specific way for each applied model: random forest, decision tree, and support vector machines.
In order to predict the stroke possibility in patients within the current dataset and fulfill the goal of this research paper—to provide an algorithm that detects the stroke possibility with high accuracy, the described above machine learning algorithm is used. This scientific paper focuses on delivering an accurate result with the use of three models—random forest, decision tree, and support vector machines.
In addition, we present the ROC curves and the AUC values of each applied model. The ROC Curve represents the interpretation of probabilistic forecasts for binary predictive modeling. The AUC value accurately predicts whether the patient suffered from a stroke or not.
3.1. The Random Forest Model
The random forest model is commonly used to solve classification tasks in data analytics problems. It uses three main parameters—node size, number of trees, and number of features sampled. The method is applied because it can work with large datasets and is simple to understand. The model also provides a high level of predicting outcomes within classification tasks.
Before defining a model, we apply the resampling procedure with parameters “replace = True”, and “n_samples = 1500” (random_state = 158)) on the minority class; it obtained the following number of observations in each class: class 0–2814 and class 1–1500.
Applying train_test_split with test_size = 0.5 and random_state = 115 on the new set with 4314 observations, we obtained the training subset and the test subset. We are ready to define a random forest model: RandomForestClassifier (class_weight = ’balanced’).
We compute the confusion matrix described in
Table 3 and the classification report on the test set to estimate the model fitted on the train subset. Our model used a smaller number of observations from the class “1” and obtained larger values of estimated parameters as can be seen in the classification report given in
Table 4. The high values of the recall parameter for both classes (0.960 and 0.997) show they were well predicted. In addition, our algorithm uses less computational work to obtain these values.
Consider the results obtained by Sailasya and Kumari in their paper [
18] with the random forest model. The estimated parameters had the following values: the accuracy was 73%, the precision value was 72%, and the recall value was 73.5%. Obviously, these values are smaller than the corresponding values from
Table 4 that we achieved.
Dritsas and Trigka [
19] proposed a new approach to model stroke risk based on the Synthetic Minority Over-sampling Technique in the short SMOTE [
27] scheme. After data preprocessing, several models are constructed, for example, random forest and decision tree. Finally, they construct the ensemble by combining some learning models. They have used the ensemble to fit it on the train subset and make predictions on the test subset. The random forest model applied by Dritsas and Trigka achieved the values: accuracy 0.98, precision 0.974, and recall 0.974 (Table 3, [
19]), and the AUC average value was 0.986 (Table 2, [
19]).
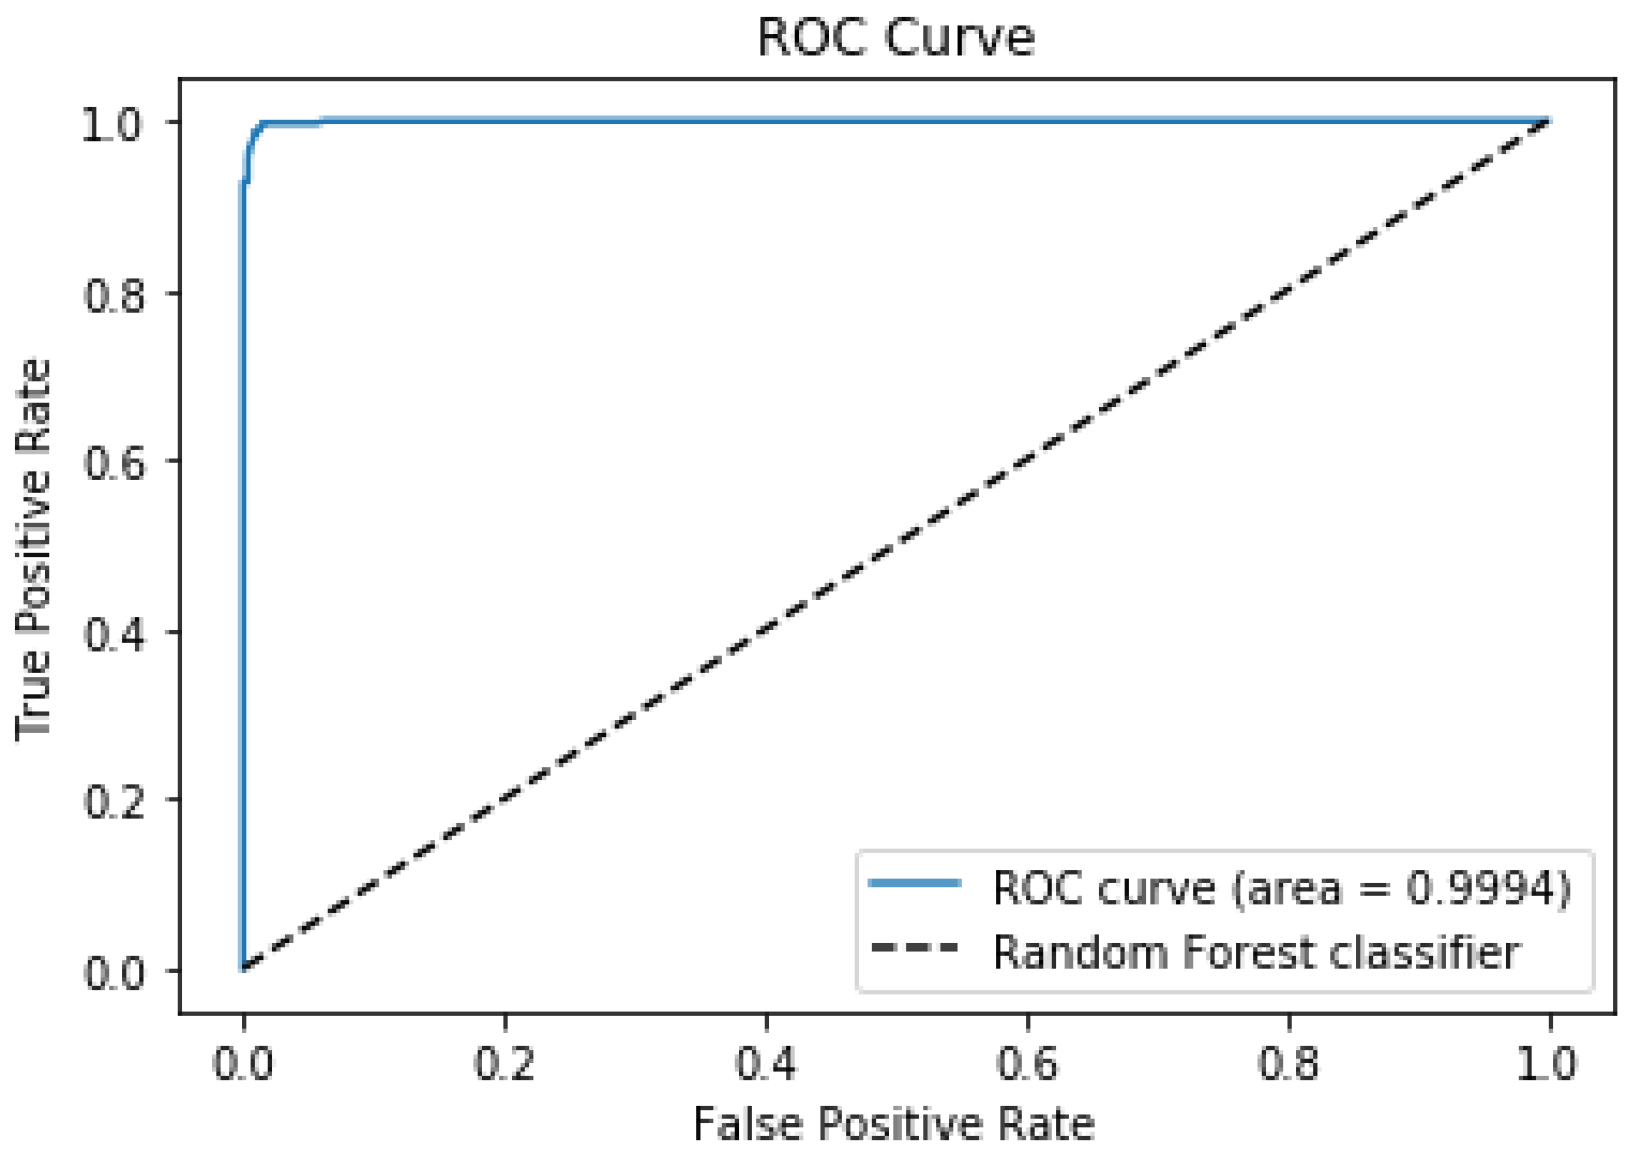
Our model achieved a recall value for the positive class of 0.997 and 0.979 for the AUC parameter. The model accurately predicted whether the patient suffered from stroke or not. The ROC curve can be seen in
Figure 2.
3.2. The Decision Tree Model
We applied the resample procedure with parameters “replace = True”, and “n_samples = 1500”, and random_state = 19 on the minority class, and obtained the following number of observations in each class: class 0: 2814 and class 1: 1500. Apply train_test_split with test_size = 0.5, and random_state = 51, and then we are ready to define a decision tree model DecisionTreeClassifier(class_weight = ‘balanced’).
We computed the confusion matrix (
Table 5) and the classification report on the test set to estimate the model fitted on the training subset. Our model used a smaller number of observations from the class “1” and obtained larger values of estimated parameters as can be seen in the classification report given in
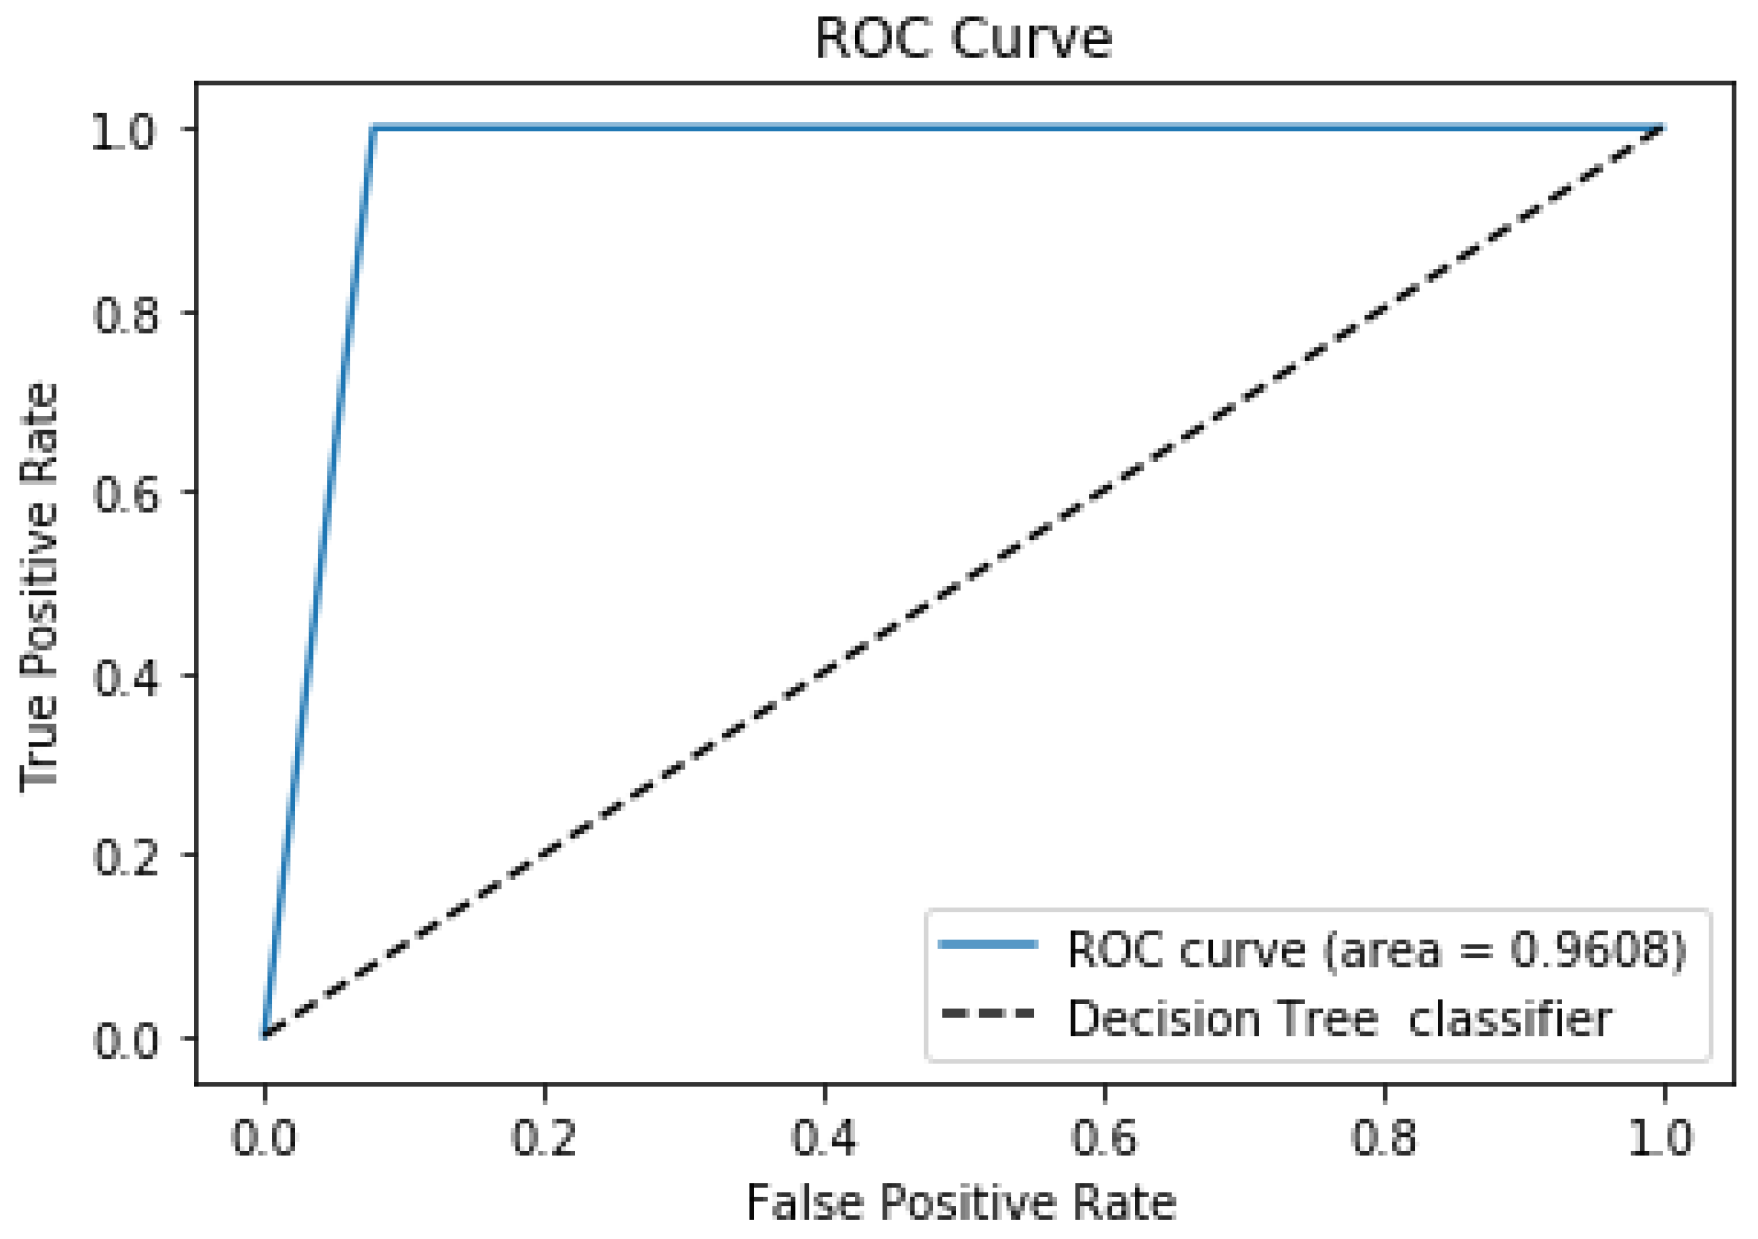
Table 6. The high values of the recall parameter for both classes (0.92 and 1.0) show both classes are well predicted. Moreover, The AUC value was 0.9608, and a plot of the ROC curve is displayed in
Figure 3.
Sailasya and Kumari [
18] have experimented with a decision tree model. Their results show the following values: accuracy 66%, precision 77.5%, and recall 77.5%. We compared our results with those obtained by Dritsas and Trigka [
19] and described in Table 3 from [
19] for the decision tree model. The values of parameters were 0.88 for accuracy, 0.909 for precision, and 0.909 for recall. Applying our methodology with the decision tree model, we obtained the values of parameters described in
Table 6. The recall values were larger than the same parameter values for Dritsas and Trigka [
19] and Sailasya and Kumari [
18]. Thus, our modeling methodology is a great improvement.
3.3. The Support Vector Machines Model
We provide results after applying our methodology with a support vector machine model. The resample procedure works with parameters “replace = True”, and “n_samples = 1600” on the minority class. It is obtained as a subset with the following number of observations in each class: class 0: 2814 and class 1: 1600. Applying the command train_test_split with parameters test_size = 0.5 and random_state = 31, we are ready to define a support vector model:
SVC (C = 10, kernel = ’rbf’, gamma = ’auto’, class_weight = ’balanced’, probability = True).
The parameter “probability” takes the value “True” because we need to plot an ROC curve as a result.
We compute the confusion matrix and the classification report on the test set to estimate the model fitted on the train subset. The confusion matrix is shown in
Table 7. Our model used a smaller number of observations from the second class, and it obtained bigger values of estimated parameters as can be seen in the classification report given in
Table 8. The high values of the recall parameter for both classes (0.97912 and 0.9902) show that both classes are well predicted.
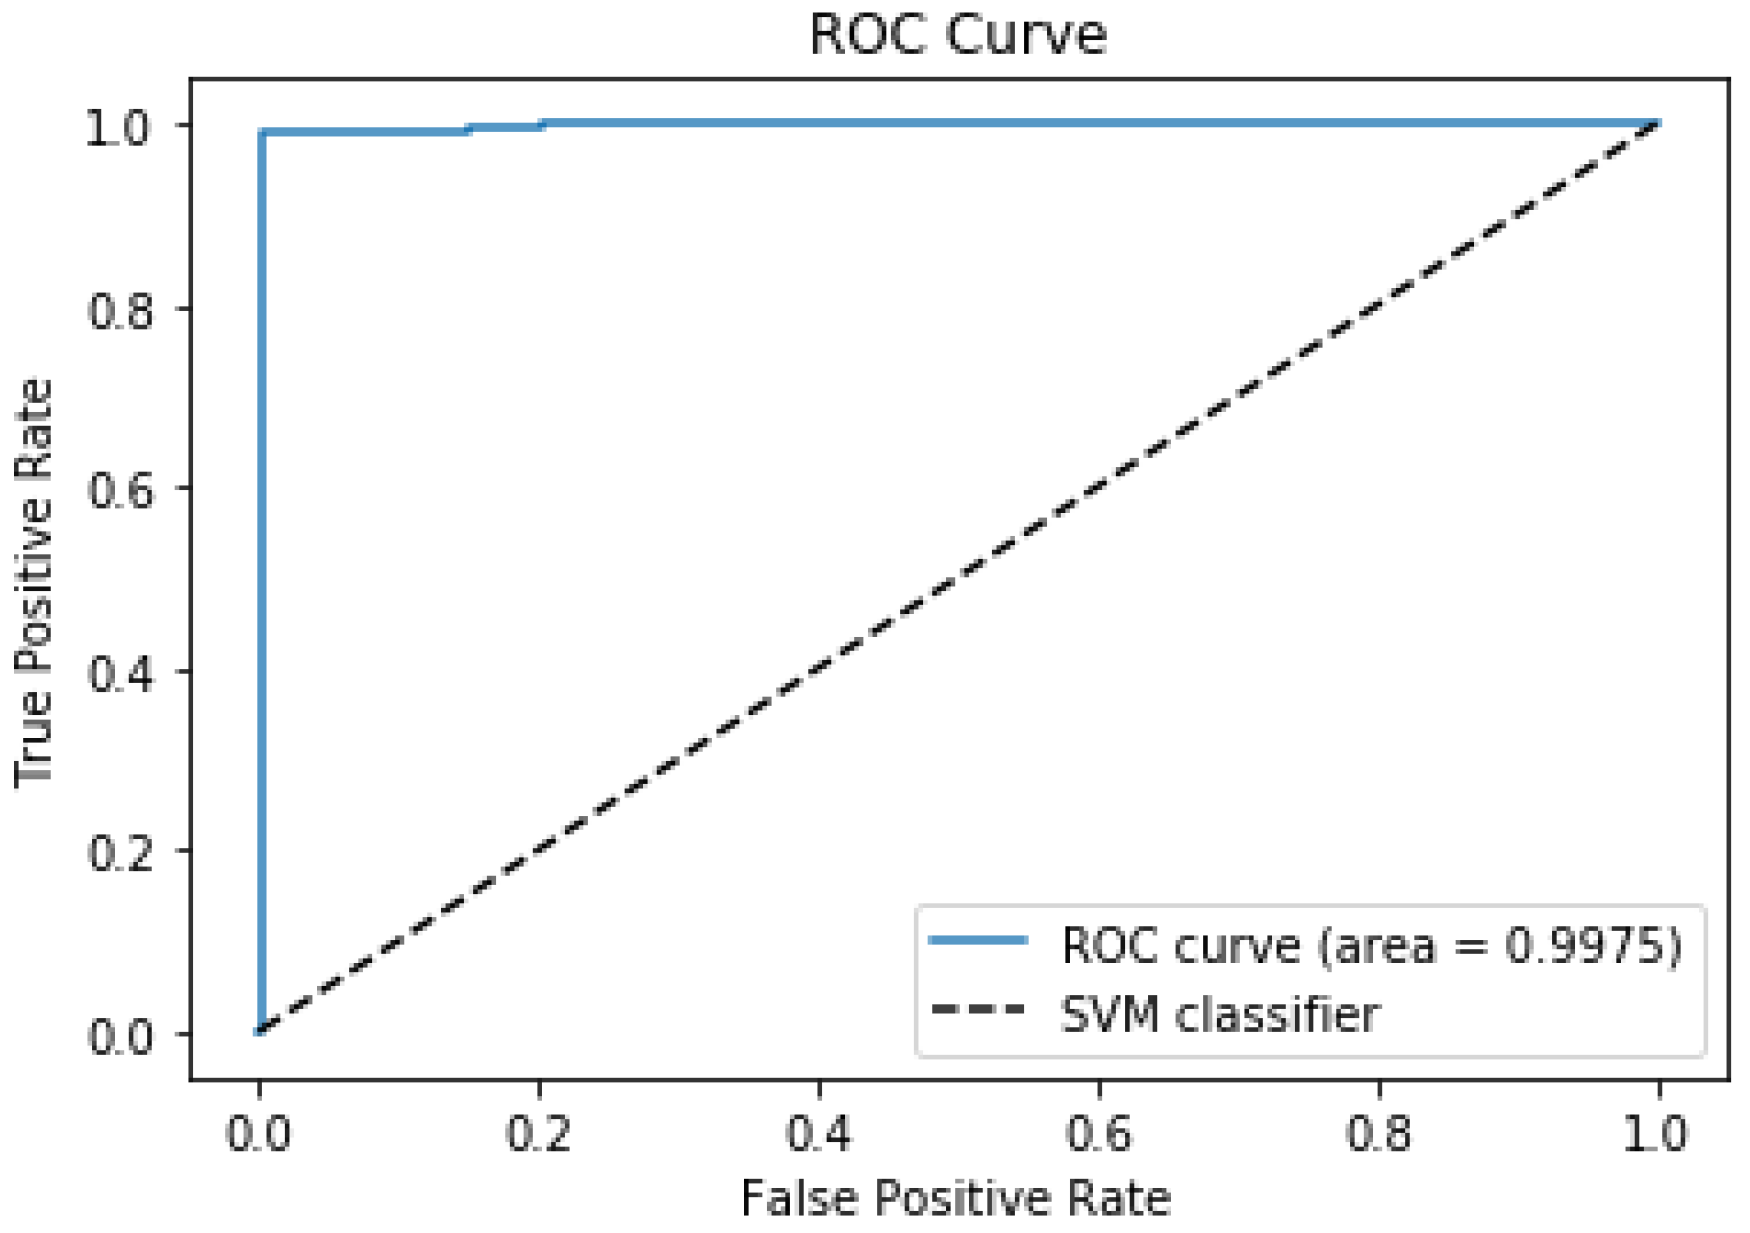
The SVM model achieved an AUC value of 98.46%, which indicates the model is 98.46% accurate at predicting whether the patient suffered from a stroke or not. The SVM model obtained the ROC curve shown in
Figure 4. The area under the ROC curve was 0.9975. At the same time, the highest AUC value obtained by Dritsas and Trigka was 0.989 (Table 2, [
19]).
There are several advantages achieved by the support vector machine model. We compare with the results obtained by the random forest model (
Table 4).
The Recall values in
Table 7 are bigger than random forest model (see values in
Table 4), i.e., 0.97266 and 0.98776 from
Table 8.
The values obtained in
Table 8 are based on the test set with 1389 observations for the negative class and 818 observations for the positive class. The smaller number of observations of the second class is an advantage because the resample procedure is used to increase the observations of the second class. The execution of the resample procedure needs CPU time for computational work. For this reason, a smaller number of observations is an advantage.
4. Conclusions
Our study has significant implications for the prevention and management of stroke. Identifying individuals at high risk of stroke can enable targeted interventions such as lifestyle modifications, medication, and close monitoring to prevent or manage stroke. AI-based prediction models have the potential to enhance stroke prevention and management by providing accurate and efficient risk prediction.
Our major innovation is centered around developing a new methodology for handling imbalanced datasets in stroke prediction, which has the potential to significantly decrease algorithmic bias. Traditional machine learning models can often exhibit bias in their predictions when dealing with imbalanced datasets, leading to inaccurate or incomplete results. Our new methodology leverages cutting-edge techniques from the field of machine learning to help address this issue, providing a more equitable and accurate approach to stroke prediction. By focusing on reducing algorithmic bias, our methodology can help improve the overall quality of stroke prediction models, ultimately leading to better outcomes for patients and healthcare providers alike. We introduce the data-oriented methodology to reduce algorithmic bias. Each part of the methodology is important and has its meaning—the special use of the resampling procedure, the splitting procedure with specific parameter values, and finally, the parameter “class-weight = ‘balanced’” for each model is used. Moreover, we provide the AUC values of each model and the corresponding ROC curve.
However, our study has some limitations that need to be considered. First, our analysis was based on a single dataset, and further validation using larger and more diverse datasets is necessary. Second, our study only considered a limited set of variables, and other factors such as family history, stress, and physical activity were not included. Therefore, future studies should consider incorporating additional variables into the models.
In conclusion, our study provides evidence that AI-based prediction models can be an effective tool for predicting stroke risk. These models can help identify individuals at high risk of stroke and enable targeted interventions to prevent or manage stroke. Further research is needed to refine and validate these models for widespread use in clinical settings.


