Article

Implementation of Novel Evolutional Algorithm for 3-Dimensional Radiation Mapping and Gamma-Field Reconstruction within the Chornobyl Sarcophagus

1
Institute for Safety Problems of Nuclear Power Plants, NAS of Ukraine, Str. Kirova, 36-a, 07270 Chornobyl, Ukraine
2
Institute of Mathematical Machines and Systems Problems, NAS of Ukraine, Akademika Glushkova Ave., 42, 03187 Kyiv, Ukraine
3
HH Wills Physics Laboratory, School of Physics, University of Bristol, Tyndall Avenue, Bristol BS8 1TL, UK
*
Author to whom correspondence should be addressed.
Algorithms 2023, 16(4), 204; https://doi.org/10.3390/a16040204
Submission received: 14 February 2023 / Revised: 6 April 2023 / Accepted: 10 April 2023 / Published: 11 April 2023

Abstract

:
This work presents the application of a novel evolutional algorithmic approach to determine and reconstruct the specific 3-dimensional source location of gamma-ray emissions within the shelter object, the sarcophagus of reactor Unit 4 of the Chornobyl Nuclear Power Plant. Despite over 30 years having passed since the catastrophic accident, the high radiation levels combined with strict safety and operational restrictions continue to preclude many modern radiation detection and mapping systems from being extensively or successfully deployed within the shelter object. Hence, methods for reconstructing the intense and evolving gamma fields based on the limited inventory of available data are crucially needed. Such data is particularly important in planning the demolition of the unstable structures that comprise the facility, as well as during the prior operations to remove fuel containing materials from inside the sarcophagus and reactor Unit 4. For this approach, a simplified model of gamma emissions within the shelter object is represented by a series of point sources, each regularly spaced on the shelter object’s exterior surface, whereby the calculated activity values of these discrete sources are considered as a population in terms of evolutionary algorithms. To assess the numerical reconstruction, a fitness function is defined, comprising the variation between the known activity values (obtained during the commissioning of the New Safe Confinement at the end of 2019 on the level of the main crane system, located just below the arch above the shelter object) and the calculated values at these known locations for each new population. The final algorithm’s performance was subsequently verified using newly obtained information on the gamma dose-rate on the roof of the shelter object during radiation survey works at the end of 2021. With only 7000 iterations, the algorithm attained an MAPE percentage error of less than 23%, which the authors consider as satisfactory, considering that the relative error of the measurements is ±17%. While a simple initial application is presented in this work, it is demonstrated that evolutional algorithms could be used for radiation mapping with an existing network of radiation sensors, or, as in this instance, based on historic gamma-field data.

1. Introduction

1.1. The Chornobyl Accident and New Safe Confinement

The Chornobyl Nuclear Power Plant (ChNPP) is located to the north of present-day Ukraine, 100 km from the country’s capital, Kyiv. The site’s reactor Unit 1 commenced operation in 1977, with reactor Unit 4 subsequently attaining criticality and entering power generation six years later by the end of 1983. On 26 April 1986, during a routine safety test on the reactor’s steam turbines, the RBMK-type reactor Unit 4 was inadvertently placed in an unstable state by its operators, with the chronology of events that subsequently occurred in the early hours of that day leading to the greatest ever nuclear accident and largest radioactive release event to occur at a nuclear power generation facility [1]. As a result, 237 people suffered Acute Radiation Sickness, with 31 of these dying during the three months immediately following the accident [2]. In addition, approximately 300,000 residents living near the Chornobyl site, mostly in the nearby town of Pripyat (constructed for Chornobyl’s workers), were displaced from their homes. To mitigate against the consequences of the accident and prevent the further release of radioactive material into the local and global environments, the structure known as the “shelter object” (SO, or more informally, the “sarcophagus”) for burying the Fourth Power Unit of the Chornobyl Nuclear Power Plant was rapidly erected around the crippled reactor the same year as the accident. The entire emergency response included debris removal from the ChNPP site, the construction of the enclosing sarcophagus, and clean-up activities within the surrounding area involving more than 500,000 personnel, termed “liquidators” [1].
At the time of construction, the design lifetime of the SO was estimated at 30 years [3]. Following the collapse of the USSR in 1992, the Government of Ukraine announced an international competition for projects and technical solutions for the transformation of the shelter object facility. In 1995, the President of Ukraine signed a memorandum of collaboration with leaders of the G7 group of leading industrialized countries, as well as the Commission of European Communities, to support Ukraine in its activities at Chornobyl. A core condition of this involvement was the shutdown of the other RBMK units at ChNPP that were still operational, despite the earlier accident at the neighboring reactor Unit 4. A year later, in December 1997, the Chornobyl Shelter Fund (CSF) was established with the purpose of funding the Shelter Implementation Plan (SIP). This multinational program was completed in 2020 with the construction and commissioning of the New Safe Confinement (NSC), the dome-shaped, environmentally sealed structure that attracted enormous global media coverage as it slowly slid into place to completely enclose reactor Unit 4 alongside the surrounding SO. Such a momentous engineering accomplishment ensured compliance with safety and operational requirements for the next 100 years, including during the planned decommissioning and dismantling of both reactor Unit 4 and the SO.
However, delivery of the NSC is only an intermediate milestone in the multi-faceted and extensive journey to de-risk the considerable global hazard represented by Chornobyl. The program of fuel-containing material (FCM) removal and radioactive waste (RAW) processing, including its subsequent disposal in a RAW repository (whether near-surface or deep geological), needs to be completed within the operational lifetime of the NSC. As the structures within the NSC rapidly fatigue and degrade with age, prompt action is necessary to prevent the failure of the SO that could collapse onto the destroyed and itself very fragile Unit 4 and result in the release of highly radioactive dust, including particles of nuclear fuel, alongside an accompanying surge in dose-rate [4]. However, little or no meaningful work inside the NSC can be reliably designed and undertaken without accurate estimates of the radiation levels (and the associated distribution) that will likely affect both personnel and equipment. The basis for such assessments is radiation mapping, and, more appropriately for Chornobyl, three-dimensional and time-resolved gamma-field determination, both prior to as well as continually throughout operations.

1.2. Radiation Detection, Localisation, and Mapping

The scientific and engineering concepts and principles underlying radiation detection and the subsequent use of such technologies for mapping variations in both gamma and neutron field(s) are long-established [5], with series of technical papers having been published detailing the processes and best practices [6,7,8]. Although technologies have seen continued advancement over recent decades, following the March 2011 accident at Japan’s Fukushima Daiichi Nuclear Power Plant (FDNPP)notable advancements in the unmanned aerial vehicle (UAV) [9,10,11], unmanned ground vehicle (UGV) [12,13], and static/mobile distributed detection systems [14] were realized. Even years after this driver, progress continues across radiation detection, localization, and mapping, whether in underpinning detector materials research (e.g., novel plastics, high-dose semiconductors, dual gamma-neutron scintillators) [15,16,17,18]; innovative, autonomous, and miniaturized deployment mechanisms [19,20,21]; or sensor-fusion/data visualization methodologies, progressing from 2D to 3D scenarios [22,23,24,25,26,27]. This research is not just occurring at a small number of institutions and laboratories, but it is a promising and increasingly cross-disciplinary area of active research around the world, applicable for nuclear plant decommissioning, nuclear security, and safeguards applications, whether or not in accident response [25].

1.3. 3-Dimensional Radiation Analysis

As formerly mentioned, one active research area that has evolved alongside increasingly powerful miniaturized computing and post-processing is the 3D radiation mapping technique known as “scene data fusion” (SDF). The graphic representation of complex geospatial datasets by rendering radiometric data onto scenic, context-providing data was initially developed by researchers at Lawrence Berkeley National Laboratory (LBNL) and the University of California, Berkeley (UCB), for illicit source detection and emergency response situations [28]. The LBNL SDF approach uses a localization and mapping platform (LAMP) in combination with CsI-based gamma-ray spectrometers and a CdZnTe-based Polaris gamma-ray imaging system. Such sensing platforms employ sensor fusion methods that integrate Lidar, visual (optical) cameras, and radiation interaction data from an array of composite detectors to cumulatively develop 3-dimensional scenic maps of radiological environments that are intuitive to end-users and non-experts alike [28,29].
Another approach, exploiting a system that utilizes a reduced number of detectors over LAMP, is termed Projective Linear Reconstruction (PLR), a technique presented by scientists from the University of Bristol. The PLR approach uses a computational method of radiological source localization from scanning survey measurements. The procedure uses an experimentally derived Detector Response Function (DRF) to perform a randomized Kaczmarz deconvolution on radiation field measurements acquired to date via a robotic deployment platform [30]. A simultaneous use of mathematical data processing tools for radiation mapping is also ongoing at the Institute of Environmental Geochemistry at the National Academy of Sciences of Ukraine [31].
Alongside these modern systems, which exploit enhanced back-end signal processing and numerical, graphic reconstruction/representation, other long-established methods of radioactive source localization and scene reconstruction also exist based on established detection technologies and data processing [32]. One such approach is the use of Compton Cameras, which exploit differential, consecutive scatter and absorption detectors to progressively reconstruct the “cone of incidence” or “conic projection” of the incident gamma-ray photons, thereby determining the position of the radioactive source [5,33,34].
A second class of established systems is the Gamma Camera, also termed a Scintillation Camera or Anger camera [5], which reconstructs the source position via a technique known as scintigraphy, a process originally developed for medical imaging applications where gamma-emitting radioactive tracers are utilized to explore and assess bodily functions. Unlike source reconstruction using a Compton Camera, a Gamma Camera uses only a single scintillator rather than a pair. To define the location of the source that would otherwise yield an uninformative (non-directional) detection event within the photon-counting, pulse-shaping, electronic-augmented scintillator monolith, either an array of collimators or a rotating and intricately patterned “coded-mas” is placed in front of the detection face between the source and camera [35,36]. While being vastly less computationally intensive as well as faster at reconstructing a scene containing a radioactive source than a Compton Camera system, the Gamma Camera requires an appreciable level of post-processing to accurately derive the position (in both 2D and 3D, with depth) of one or more radiation sources. Despite both approaches representing established means of radioactive source localization, advancements continue to improve on acquisition rates, positional accuracy, multiple-source delineation, dosimetric calibration, and size/mass reduction, with single-pixel compressive gamma-ray imaging using randomly encoded masks based on the principles of compressed sensing possessing the potential to exploit the sparsity typically found in Gamma Camera imagery. This work has led to a new class of fast and low-cost imaging systems [37].

1.4. Technology Application to the ChNPP

Despite many developments in modern detection hardware and accompanying software, there still exists a significant number of scenarios where practical application is impossible owing to the high dose rates that would be encountered, combined with complex and intricate deployment environments. The SO is one example of such a high-hazard and challenging site, where safety restrictions do not permit the involvement of people to undertake routine measurements and inspections within the confines of the NSC. As has been shown following several earlier deployments, the significant gamma and neutron radiation levels under the NSC and inside the SO can rapidly disable the sensitive electronics of measurement equipment and control systems of robotic carriers, rendering them inoperable. In addition, the inability to deploy any form of radio communication infrastructure or provisioning of a wired communication network throughout the maze of rooms that comprised Chornobyl reactor Unit 4 (destroyed during the accident and now contained within the SO) also limits the use of robotic devices, alongside the basic installation and usage of a comprehensive sensor network inside the SO.
These limitations are not trivial and, therefore, require the development and application of innovative approaches to properly understand the distribution of potentially lethal radiation levels under the NSC and to inform crucial future hazard-reduction and decommissioning operations. In the absence of a comprehensive detection/monitoring network within the SO that would accompany modern/current nuclear installations to provide operational and critical dosimetric information, the modern reprocessing of historical data provides the only practical solution. One such method of interpreting legacy data to derive a 3D representation of the present gamma radiation field surrounding the SO is presented in this work.
This paper first provides a brief introduction to the tools used to collect input data for the reconstruction of the radiation map surrounding the SO collected during the commissioning of the NSC over the old sarcophagus. The subsequent section details a model used to reconstruct the radiation map of the SO alongside the assumptions and simplifications applied to this model. Next, the algorithm used to reconstruct the distribution of the gamma field directly on the roof of the SO is presented. The paper concludes by comparing and validating the outputs of this reconstruction algorithm with physical dose-rate measurements obtained on the SO roof by a group of reconnaissance scientists from the Institute of Safety Problems of NPPs of the National Academy of Sciences of Ukraine. It is shown that with an increase in the number of iterations of the processing algorithm, the reliability of the approximation and convergence onto the true scenario increases. This reliability underlines the potential for the technique to be used to reconstruct the extant radiation environment from historical data, therefore facilitating safe future on-site activities and, in the case of Chornobyl, efficient decommissioning and dismantling of both reactor Unit 4 and the surrounding SO within the NSC.

2. Evolutional Computational Methodology for Radiation Mapping

2.1. Available Historic NSC and SO Radiometric Datasets

The dataset used in this study was obtained during the commissioning of the Main Cranes System (MCS) of the NSC. The MCS integrates two overhead bridge cranes with two 50 tonnes (55 US tons) trolley hoists that together work in tandem to handle loads up to 100 tonnes (110 US tons). Both the cranes and hoists are managed via a dedicated control system to allow their integrated usage within the NSC. The MCS bridges are each 96 m (315 feet) long and operate along a 150 m (492 foot) long runway track with six rails under the roof of the NSC building, above the shelter object at a height of 80 m. A third trolley suspends a Mobile Tool Platform (MTP) that is eventually to be equipped with a robotic arm system comprising various function-specific tools. It is here that the detector instrument was placed on the “safe trolley” of the MCS, with a slight offset from the center of its movement axis, on the north side of the trolley under its floor, at the level of the lower plane of the MCS movement, such that the detector is shielded from above by the MCS structural elements.
The radiation detection system mounted onto the MCS comprises ruggedized ECOTEST® Group BDBG-09 “Intelligent Detecting Unit of Gamma Radiation” dual scintillator and Geiger-Muller devices combined with an ARM-based single board computer, with communication provided through a dedicated Wi-Fi interface [38,39]. A BDBG-09 detector is capable of outputting gamma dose-rate (GDR) measurement across a dose-rate range of 0.05 μSv/h to 10 Sv/h, with a relative error of ±17% [39]. With its environmentally sealed nature, wide dose range, broad thermal operating window, and low power consumption, it is widely used across the nuclear industry in Ukraine, France, Bulgaria, and Korea. The aforementioned single board ARM-based computer hosts the software developed for this application, providing an interface with the intelligent detector BDBG-09, processing primary information, and accumulating information in a local database (in case of a connection failure), as well as an interface with the existing NSC radiation monitoring system via a secure, encrypted Wi-Fi channel [38,40].
During the routine operation of the MCS, trolley movements and GDR measurements were continually obtained by the sensor, with values from 230 μSv/h to 28,490 μSv/h recorded by the NSC’s Integrated Control System (ICS) and subsequently archived on the historical server. All measurements were obtained in the same horizontal plane. As a result, data on the GRD distribution (at the level of the MCS equipment above the SO) was obtained [38]. All of the gamma-ray point sources are, therefore, considered to be isotropic, with the detector uncollimated but omnidirectional. As a result, the subsequently detailed model does not consider the existing but poorly studied effect of gamma-ray re-reflection from the shell of the New Safe Confinement since the real detector is shielded from such radiation by the MCS.
For each square meter in that plane under the MSC, the pair x , y were assigned as coordinates, where x and y are integer numbers of meters from the beginning of the MCS coordinate system. If the MCS trolley visited a certain square with coordinates x , y , then all GDR measurement values for that location were recorded, and the arithmetic mean for all such records was calculated as value γ x y . Each γ x y is linked as a value of «virtual detector» S j   x , y coordinates.

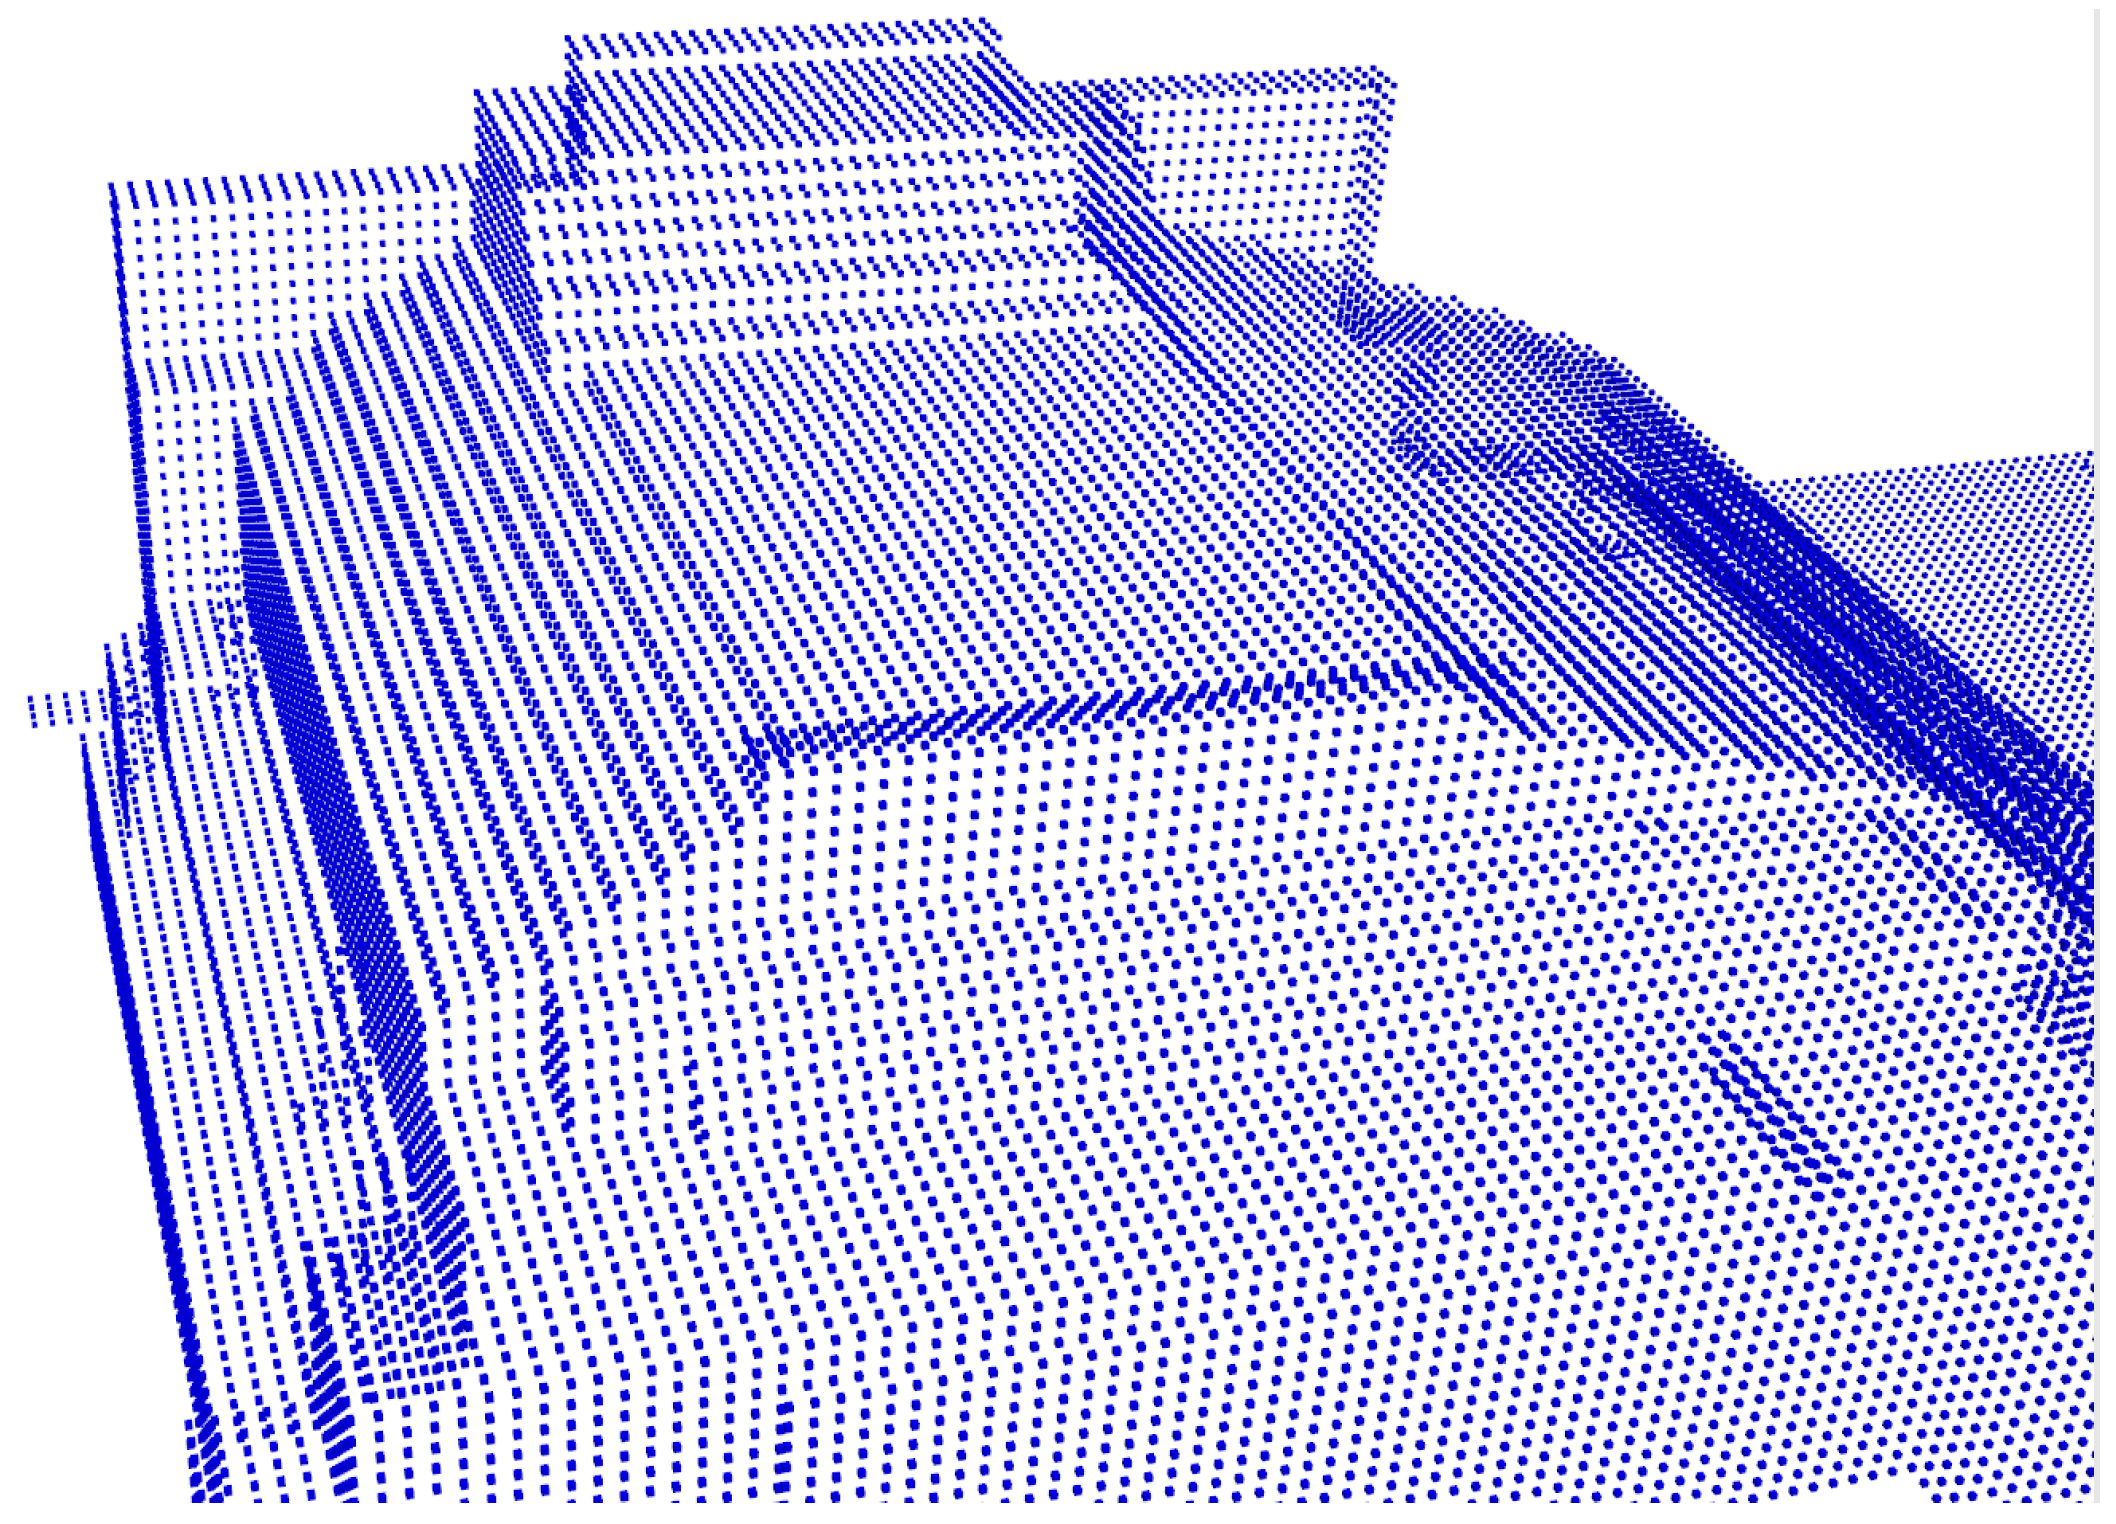
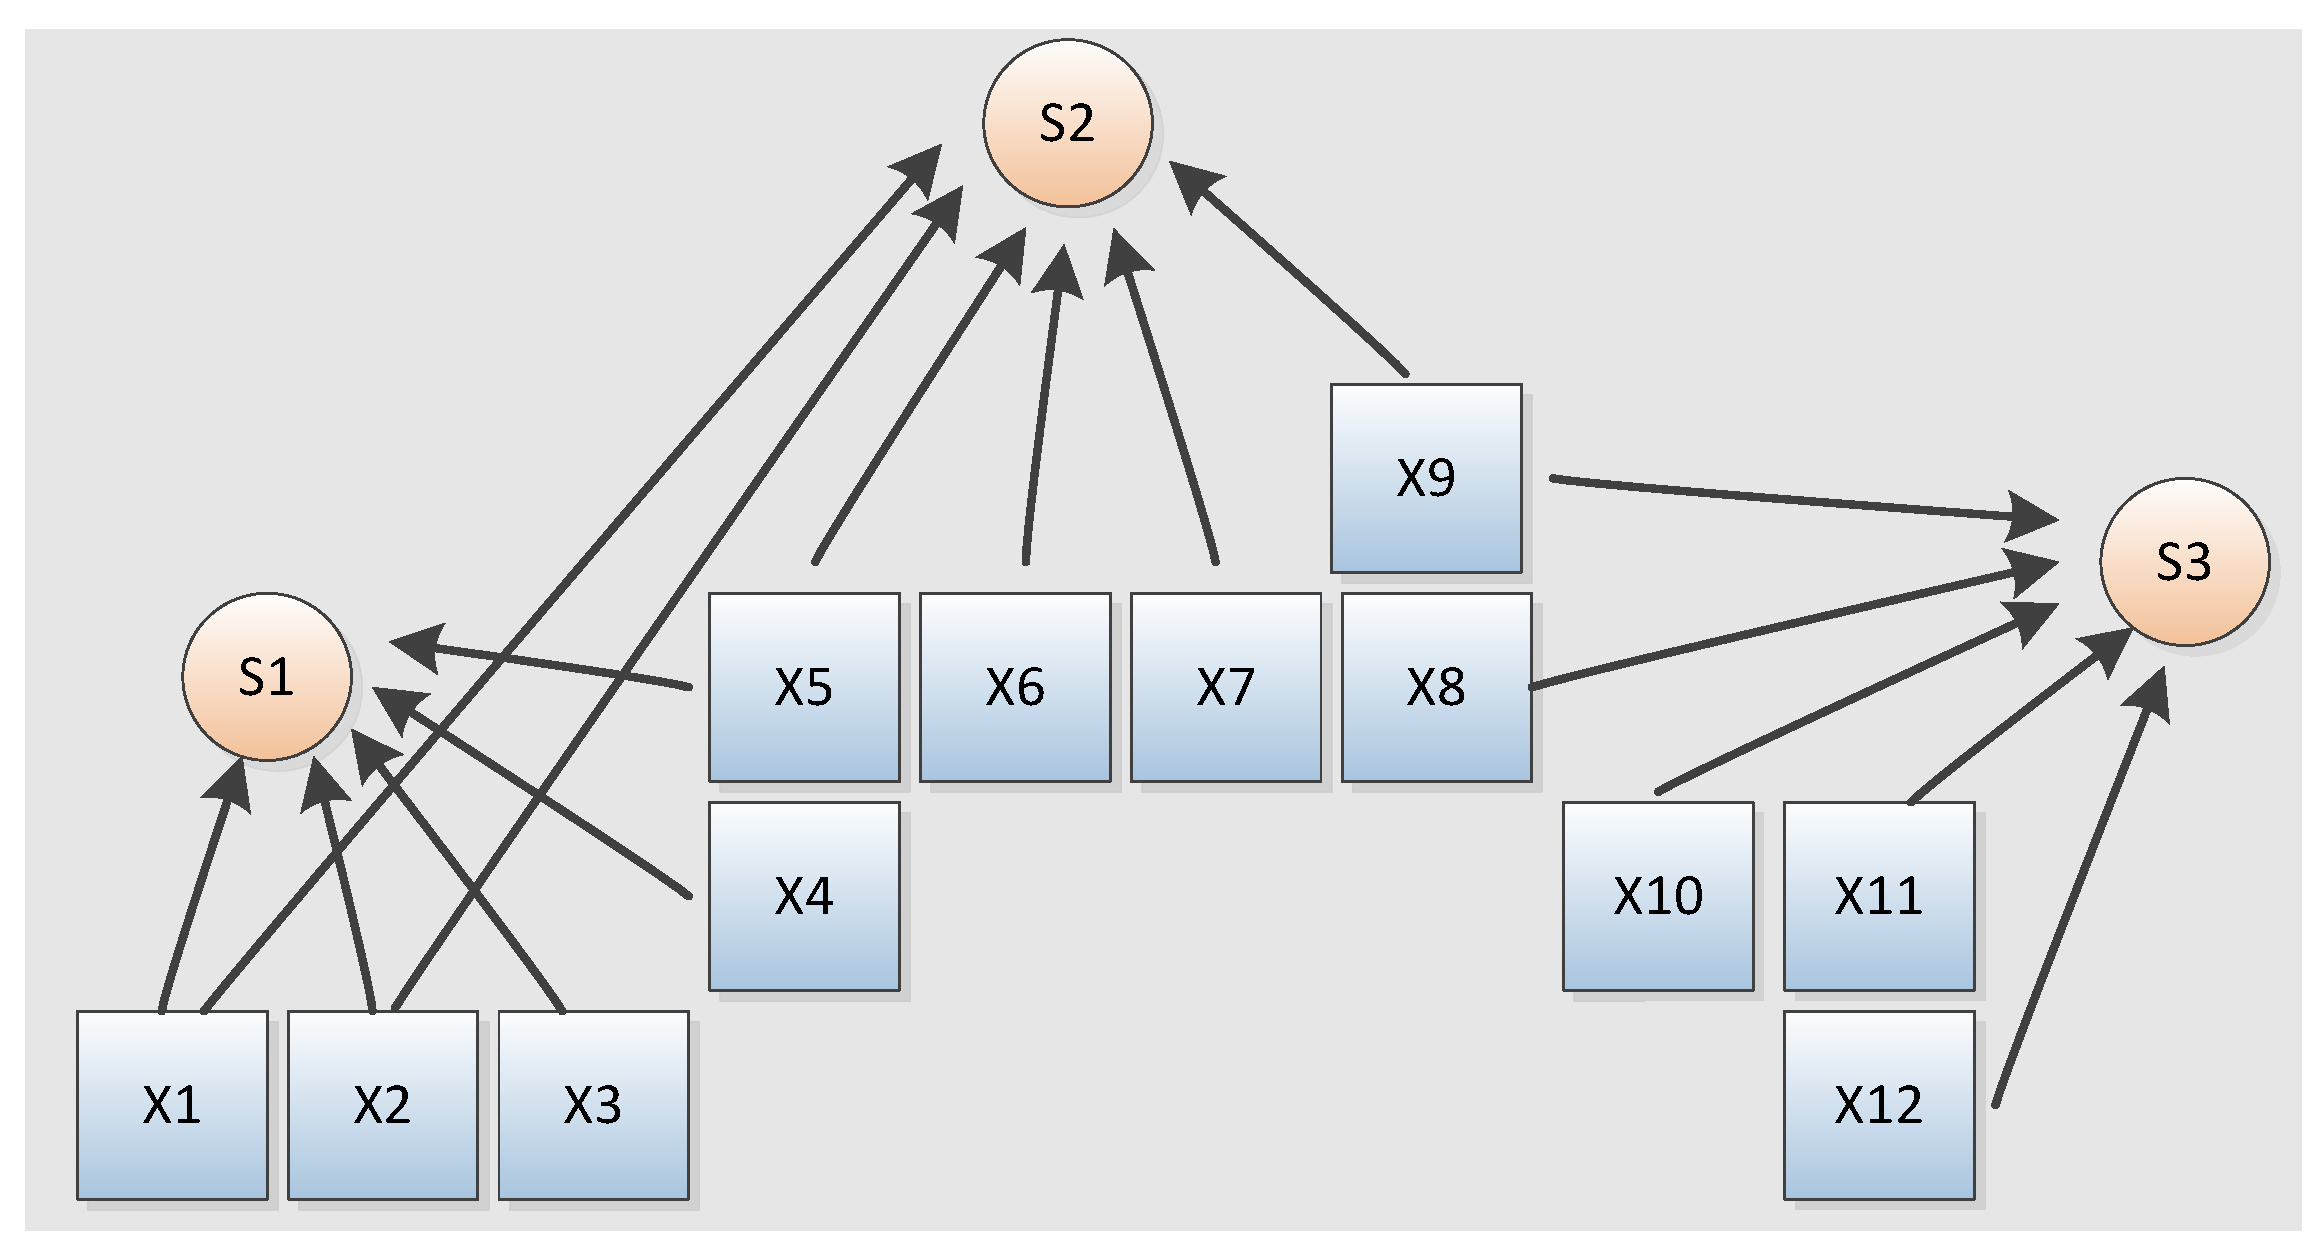
2.2. Simplified Radioactivity Model of the Shelter Object

The 3D geometric model of the SO is simplified for the purposes of this study, compounded by the limited amount of detailed information that exists relating to the Matryoshka doll-like configuration of the structure (the original concrete building and other materials, enclosed by the outer shell) and the unknown source-term contained within. As such, the SO was modeled as a suite of isotropic gamma point sources with a step of 1 m, located on its outer shell, as shown in Figure 1. No internal sources or other available information is hence used.
As a true model of the SO would possess considerable uncertainties, predominantly because of the unknown “media” between the real, multiple sources and sensors, this evolutional algorithm approach simplifies the scenario by representing the radioactivity as external “contamination” of the SO shell via point sources with a consistent step spacing of 1 m. Owing to workers and equipment operating outside the SO exterior during decommissioning activities, it is of limited significance if the radioactive source is on the shell or behind the shell in 30 m, under 15 cm of concrete or debris. Therefore, such a surface-based model can be considered applicable and appropriate.
The model does not consider the existing but poorly studied effect of gamma-ray re-reflection from the shell of the NSC since the real detector is shielded from such radiation by the above-mounted MCS.
Here, the photon flux reaching the omnidirectional detector from each point source, accounting for the decrease with increasing distance (inverse square law), is modeled. In this simplified model, S = F a 1 , , a n × m ; x 1 , , x n , the activity measured by the sensor, S j within coordinates x , y , is expressed in (1).
S j = i = 1 n a i j × x i + φ j
where x i is the activity in the point i , a i j is the coefficient of decrease that depends on the distance between sensor S j , and point x i , and φ j represent the uncertainty associated with measurement error and other random factors. This is represented graphically in Figure 2.
Then, for all “virtual detectors” and all point sources, modeling SO as an underdetermined system of linear Equation (2) can be constructed.
S 1 = i = 1 n a i 1 × x i + φ 1 S j = i = 1 n a i j × x i + φ j S m = i = 1 n a i m × x i + φ m
However, some constraints in (3) are linked to the fact that the photon flux cannot not be negative and practically could not exceed a reasonable value. It should be noted that the set of equations in (3) does not comprise an Objective Function, instead comprising a constraint only, with the Objective Function that which is being optimized, while the fitness function is used to guide to such an optimization. The Objective Function is the value of the approximation error.
i 1 , n , j 1 , m | V m i n < x i < V m a x , a i j > 0
Here V m a x and V m i n are a maximum and a minimum of the dose-rate in the actual system. Thus, the construction of the gamma-ray map is reduced to finding some approximation to the solution of this system of equations with practical accuracy.

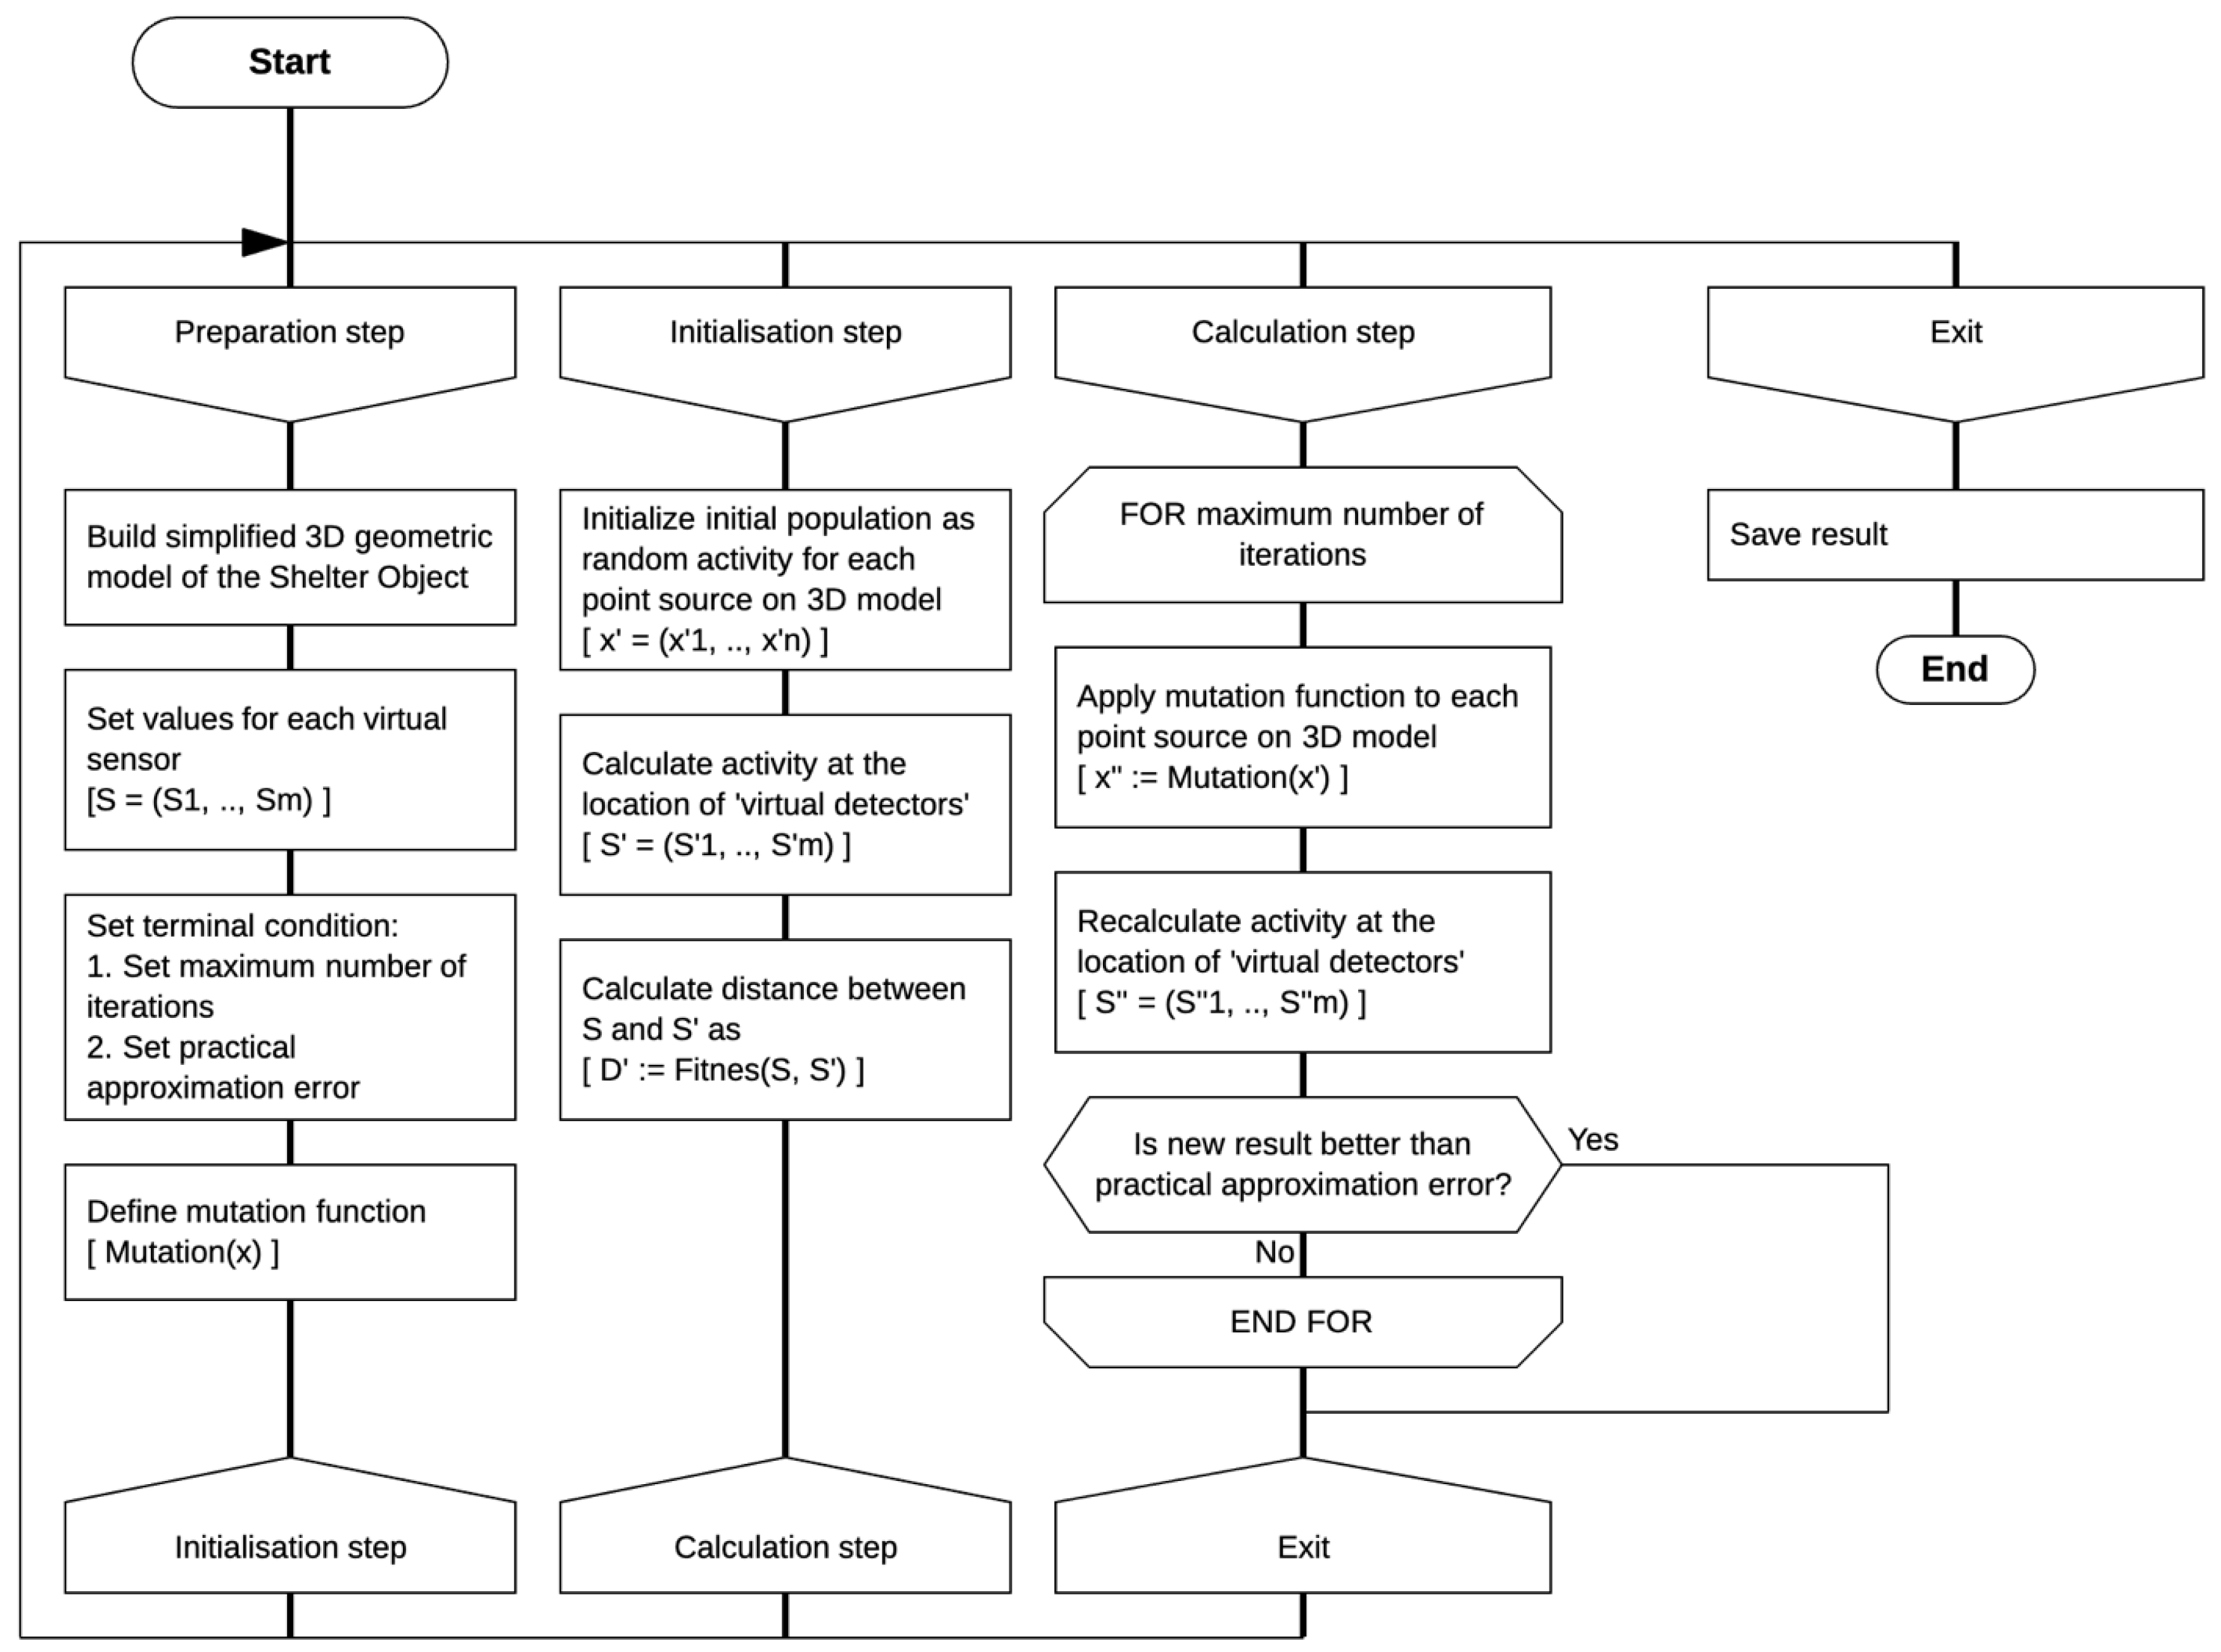
2.3. Algorithm Description

Evolutionary algorithms comprise search algorithms that operate by evolving a population of solutions through repeated transformations [41], with such an implementation representing an adaptation of evolutionary algorithm computing. The foundational techniques of evolutionary algorithms were inspired by biological evolution, the change in the heritable characteristics of biological populations over successive generations. There exist two primary ways in which such algorithms can be represented; pseudocode and flowchart. In this instance the pseudocode representation of the general evolutionary algorithm is considered to be more informative and is detailed simplistically below (Algorithm 1);
Algorithm 1 Pseudocode
BEGIN
  INITIALISE population;
  DEFINE FUNCTION Mutation();
  DEFINE FUNCTION Fitness();
  DEFINE FUNCTION Terminal_Condition();
  REPEAT
    new_population:= Mutation(population);
    IF (Fitness(new_population) BETTER THAN Fitness(population))
    THEN population:= new_population;
    END IF
    IF
  UNTIL Terminal_Condition();
END
Wherein “population” holds the representation of the current solution in the form of a set of individuals (partial solutions of the problem); “mutation” represents a function whose inputs change to individuals’ properties in the next generation of the population; “fitness function” accepts the candidate solution and outputs a value that evaluates the suitability of the candidate solution to the target goal; and “terminal condition” is a criterion for termination of the algorithm. Typically, the algorithm ceases when a solution with acceptable accuracy is found or other limiting parameters are attained (e.g., the maximum number of iterations or time, the value does not improve). This approach represents general evolutional rather than a variation of a genetic algorithm, resulting from the authors’ wish to keep the mutation function open for future developments, such as the parallelization of the main loop with different concurrent mutation functions.
To solve (3), the general evolutionary method of problem-solving was modified and is presented in the DRAKON visual programming language notation [41], as shown in Figure 3.
In this case, we consider vector x 1 , x i , x n as a population of individuals. The fitness function will be the computation of distance between vectors S 1 , S j , S m and S 1 , S j , S m , where S j = i = 1 n a i j × x i . So, the population x 1 , x i , x n will be “better” than x 1 , x i , x n if the distance between vectors S 1 , S j , S m and S 1 , S j , S m will be less than distance between vectors S 1 , S j , S m and S 1 , S j , S m .

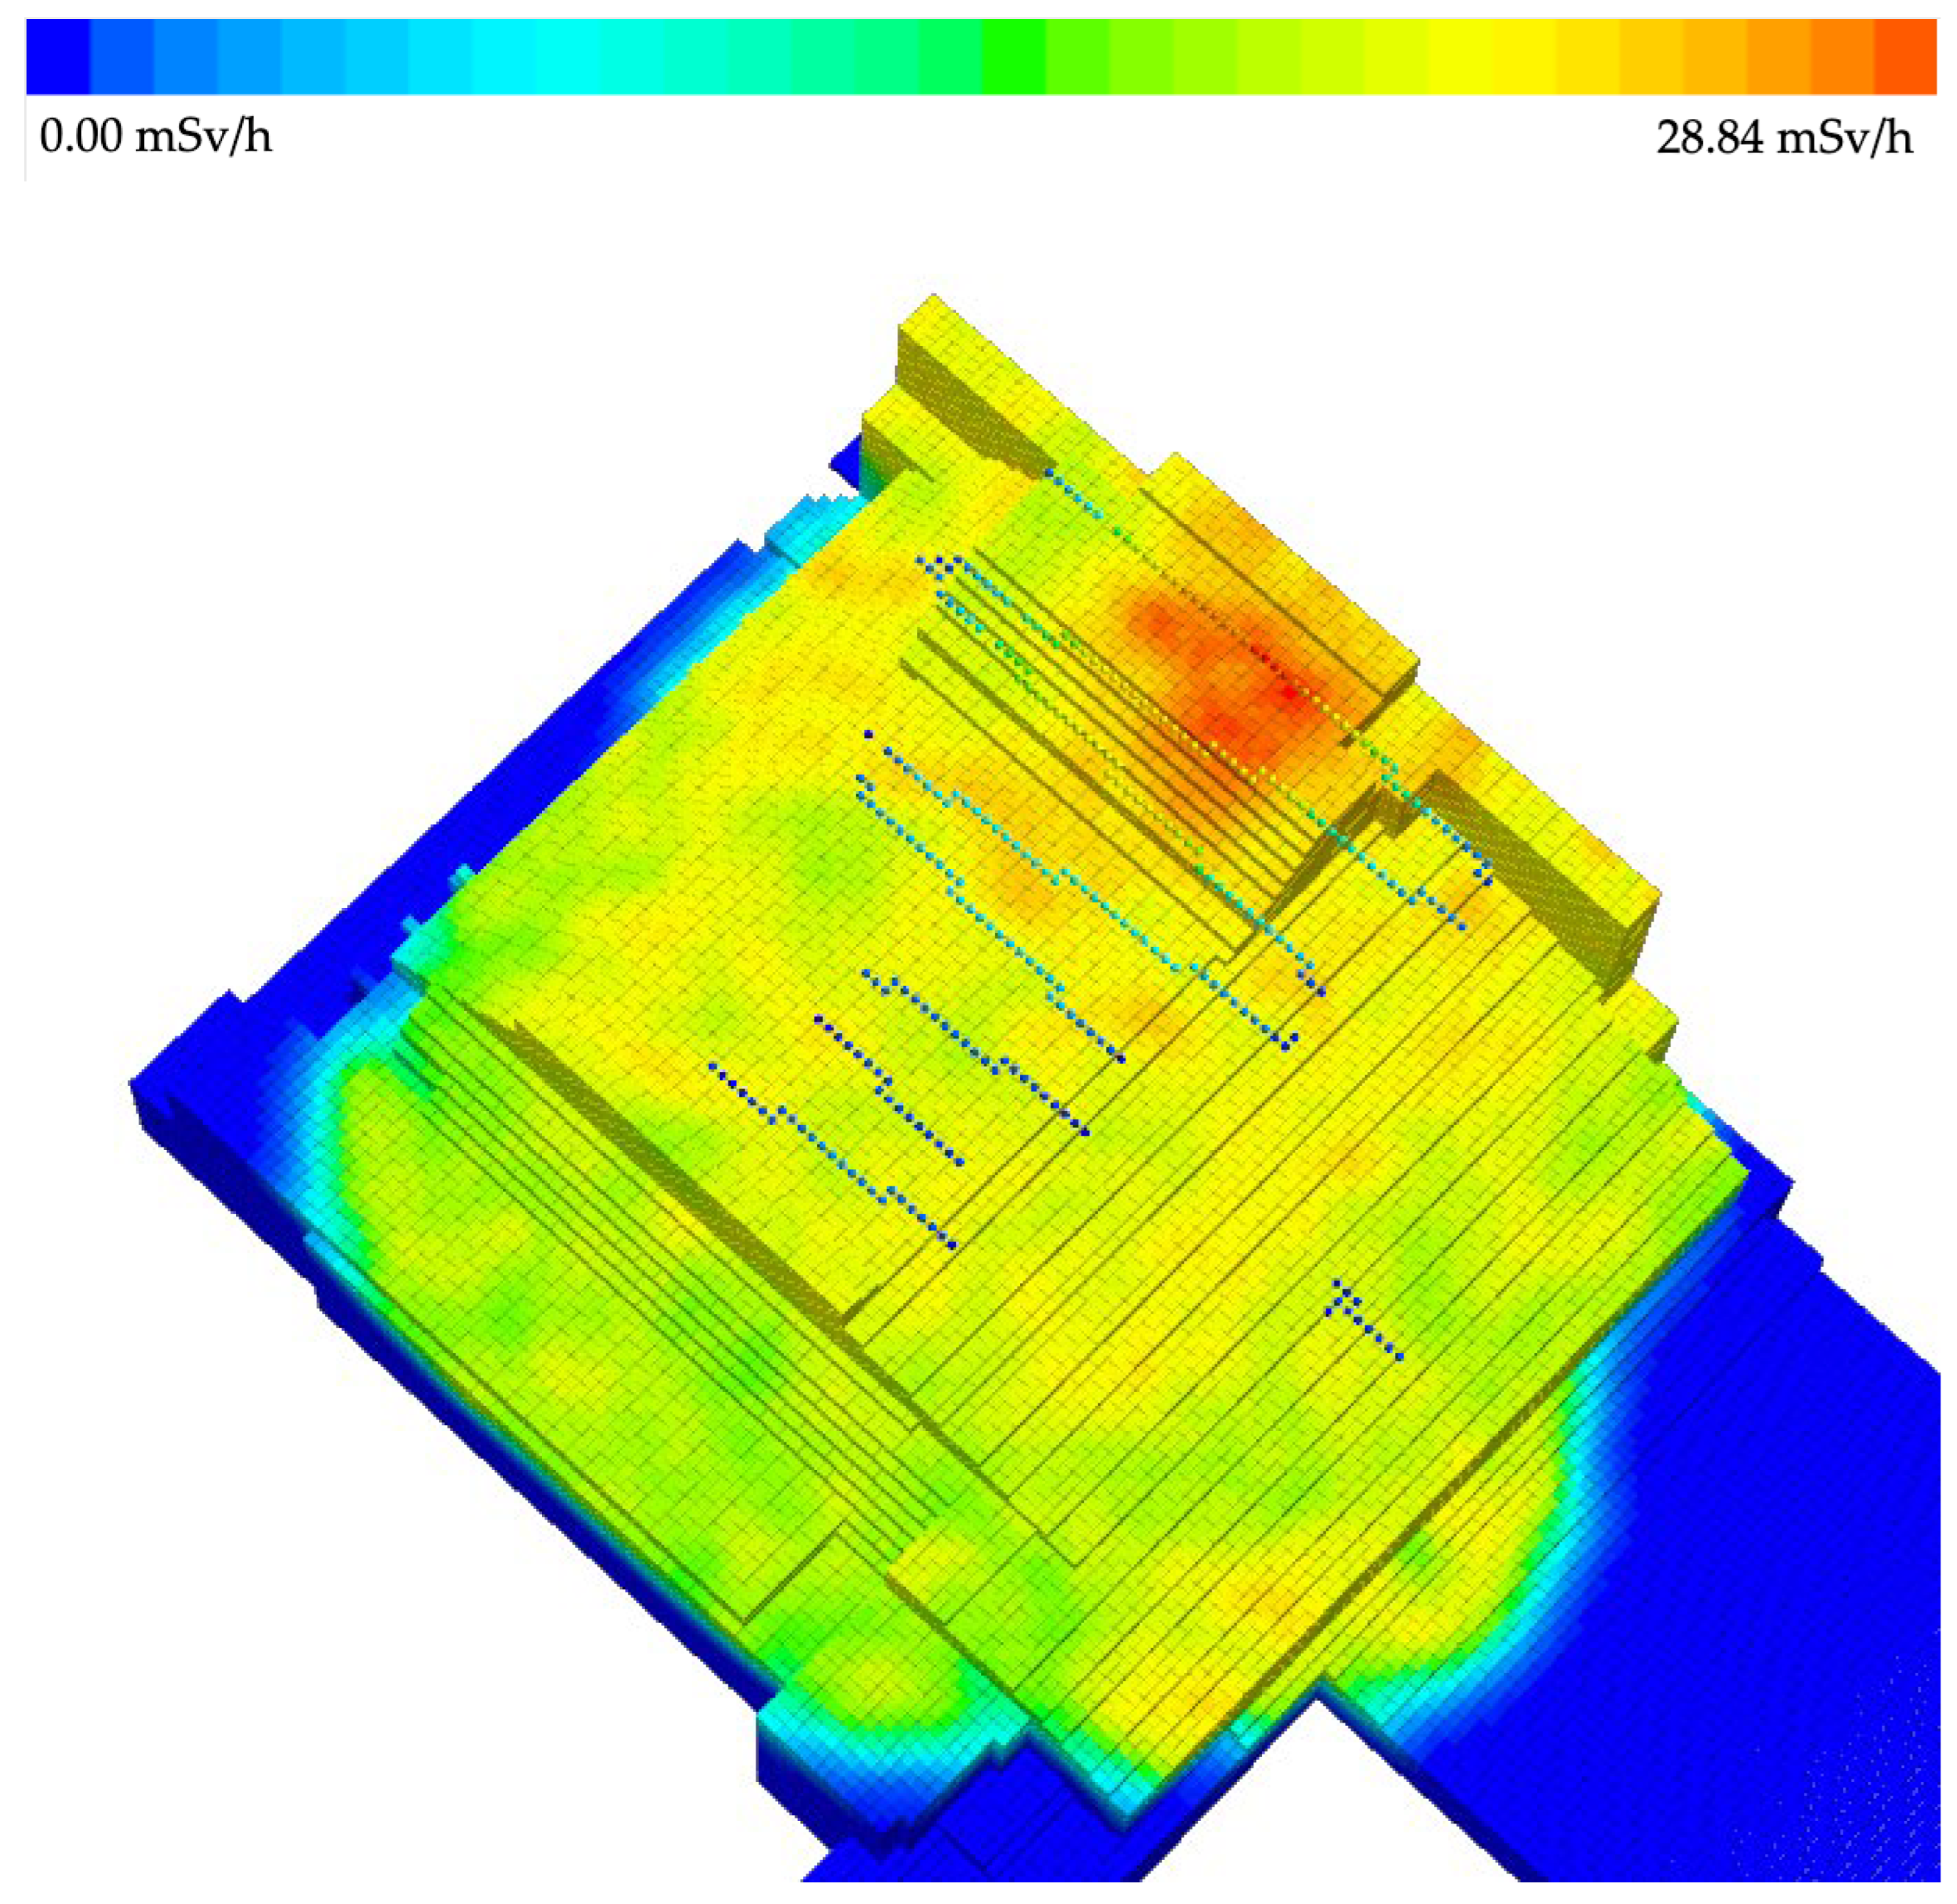
3. Results and Discussion

Figure 4 details the result of 7000 iterations of the algorithm detailed above, with visualization using the Mayavi 3D visualization library for the Python programming language [42]. Each modeled point source on the shell of the shelter object is represented as virtual cubes, with edge lengths of 1 m. The color of the cube displays the activity value in the range from blue (low) to red (high). The “virtual detectors” are represented in the form of spheres, each with a conventional diameter of 0.75 m, wherein the colour of the sphere is also coded, in the range from blue to red, with increasing dose-rate.
The quality of the implementation of the proposed algorithm was assessed by comparing both individual values of the activities S j , measured by the sensor in the coordinates x , y and activity evaluations S j ^ , obtained with the algorithm, as well as arrays of measurements and their estimates. The following were used as quality measures for the arrays of activity values: approximation error σ a p p r o x (4), Mean Absolute Percentage Error (MAPE) (5), approximation reliability R S j , S j ^ 2 (6):
σ a p r o x = j = 1 n S j S j ^ 2 n m
where n is the volume of the array under study and m is the number of parameters in the model (1),
M A P E = 1 n j = 1 n S j S j ^ S j × 100 %
R S j , S j ^ 2 = j = 1 n S j S j ^ 2 j = 1 n S j S j ¯ 2
where S j ¯ = 1 n j = 1 n S j , arithmetic average of the activity values measured by the sensor.
While the authors note that other differing and complementary error quantifications such as Mean Absolute Error (MAE), Root-Mean-Square Deviation (RMSE), and, especially, Mean Relative Error (MRE) could be used, this work proceeded by assessing the quality of the model and the simulation results, considering the structure of the model over the entire range of values of the measured quantities and iterations. Hence, MAE was not used since it is a linear estimate whereby all errors are weighted equally on average.
Furthermore, since no anomalous values of simulation results were observed during the simulation, even on a small number of iterations, the RMSE metric, which can be considered sensitive to anomalous values (large errors have a disproportionately large effect on the RMSE), was also not used. In the case of MRE, this measure shows the magnitude of the absolute error relative to the actual value of the output variable (hence, this error is often referred to as the average relative absolute error, or MRAE) and can show significant variation with input variable magnitude. In contrast, the MAPE error is easy to interpret and has a scale for evaluating the quality of simulation results.
The dependence of the approximation absolute error on the number of iterations of the algorithm are shown in Figure 5, with this approximation error used not only as a measure of model quality, but also to control the number of iterations, reaching the minimum error value indicating the end of the algorithm. An R2 error can also be used to evaluate the quality of a regression model. However, in this instance, error values are not considered, rather the value that depicts how much better the given model works than the model where only the constant is present, while the input variables are absent or the regression coefficients with them are equal to zero. In this work, the R2 value shows the proportion of variance of the dependent variable explained by the regression model.
The best approximation of true measurements by activity estimates obtained by the algorithm is achieved at the minimum value of the approximation error, which corresponds to 2000 iterations. It is noted that the algorithm’s execution time has no importance and could be optimized by parallelization of the main loop, with the number of iterations in this proof-of-concept study limited for practicality reasons. Without the optimization of the mutation function, the ability to obtain a “better” population decreases with the growth of the number of iterations. Such a behavior could also be used as a termination condition of the algorithm.
The dependence of the MAPE percentage error on the number of iterations of the algorithm is shown in Figure 6. Supporting other assessment metrics, this MAPE error is easy to interpret and has a scale for assessing the quality of modeling results, allowing an assessment of the quality of the model.
The mean absolute percentage error of MAPE (Figure 6) indicates the quality of the approximation and if MARE ≤ 10%, the approximation accuracy is excellent; 10% < MARE ≤ 20%, the approximation accuracy is good; 20% < MARE ≤ 50%, then this accuracy is satisfactory; and if MARE > 50%, then the solution is deemed unsatisfactory.
Such dependence of the approximation accuracy (percentage error) on the number of iterations of the algorithm is subsequently shown in Figure 7.
Together, the analysis results of the algorithm show that, as the number of iterations increases, the reliability of the approximation also increases. This correlates with the values of the MAPE error, whereby the value decreases with increasing the number of iterations of the algorithm. The utilization of these three aforementioned metrics together provides a means to evaluate the modeling results obtained from the perspective of algorithm implementation, alongside the quantitative and qualitative aspects of the results obtained.

4. Conclusions

This works provides application-specific results from which to further consider evolutionary computational methods for radiation mapping problems in conditions where the use of other solutions is not advisable based on the As Low as Reasonable Acceptable (ALARA) principle for radiation protection.
Under the conditions of Chornobyl, where the radiation source term is characterized by significant non-uniformity and irregularity, the only practical method is the construction of radiation maps by the method of spatial interpolation using a regular network of measurements. Such an interpolation network is formed directly from measurement outputs of radiation survey meters operated by humans or a remotely controlled apparatus, and therefore has a high dose “cost”. At the same time, the accuracy of the method utilized in this work on a complex scenario such as the Chornobyl sarcophagus, where any measurement is a superposition from many sources, significantly exceeded the initial expectations of the results. However, further research and evolution of the approach is needed, including improvements to the method for parallelizing the evolution of solutions and population control in addition to validating the method on other objects with more complex radiation emission characteristics.
It is noted that the purpose of this study was not to present the most complete and perfect algorithm, but to provide a real-world example of the practical possibility of using evolutionary algorithms in complex radiation mapping scenarios. There exist several ways to improve this algorithm. For example, it is apparent that the speed of the algorithm significantly depends on the initial approximation and mutation strategies. It is the viewpoint of the authors that the most important result is that despite its simplicity, it is possible to obtain an acceptable result in a comparatively small number of iterations (generations, in evolutionary parlance).

Author Contributions

Conceptualization, M.S. and M.P.; methodology, M.S. and M.P.; software, M.P.; validation, I.S. and P.G.M.; formal analysis, M.S. and M.P.; investigation, M.P.; resources, M.S., T.B.S. and P.G.M.; data curation, M.S.; writing—original draft preparation, M.S. and M.P.; writing—review and editing, I.S., P.G.M. and T.B.S.; visualization, M.P. and P.G.M.; supervision, M.S. and T.B.S.; project administration, M.S. and P.G.M.; funding acquisition, M.S. and T.B.S. All authors have read and agreed to the published version of the manuscript.

Funding

The authors wish to acknowledge UK Research and Innovation, specifically the Engineering and Physical Sciences Research Council (EPSRC), for their funding via the Robotics and AI in Nuclear (RAIN) Project (EP/W001128/1) who have supported work in, and collaborations with Ukraine. PGM acknowledges the funding provided by the Royal Academy of Engineering (RAEng) as part of his Research Fellowship. TBS also thanks the Royal Academy of Engineering for their direct funding via the academy Fellowships scheme. Support for this work was additionally provided through the NATO Science for Peace and Security (SPS) Programme (SPS.MYP-G5913).

Data Availability Statement

Not applicable.

Acknowledgments

The authors would like to express their gratitude to all staff of the Chornobyl NPP, and personally O. Novikov and S. Kondratenko; the staff of the Institute for Safety Problems of Nuclear Power Plants of NAS of Ukraine who devoted their lives to the research of OU and, personally, V. Krasnov, A. Levchenko, P. Sabenin, and A. Andreev, as well as young scientists who performed measurements on the OS roof, S. Kupriyanchuk, D. Khomenko, and others.

Conflicts of Interest

The authors declare no conflict of interest, financial or otherwise.

References

  1. International Atomic Energy Agency (IAEA). Environmental Consequences of the Chernobyl Accident and their Remediation: Twenty Years of Experience; International Atomic Energy Agency: Vienna, Austria, 2006; Available online: https://www-pub.iaea.org/MTCD/Publications/PDF/Pub1239_web.pdf (accessed on 4 January 2023).
  2. UN Chernobyl Forum Expert Group “Environment”. Environmental Consequences of the Chernobyl Accident and Their Remediation: Twenty Years of Experience. Report of the UN Chernobyl Forum Expert Group “Environment” (EGE). Available online: https://www-ns.iaea.org/downloads/rw/meetings/environ-consequences-report-wm-08.05.pdf (accessed on 3 March 2023).
  3. Nosovskij, A.V.; Vasil’chenko, V.N.; Klyuchnikov, A.A.; Prister, B.S. Accident on the Chernobyl Nuclear Power Plant. Getting over the Consequences and Lessons Learned (in Russian). Available online: http://inis.iaea.org/Search/search.aspx?orig_q=RN:40004144 (accessed on 19 January 2023).
  4. Nemchinov, Y.Y.; Bambura, A.M.; Sazonova, Y.P.; Babyik, K.M.; Shcherbyin, V.N.; Rud’ko, V.M. Assessment of the Shelter Structures to Be Dismantled after NSC Installation. Comparative Analysis of Dismantling Options. Yaderna ta Radyiatsyijna Bezpeka 2019, 1, 17–22. Available online: http://inis.iaea.org/Search/search.aspx?orig_q=RN:50038573 (accessed on 19 January 2023). [CrossRef]
  5. Knoll, G.F. Radiation Detection and Measurement; John Wiley & Sons: Hoboken, NJ, USA, 2010. [Google Scholar] [CrossRef]
  6. IAEA. Radioelement Mapping; International Atomic Energy Agency: Vienna, Austria, 2010; Available online: https://www.iaea.org/publications/7649/radioelement-mapping (accessed on 30 March 2020).
  7. Tsoulfanidis, N.; Landsberger, S. Measurement and Detection of Radiation, 4th ed.; CRC Press: Boca Raton, FL, USA, 2015; Available online: https://books.google.co.uk/books?hl=en&lr=&id=zRjSBQAAQBAJ&oi=fnd&pg=PP1&ots=ValJlvS7qj&sig=4JJ67_m48q6yyUCo1JsNuU_q2pU (accessed on 19 August 2016).
  8. IAEA. Guidelines for Radioelement Mapping Using Gamma Ray Spectrometry Data, IAEA-TECDOC-1363; International Atomic Energy Agency: Vienna, Austria, 2003; Available online: https://www-pub.iaea.org/MTCD/publications/PDF/te_1363_web.pdf (accessed on 22 February 2021).
  9. Sanada, Y.; Torii, T. Aerial radiation monitoring around the Fukushima Dai-ichi Nuclear Power Plant using an unmanned helicopter. J. Environ. Radioact. 2015, 139, 294–299. [Google Scholar] [CrossRef] [PubMed]
  10. Nishizawa, Y.; Yoshida, M.; Sanada, Y.; Torii, T. Distribution of the134Cs/137Cs ratio around the Fukushima Daiichi nuclear power plant using an unmanned helicopter radiation monitoring system. J. Nucl. Sci. Technol. 2015, 53, 468–474. [Google Scholar] [CrossRef]
  11. Shikaze, Y.; Nishizawa, Y.; Sanada, Y.; Torii, T.; Jiang, J.; Shimazoe, K.; Takahashi, H.; Yoshino, M.; Ito, S.; Endo, T.; et al. Field test around Fukushima Daiichi nuclear power plant site using improved Ce:Gd3(Al,Ga)5O12 scintillator Compton camera mounted on an unmanned helicopter. J. Nucl. Sci. Technol. 2016, 53, 1907–1918. [Google Scholar] [CrossRef] [Green Version]
  12. Lazna, T.; Gabrlik, P.; Jilek, T.; Zalud, L. Cooperation between an unmanned aerial vehicle and an unmanned ground vehicle in highly accurate localization of gamma radiation hotspots. Int. J. Adv. Robot. Syst. 2018, 15, 1729881417750787. [Google Scholar] [CrossRef] [Green Version]
  13. Peterson, J.; Li, W.; Cesar-Tondreau, B.; Bird, J.; Kochersberger, K.; Czaja, W.; McLean, M. Experiments in unmanned aerial vehicle/unmanned ground vehicle radiation search. J. Field Robot. 2019, 36, 818–845. [Google Scholar] [CrossRef]
  14. Coletti, M.; Hultquist, C.; Kennedy, W.G.; Cervone, G. Validating Safecast data by comparisons to a U. S. Department of Energy Fukushima Prefecture aerial survey. J. Environ. Radioact. 2017, 171, 9–20. [Google Scholar] [CrossRef] [Green Version]
  15. Hajagos, T.J.; Liu, C.; Cherepy, N.J.; Pei, Q. High-Z Sensitized Plastic Scintillators: A Review. Adv. Mater. 2018, 30, e1706956. [Google Scholar] [CrossRef]
  16. Ye, M.; Gong, P.; Wu, S.; Li, Y.; Zhou, C.; Zhu, X.; Tang, X. Lightweight SiPM-based CeBr3 gamma-ray spectrometer for radiation-monitoring systems of small unmanned aerial vehicles. Appl. Radiat. Isot. 2021, 176, 109848. [Google Scholar] [CrossRef]
  17. Jeon, B.; Kim, J.; Lee, E.; Moon, M.; Cho, G. Pseudo-Gamma Spectroscopy Based on Plastic Scintillation Detectors Using Multitask Learning. Sensors 2021, 21, 684. [Google Scholar] [CrossRef]
  18. Kaburagi, M.; Shimazoe, K.; Kato, M.; Kurosawa, T.; Kamada, K.; Kim, K.J.; Yoshino, M.; Shoji, Y.; Yoshikawa, A.; Takahashi, H.; et al. Gamma-ray spectroscopy with a CeBr3 scintillator under intense γ-ray fields for nuclear decommissioning. Nucl. Instrum. Methods Phys. Res. Sect. A 2021, 988, 164900. [Google Scholar] [CrossRef]
  19. Bilton, K.J. Data-driven Approaches to Spectral Gamma-Ray Source Detection and Identification. Ph.D. Thesis, University of California, Berkeley, CA, USA, 2020. [Google Scholar]
  20. Flanagan, R.R.; Brandt, L.J.; Osborne, A.G.; Deinert, M.R. Detecting nuclear materials in urban environments using mobile sensor networks. Sensors 2021, 21, 2196. [Google Scholar] [CrossRef] [PubMed]
  21. Marques, L.; Vale, A.; Vaz, P. State-of-the-Art Mobile Radiation Detection Systems for Different Scenarios. Sensors 2021, 21, 1051. [Google Scholar] [CrossRef]
  22. Sasaki, M.; Sanada, Y.; Katengeza, E.W.; Yamamoto, A. New method for visualizing the dose rate distribution around the Fukushima Daiichi Nuclear Power Plant using artificial neural networks. Sci. Rep. 2021, 11, 11. [Google Scholar] [CrossRef]
  23. Salathe, M.; Bandstra, M.S.; Quiter, B.J.; Curtis, J.C. Using 3D-Scene Data from a Mobile Detector System to Model Gamma-Ray Backgrounds. In Proceedings of the 2019 IEEE Nuclear Science Symposium and Medical Imaging Conference (NSS/MIC), Manchester, UK, 26 October–2 November 2019; p. 4. [Google Scholar] [CrossRef]
  24. Pavlovsky, R.; Cates, J.W.; Vanderlip, W.J.; Joshi, T.H.Y.; Haefner, A.; Suzuki, E.; Barnowski, R.; Negut, V.; Moran, A.; Vetter, K.; et al. 3D Gamma-ray and Neutron Mapping in Real-Time with the Localisation and Mapping Platform from Unmanned Aerial Systems and Man-Portable Configurations. arXiv 2019. Available online: http://arxiv.org/abs/1908.06114 (accessed on 29 January 2021).
  25. Vetter, K.; Barnowski, R.; Cates, J.W.; Haefner, A.; Joshi, T.H.; Pavlovsky, R.; Quiter, B.J. Advances in Nuclear Radiation Sensing: Enabling 3-D Gamma-Ray Vision. Sensors 2019, 19, 2541. [Google Scholar] [CrossRef] [PubMed] [Green Version]
  26. Bandstra, M.S.; Hellfeld, D.; Vavrek, J.R.; Quiter, B.J.; Meehan, K.; Barton, P.J.; Cates, J.W.; Moran, A.; Negut, V.; Pavlovsky, R.; et al. Improved Gamma-Ray Point Source Quantification in Three Dimensions by Modeling Attenuation in the Scene. IEEE Trans. Nucl. Sci. 2021, 68, 2637–2646. [Google Scholar] [CrossRef]
  27. Henderson, K.; Liu, X.; Stadnikia, K.; Martin, A.; Enqvist, A.; Koppal, S.J. Proximity-Based Sensor Fusion of Depth Cameras and Isotropic Rad-Detectors. IEEE Trans. Nucl. Sci. 2020, 67, 840–857. [Google Scholar] [CrossRef]
  28. Pavlovsky, R.; Haefner, A.; Joshi, T.; Negut, V.; McManus, K.; Suzuki, E.; Barnowski, R.; Vetter, K. 3-D Radiation Mapping in Real-Time with the Localization and Mapping Platform LAMP from Unmanned Aerial Systems and Man-Portable Configurations. arXiv 2018. Available online: http://arxiv.org/abs/1901.05038 (accessed on 29 January 2021).
  29. Bandstra, M.S.; Quiter, B.J.; Curtis, J.C.; Bilton, K.J.; Joshi, T.H.; Meyer, R.; Negut, V.; Vetter, K.; Archer, D.E.; Hornback, D.E.; et al. Attribution of gamma-ray background collected by a mobile detector system to its surroundings using panoramic video. Nucl. Instrum. Methods Phys. Res. Sect. A 2020, 954, 161126. [Google Scholar] [CrossRef]
  30. White, S.R.; Wood, K.T.; Martin, P.G.; Connor, D.T.; Scott, T.B.; Megson-Smith, D.A. Radioactive Source Localisation via Projective Linear Reconstruction. Sensors 2021, 21, 807. [Google Scholar] [CrossRef] [PubMed]
  31. Zabulonov, Y.L.; Popov, O.O.; Iatsyshyn, A.V.; Iatsyshyn, A.V.; Puhach, O.V.; Stokolos, M.O. Modern technical and software-analytical tools for solving problems of radiation and technogenic-ecological safety of Ukraine. IOP Conf. Ser. Earth Environ. Sci. 2022, 1049, 012013. [Google Scholar] [CrossRef]
  32. Anger, H.O. Use of a Gamma-Ray Pinhole Camera for in vivo Studies. Nature 1952, 170, 200–201. [Google Scholar] [CrossRef] [PubMed] [Green Version]
  33. Phillips, G.W. Gamma-ray imaging with Compton cameras. Nucl. Instrum. Methods Phys. Res. B 1995, 99, 674–677. [Google Scholar] [CrossRef]
  34. Everett, D.B.; Fleming, J.S.; Todd, R.W.; Nightingale, J.M. Gamma-radiation imaging system based on the compton effect. Proc. Inst. Electr. Eng. 1977, 124, 995. [Google Scholar] [CrossRef]
  35. Carrel, F.; Khalil, R.A.; Colas, S.; de Toro, D.; Ferrand, G.; Gaillard-Lecanu, E.; Gmar, M.; Hameau, D.; Jahan, S.; Laine, F.; et al. GAMPIX: A new gamma imaging system for radiological safety and Homeland Security Purposes. In Proceedings of the 2011 IEEE Nuclear Science Symposium Conference Record, Valencia, Spain, 23–29 October 2011; pp. 4739–4744. [Google Scholar] [CrossRef]
  36. Fenimore, E.E.; Cannon, T.M. Coded aperture imaging with uniformly redundant arrays. Appl. Opt. 1978, 17, 337. [Google Scholar] [CrossRef]
  37. Boardman, D.A.; Sarbutt, A.; Flynn, A.; Guenette, M.C. Single pixel compressive gamma-ray imaging with randomly encoded masks. J. Instrum. 2020, 15, P04014. [Google Scholar] [CrossRef]
  38. Istomin, N.; Pantin, M.; Saveliev, M. An example of import substitution in automated radiation control systems. In Proceedings of the INUDECO 2019, Slavutych, Ukraine, 24–27 April 2019; p. 102. [Google Scholar]
  39. ECOTEST Group Intelligent Detecting Unit of Gamma Radiation BDBG-09. Available online: https://ecotestgroup.com/products/bdbg-09/ (accessed on 5 January 2023).
  40. Saveliev, M.V.; Krasnov, V.A.; Levchenko, A.P.; Novikov, A.E.; Evstigneev, A.Y.; Pantin, M.A. Measuring the equivalent dose rate over the Shelter object after completion of the New Safe Confinement. Nucl. Power Environ. 2020, 19, 50–56. [Google Scholar] [CrossRef]
  41. Engelbrecht, A.P. Computational Intelligence: An Introduction, 2nd ed.; John Wiley & Sons: Hoboken, NJ, USA, 2007; Available online: https://books.google.co.uk/books?hl=en&lr=&id=IZosIcgJMjUC&oi=fnd&pg=PR7&dq=Engelbrecht,+A.+P.+(2007).+Computational+intelligence:+an+introduction.+John+Wiley+%26+Sons.&ots=Dxntv8xkPi&sig=rpSuTwa-jjlZQxoML_S3QY01-Qk&redir_esc=y#v=onepage&q=Engelbrecht%2C%20A.%20P.%20(2007).%20Computational%20intelligence%3A%20an%20introduction.%20John%20Wiley%20%26%20Sons.&f=false (accessed on 30 March 2023).
  42. Ramachandran, P.; Varoquaux, G. Mayavi: 3D visualization of scientific data. Comput. Sci. Eng. 2011, 13, 40–51. [Google Scholar] [CrossRef] [Green Version]
Figure 1. Simplified 3D geometric model of the shelter object, which houses the Unit 4 reactor.
Algorithms 16 00204 g001
Figure 2. Simplified model of radiation emission from the shelter object.
Algorithms 16 00204 g002
Figure 3. DRAKON visual programming language notation of the proposed evolutionary algorithm.
Algorithms 16 00204 g003
Figure 4. Result of 7000 iterations of the evolutional algorithm, yielding a color-scaled map of the radiation levels on the roof of the shelter object.
Algorithms 16 00204 g004
Figure 5. Dependence of the approximation accuracy on the number of iterations of the proposed evolutional method.
Algorithms 16 00204 g005
Figure 6. Dependence of the MAPE on the number of iterations of the proposed evolutional method, with reference to the absolute error.
Algorithms 16 00204 g006
Figure 7. Dependence of the approximation accuracy on the number of iterations of the algorithm, with reference to the percentage error.
Algorithms 16 00204 g007
Disclaimer/Publisher’s Note: The statements, opinions and data contained in all publications are solely those of the individual author(s) and contributor(s) and not of MDPI and/or the editor(s). MDPI and/or the editor(s) disclaim responsibility for any injury to people or property resulting from any ideas, methods, instructions or products referred to in the content.

