Article

Storytelling with Image Data: A Systematic Review and Comparative Analysis of Methods and Tools

1
School of Computing, Macquarie University, Sydney 2109, Australia
2
Computer Engineering Department, Sharif University of Technology, Tehran 14588-89694, Iran
*
Authors to whom correspondence should be addressed.
Algorithms 2023, 16(3), 135; https://doi.org/10.3390/a16030135
Submission received: 14 December 2022 / Revised: 23 February 2023 / Accepted: 24 February 2023 / Published: 2 March 2023

Abstract

:
In our digital age, data are generated constantly from public and private sources, social media platforms, and the Internet of Things. A significant portion of this information comes in the form of unstructured images and videos, such as the 95 million daily photos and videos shared on Instagram and the 136 billion images available on Google Images. Despite advances in image processing and analytics, the current state of the art lacks effective methods for discovering, linking, and comprehending image data. Consider, for instance, the images from a crime scene that hold critical information for a police investigation. Currently, no system can interactively generate a comprehensive narrative of events from the incident to the conclusion of the investigation. To address this gap in research, we have conducted a thorough systematic literature review of existing methods, from labeling and captioning to extraction, enrichment, and transforming image data into contextualized information and knowledge. Our review has led us to propose the vision of storytelling with image data, an innovative framework designed to address fundamental challenges in image data comprehension. In particular, we focus on the research problem of understanding image data in general and, specifically, curating, summarizing, linking, and presenting large amounts of image data in a digestible manner to users. In this context, storytelling serves as an appropriate metaphor, as it can capture and depict the narratives and insights locked within the relationships among data stored across different islands. Additionally, a story can be subjective and told from various perspectives, ranging from a highly abstract narrative to a highly detailed one.

1. Introduction

Due to the advancement of technology, a massive amount of data is generated on various offline/online platforms. Data analysis and Big Data are at the forefront of business and science today. These data are collected from online transactions, emails, images, videos, audio files, log files, posts, health records, social networking interactions, scientific data, sensors, and mobile phones. However, this Big Data is stored in different data islands that grow immensely and are challenging to capture, store, organize, analyze, and visualize. The challenges that big data carry include understanding the data, poor data quality, data scaling, incorrect integration, considerable costs, real-time data issues, and data verification. A substantial amount of this unstructured generated data consists of images and videos, e.g., on Google Images and surveillance cameras. Moreover, the emergence of social media has resulted in countless daily images uploaded by users on numerous online platforms, such as Instagram and Facebook [1]. Therefore, managing, curating, processing, and analyzing this vast amount of data is of significant importance. To be more specific, data analysis can help businesses better understand their customers, increase sales, improve customer targeting, diminish costs, and solve problems more effectively. It is used to evaluate data with statistical tools to discover useful information. Therefore, analyzing data is crucial in many organizations, businesses, and research studies, as well as academia.
Images are one of the essential categories among the vast available data. There are various means of processing and analyzing image data by assigning keywords, detecting objects, annotating, captioning, or creating a textual description. Thus, there has been an explosion of interest in this area, which is used in various applications such as image annotation, object detection, and image captioning. Various traditional computer vision approaches have been proposed for solving these tasks; however, they have limited capabilities. It is necessary to choose which features are important in each given image in traditional methods (feature selection step). The traditional approaches use well-established computer vision (CV) techniques such as feature descriptors (e.g., SIFT [2], SURF [3], BRIEF [4]), and after that, a feature extraction step is carried out. The features in an image are small areas of interest that are descriptive or informative. Several computer vision algorithms may be involved in this step, such as edge detection, corner detection, or threshold segmentation.
In recent years, machine learning (ML) and deep learning (DL) have been recognized as highly effective means for advancing technology and have pushed the limits of what is possible in the domain of image processing and artificial intelligence (AI) in general. As a result, ML and DL are increasingly applied to machine vision applications. Furthermore, multiple problems in vision tasks (e.g., object detection, image annotation, and multilabel image classification) have leveraged these learning techniques to interpret an image to figure out what is occurring. Recent DL-based approaches have demonstrated promising results in vision tasks, and the introduction of convolutional networks has set off a technological revolution in “image understanding”.
In the last decade, we have witnessed a significant advancement in the field of image processing, analytics, and understanding. We can discover patterns in raw image data using data analytics techniques and gain valuable insights. However, these techniques have limitations, such as hidden bias and complexity, which affects the decision process. On the other hand, they do not provide sufficient techniques for discovering, linking, and understanding image data. Transforming the data extracted from images into commonly understood and subjective descriptions to make subsequent decisions according to the various interpretations of the image data is challenging. The current techniques in image processing are incapable of deriving an understanding from various perspectives, and image data analytics is often insufficient. Narratives are effective means of conveying the underlying information in an image and gaining a rich understanding of it. We can effortlessly distinguish between a story and a narrative by shuffling the order of events and generating a new narrative of the same story every time we change the event order. Stories, which are various combinations of narratives, are subjective and assist in understanding images based on an analyst’s view. Storytelling with image data and image processing are not the same but are deeply intertwined, since storytelling is integral to analytics. Storytelling with image data is a broad and complicated task; its intention is to collect images most representative of an event. Then, after steps such as curation, enrichment, extraction, summarization, labeling, and narrative construction, a textual story is generated based on the incidents in the images.
Storytelling with image data can play a crucial role in preventing tragedies such as the 2016 Brussels airport bombings (https://en.wikipedia.org/wiki/2016_Brussels_bombings, accessed on 1 December 2022) by using image analysis technology to detect and automatically predict suspicious activities and unattended packages. By extracting information from images and enriching it with external knowledge sources, AI systems can generate detailed narratives that provide context and guidance for security personnel. This enables them to respond quickly and effectively to potential threats, potentially preventing harm to innocent civilians.
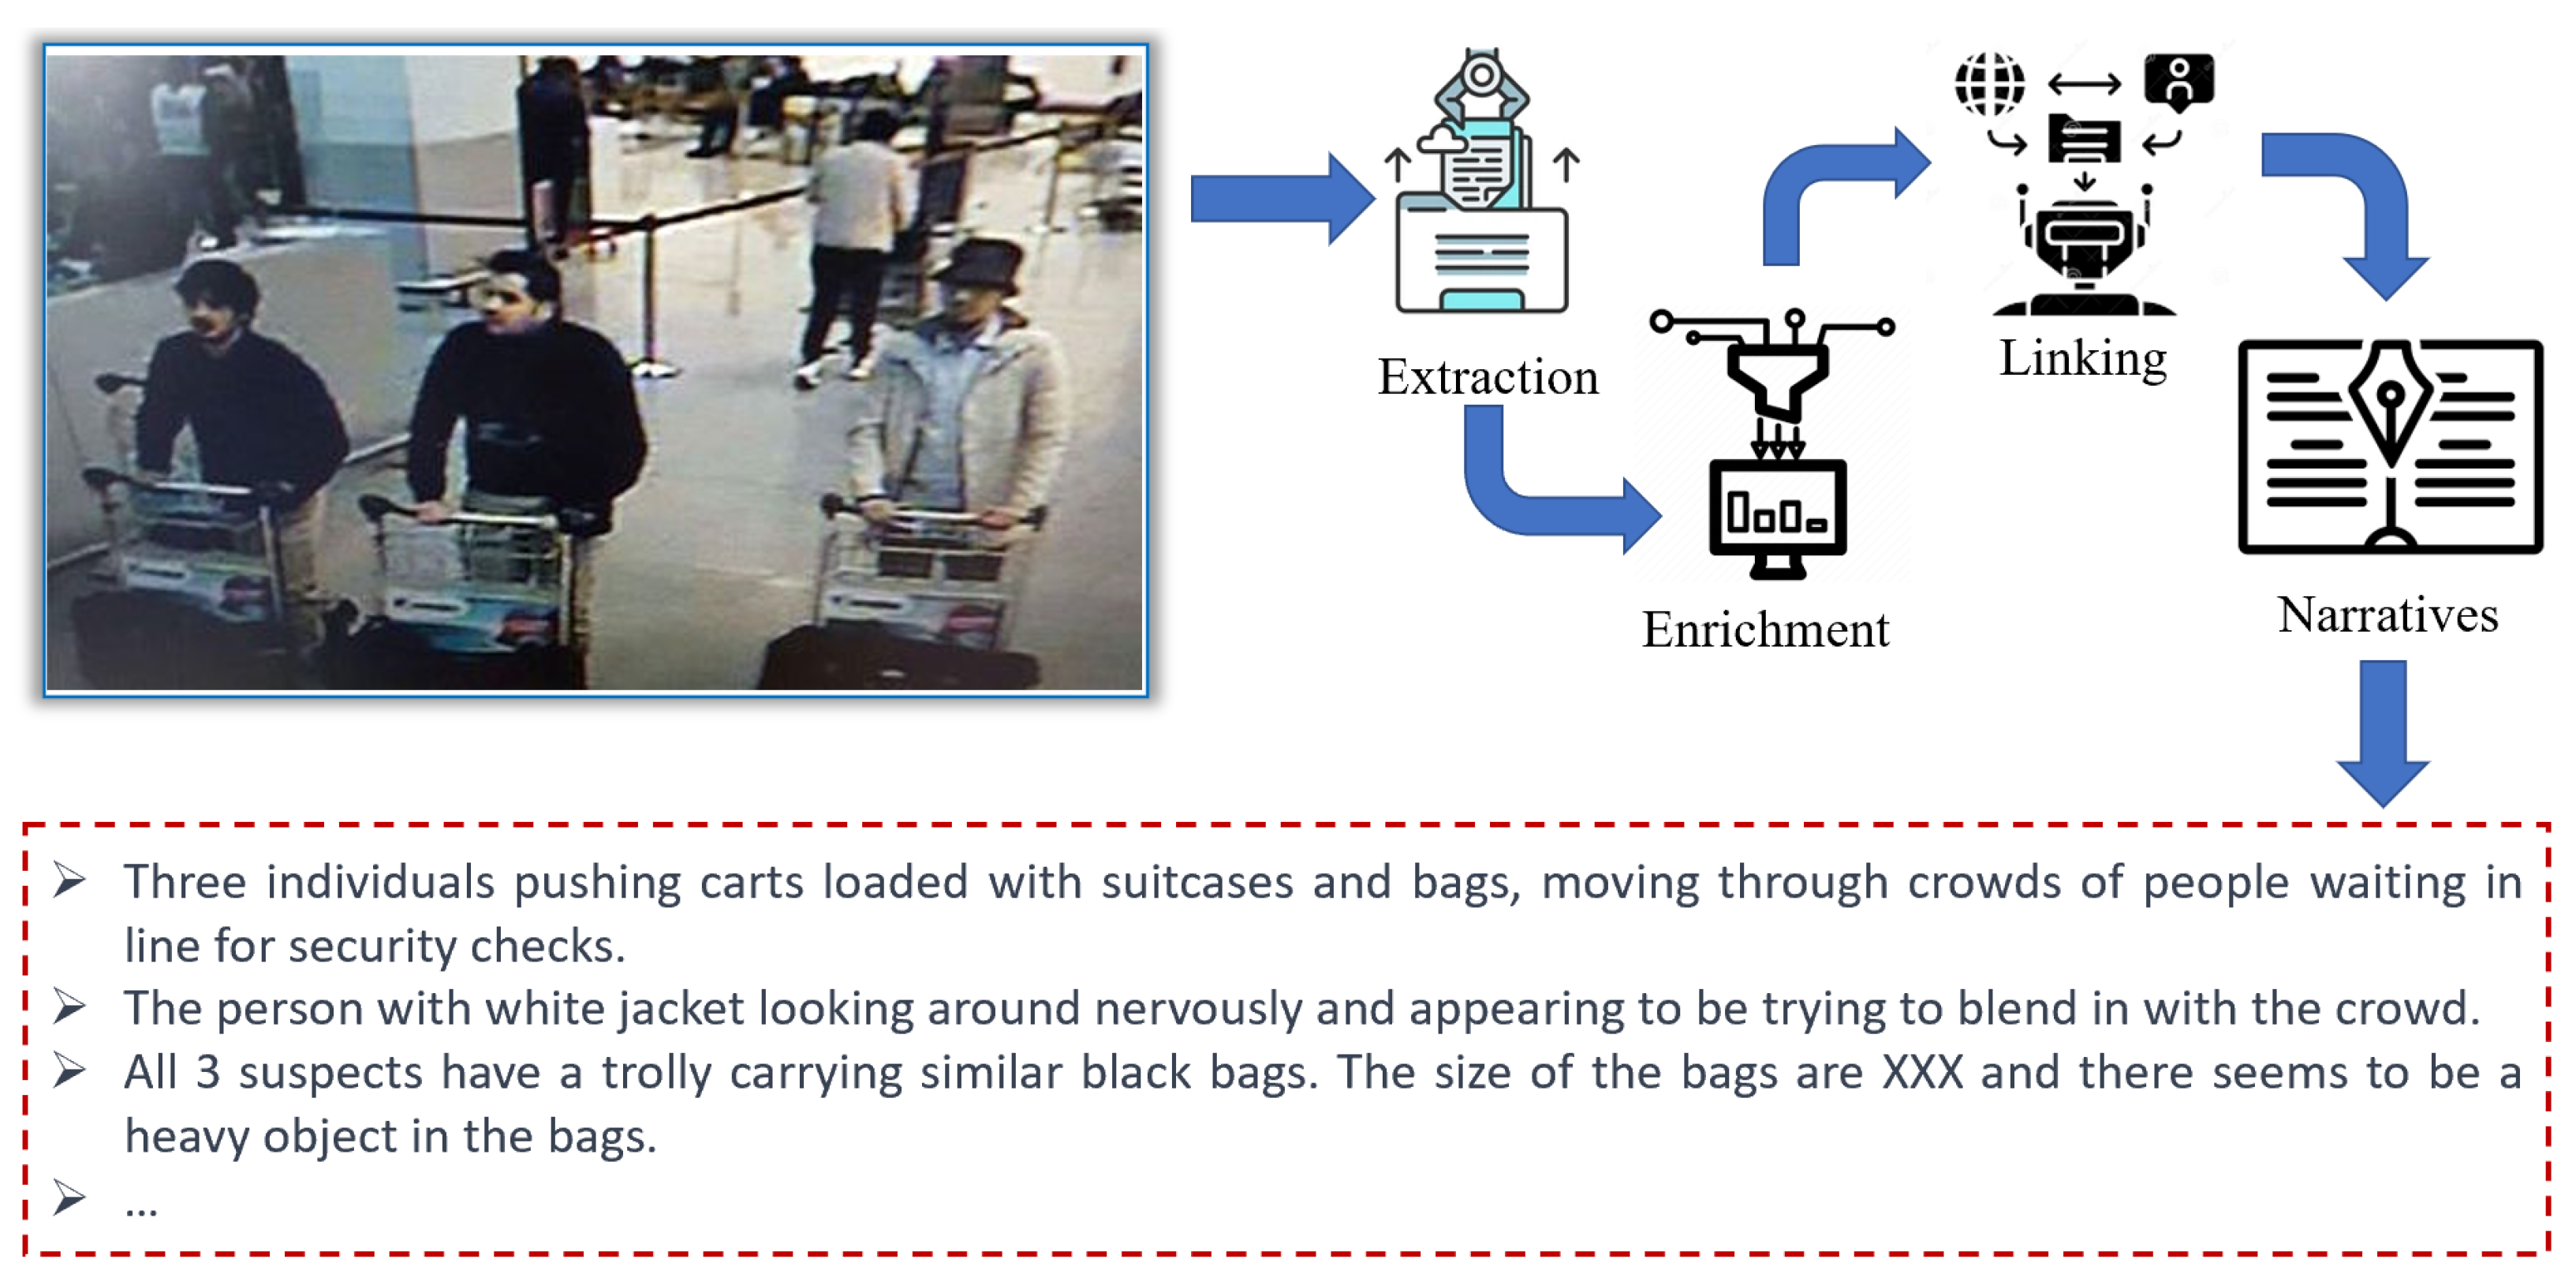
Figure 1 presents an exemplary end-to-end storytelling scenario that highlights the potential of utilizing image data obtained from cameras installed in airports to gain a better understanding of events and activities. In the background, an AI system equipped with image analysis technology constantly scans security camera footage for potential threats. In an image of an airport, various objects can be extracted to detect suspicious activities, these include the following:
  • Unattended bags or packages: these can be detected by analyzing the shape, size, and position of bags and packages in an image.
  • People loitering or moving in a suspicious manner: this can be detected by analyzing the movements and patterns of people in the image.
  • Individuals wearing bulky or concealed clothing: this can be detected by analyzing the size and shape of individuals in the image.
  • Suspicious behavior: this can be detected by analyzing the posture and gestures of individuals in the image.
  • Abandoned vehicles or other objects: these can be detected by analyzing the position and size of vehicles and other objects in the image.
By extracting information about these objects, an AI system can identify potential threats and generate a detailed story that provides context and guidance for security personnel. By enriching these data and linking information items to external knowledge sources, such as social and historical police data, the AI system can generate a detailed story that provides context for the situation. The system can highlight potential warning signs, identify potential threats, and provide guidance on how to respond.
Accordingly, storytelling with image data is capable of capturing and representing temporal/sequential order of key events [5]. Moreover, a story can be told at multiple levels, i.e., a very abstract story versus a detailed story, to support the subjective nature of storytelling with data. To the best of our knowledge, no system can interactively generate different narratives from the timeline of events/activities that happened since the crime incident up to the present time.
Storytelling with image data can be identified as an analytics approach to turning insights into actions. Despite the early adoption, storytelling systems are still in the early stages of development, with many unsolved theoretical and technical challenges stemming from the lack of a formal framework for story modeling and creation from data identifying the notion of story schema, story instance, story element, and narrative. Most related works [6,7] in storytelling presented interactive visualizations to convey data-driven discoveries in a captivating and intuitive way. However, storytelling with image data is much more than sophisticated ways of presenting data visually. Organizing image data, contextualizing it, enhancing the discovery of related events and entities in the image, and presenting it interactively to end-users are the main challenges in storytelling with image data. However, more importantly, there is a need to evaluate the quality of the constructed stories and narratives, which is still a big challenge. We further discuss the current methods for assessing the quality of generated stories in Section 8; however, we leave it as future work since there is a huge knowledge gap in this part and it is still an active research field.
In this survey, we focus on the research problem of “understanding the image data” in general and, more particularly, analyzing the state of the art in the curation, summarization, and presentation of large amounts of image data in a succinct and consumable manner to end-users. We argue that stories are able to combine data with narratives to reduce the ambiguity of data, connect data with the context, and describe a specific interpretation. We aim to advance the scientific understanding of storytelling with image data in general, and image data curation, event/entity extraction and discovery, narrative formation (e.g., event stream processing), Knowledge Bases [8], Knowledge Lakes [9], and Knowledge Graphs [10,
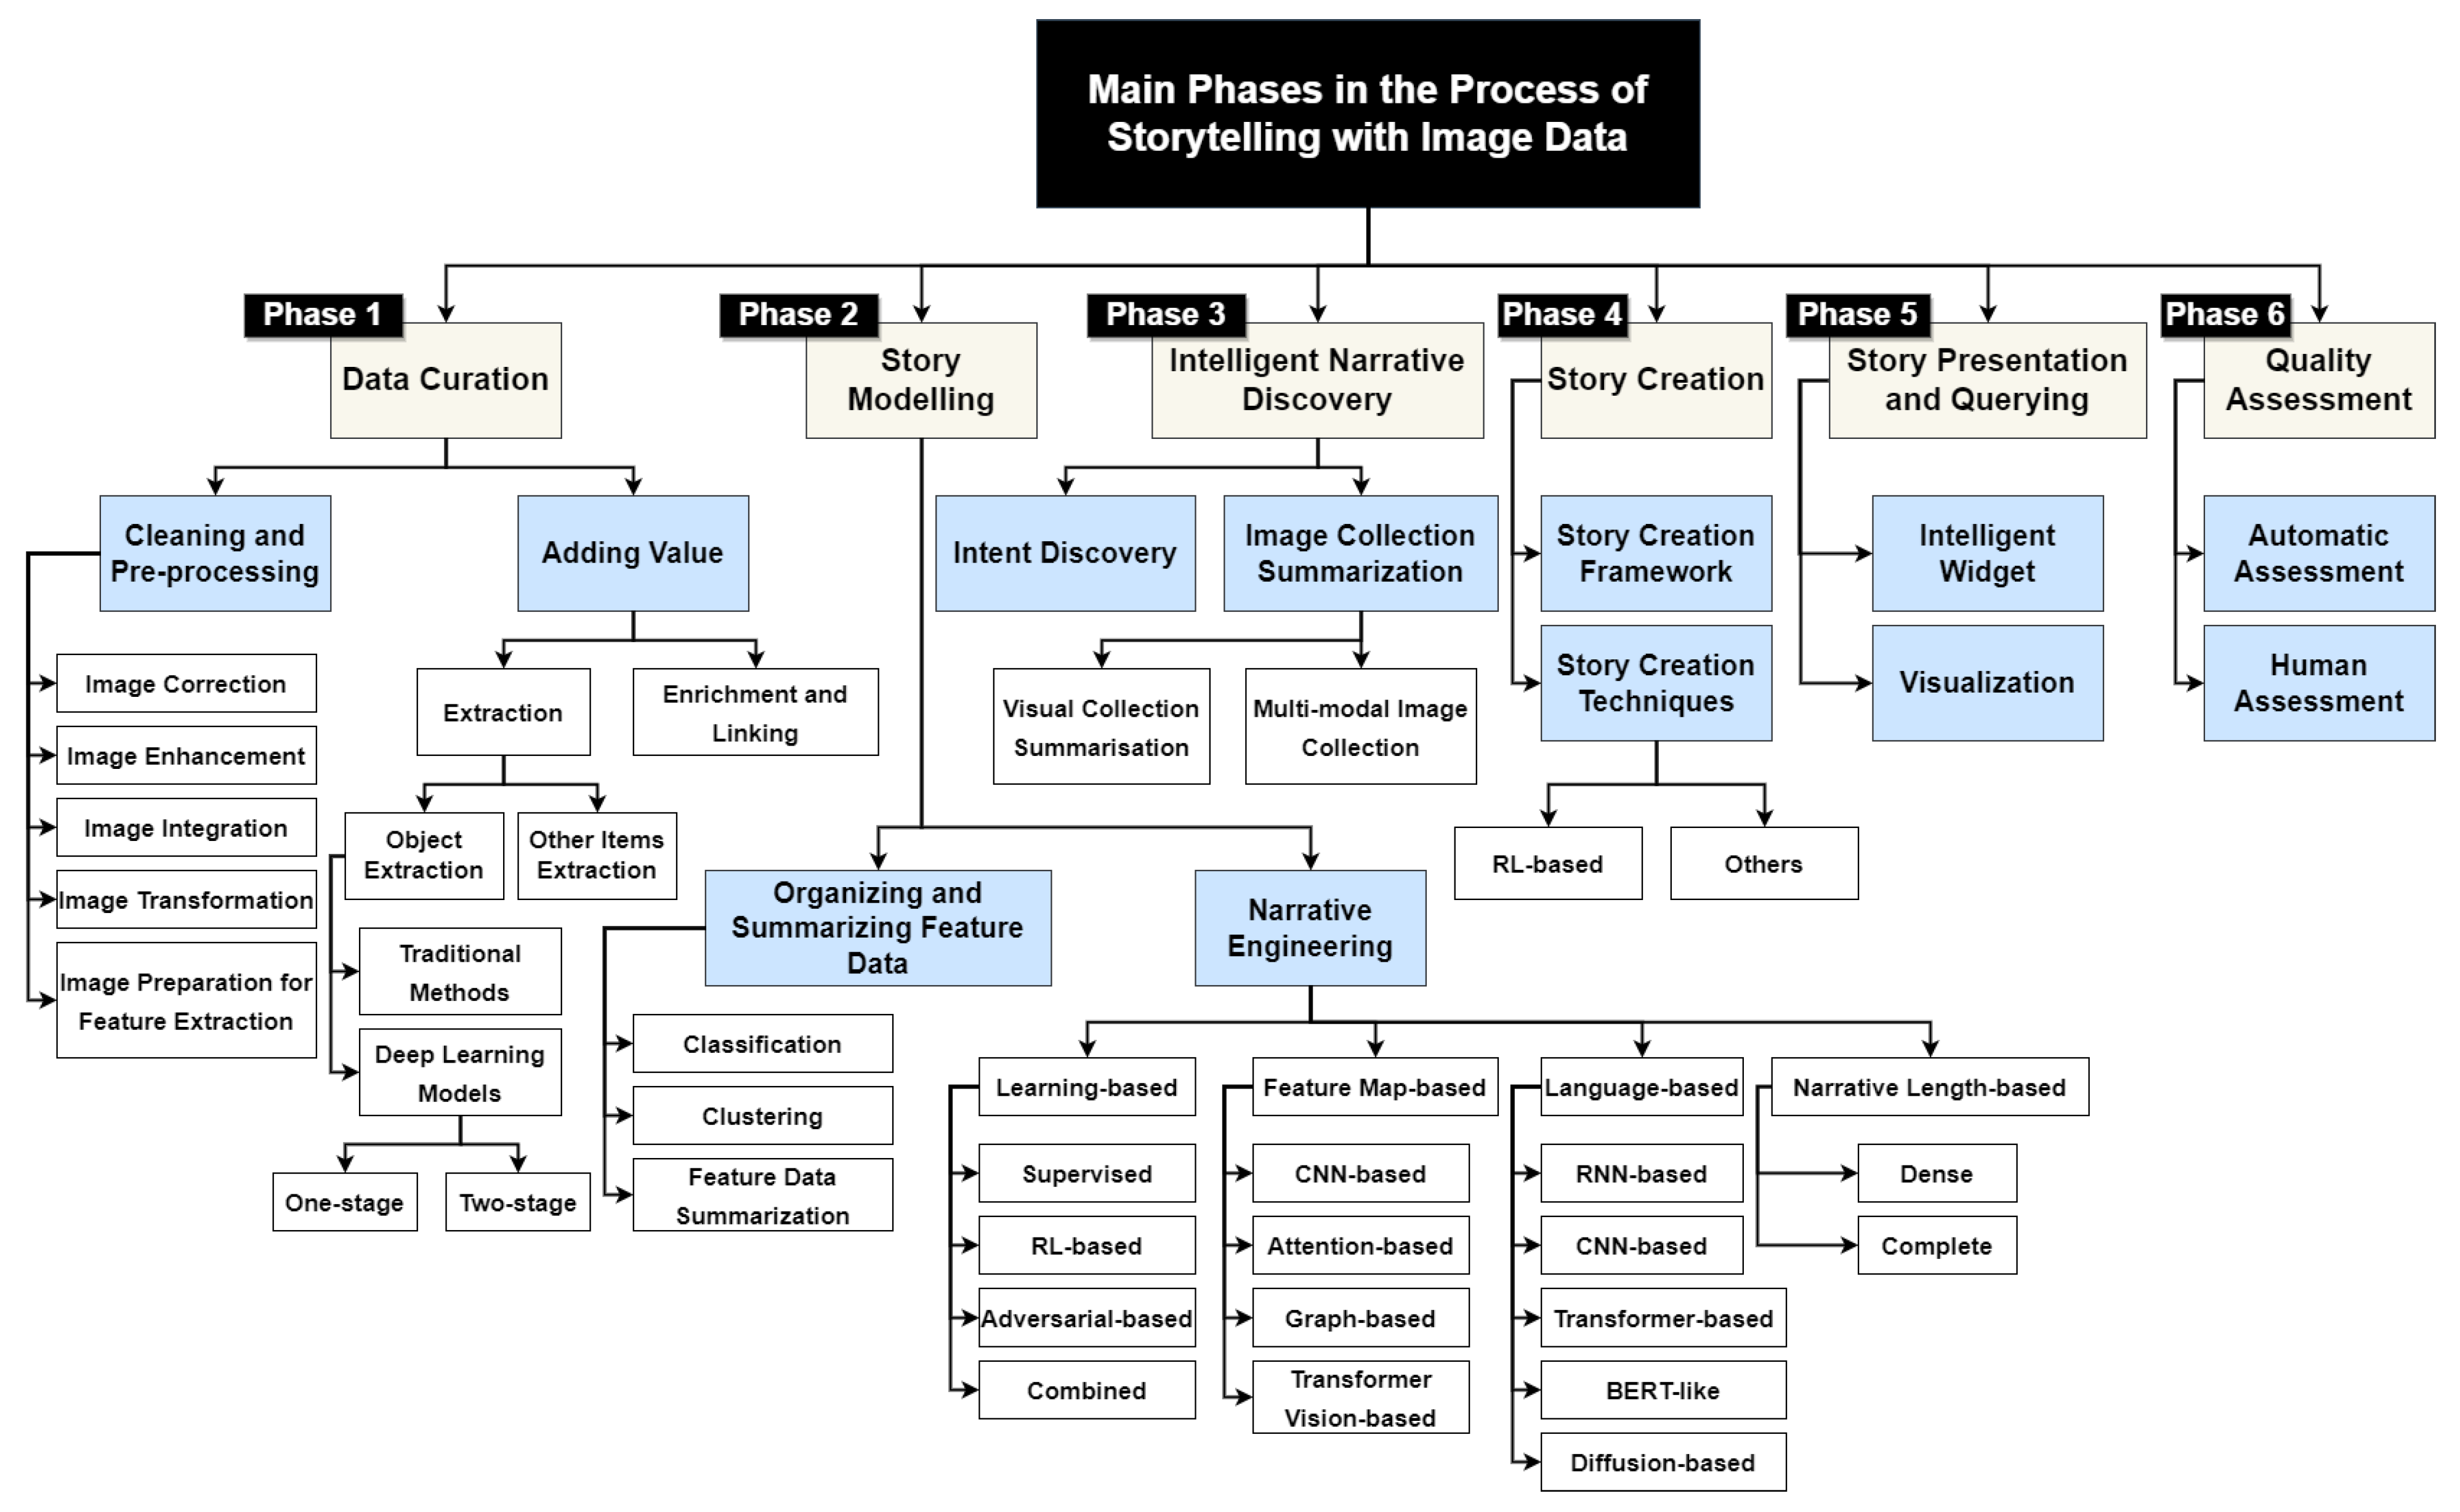
11] in particular. We provide a systematic review and comparative analysis of methods and tools to identify, evaluate, and interpret relevant research in the field of storytelling with image data. This paper introduces storytelling as a process that facilitates understanding image data. This process uses several phases, from cleaning and cleansing, followed by curation and adding value. Several approaches in this paper focus on preparing an image for data analytics and turning a raw image into contextualized knowledge, which is very critical for the process of storytelling with image data. Therefore, we decided to conduct a comprehensive review of the existing work in image processing, cleaning, and curation, preparing the understanding of the importance of these phases in the storytelling process. These phases and steps of storytelling with image data are highlighted in Figure 2.
The method used to select the literature for this survey is described in Section 2. Storytelling with image data is decomposed into five tasks. Data curation is the first task toward story generation with image data, which is discussed in Section 3.1. Then, in Section 4, we investigate the story modeling process. Intelligent narrative discovery is further studied in Section 5. Story creation and intelligent widgets for narrative discovery are discussed in Section 6 and Section 7. Section 8 explains the quality assessment step. Finally, in Section 9, we conclude our study and provide the future works that we have in mind. The taxonomy of storytelling with image data is demonstrated in Figure 2.

2. Literature Selection

2.1. Background and Motivation

This work is a systematic literature review (SLR) on storytelling with image data based on the standard guidelines for performing SLR in software engineering [12]. The most crucial aspect of any SLR is identifying the research questions (RQs). Table 1 demonstrates the list of research questions (RQs), the discussion, and the main motivation that we focus on to identify state-of-the-art storytelling methods with image data, which is discussed in detail in Section 2.2. Moreover, 
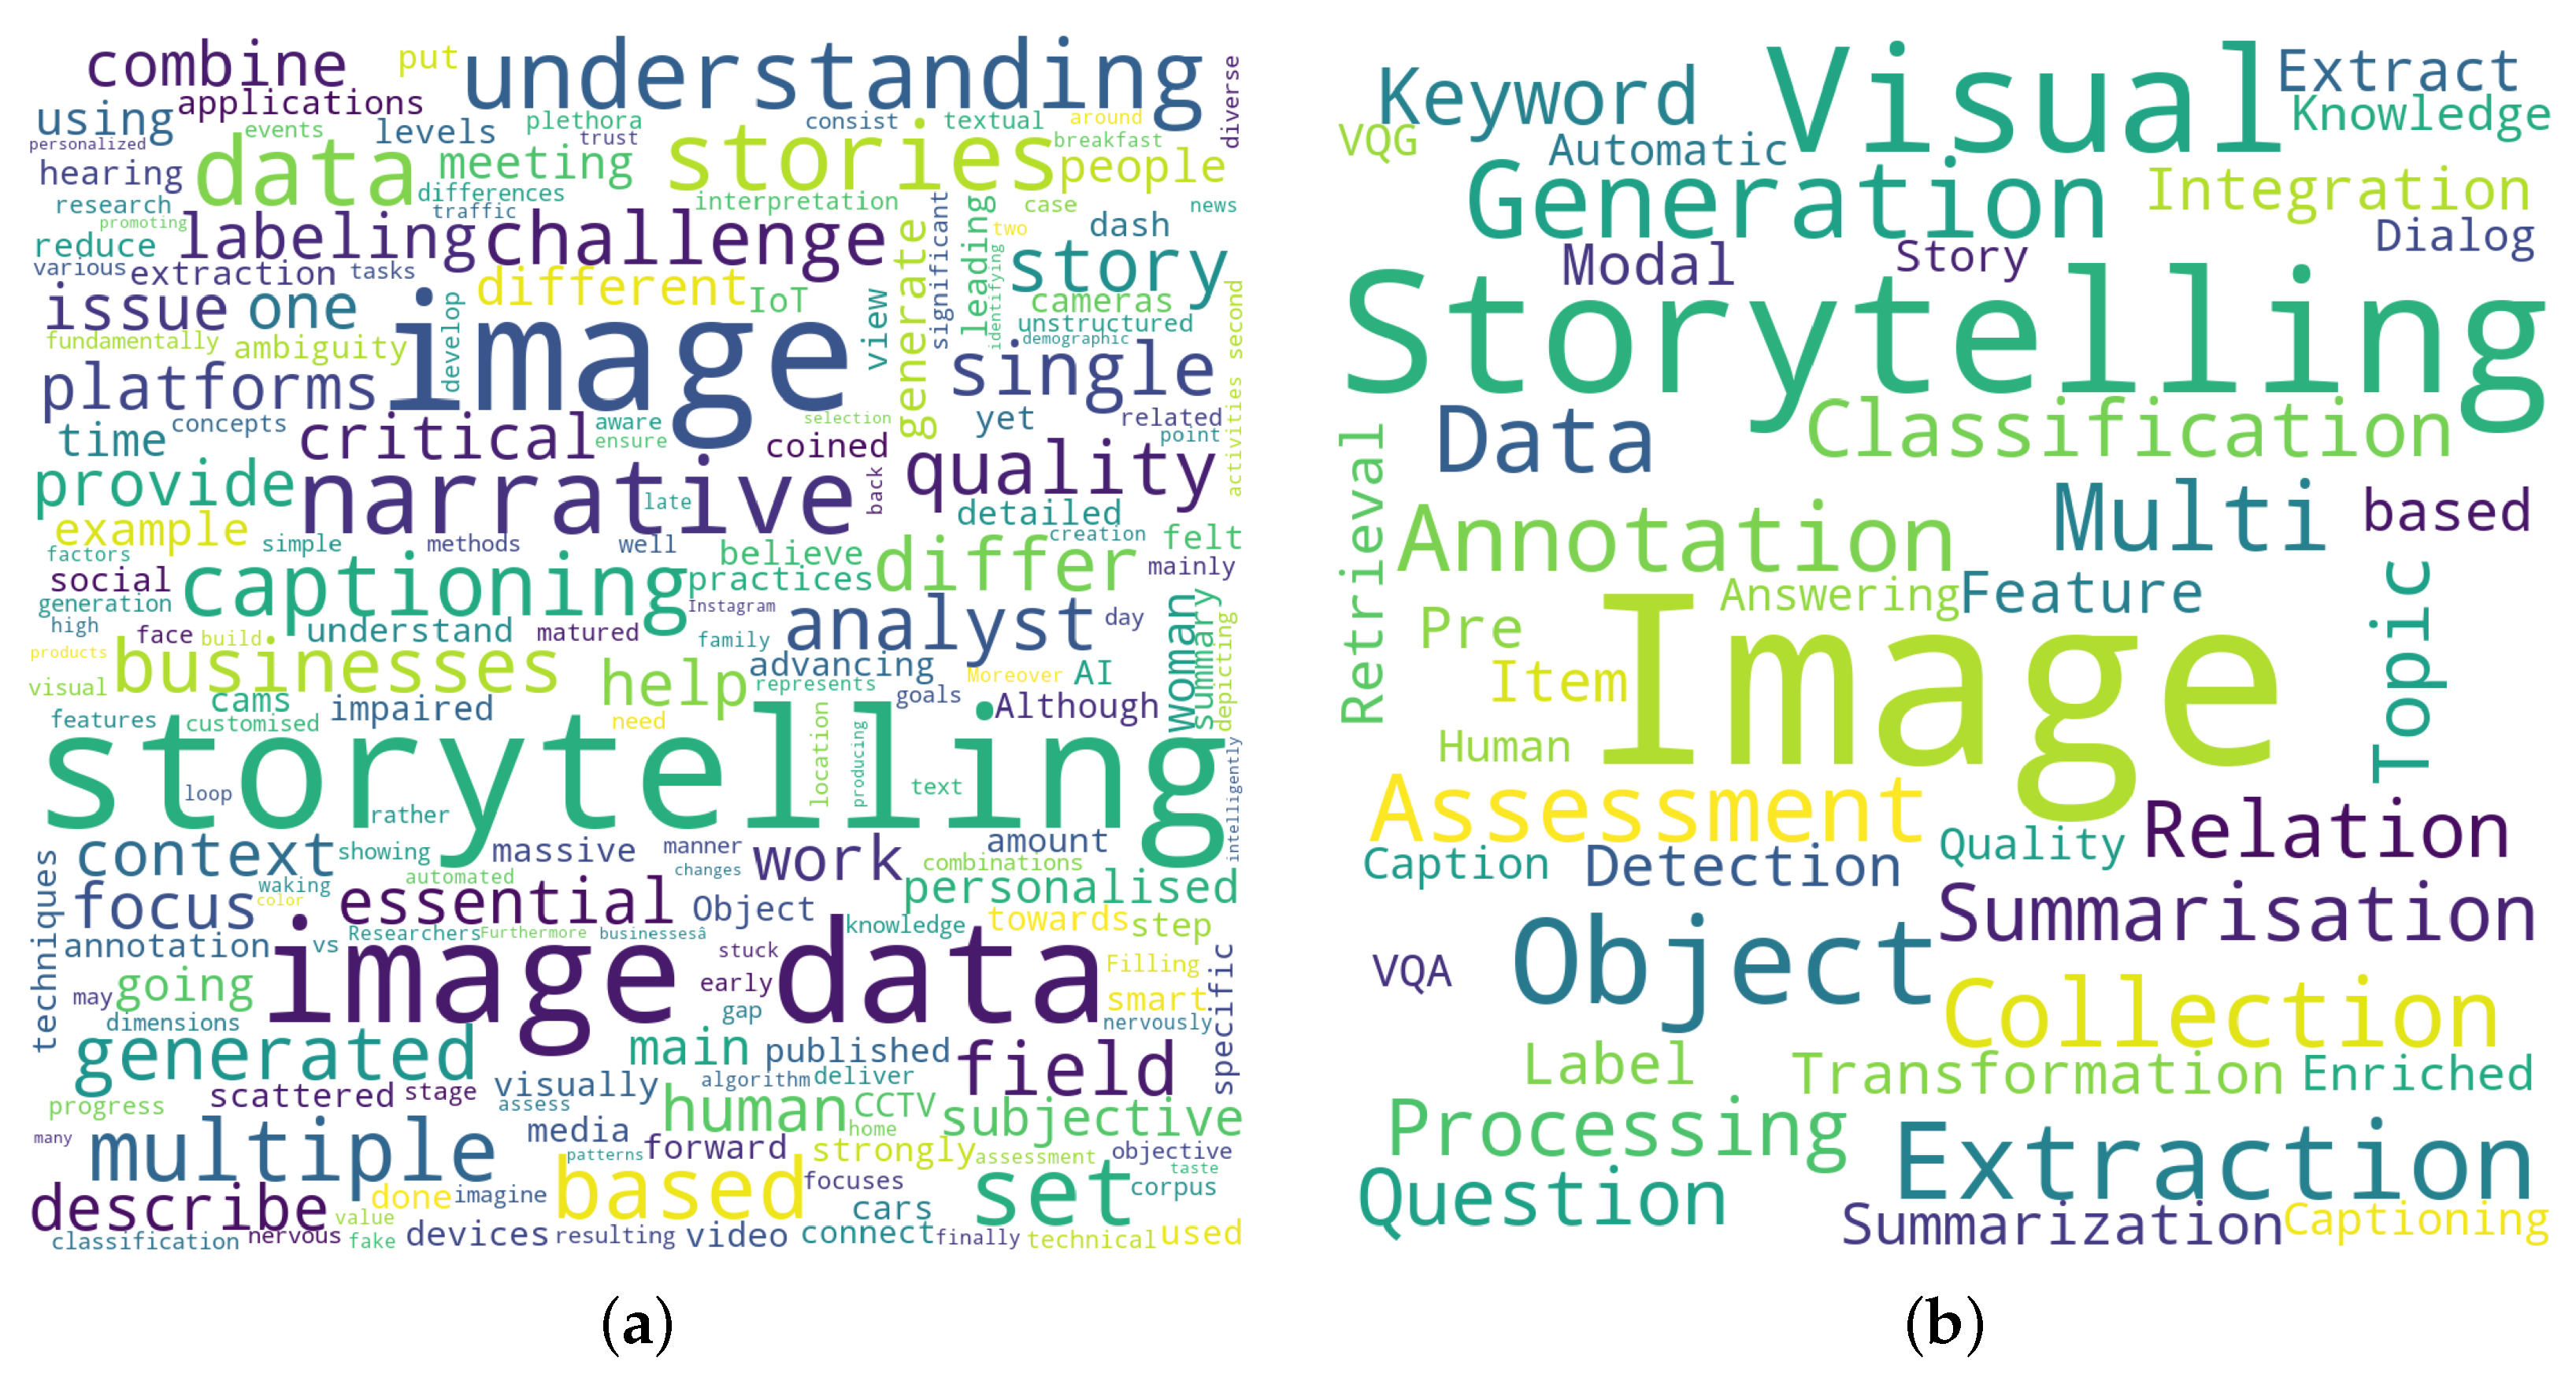
Figure 3a shows a word cloud representation of research questions and their corresponding main motivations, with more frequent words in larger font sizes. Word clouds, in general, are visual representations of textual data. They highlight the most prominent or frequent words and ignore the most common words in the language. These figures pinpoint the most important keywords in our search keywords and question–motivation pairs for storytelling with the image data field. Finally, the detailed classification of different categories with their subcategories, references, time period, and the number of references in each subcategory is mentioned in Table 2 in this survey.

2.2. Research Questions

The use of image data in storytelling has gained significant attention in recent years as an effective way for businesses to communicate their messages to their audience. Storytelling with image data can help brands stand out from the competition and increase customer engagement by creating an emotional connection with their target audience. However, there are several research questions that remain unanswered regarding the use of image data in storytelling. In this section, we explore the main motivations behind these research questions and summarize the findings that they offer to the field of visual storytelling. By understanding the motivations behind these research questions and their contributions to the field, we can gain insights into the best practices for using image data in storytelling and the potential benefits for businesses. Table 1 illustrates the research questions (RQs) examined in this survey.
  • RQ1. What is storytelling with image data, and how can it contribute to understanding images?
The main motivation behind this research question is to explore the use of image data as a means of storytelling and understanding visual content. In today’s world, we are bombarded with vast amounts of visual data, and it is becoming increasingly important to understand how we can effectively use these data to communicate ideas and convey messages. The research question aims to identify and analyze the methods and techniques used in storytelling with image data and explore how these methods can be used to enhance our understanding of visual content.
The findings of this research question will offer insights into how images can be effectively used as a medium for storytelling and how they can be used to convey complex information in a way that is easy to understand and engaging for the audience. The research question will offer a summary of the key techniques and strategies used in storytelling with image data, including data visualization, image classification, and image recognition. It will also provide insights into how these techniques can be used to improve our understanding of images, including their context, content, and meaning.
  • RQ2. How is storytelling with image data different from image/video captioning methods?
The main motivation behind this research question is to identify and understand the unique approaches and techniques used in storytelling with image data compared with image/video captioning methods. While both methods involve using images and videos to convey information, the way they approach storytelling can be quite different. The research question aims to analyze the differences between storytelling with image data and image/video captioning methods, including the use of context, narrative structure, and audience engagement. It will explore how storytelling with image data is focused on creating a narrative that engages and resonates with the audience, whereas image/video captioning methods are often more focused on providing a concise and accurate description of the visual content.
The findings of this research question will offer insights into the unique strategies and techniques used in storytelling with image data, including the use of data visualization, creative design, and visual storytelling. It will also provide a better understanding of how these methods can be used to create more engaging and impactful visual content.
  • RQ3. What are the differences between storytelling with a set of related images rather than a single image?
The main motivation behind this research question is to investigate the effectiveness of using multiple images to tell a story as opposed to using a single image. The question arises from the need to understand how different visual storytelling techniques can be utilized to create more impactful and engaging narratives. The research question aims to analyze the differences between using a set of related images and a single image to tell a story, including the ways in which they convey information, create meaning, and engage the audience. It will explore the various factors that contribute to the effectiveness of using multiple images, such as context, sequence, and visual coherence.
The findings of this research question will offer insights into the unique strategies and techniques used in storytelling with a set of related images, including the use of visual hierarchy, narrative structure, and visual metaphors. It will also provide a better understanding of how these methods can be used to create more engaging and impactful visual content.
  • RQ4. What are the technical challenges we face in storytelling with image data?
The main motivation behind this research question is to identify the technical difficulties that arise when utilizing image data for storytelling purposes. This research question is crucial because, while there are numerous techniques available for analyzing and understanding image data, there are significant challenges that remain to be addressed in utilizing image data for storytelling purposes. Some of the technical challenges that may be addressed by this research question include issues related to image recognition, feature extraction, data preprocessing, and scalability. Additionally, the research may delve into challenges related to representing the narrative structure and visual language of the story in a coherent and meaningful way.
The findings of this research question may offer insights into the limitations and challenges of utilizing image data for storytelling and provide potential solutions to these issues. By understanding these challenges, we may be able to improve the effectiveness and efficiency of storytelling with image data and enhance our ability to communicate complex concepts and narratives.
  • RQ5. What techniques have been used in storytelling with image data?
The main motivation behind this research question is to identify and understand the different approaches and methods that have been used to create compelling stories using image data. This research question is important because there are various ways to approach storytelling with image data, and by examining the different techniques that have been employed, we can gain insights into the strengths and limitations of each approach.
The findings of this research question may offer a comprehensive overview of the techniques that have been used for storytelling with image data. This can include methods such as visual narratives, data-driven narratives, photo essays, and multimedia storytelling. By analyzing these different approaches, we can gain insights into their unique features, advantages, and challenges. Additionally, this research may highlight emerging techniques and trends in storytelling with image data, providing new avenues for exploration and innovation in this field.
  • RQ6. What are the applications of storytelling with image data, and how can they provide value for businesses?
The main motivation behind this research question is to explore the potential benefits of using image data in storytelling for businesses. With the increasing availability of visual data, businesses have the opportunity to communicate their brand messages in more engaging and impactful ways through the use of images. By answering this research question, we can gain insights into the various applications of storytelling with image data, such as creating marketing campaigns, visualizing data, and enhancing customer experiences. Additionally, we can explore how businesses can leverage these applications to create value for their brand, increase customer engagement, and drive revenue growth. Some potential findings that could arise from this research question include the following:
  • Image data can be used to create compelling marketing campaigns that are more engaging than traditional text-based approaches.
  • Visualizations of data through image data can provide businesses with valuable insights and help them make data-driven decisions.
  • The use of image data can enhance the customer experience by creating more immersive and interactive experiences.
  • Storytelling with image data can help businesses to differentiate their brand and stand out in a crowded marketplace.
  • The adoption of image data in storytelling can lead to improved brand perception, increased customer loyalty, and ultimately, increased revenue growth.
  • RQ7. How can the quality of the stories be assessed?
The main motivation behind this research question is to provide a framework for evaluating the effectiveness of visual storytelling. While there is a growing interest in the use of visual storytelling, there is a lack of guidance on how to measure the quality of the stories being created. By answering this research question, we can gain insights into the key elements that contribute to the quality of visual stories, such as the clarity of the message, the coherence of the narrative, the use of visual elements to support the story, and the emotional impact of the story. Additionally, we can explore how to measure these elements to assess the overall quality of the story. Some potential findings that could arise from this research question include the following:
  • The identification of key elements that contribute to the quality of visual stories, such as the use of clear and concise messaging, the use of compelling visual elements, and the emotional impact of the story.
  • The development of a framework for evaluating the quality of visual stories, including the creation of metrics to assess the effectiveness of the story in achieving its intended goals.
  • The importance of considering the target audience when assessing the quality of visual stories, as different audiences may have different preferences and expectations.
  • The need to balance the creative and technical aspects of visual storytelling when assessing quality, as both elements are important in creating effective stories.
  • The potential for using technology, such as eye-tracking or emotional recognition software, to measure the impact of visual storytelling on the viewer.

2.3. Literature Selection

We broke down our research questions into individual facets and conducted an extensive literature search on electronic sources such as Google Scholar (https://scholar.google.com, accessed on 1 December 2022) and arXiv (https://arxiv.org/, accessed on 1 December 2022) based on sophisticated search queries and keywords. We did our best to have an unbiased search strategy. The following search string uses AND and OR operators to represent our “storytelling with image data” generic search query:
([“Image” AND “Captioning”] OR [“Image” AND “Caption” AND “Generation”]) AND ([“Visual” AND “Question” AND “Answering”] OR [“VQA”]) AND ([“Visual” AND “Question” AND “Generation”] OR [“VQG”]) AND (“Visual” AND “Dialog”) AND ([“Visual” AND “Storytelling”] OR [“Storytelling” AND “Image” AND “Data”] OR [“Multi-Image” AND “Story” AND “Generation”]).
We included all possible search strings related to each part and did our best to make sure no potential study is missed in our results. Moreover, the word cloud representation for the search keywords is demonstrated in 
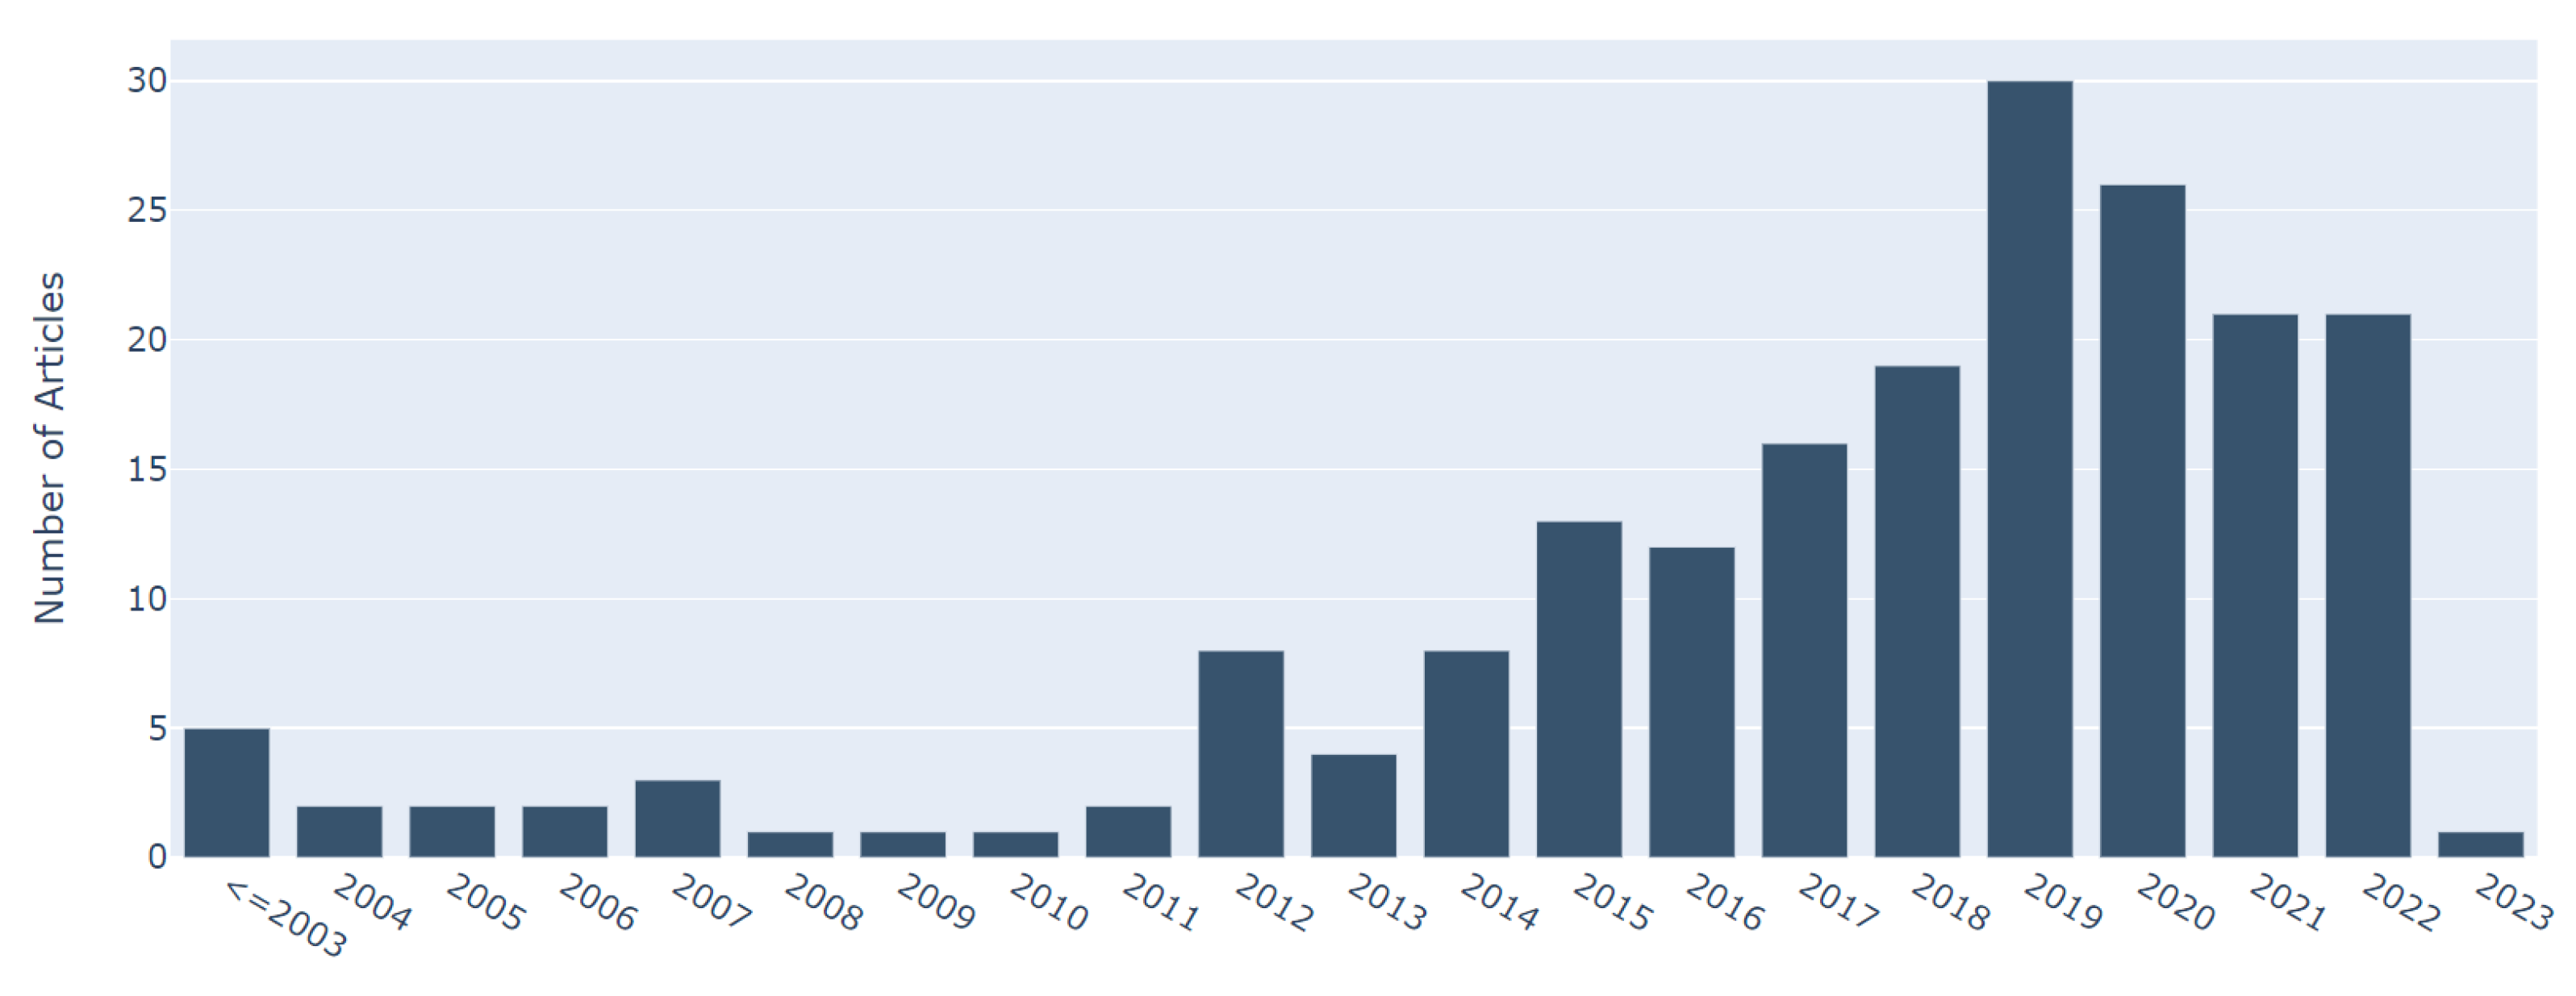
Figure 3b. In addition, we included articles published since 1980, and the yearwise distribution of the selected articles after the paper quality assessment phase is represented in Figure 4. These selected articles were included in our study if they met the inclusion criteria explained in the following.
  • English language studies.
  • Articles dated between 1980 and 2022.
  • Articles related to at least one aspect of our research questions.
  • Reference list from relevant studies and review articles.
On the other hand, we excluded some articles based on our exclusion criteria, which include the following items:
  • Informal literature surveys (no defined research questions, no search process, no defined data extraction or data analysis process).
  • Articles that are not published (except for preprints and arXiv).
  • Non-English articles.
  • Studies not related to at least one aspect of our research questions.
Ultimately, the quality of the selected studies is assessed based on the following list:
  • Frequency of citations.
  • Are the study’s research challenges/contributions/experiments clearly explained?
  • Is there a clear statement of the objectives of the research?
  • Are the experiments realized to evaluate the ideas presented in the study?

3. Task 1. Building the Foundation for Organizing and Curating the Raw Image Data

3.1. Curation: Image Preparation Using Cleaning and Preprocessing

Preprocessing is a critical initial step in data analysis because it converts raw data into cleaned data by removing undesired variance such as subjective and experimental abnormalities [134]. These data are then more suitable for the data analysis objectives. In contrast, incorrect preprocessing can result in undesired variation. Appropriate preprocessing is thus a vital step that directly impacts the performance of all subsequent pipeline processes and, hence, the performance of the whole investigation [134].
Generally, image classification and segmentation are performed using real-time pictures gathered from imaging centers and simulated images obtained from publicly available databases [135]. These real-time images that have been stored in a database prior to being processed are referred to as raw images. Typically, these raw images are unsuitable for analysis since they may contain numerous types of noise. As a result, sufficient preprocessing techniques should be utilized to improve image quality. Techniques for image preprocessing are fundamental for all image-based applications, such as storytelling with image data. Such approaches’ accuracy and convergence rate should be extremely high in order to ensure the success of succeeding phases. However, these strategies are frequently overlooked, resulting in unsatisfactory outcomes [135]. Optimizing image brightness, cleaning, and enhancement is significant because this information may be utilized for other purposes, such as feature detection or navigation. In addition, these approaches can independently access and operate with this information [136]. This section discusses the various preprocessing techniques and approaches available for image analysis.

3.1.1. Image Correction

Prior to feature generation and analysis, potential noises in the images may need to be addressed during image preprocessing. Various candidates for rectification are listed below.
  • Image Denoising [13,14]. Noise might be created randomly or through the operation of a device. The presence of noise distorts the photos and may confuse the identification process. Thus, image denoising is a critical preprocessing approach for the subsequent phases of image processing. Traditionally used single-image denoising methods frequently represent the image’s attributes and the noise they are intended to remove analytically. In contrast, contemporary denoising techniques frequently use neural networks to develop a mapping between noisy and noise-free pictures. While DL models are able to reflect complex features of pictures and noise, they need considerable paired samples to train such systems. Therefore, the majority of denoising approaches that are based on learning make use of synthetic training datasets.
  • Color Corrections [15]. Given that digital photographs are inherently color images, such examination should make proper use of the color or spectral data contained in the acquired data. However, prior to performing color picture analysis, considerable preprocessing is often required to both enhance and facilitate effective analysis. Color calibration is used to guarantee that correct color information is collected. In contrast, color enhancing ensures the efficient results of image analysis techniques that are otherwise highly susceptible to imaging circumstances and scanner fluctuations. The approaches used vary from calibrating cameras and scanners to adjusting the presented colors for converting the picture to another color representation, which can help with following activities such as segmentation. The color technique would be utilized to effectively distinguish the achievements of stains that are all in the same region. This allows the assessment of strain-specific pictures, whereas color normalization methods can be used to decrease different shades in histopathology images caused by things such as scanner features, chemical color levels, or different procedures.
  • Lighting Corrections [16,17]. Deep shadows cast by lighting can hide particular textural characteristics; inconsistent lighting across the picture might distort findings. Rank filtering, histogram equalization, and remapping are all possible corrective approaches. Background can be caused by uneven illumination, which occurs when the light source is on one side of the picture, and the overall brightness decreases from one side to another. However, there are other different methods to establish a background, and frequently, the background is so faint or normal that we have difficulty noticing it at all. To address background issues, it is good to obtain a separate image of the background. This method compensates for lighting issues and additional background abnormalities.

3.1.2. Image Enhancement

Rather than correcting faults, enhancements are utilized to optimize for certain feature-measuring methodologies. Sharpening and color balance are two well-known image enhancement techniques. The followings are some broad types of image-enhancing techniques and their possible advantages for feature description.
  • Enhancements to Illumination [18,19]. Lighting and contrast enhancement difficulties are inextricably linked when it comes to low-light picture enhancement. Several works have attempted to build frameworks for how lighting and noise in low-light images are viewed jointly, resulting in noise control and low-light improvement findings. Convolutional neural networks (CNNs) can simulate the usage patterns of illuminance and picture noise accordingly and utilize them as restrictions to aid the joint learning process. High-quality pictures require high-quality thin slices, should be clean, free of imperfections, and consistent in thickness from center to edge to minimize artificial intervention contrast—the narrower the segment, the smaller the path variance and the lesser the intervention color.
  • Pyramids of Scale-Space. Kim [20] developed defining the diffusion pyramid to investigate lighting qualities over a range of scales precisely. They reasoned that by aggregating the nonlinear rate of diffusion from wide to fine scales via max pooling, the dazzling characteristic of lighting, even in the dark environment, would be well shown from both domestic and global perspectives. Additionally, Pang et al. [21] suggested a scale-aware deep CNN for deraining that has a multiscale features extraction branch that is coupled to a scale-space invariant focus branch.
  • Enhancements to the Blur. Motion blur is a typical occurrence due to the exposure time taken by camera sensors, throughout which scenes are collected at distinct time stamps and averaged (blurred) into a signal [137]. So, a slow shutter speed and change in momentum of the camera or subject might create motion blur. It can also occur as a result of a UAV (unmanned aerial vehicle) platform’s extreme vibrations, which might impair fracture identification [22]. The noise of blurring produced by complementary beam removal imaging could be reduced with a compressed blind deconvolution and denoising technique [23].
Preprocessing and denoising are crucial procedures in image storytelling since they enhance the quality of the used images. It involves various techniques, such as image denoising, color correction, and contrast adjustment, which are used to improve the overall appearance and readability of the image. Denoising an image by reducing undesired noise can, for example, diminish the visual impact of the image for a storytelling purpose.

3.1.3. Image Integration

The process of image integration might involve preprocedural imaging, segmentation of the image, and registration of image [24]. Image integration has the ability to improve the results of several image-processing applications. Active sensors are the root of volumetric range image integration technologies [25]. The integration technique should resist severe outliers in the range of pictures. The vast majority of 2D data integration solutions rely on data-level picture fusion [26]. Integration of range photos in a robust manner is a crucial step in creating high-quality 3D images [25]. Due to the fact that range pictures and specific range maps from 2D images may contain a significant number of outliers, any integration strategy attempting to produce high-quality models should be more resilient. Bavirisetti et al. [27] have devised an image integration approach for data absorbed from multifocus image fusion utilizing multiscale picture decomposition and saliency identification. They were able to integrate just focused and sharpened portions into the merged picture.

3.1.4. Image Transformation

Image-to-image transformations try to turn an input image into the required output image, and they occur in a variety of image-processing, computer vision, and object recognition applications [28], for example, creating high-quality photographs from comparable degraded (e.g., compressed, damaged, or low-resolution) images and modifying images [28]. Using two examples of image transformation, the analysis highlights the role of perception in defining, analyzing, and transforming images [29]. Following Jia et al. [30], many challenges in computer vision might be formulated as image transformations. Natural images are extremely high-dimensional, statically non-Gaussian, and have diverse texture patterns. In recent years, CNNs have been trained under supervision for different image-to-image transformation issues [28]. They encode the input image into a hidden representation, which is subsequently decoded to produce the output image.

3.1.5. Other Preprocessing Methods for Feature Extraction

The feature extraction procedure makes use of a number of image-processing methods and statistical analyses to discover common patterns within the pictures. Texture characteristics have been identified as one of the most critical imaging aspects in the field of classification [31]. Preprocessing a picture can significantly influence the quality of extracted features and image analysis outcomes. Preprocessing an image is comparable to the mathematical normalization of data collection, which is a frequent stage in developing several feature descriptor algorithms [16].
As Tofighi et al. [32] discussed, background removal is one of the preprocessing procedures for preparing pictures for feature extraction. They stated that if an image has a light-colored object on a dark background, it is possible to distinguish the grayscale pixels of the object and background by identifying two main parts. A commonly used technique for removing the background in this situation is selecting a threshold value that separates these parts.
The extraction of an image’s features is a fundamental and critical element for image modeling [33]. Based on the work by Heaton [34] to employ feature engineering, the feature vector of a system is enlarged by introducing new features that are calculated from the existing features. Manual feature engineering is eliminated by utilizing a CNN to learn the visual representation for the collection challenge. However, such a presentation needs to be as simple as feasible to facilitate the retrieval and preservation of document images [35]. Some detection algorithms receive the extracted features of unannotated pictures, annotated images, and a code book as the input [36]. The critical stage in evaluating an image’s numerous properties is feature extraction. One goal of feature selection and extraction may be to reduce the dimensions of data for better analysis [37]. Then, in the next section, we cover how to manage image collection summarization.

3.2. Curation: Adding Value

Adding value to the preprocessed images is critical in image analysis processes because it turns the raw unstructured images into useful information items. In the storytelling process, specifically, adding a value to the images is highly important for extracting hidden information, topics, and keywords, and adding more real-world contexts by linking the images to the knowledge base within a particular area is of the utmost significance. The rest of this section reviews the techniques and methods used to add value to images as a preprocessing step of storytelling.

3.2.1. Extraction

The first insight extracted from images for any image analysis process is the very explicit terms, such as different objects, topics, and contexts. This part reviews the techniques and methods of feature extractions that lead to extracting the additional terms mentioned above.
Object Extraction. In computer vision, object detection is the task of detecting the objects of a particular class, such as cars, humans, and different types of plants and animals. Object detection can be considered a combination of image classification and object localization. Every object in the image is given a class label and a bounding box. On the other hand, image annotation is often formulated as a multilabel image classification problem [55]. Since object detection and image annotation are critical steps after organizing feature data and before narrative construction, we further investigated some state-of-the-art models addressing this problem. Generally, the object detection approaches could be divided into traditional ML- and DL-based categories [38]. We review some popular algorithms for object detection in this part.
  • Traditional Methods. Traditional object detection methods use handcrafted features and feed them to a classifier or use the correlation between them in different images to detect different objects [39]. A suitable feature extraction technique could be extracting the geometric features from the images using General Hough Transform [40]. This feature extractor detects geometric shapes such as lines, circles, and curves on a grayscale image. Corners and edges are other features used for detecting objects. Harris Corner and Edge detector [41] is one of the feature extractors that could be used in this regard. This method could detect different objects and shapes in the image by extracting the corners and edges of two images and calculating their correlation [39].
    The problem with these features is that they are all sensitive to rescaling and rotation. To be able to detect the objects without the rotation and scaling concerns, intersect point and local features detectors such as Scale-Invariant Feature Transform (SIFT) [42] and Speeded Up Robust Features (SURF) [43] could be used. These feature descriptors are rotation- and scale-invariant by considering the features as objects. The Histogram of Oriented Gradients (HOG) [44] is another feature descriptor of the same type; however, it is not rotation-invariant and is only robust to scaling [38,39].
  • Deep Learning Models. Generally, deep learning object detection approaches are divided into two categories: (i) two-stage: in this approach, first, the regions are extracted, and each region is then fed to a model to detect the object inside that region; (ii) single-stage: in this approach, an end-to-end model will detect both the regions and the class of different objects [38,45]. The following reviews some of the most popular methods in the above categories.
    Two-Stage. A two-stage model finds the object regions first, and then for the next step, each region is treated as a single image and is fed to a model to classify the object in it. Table 3 shows a summary of some of the well-known two-stage object detection models.
    R-CNN [48]: In this method, 2000 regions of interest will be first selected based on the selective search technique [138] at first. Then, each of these regions is fed to a CNN architecture, resulting in a 4096-dimensional feature vector for each region. In the final step, the feature vector is fed to a pretrained SVM to classify the objects inside that region.
    SSP-Net [46]: The problem with the R-CNN approach is that it might miss some of the objects that are divided into multiple regions and partially exist in each region. To solve this problem, SPP-Net was proposed using the idea of spatial pyramid matching (SPM) [139]. In this method, in the fifth convolution layer, three kernels with sizes of one, two, and four are applied in each region to consider different objects with different sizes.
    Fast R-CNN [47]: Like R-CNN, SPP-Net has multiple stages of extracting the feature vector, feeding to SVM for classification, and refining bounding box regions. Fast R-CNN solved this issue by altering the architecture of the CNN in SPP-Net so that the feature vector layer is then connected to two sibling output layers. One is a softmax layer for classifying objects, and one is regarding refining the position of the object’s bounding box.
    Faster R-CNN [49]: The problem with the proposed approaches is selecting the suitable regions in a costly way. In Faster R-CNN, a Region Proposal Network (RPN) is proposed that could propose accurate bounding boxes for the objects in an image cost-effectively. Adding RPN to the CNN architecture leads to a more efficient and faster solution.
    ORE [60]: The Open-World Object Detector (ORE) is a new method for detecting objects in the open world using contrastive clustering and energy-based identification.
    Single-Stage. Single-stage models are end-to-end frameworks that perform the region selection and object detection with the same model; hence, the computation cost is drastically reduced in these models. Here, we review some of the popular models in this category.
    YOLO v1. [50]: In this method, the image is divided into SxS grids, and for each cell of the grid, the bounding boxes plus their confidence scores and the object that is centered on that cell plus its confidence score are calculated. Finally, the prediction of an object will be a function of the two confidence scores of the bounding box and object.
    SSD [51]: The problem with YOLO is that sometimes it might not detect small objects very well due to its fixed-size grids. SSD solves this issue by proposing a more accurate and faster solution using a set of anchor boxes with different scales to make a discrete output space.
    RetinaNet [52]: RetinaNet uses a new loss function (also known as Focal Loss) which forces the model to focus on misclassified samples in the training stage. By doing so, the model could reach a comparable accuracy to the two-stage models.
    NAS-FPN [56]: By utilizing a feature pyramid network, this method intends to learn a more reasonable object detection architecture without designing it manually. This architecture aggregates features at multiple scales.
    EfficientDet [58]: This method examines the design options for neural network models for object detection and suggests critical optimizations to enhance efficiency. These optimizations are used to design a novel family of detectors called EfficientDet. Feature networks and class prediction networks need to be scaled up to optimize accuracy and efficiency, as the authors claim.
Extracting Additional Information. The same object detection approaches and other deep learning models could also be used to detect the image’s relations, concepts, and keywords. In some studies, the detected objects are referred to as concepts [62,64]. In another study, topic extraction was addressed from the image [53]. The image is first fed to a pretrained neural network to extract the features, those features are used as the input to a topic generation model, and the related topics are extracted. RW-AIA [59] finds image keywords by considering label dependencies and modeling the relationship between these labels. They construct a vocabulary graph and, by applying graph convolutional networks (GCNs), find the tag descriptors. Finally, QAIA [61] uses a reweighting quantization function to calculate the similarity between each pair of image keywords in the vocabulary graph.

3.2.2. Enrichment and Linking

Storytelling is the task of creating a coherent and reasonable story that contains imaginary concepts from an input of a set of images. So far, we have reviewed the explicit term extraction methods from the images. However, generating a story with the explicit extracted terms would be monotonous and limited to a set of words. To fill this gap, enriching the extracted terms with external commonsense knowledge bases and graphs is required as the next step of the storytelling framework. In this part, we review some of the enrichment methodologies.
Yang et al. [62] used an object detection method to extract the terms and then used an external knowledge base (ConceptNet [63]) to enrich each term by the external commonsense knowledge. They created a set for the explicit terms and another set for the nodes directly connected to each term in ConceptNet’s Knowledge Graph. They also proposed a vision-aware directional encoding to reduce the noise and obtain the most relevant and informative set of concepts. Chen et al. [64] used a similar approach to select the best concepts from the ConceptNet. They proposed two concept selection methodologies: one using an attention mechanism to select the most relevant concepts in one image and another using an encoder–decoder to directly select the concepts from the images. In another study, Li et al. [65] proposed a new approach to enrich the items. They used association rules mining to mine the cross-modal rules and infer implicit concepts.

4. Task 2. Story Modeling

Data curation is the preprocessing, organization, enrichment, and integration of data collected from various sources. In previous sections, we discussed data curation approaches for image data in detail. To aggregate this huge amount of curated feature data, we can shift away from the common feature data and move to a better organization of data in the form of Knowledge Graphs, a collection of interlinked descriptions of concepts, entities, relationships, and events. Knowledge Graphs put the data into context via linking, as well as semantic metadata, created by subject-matter experts.
We present the Story Model, which transforms the raw image data into contextualized knowledge. Then, it automatically discovers and links the events and entities of interest from the contextualized data to create a Knowledge Graph. Ultimately, it summarizes the Knowledge Graph and facilitates intelligent narrative discovery. It is a primary step before modeling and representing the story based on the data. As a semantic network, this Story Model represents a network of real-world entities, i.e., objects, events, or concepts. It is a reusable data layer for answering complex queries across data silos.
Images require summarization, representation, understanding, and analysis from various perspectives. Summarization is the presentation of a summary of generated data in an informative manner. The image features are considered the cornerstone of image summarization, and the most crucial issue is what features are to be considered in the summarization process. On the other hand, narratives are perhaps the most efficacious way to understand these images. Narratives are a choice of which events/entities to relate to and in what order each narrative can be constructed based on a specific path in the data Knowledge Graph in the Story Model. However, narratives are subjective and depend on the analyst’s perspective. Therefore, analyzing image data narratives using models is indispensable to understanding how analysts reason about images. Therefore, various aspects of the narrative, such as its structure, time, purpose, and listener’s role, should be considered to accomplish this. A story based on multiple images is a unique combination of a set of narratives. Storytelling with image data deals with presenting large amounts of data in a straightforward manner to end-users. Storytelling best represents image data since it captures and represents temporal/sequential relationships between key events. There are multiple levels to a story, i.e., an abstract story might differ from a detailed story. In this section, we first focus on organizing and summarizing feature data to create narratives and the final story. Then, we focus on narrative engineering from the summarized data and categorize it from different perspectives.

4.1. Organizing and Summarizing Feature Data

In previous sections, we discussed how different features have been extracted, collected, summarized, and curated from raw data. In this section, we discuss organizing and summarizing feature data to be prepared for narrative engineering. Here, we examine classification, clustering, and summarization techniques to organize the feature data.

4.1.1. Classification

Multiple features are extracted from images, and images are enriched with metadata extracted from different sources. These metadata belong to various categories and classes. For example, some are words of places and some are human names; some are separate objects and items in the image. These metadata must be classified into various categories to organize our final feature data. Several existing classification methods are suitable for different data types; in this article, some of the most useful ones are described [66].
  • Decision Tree. Decision trees are one of the classification methods that classify the data based on several conditions, each including one or more features of the data. It is a tree model, in that each node contains a condition that divides the training data into two or more parts, and the number of leaf nodes will determine the number of classes.
  • Probabilistic Methods. A model created using probabilistic classifiers estimates the probability of the relation between the feature and its class. Naive Bayes and Logistic Regression are two popular probabilistic classifiers.
  • Support Vector Machines. Support Vector Machines classify the data into two classes and are suitable for binary classification tasks. In the feature space for the data, this method tries to fit a hyperplane that separates the two data classes, so that the hyperplane has the maximum margin with the data of both categories.
  • Neural Networks. Neural networks are also one type of classifier. Different architectures of neural networks with different output and input layers could be used based on the type of data and the number of classes to nonlinearly classify the data into different categories.

4.1.2. Clustering

Sometimes the metadata we use do not belong to specific categories; however, different metadata groups have similar features and could be clustered into a single group. Several existing clustering methods fit different data types. In this section, some of the most useful ones are described [67].
  • Representative-Based Methods. These methods are the most straightforward clustering techniques, since they use the similarity or distance of the data points in the feature space. In these methods, candidates are chosen among either the data points or a function of the data points, such as mean or median, to be the center of the clusters. The most popular techniques in this category are K-Means, K-Median, and K-Medoids.
  • Hierarchical Clustering Methods. Hierarchical clustering methods cluster the data on different levels. In the hierarchical clustering approach, a tree-shaped clustering is produced so that each tree level demonstrates one option for clustering with a specific number of clusters. e.g., the first node of the tree represents all data points in one cluster, and the leaf nodes represent clustering with C clusters, in which C is the number of data points. This approach is advantageous when we need different insights from the clustering and we could obtain those insights by looking at each tree level. Bottom-Up (Agglomerative) and Top-Down (Divisive) are two types of hierarchical clustering approaches.
  • Probabilistic Methods. In the probabilistic approaches, for each data point, C likelihoods will be calculated, in which C is equal to or less than the number of the clusters. In these approaches, each data point could belong to multiple clusters but with different probabilities. This method is called soft clustering.
  • Density-Based Methods. The problem with distance-based and probabilistic clustering is that the shapes of the clusters are always defined based on the model we are using, e.g., the K-means technique’s cluster shape is always spherical. However, sometimes the clusters of our data points have multiple odd shapes, and the clusters are too close to each other. In this scenario, none of the above functions can correctly cluster them. Density-based clustering solves this problem by identifying fine-grained dense regions.

4.1.3. Feature Data Summarization

The features extracted in the previous sections are of different types, such as images, text, words, items, and keywords, and they also have a large volume. Using data summarization is of the utmost importance to effectively analyze such extensive data. There are several summarization techniques for each of the data types. In the storytelling use case, we are dealing with unstructured data as our features. Hence, in this part, we introduce some popular summarization techniques for unstructured data. Different classification and clustering methods discussed in the previous part could also be used to summarize the feature data. e.g., Decision trees, Hidden Markov Model (HMM), Artificial Neural Networks (ANN), and similarity-measure-based models. For text summarization, topic modeling, and natural language processing (NLP), summarization techniques are also widely used. For item and keyword summarization, techniques such as removing irrelevant and less effective items and keywords, frequent itemset selection, and sampling could be used [68].

4.2. Narrative Engineering

Narrative construction develops descriptive text for images using computer vision and natural language processing. However, over and above that, an accurate image and language understanding should be paired syntactically and semantically. There have been various approaches to tackling the task of “Image Narrative Generation” [100,140]. In this section, we first define the concept of a narrative, then investigate its generation process from different perspectives. Narrative construction can be studied and categorized into learning-based, feature-map-based, language-based, and narrative length-based methods.
Definition1. 
A narrative N is a specific subgraph, path, or walk in a Story Model starting from a random node i and ending in another random node j while traversing the Knowledge Graph G with a sequence of vertices in-between them. Graph G is the Knowledge Graph containing the contextualized data information, extracted concepts, objects, topics, captions, metadata, and rules from the image data.
Learning-Based Methods. Narrative construction has utilized a variety of learning-based approaches. We classify them into three main categories. A supervised learning method, which is the first category, refers to training the model under the supervision of a teacher. Labels are used to supervise the learning process. In the second category, reinforcement learning (RL) aims to maximize the long-term reward of agents by taking the optimal action (through trial and error) in a particular state. Finally, a generative adversarial network (GAN) trains a generative model by defining the problem as a supervised learning problem consisting of two submodels: a generator and a discriminator. The generator generates fake new samples and the discriminator tries to ascertain whether the input samples are real or fake. Finally, a zero-sum adversarial game is used to train these two models together until the discriminator is fooled half the time.
  • Supervised Learning Methods. Multimodal Recurrent Neural Network (m-RNN) architecture has been proposed in [69] to handle these two tasks: (1) image-to-sentence description generation and (2) image and sentence retrieval. Additionally, this architecture is trained by utilizing a log-likelihood cost function. The model parameters are learned by differentiating from the cost function given the input and the backpropagation algorithm. Karlpathy et al. [70] introduce a multimodal RNN architecture that learns to generate narratives for image regions based on inferred alignments (multimodal embeddings of convolutions over images and bi-RNNs over sentences). They map every image and sentence into a shared space of h-dimensional vectors. The supervision is carried out at the entire image and sentence level, so they formulate an image–sentence score based on the individual region scores. Vinyals et al. [71] present an end-to-end solution to the caption generation problem, which is fully trainable by employing stochastic gradient descent, and the loss is the sum of each step’s negative log-likelihood of the correct word.
  • Reinforcement Learning (RL). SCST [72] is a reinforcement learning (RL) optimization technique that normalizes rewards by exploiting the output of its test-time inference algorithm. This approach baselines the REINFORCE approach more efficaciously, leading to better results with nondifferentiable evaluation metrics. Ren et al. [73] take a collaborative approach and propose a decision-making framework. They use a policy and value network to predict the word for each step of narrative generation. Specifically, an actor–critic RL algorithm is introduced to learn these two networks. Gordon et al. [74] introduce the Interactive Question Answering (IQA) task (answering questions that demand the agent’s interaction with a dynamic environment) and propose the Hierarchical Interactive Memory Network (HIMN). HIMN is factorized into a Planner, a set of controllers, and a semantic spatial memory. The Planner, formulated as an RL problem, invokes the controllers to explore the environment and answer the question in the IQA task.
  • Generative Adversarial Networks (GANs). Patro et al. [75] present a Correlated Collaborative Model (CCM) that guarantees the coherence of the generated textual explanations and answers. CCM collaborates with the answer and explanation features and employs generative adversarial strategies for training. In addition, the results are robust to noise in images and text (even if the model is not trained for noise-based attacks).
  • Combined Methods (RL + GAN). To generate more human-like answers to questions, Wu et al. [76] combine RL with GANs and introduce a novel framework. This framework updates the generator by employing the reward of the generator policy at each training step. After sampling data from the dialog history (a sequence of textual data), maximum likelihood estimation (MLE) is used to update the generator. Chen et al. [77] introduce a conditional generative adversarial captioning technique to extend RL-based architectures. Furthermore, CNN- and RNN-based architectures are presented for the discriminator module. The discriminator judges whether a human described the resulting caption or if it is machine-generated.
Feature-Map-Based Methods. One of the critical challenges in narrative construction based on an image is extracting visual features which best represent the image content. Therefore, we categorize these methods into three main groups based on various strategies proposed for extracting visual features: CNN-based, attention-based, graph-based, and vision-transformer-based methods, which are discussed in detail in the following paragraphs.
  • CNN-Based Methods. Vinyals et al. [71] employ a vision CNN model to extract image features, since CNNs can embed images in fixed-length vectors. They utilize the result feature vector of GoogleNet [141] for the visual feature extraction step. Moreover, Karpathy et al. [70] used the visual features extracted from AlexNet [142]. Many studies employ the CNN modules to extract features such as [72,143,144].
  • Attention-Based Methods. Simple CNN-based methods have the main advantage of being compact and straightforward. At the same time, the extreme compactness and lack of granularity are crucial issues that need to be addressed. An attention module handles this issue by computing attention weights and attending to specific parts of the visual features. Many approaches fit into attention-based methods that can be divided into three main categories: grid-based, region-based, and self-attention. In the following items, these three categories are further discussed.
    Grid-Based Attention Methods. A significant proportion of image captioning methods use the attention mechanism to make captioning more flexible and provide better granularity. Xu et al. [78] introduced an attention-based image captioning model inspired by a recent study in machine translation [79] and object detection [80,81]. The authors proposed two attention-based image caption generators: a “soft” deterministic attention mechanism and a “hard” stochastic attention mechanism. An adaptive encoder–decoder model [82] also automatically determines when to rely on the language model and when to look at the image (the spatial CNN features at each of the k grid locations of the image).
    Region-Based Attention Methods. Anderson et al. [83] employ a novel bottom-up and top-down attention module (based on Faster R-CNN [49] and task-specific context). First, the bottom-up visual attention module extracts salient regions of an image and represents them using convolutional feature vectors. Then, the top-down module estimates the distribution of attention over image regions (specifies weights of the features). As a result, a weighted average of all image features is the final attended feature vector. The Look-Back and Predict-Forward (LBPF) approach [84] presents two main modules: Look-Back (LB) module and Predict-Forward (PF) module. As the input of the attention module, the LB module concatenates the previous attention vector and the current hidden state. In contrast, the PF module sequentially predicts the two following hidden states based on the current hidden state. For constructing high-quality image captions, the Reflective Decoding Network (RDN) [85] improves the capability of the standard caption generator to handle long sequential modeling by examining the caption’s word consistency. Li et al. [145] also addresses both the tasks of VQA and VQG using the attention mechanism after extracting the visual features from the input image.
    Self-Attention Methods. Despite the widespread use of attention mechanisms in image captioning, we still do not know how closely related attended vectors and given attention queries are. Therefore, Huang et al. [86] proposed the “Attention on Attention” (AoA) module, which specifies the attention results and queries relevancy. Applying AoA to both the encoder and decoder in this research, the authors introduced AoANet for image captioning. Guo et al. [87] first proposed a normalized self-attention (NSA), which indicated that conducting this normalization on the hidden activations inside self-attention is advantageous. Then, a geometric-aware self-attention (GSA) module was proposed to compute the objects’ geometric bias to assist with image comprehension. Furthermore, the self-attention module in the encoder facilitated the EnTangled Attention (ETA) model [88] to examine the detected entities’ relationships.
  • Graph-Based Methods. This image encoder incorporates two kinds of visual relationships (semantic and spatial object relationships) in the proposed GCN-LSTM framework [89], which attempts to explore the relations between objects. Based on these visual relationships, they developed graphs over the detected objects in an image and used GCNs proposed in [146]. The Scene Graph Auto-Encoder (SGAE) [90] embeds inductive bias into a dictionary unsupervised. Subsequently, it is shared as a re-encoder for text generation, enhancing the encoder–decoder performance. For captioning, Yao et al. [91] utilize the hierarchical structure in images at the instance, region, and whole image level. This hierarchical structure is analyzed with a tree-structured LSTM model, and each instance-, region-, and image-level feature is improved. Image encoding is also based on a hierarchical scene parsing architecture.
  • Vision-Transformer-Based Methods. In this category, the methods [147,148,149] study the importance of spatial dimension conversion and its effectiveness on Vision Transformer (ViT) [150]. These methods are considered a better-performing detector-free image captioning model.
Language-Based Methods. Story generation is a cross between computer vision and natural language processing. Researchers use various methods to encode or decode textual data. We categorize these approaches into four groups: RNN-based, CNN-based, Transformer-based, BERT-like, and Diffusion-based methods.
  • RNN-Based Methods. RNNs are a class of artificial neural networks that are derived from feedforward neural networks. RNNs can process variable-length sequences of inputs using their internal state (memory) and are used to handle text data generation due to the sequential structure of the language. Recurrent methods can be divided into three primary types: single-layer, stacked-layer, and attention-based approaches.
    Single-Layer Approaches. Vinyals et al. [71,151] propose a simple single-layer LSTM-based [152] captioning system. Specifically, a convolutional neural Network is employed as an image encoder, followed by LSTM Recurrent Neural Networks as decoders to generate the output sequence. The authors conceptualize image captioning in a way that predicts the probability of a given sentence based on the input image.
    Stacked-Layers Approaches. LRCN model [153] processes the visual input with CNN modules, whose outputs are fed into a stack of recurrent sequence models (two-layer LSTMs) to generate a variable-length sentence description for an input image. Donahue et al. input the image and context word features to the recurrent model at each step instead of feeding visual features to the system solely at the initial phase.
    Attention-Based Approaches. This work [83] introduces top-down and bottom-up attention to salient objects and other image regions. According to this work, based on Faster R-CNN [49], the bottom-up mechanism proposes image regions with a feature vector associated with them (each represented by a pooled convolutional feature vector). In contrast, the top-down mechanism uses task-specific context to predict an attention distribution over the image regions and determine feature weights.
  • CNN-Based Methods. LSTM modules overlook a sentence’s underlying hierarchy. Moreover, a memory cell’s long-term dependencies also demand notable storage, which leads to the introduction of CNNs as language models. Unlike LSTMs, CNNs are faster and can learn the internal structure of sentences. The language CNN model introduced in [154] is able to capture long-range dependencies in sequences. It examines the hierarchical and temporal data sequentially for image captioning. An image captioning method using convolutional LSTM units is proposed in [92] to resolve this issue that arises from LSTM units’ complexity and sequential nature. It uses convolutional machine translation models combined with an attention mechanism to utilize spatial image features. The authors of this work provide valuable insights, such as CNNs produce more entropy, do not suffer from vanishing gradients, and are more accurate. The CNN + CNN framework [93], another fast and competitive model with LSTM-based language models, investigated how the kernel width and layer depth of the language CNN impact image captioning. In a meaningful way, according to the authors, the model can visualize learned attention maps and discover the concepts by paying attention to the related areas in images.
  • Transformer-Based Methods. The majority of conventional captioning systems use an encoder–decoder framework. First, an input image is encoded into a representation of information within the image and then decoded into an image description. However, these practical and state-of-the-art methods overlook the spatial relationships among the detected objects. The Object Relation Transformer [94] integrates object spatial relationship modeling into image captioning. The Dual-Level Collaborative Transformer (DLCT) [95] leverages region and grid features to enhance image captioning. Moreover, the locality-constrained cross-attention (LCCA) module designed in this work addresses the problem of semantic noise produced when two sources of features are directly fused. To guide the alignment of two sources of features, LCCA constructs a geometric alignment graph.
  • BERT-Like Paradigm Methods. Instead of constructing the narrative of an image using the encoder–decoder framework, some approaches have attempted to tackle this task by following the structure of BERT [155]. This category of methods, such as the Vision-Language Pretraining (VLP) model [96], which can be fine-tuned for image-to-text generation and understanding tasks, directly connect the visual and textual inputs.
  • Diffusion-Based Methods. In image captioning, the text tokens are decoded one at a time using an auto-regressive method. Non-autoregressive methods, such as diffusion-based captioning models [156,157,158], emit all words simultaneously, enabling bidirectional textual message exchange, in contrast to autoregressive methods that generate sentences word-by-word.
Narrative Length-Based Methods. Most methods generate narratives for the complete scene in the query image. On the other hand, another category for narrative construction, called dense captioning, generates narratives for each scene region. These two various approaches are discussed in detail in the following paragraphs.
  • Complete Narrative Construction. All the image captioning and narrative construction techniques that generate single or multiple captions for the whole scene and the occurrences in the image fall into this category. The studies and research in this category are discussed in previous sections.
  • Dense Narrative Construction. Dense narrative construction, or dense captioning, introduced by Johnson et al. [97], simultaneously recognizes and describes salient image regions through short text sentences. As a result, it can be viewed as the generalization of the object detection task, where a caption substitutes a tag, or image captioning, where a single region substitutes the entire image. Another proposed approach for dense captioning [98] is based on two ideas: joint inference and context feature fusion. The localization bounding box gradually adapts to the correct position based on the predicted descriptions through a step-by-step joint inference method. Meanwhile, the fusion of context features from regions of interest can better predict image narratives. The notion of relational captioning is introduced in [99], a novel captioning approach to generate captions and narratives concerning relational information among objects in a given image. Furthermore, the multitask triple-stream network (MTTSNet) has been proposed to train the relational information effectively.

5. Task 3: Intelligent Narrative Discovery

In this section, we focus on the issue of intelligent narrative discovery. First, we argue that intent discovery is an indispensable element in comprehending the ultimate goal of an end-user. Then, the image summarization approaches are further discussed.

5.1. Intent Discovery

By exploring raw data—numeric or qualitative datasets—data analysts assist many organizations to make better decisions. In addition, these analysts assist in solving problems by taking vast volumes of complex data and extracting hidden insights from these data. An analyst’s goal is based on prior knowledge and personal assumptions about the data. Accordingly, understanding the analysts’ goal is the primary concern in successful storytelling with data. Based on an analyst’s goal, various stories could be generated, given a set of relevant images. Various studies have been related to intent discovery in various tasks [159,160]. Analysts deliver feedback based on their technical expertise and application domain knowledge. By discovering the end-user’s intention and extracting features from it, the feedback subjectively guides the story generation process.
There are various ways to communicate with the end-users. A common phrase heard over the phone for decades was, “How may I help you?”. Today, online chatbots (i.e., software applications that perform online chat conversations via text or text-to-speech rather than by contacting a live human agent. Through messaging platforms, they can automate conversations and facilitate interactions with customers) accomplish the same task and help us to interact with users. Myriad stories may be generated for a specific goal based on an objective. Therefore, as mentioned before, analyzing the audience is the starting point for developing efficacious chatbots. For example, when used in a police investigation, the chatbot can help determine the investigator’s goal and generate the story based on requirements to give the investigators a deep insight (which is impossible or hard for them to gain without storytelling), freeing them to focus on higher-level problem solving.

5.2. Image Collection Summarization

Intent discovery, mentioned in the previous section, facilitates the image collection summarization process and determines what or how the data are summarized. Existing techniques for storytelling with image data may be split into two categories: vision-based techniques and text-based techniques [101]. Vision-based methods rebuild successive pictures or frames based on a narrative or plot. Visual summarization chiefly consists of selecting important frames or pictures from a series to create a plot. The vision and text techniques primarily focus on summarizing or sorting consecutive pictures or frames and are a shallower task than what is often referred to as “storytelling” [101].
Following Riahi et al. [102], the number of online picture collections is rapidly growing, and it has resulted in an explosion of photos and an accumulation of multimedia data. They also discussed that managing this massive quantity of data is a significant challenge, and novel strategies are necessary to aid users in viewing, browsing, and summarizing these massive collections. Techniques for image summarizing might be classified into two broad categories: visual summarization and multimodal summarization. The term “visual summarizing approaches” refers to a type of work that uses exclusively visual aspects as its summary features. Multimodal image collection summarizing approaches often incorporate additional modalities such as textual, geospatial, or other data types.
Visual Collection Summarization. Singh et al. [37] discussed summarizing an image collection as a critical undertaking that continues to escape practitioners due to the inherent difficulties and distinctions between image collection summarizing and video collection summarizing. Due to the fact that the video contains numerous temporal links that can be utilized using temporal neural networks such as Long Short-Term Memory (LSTM) or Recurrent Neural Networks (RNNs), they confirm to be advantageous when constructing DL-based architectures for the incident and video summarization.
As Sharma et al. [103] mentioned, when we use digital cameras, we usually end up with repeating and similar photographs that people wish to delete. Manually sorting through such a vast collection and selecting the finest photographs is time-consuming. Sharma et al. [103] suggested a method for summarizing a collection of pictures into a unique set of representative images. They partitioned the photos into a “Bag of words” representation constructed using Scale-Invariant Feature Transform (SIFT) vectors and then clustered these vectors into categories using a simplified Latent Dirichlet Allocation (LDA) approach. They portrayed each photo as a “bag of words” using SIFT vectors by clustering these vectors into multiple bins and displaying each image as a histogram of the probability density of these vectors over such bins. Finally, they classified the picture collection into clusters using the topic modeling LDA approach. The image vector determines the best image with the smallest sum of square distances inside the cluster from the other image vectors [103].
Camargo et al. [104] presented a technique for incorporating domain knowledge into summarizing large image sets. They employed a multiclass kernel alignment technique to train a kernel function that takes domain knowledge into account. The kernel function serves as the foundation for a clustering technique that creates a subset of the visual collection, termed the summary.
Features are retrieved from the remaining pictures, and the kernel function is computed using the previously acquired combination function. Following them, when a new image is added to the collections, it may be categorized into one of the clusters by calculating its resemblance to the medoids utilizing the combination function.
Sreelakshmi et al. [105] developed two unsupervised approaches for extractive image summarizing. The first technique, termed image summarization through clustering, employs One-Class Support Vector Machine (SVM) clustering accompanied by outlier identification in the process of extracting representative images. The second technique, dubbed image summarization using an auto-encoder, employs an auto-encoder to assign a representative value to each picture in the collection and then creates a summary using photos with varying values.
Multimodal Image Collection. The phrase “multi-modal image collection” refers to a collection of photos that include other modalities such as video, text, and hyperlinks [109]. Chen et al. [106] approached extractive multimodal summarization as a classification problem and proposed a text–image classification technique based on a multimodal RNN model. Their strategy encrypts words or phrases using hierarchical RNNs frameworks and the ordered image set using a CNN model and an RNN model, further determining the probability of sentences being selected and the likelihood of sentences being aligned using a logistic classifier with characteristics for text coverage, text duplication, photo set coverage, and photo set duplication. By merging the essential scores of words and the hidden sentence–image arrangement, two techniques are provided for computing the image set redundant feature.
For event summarization, Qian et al. [107] argued that it had been a contentious topic of how to make sense of this deluge of data in order to discover and forecast breaking events. Additionally, they highlighted that while the majority of existing systems focus on event recognition, event location estimate, and text-based summary, a tiny number of works have concentrated on event summarizing. Then, they designed a framework for event summarizing based on social media, consisting of three stages: (1) A coarse-to-fine filtering technique is used to reduce superfluous data. (2) A unique technique called User–Text–Image Co-Clustering (UTICC) is suggested for simultaneously discovering subevents from blogs that contain several media types—user, text, and image. (3) A multimedia event summarizing approach is used to find representative words and pictures, which are then combined to provide a holistic, visually represented summary of the incidents.
Kuzovkin et al. [108] investigated the idea of context-aware picture quality evaluation, in which the photo context is determined using clustering, and statistics from both the extracted context and the complete photo collection are utilized to assist the detection of low-quality photographs. They selected to show their concept by utilizing sharpness as the primary criterion for image quality. As such, it is proposed that a photograph be eliminated if its sharpness is insufficient in the scope of the collection. They also believed that, simultaneously, sharpness needs vary significantly according to content type and user purpose, necessitating context-aware customization.

5.3. Narrative Extension

The presented Story Model is a Knowledge Graph constructed after curating and preprocessing the raw data. This graph contains all the raw and contextualized data information, extracted concepts, objects, topics, captions, metadata, and rules. This Knowledge Graph is a network of interconnected data that integrates semantics to allow further interpretation of the underlying data. Since stories can be subjective and the intent discovery is a critical step, a vast number of stories may be generated. In this section, extending the resulting narrative, finding particular paths in a graph, and finally, defining it as a unique narrative based on the requested intentions are further explored.
We aim to find specific paths/subgraphs based on end-users’ intent. Various approaches, such as graph2vec [161], have been proposed to work with graph data. Using graph2vec, several rooted subgraphs can be extracted based on the analyst’s intention and the Story Model. An entire graph is treated as a document in graph2vec, with the rooted subgraphs around each node as words. Graphs are composed of different subgraphs in the same way that sentences and documents are composed of different words. In addition to rooted subgraphs, other substructures such as nodes, paths, and walks could constitute a graph’s atomic entities. Accordingly, the output of this step is a set of graph walks/paths or subgraphs employing the graph2vec algorithm. We intend to extend feature/narrative engineering to discover narratives that could be generated based on the needs of an analyst. Finally, the story could be generated based on some high-level extracted knowledge, i.e., these subgraphs, and graph paths/walks, as discussed in the following Section 6.

6. Task 4: Story Creation

6.1. Story Creation Framework

How can we generate a coherent story from a collection of images? How can that story use rich vocabulary and various styles that accurately describe the objects and concepts in the pictures and ensure that the sentences are semantically and logically coherent? Different narratives can be constructed in a subjective manner based on end-user intent. In this section, we study the story creation framework and techniques based on the narratives and the user’s intentions, which should be further assessed by domain experts. The feedback received from the human-in-the-loop process and the knowledge of experts assist in enriching/annotating the data using RL approaches.
The framework of constructing the Data Lake [162] and Knowledge Lake [163] from the raw data has been studied well in the context of textual data. However, for storytelling with image data, an Image Data Lake is constructed based on the raw image data. By creating the Image Data Lake, researchers seek to organize the raw image data. Moreover, the Image Knowledge Lake contains all the curated and contextualized image data created by the raw image. Various features, objects, concepts, captions, keywords, topics, and/or rules may be extracted using different techniques. All these features constitute a story graph model, which contains high-level knowledge and results in different paths/subgraphs. These paths/subgraphs, intelligent interactive widgets, and visualization strategies facilitate the story-generation process. Although there are automatic approaches to creating and assessing the generated story, RL techniques are also considered very effective in creating stories.

6.2. Story Creation Techniques

Storytelling with image data involves describing a series of images in a story-like manner. A storytelling approach aims not only to describe facts but also to convey human-like narratives. The literal and concrete content of the image is captured when trying to consider images in isolation. However, generating human-like narratives demands further inference and creativity. The first dataset of sequential images with descriptions and some baseline experiments has been introduced in [110] for storytelling with image data. Lukin et al. [119] define the task of storytelling with image data as a pipeline of three separate task modules: Object Identification, Single-Image Inferencing, and Multi-Image Narration. This pipeline helps construct a story tailored to a target audience. Table 4 summarizes all the proposed methods for storytelling with image data, and TR is the short form for transformer. The Relevant Phases column refers to phases proposed in Figure 2. Although these works may be relevant to other phases (2, 3, and 5), they are directly relevant to phases 1, 4, and 6.

6.2.1. RL-Based Methods

Similarly to image captioning, RL has been applied to storytelling with image data [112,113,114,117,164,165]. Unlike image captioning, storytelling with image data presents a much broader range of potential stories than image captioning, so finding the right reward function can be tricky. The Adversarial REward Learning (AREL) technique [112] creates more human-like narratives with expressive language styles and learns an intelligent reward function. A Boltzmann distribution associates reward learning with distribution approximation before designing an adversarial process using policy and reward models. The policy model produces the story, whereas a reward model learns the reward function, which can be used to optimize the policy.
An algorithm for generating stories for photo streams is also introduced in [113]. The hierarchical structure of the model and the RL framework with two discriminators leads to the creation of relevant and explicit paragraphs. The story generator exploits the hierarchical RNN to extract the paragraph structure. A multimodal and a language-style discriminator act as two critic networks and guarantee the generated paragraphs’ relevancy and style. The story generator intends to create indistinguishable human-like stories, and the two discriminators are trained to differentiate a generated story from a real one. The visual story generation problem for an image sequence is further studied in [114]. This problem is divided into two hierarchical decoders employing reinforcement learning. It is demonstrated that hierarchical RL can enhance story creation. The Relevance–Expressiveness–Coherence through Reinforcement Learning (ReCo-RL) [117] model has composite reward functions, which result in a relevant, expressive, and coherent story based on a sequence of images. This method contains two layers: (1) a high-level decoder and (2) a low-level decoder with three quality evaluation components.

6.2.2. Other Methods

The dataset of sequential images with descriptions has been first introduced in [110] for storytelling with image data. This sequential vision-to-language dataset helps researchers to move forward from processing images in isolation to creating creative stories based on an image stream. In this section, we further investigate those methods that attempt to tackle storytelling with image data with or without intermediate data.
Yu et al. [111] propose a three-step framework for storytelling. These three steps are hierarchically attentive RNNs that encode the whole album photos, select representative photos using selection mechanisms, and compose a story by taking the weighted representation. Most visual story generation approaches lack commonsense reasoning. Stories are written artistically and may include many imaginary concepts that do not exist in the image. Accordingly, rational reasoning and semantic association are essential for generating these concepts. The model presented in [62] proposes a commonsense-based generative model to address this challenge. Vision-aware common sense reasoning and knowledge-augmented generation are both parts of this model. KG-Story, proposed in [115], is a three-stage technique that exploits external resources, such as Knowledge Graphs, to generate engaging sequential stories for a given image. First, it extracts representative words, enriches the set using Knowledge Graphs, and generates stories based on this enriched set.
Jung et al. [116] propose an effective method to learn imaginative capability for storytelling with image data by using a hide-and-tell training strategy. The authors aim to learn to imagine a storyline that bridges the visual gap between the given images with the subjective story. First, some of the images are randomly removed from the image set in this strategy, and then the model is trained to generate a sequential story without the removed images. The authors in [118] argue that an auxiliary transitional adaptation task is necessary between the pretraining and fine-tuning phases. For challenging tasks such as storytelling with image data, the transitional adaptation seeks to harmonize visual encoding and language modeling. Based on the human logic of how we write stories, Xu et al. [120] introduced a new imagine–reason–write (IRW) model for storytelling with image data. To develop human-like stories, they leveraged an imagining module, a reasoning module to utilize the exterior commonsense knowledge, and a guiding unit to combine visual and semantic knowledge. Many other approaches have attempted to tackle storytelling with image data, such as [64,65,101,121,122,166,167,168,169,170,171,172,173,174,175,176,177], which fall into this category.

7. Task 5: Story Presentation and Querying

7.1. Intelligent Widget for Narrative Discovery

In the past decades, numerous images have been uploaded to online platforms containing hidden, interesting information that should be discovered. However, the uploaded raw data do not deliver any insights. Accordingly, these raw data should be curated and transformed into knowledge. Data analytics helps understand the data; however, it is insufficient, and a solution to accomplish such knowledge could be storytelling with image data.
Personalized storytelling demands human–computer interaction, since direct interaction with the end-users is indispensable. Story creation has complicated challenges; however, representing the generated story to end-users is another issue that needs careful attention. Creating graphical representations of data is known as data visualization. Visualization techniques translate information into a visual context, such as a map or graph, so the human brain can comprehend and extract hidden insights. For example, large datasets can be visualized to identify patterns, trends, and outliers. Therefore, an interactive visualization module, a dashboard, is the most proper environment for engaging users and being able to recommend various data based on the user’s needs. Regardless, storytelling with image data is more than simply visualizing data. Instead, this process transforms raw image data into insightful narratives by highlighting valuable information and proving key points. Together, storytelling and visualization make a powerful combination. An intelligent widget allows for presenting a contextual and visual component alongside content in a platform, supplying the end-users with a visual fragment of the most relevant and representative data. It also enables user interaction and uses domain knowledge and expertise to achieve a subjective demand. Visualization objectives, benefits, and challenges are discussed in the following.
Visualization Objectives. Data visualization serves a straightforward objective. It is to comprehend the data and use them for the end-user benefit. However, since data are complex, they attain more value when visualized. Therefore, visualization is crucial for communicating data findings, identifying patterns, and interacting with data.
Visualization Benefits. In addition to providing a better understanding of the data, data visualization facilitates sharing information with some audiences, helps accurately analyze data, and uncovers relationships between events and entities.
Visualization Challenges. Visualization delivers estimation, not accuracy. It may not be objective, may have improper design issues, and the core messages may be skipped.

7.2. Visualization Techniques

Data visualization involves various strategies, so knowing which ones to utilize and when is essential. We can point out bar charts, line charts, pie charts, histograms, radial maps, box plots, and violin plots as some of the essential data visualization techniques.
Static Data Visualization. There is no interaction capability in static data visualization, and the information does not change over time. Because static visualizations cannot be adjusted, such as through filtering and zooming, it is vital to consider what data are displayed. Knaflic et al. [123] mainly focuses on static data visualization.
Interactive Data Visualization. Users can better identify patterns and discover new relationships within their data by allowing direct interaction. Data visualization assists in transforming raw data into valuable insights. Using interactive visualization, the end-user experience is also collected, which assists the customer journey/experience process. As an interactive data visualization approach, we can point to the storytelling engine in iStory presented in [6].
Adaptive Data Visualization. This visualization improves visualization by incorporating adaptations, i.e., changing the visualization based on various end-user features, either explicitly provided or inferred from the traces of the user’s actions. For example, Toker et al. [124] proves that specific user characteristics significantly affect task efficiency, user preference, and ease of use.

8. Task 6: Quality Assessment and Dataset

Storytelling with image data is the process of constructing a literary story from an image stream, which necessitates a more in-depth knowledge of the stream’s event flow [112]. After creating digital storytelling, it is critical to undertake assessments to ensure that the systems are more reflective and accurate [178]. Different assessors evaluated digital storytelling. Assessments of machine-generated descriptions of images may be classified as automatic or human assessments [131]. Some distinct metrics were initially developed for machine translation, and image captioning is used to undertake automatic evaluations. Bilingual Evaluation Understudy (BLEU) [125], Metric for Evaluation of Translation with Explicit Ordering (METEOR) [126], Consensus-based Image Description Evaluation (CIDEr) [128], Word Mover’s Distance (WMD) [179], Recall-oriented Understudy for Gisting Evaluation (ROUGE) [180], and Semantic Propositional Image Captioning Evaluation (SPICE) [127] are some of these models. Human assessments are also conducted due to the poor performance of automatic metrics in light of the reality that the same image can be described in a variety of ways [131]. In this section, we discuss automatic assessments and human evaluation separately. The quality assessment process is demonstrated in Figure 5. As represented in the story generation process, the quality of the generated story should be evaluated. We categorize the quality assessment measures into two classes based on evaluation approaches proposed for storytelling with image data. Automatic assessments such as BLEU and SPICE are examples of the first category. For the second category, the knowledge of human beings and domain experts is utilized to assess and fine-tune the Knowledge Lake.

8.1. Automatic Assessment

Determining the quality of created text remains a significant difficulty [117]. In machine translation, some metrics such as BLEU [125] and METEOR [126] are commonly utilized. In addition, for image captioning evaluation, CIDEr [128] and SPICE [127] are a kind of text summarization evaluation tool. However, each of these metrics has drawbacks for analyzing natural language performance, as there is a significant gap between automated metrics and human evaluation [117]. Recent research has focused on more natural evaluations of text creation tasks, such as structuredness, variety, and readability [112,129,130]. As follows, we discuss each metric in detail, and [131,132] Table 5 indicates a summary of the evaluation metrics considered in this section.
Bilingual Evaluation Understudy (BLEU). BLEU [125] is one of the earliest and most widely used metrics used to measure the similarity between two texts and is established for the automatic evaluation of machine translation platforms [132]. It is a precision-based measure that calculates the n-gram overlap between the assumption and the reference [133]. BLEU represents the proportion of overlapping n-grams to the total number of n-grams in the assumption [133]. To be accurate, the numerator includes the total number of overlapping n-grams across all hypotheses, whereas the denominator comprises the total number of n-grams throughout all assumptions [133]. BLEU stipulates that a high-scoring explanation should meet the ground truth in length, i.e., a precise match of words and their arrangement [131]. An accurate match will receive a BLEU assessment score of 1 [131].
Metric for Evaluation of Translation with Explicit Ordering (METEOR). METEOR [126] is another measurement for machine translation. It was designed to overcome the inadequacies of BLEU, and instead of requiring a precise lexical match, METEOR implements semantic matches [131]. It may be described as the arithmetic mean of accuracy and recall of unigram matches among texts [132]. The METEOR score depends on how effectively the produced and reference phrases are constructed [131]. Each phrase is represented as a collection of unigrams, and alignment is accomplished by mapping the unigrams of nominees and reference phrases [131]. A unigram in a nominee phrase (or reference phrase) would map to either a unigram in the reference phrase (or candidate phrase) or to zero throughout the mapping process [131]. Furthermore, it uses synonyms and the matching of phrases. METEOR solves various shortcomings of BLEU, such as the assessment of recall and the absence of direct word matching [132]. In cases when numerous alignment possibilities are available between two phrases, the alignment arrangement with the fewest crossings is selected [131]. After completing the alignment procedure, the METEOR score is determined [131].
Recall-Oriented Understudy for Gisting Evaluation (ROUGE). In 2004, ROUGE [180] was first developed for evaluating summarization programs, and this assessment is performed by comparing overlapping n-grams, word sequences, and word pairs [132]. Using n-grams, the algorithm determines the recall value of the created sentences that match the reference phrases [131]. Comparable to BLEU, ROUGE is determined by altering the number of n-grams. ROUGE is based on recall rates, whereas BLEU is based on accuracy [131] Since the ROUGE metric depends heavily on recollection, it favors extended sentences [132]. In addition to n-gram variations of ROUGEn, there is also ROUGEL (Longest Common Subsequence), ROUGES (Skip-Bigram Co-Occurrences Statistics), ROUGEW (Weighted Longest Common Subsequence), and ROUGESU variants (extension of ROUGES) [131].
Semantic Propositional Image Captioning Evaluation (SPICE). SPICE [127] is a recently developed measure for measuring the similarity of picture captions [132]. It is determined by comparing the scenery graph tuples of the prospective phrase with those of all reference phrases [132]. Using a dependency tree structure, the semantic image graph represents the objects’ properties and relationships [131]. The SPICE value is thereafter defined as the F1-score depending on the correspondence between the candidates and reference description tuples [132].
Consensus-Based Image Description Evaluation (CIDEr). CIDEr [128] is intended as a specialized measure for evaluating picture captioning, although it operates in a cognitive, technical manner and only expands current metrics by weighting tf-idf across n-grams [132]. It assesses the agreement between an anticipated sentence and the image’s reference phrases. It executes stemming and transforms all candidate and reference phrases’ words into the root types [131]. Each phrase is represented by a collection of n-grams comprising one to four words via CIDEr [131]. To encode the agreement between the anticipated phrase and the reference phrase, the co-occurrence rate of n-grams in both phrases is measured [131]. Therefore, for the purpose of computing this measure, initial stemming is performed, and each phrase is represented by a set of 1 to 4 grams [132].
As a summary, we have discussed various metrics that are commonly used to evaluate the quality of text generated by machine translation and image captioning systems. The metrics discussed include BLEU, METEOR, ROUGE, SPICE, and CIDEr. BLEU is a precision-based measure that calculates the overlap between the generated text and a reference text using n-grams [133]. METEOR, on the other hand, is also a measure for machine translation; it was designed to overcome the limitations of BLEU by using semantic matches instead of requiring a precise lexical matches [131]. ROUGE is a metric developed for evaluating summarization programs; it is performed by comparing overlapping n-grams, word sequences, and word pairs [132]. SPICE is a measure that is recently developed for measuring the similarity of picture captions [132]. Lastly, CIDEr is a specialized measure intended for evaluating image captioning; it operates in a cognitive and technical manner [132]. In general, each metric has its own strengths and weaknesses, and it is more appropriate to use one depending on the specific task and its requirements.
In addition to the objective metrics (described above) that several storytelling studies appear to employ in their evaluations, subjective metrics such as fidelity and coherence are also necessary. For a work involving creative generation, such as story generation, there are no valid automatic evaluation criteria for assessing qualities such as interestingness and coherence [129]. There are four primary subjective metrics: fidelity (if the story corresponds to the title), coherence (if the story is logically valid and cohesive), interestingness (if the story is engaging), and overall user satisfaction (how readers enjoy the story) [129]. Then, a cohesive narrative should arrange its sentences in the proper sequential sequence and maintain the same theme between adjacent sentences [117]. In addition, one technique to determine the relevance between an image and its produced explanation is to match the things specified in the explanation to the image’s bounding boxes [117].

8.2. Human Assessment

The optimal method for evaluating a language processing system is to have humans analyze the system’s results [133]. Due to the unavailability of reference captioning and the low connection between automated assessment measures and human assessments, human evaluations are frequently utilized to assess the quality of robot captions [131]. Depending on the criteria of the project and the evaluation’s purpose, the evaluators might be specialists, crowd-sourced annotators, or perhaps even end-users [133]. Such human judgments can be organized further using metrics such as coherence or grammar accurateness [131]. The majority of human assessments are focused on checking for completion of the task, i.e., people are asked to score or examine the generated phrases (and the producing systems) to determine how well they match the overall task criteria [133]. In systems that evaluate grammatical accuracy, the phrases are evaluated based on their grammatical correctness, even without image content being seen by the evaluators; in this scenario, many phrases may receive the same score [131].
Wang et al. [112] developed and conducted a rigorous human assessment using Amazon Mechanical Turk, which reveals that the produced tales of their technique are superior in terms of relevancy, creativity, and definiteness. Kilickaya et al. [132] analyzed the degree to which automated measures resemble human evaluations by evaluating their relationships with the obtained human evaluations. Hu et al. [117] stated that given the complicated nature of the narrative problem, they undertook additional human review utilizing Amazon Mechanical Turk to specifically check the quality of the stories created by all the models.

8.3. Dataset

The Visual Storytelling Dataset (VIST) [110], which is a sequential vision-to-language dataset, has been widely used for storytelling with image data. This dataset consists of 10,117 Flickr albums with 210,819 unique photos. Each album has an average of 20.8 photos, and the average duration of each album is 7.9 h. Stories consist of five images from an album with five descriptions (mainly one sentence per image). Amazon’s Mechanical Turk (AMT) workers have chosen, organized, and annotated these images, and the same album is paired with five various stories as a reference. After filtering, the size of the dataset is 50,136 samples and is divided into 3 primary splits: training, validation, and testing. The training size is about 40,098 samples: 4988 for validation and 5050 for testing. The VIST-Edit1 dataset [181] also includes 14,905 human-edited versions of 2981 machine-generated visual stories.
The AESOP dataset [182] is built with three guiding principles: (i) Creativity Over Perception, (ii) Causal and Coherent Narratives, and (iii) Constrained World Knowledge. In AESOP, stories are composed of three image–text panels, with the visual parts generated by the drag-and-drop interface. In total, 7062 stories containing 21,186 abstract visual scenes with corresponding text were collected. In the VHED (VIST Human Evaluation Data) dataset [183], the story pairs with zero ranking gap are removed, which yields 13,875 story pairs altogether. The authors divided the train–test–validation sets into 11,208, 1351, and 1316 story pairs in an 8:1:1 ratio.
On the other hand, an image-based cooking dataset [173] is presented for sequential procedural (how-to) text generation, which consists of 16,441 cooking recipes with 160,479 photos (for food, dessert, and recipe topics) associated with different steps. The authors used 80% of the dataset for training, 10% for validation, and 10% for testing their models. Another similar dataset, Recipe1M+ [184], is a new large-scale, structured corpus of over 1 million cooking recipes and 13 million food images. An overview of the datasets and the approaches that utilized these datasets in their study are represented in Table 6.

9. Conclusions, Discussion, and Future Directions

The field of storytelling with image data is a relatively new area of research that has not been well-established despite recent accomplishments in storytelling in general. To address this, a systematic review and a comparative analysis of methods and tools were conducted to identify, evaluate, and interpret relevant research in this field. The state of the art in the curation, summarization, and presentation of large amounts of image data in a succinct and consumable manner to end-users was analyzed, and a taxonomy was introduced to identify important tasks in constructing narratives and stories from image data.
The proposed taxonomy consists of several phases, including data curation (from preprocessing to extraction, enrichment, linking, and adding value), story modeling, intelligent narrative discovery, story creation, and story presentation and querying. It is argued that storytelling is distinct from simple data visualization techniques or image data analytics, since it enables the discovery and understanding of hidden, complex, and valuable data insights. The paper also discussed the evaluation measures for assessing the quality of the generated story, which are crucial for ensuring that the story is both informative and relevant to the end-user. In summary, this paper lays the foundation for further research in the field of storytelling with image data by providing a framework for identifying important tasks and evaluation measures.

9.1. Discussion

The proposed approach of storytelling with image data has several advantages. First, this framework can help address the challenges in understanding and analyzing large amounts of image data, which are often scattered across different sources and data islands. By curating and summarizing these data in a digestible manner, storytelling with image data can help users gain a better understanding of the insights and relationships locked within the data. Moreover, the use of storytelling as a metaphor can make the data more accessible to a wider range of users who may not have the technical skills to understand complex data analysis techniques.
However, this approach also faces several challenges. One of the major obstacles is the lack of effective methods for labeling, captioning, and extracting information from images. As a result, it can be difficult to ensure the accuracy and relevance of the data presented in the stories. Another challenge is the potential for bias and subjectivity in the narratives presented in the stories. Depending on the storyteller’s perspective, the story may focus on certain details and overlook others, potentially leading to incomplete or misleading interpretations of the data. Additionally, the sheer volume of image data available poses a significant challenge for data processing and storage, making it necessary to develop scalable and efficient methods for analyzing and presenting these data in a meaningful way.
In particular, while the storytelling with image data approach has great potential for improving data comprehension and analysis, it also faces several challenges. Addressing these challenges will require ongoing research and development of new methods for image data labeling, extraction, and analysis, as well as careful consideration of the potential for bias and subjectivity in the narratives presented in the stories. With continued innovation and collaboration, storytelling with image data has the potential to revolutionize the way we analyze and understand large amounts of unstructured data in the digital age.

9.2. Future Directions

The field of storytelling with image data is a rapidly evolving research area, with ongoing efforts to improve the techniques and metrics used to assess the generated story. Despite recent advances, there are still significant knowledge gaps and limitations in the state-of-the-art methods. Recent research in text generation has focused on open-ended domains, such as stories, but evaluating the quality of the generated text remains a complex challenge. Current evaluation methods often rely on human judgments of the quality of narratives, which can be unreliable if not properly conducted. Improving the quality assessment of storytelling with image data is essential and requires further investigation. Additionally, benchmark datasets in different domains of storytelling with image data need to be properly labeled to facilitate research and development in this field.
In future work, we aim to use the knowledge gained from this survey to present an Open Story Model that will transform raw image data into contextualized data and knowledge. The model will automatically discover and connect events and entities from the contextualized data to construct a Knowledge Graph. This graph will be summarized and used to facilitate intelligent narrative discovery, enabling image data stories to combine with narratives to reduce ambiguity and connect image data with context. The model will also support interactive visualization on top of the data summaries to help analysts construct their own stories based on their points of view and subjective goals.
There are several other potential areas for future research and development in the field of storytelling with image data. Some potential avenues of exploration include the following: (i) Developing more advanced metrics for evaluating image data stories, such as those that take into account sentence structure and topic coherence. These metrics could help improve the quality assessment of image data stories and provide insights into specific errors made by the model. (ii) Exploring new approaches for generating image data stories that are more creative and engaging. For example, researchers could explore the use of generative adversarial networks (GANs) to create more visually appealing and realistic image data stories. (iii) Investigating the use of multimodal data sources to enhance the quality of image data stories. For example, combining image data with text, audio, or video data could help to provide a more complete and engaging story. (iv) Developing new interactive tools and platforms for creating and sharing image data stories. These tools could be designed to make it easier for users to explore and interact with image data stories and to share their own stories with others. (v) Applying image data storytelling techniques to new domains and applications. For example, researchers could explore the use of image data stories in education, healthcare, or social media, where they could be used to communicate complex information in a more engaging and accessible way.
Overall, the field of storytelling with image data is still in its early stages, and there is a wealth of potential areas for future research and development. As researchers continue to explore these areas, we can expect to see significant advances in the techniques and tools used to create and evaluate image data stories, with far-reaching implications for a wide range of applications.

Author Contributions

Conceptualization, F.L. and A.B.; validation, F.L., A.B., M.J. and H.B.; formal analysis, F.L. and A.B.; investigation, F.L. and A.B.; resources, F.L. and A.B.; writing—original draft preparation, F.L., A.B., H.F. and M.P.; writing—review and editing, F.L., A.B., M.J. and H.B.; visualization, F.L. and A.B.; supervision, A.B., M.J. and H.B.; project administration, F.L. and A.B. All authors have read and agreed to the published version of the manuscript.

Funding

This research received no external funding.

Data Availability Statement

Data is contained within the article.

Acknowledgments

We acknowledge the the Centre for Applied Artificial Intelligence (https://www.mq.edu.au/research/research-centres-groups-and-facilities/centres/centre-for-applied-artificial-intelligence, accessed on 1 December 2022) at Macquarie University for funding this research.

Conflicts of Interest

The authors declare no conflict of interest.

References

  1. Beheshti, A.; Ghodratnama, S.; Elahi, M.; Farhood, H. Social Data Analytics; CRC Press: Boca Raton, FL, USA, 2022. [Google Scholar]
  2. Lindeberg, T. Scale Invariant Feature Transform; KTH: Stockholm, Sweden, 2012. [Google Scholar]
  3. Bay, H.; Ess, A.; Tuytelaars, T.; Van Gool, L. Speeded-up robust features (SURF). Comput. Vis. Image Underst. 2008, 110, 346–359. [Google Scholar] [CrossRef]
  4. Calonder, M.; Lepetit, V.; Strecha, C.; Fua, P. Brief: Binary robust independent elementary features. In Proceedings of the European Conference on Computer Vision, Heraklion, Greece, 5–11 September 2010; Springer: Berlin/Heidelberg, Germany, 2010; pp. 778–792. [Google Scholar]
  5. Li, Q.; Li, J.; Sheng, J.; Cui, S.; Wu, J.; Hei, Y.; Peng, H.; Guo, S.; Wang, L.; Beheshti, A.; et al. A Survey on Deep Learning Event Extraction: Approaches and Applications. IEEE Trans. Neural Netw. Learn. Syst. 2022; Early Access. [Google Scholar] [CrossRef]
  6. Beheshti, A.; Tabebordbar, A.; Benatallah, B. istory: Intelligent storytelling with social data. In Proceedings of the Companion Proceedings of the Web Conference 2020, Taipei, Taiwan, 20–24 April 2020; pp. 253–256. [Google Scholar]
  7. Thöny, M.; Schnürer, R.; Sieber, R.; Hurni, L.; Pajarola, R. Storytelling in interactive 3D geographic visualization systems. ISPRS Int. J. Geo-Inf. 2018, 7, 123. [Google Scholar] [CrossRef] [Green Version]
  8. Beheshti, A. Knowledge base 4.0: Using crowdsourcing services for mimicking the knowledge of domain experts. In Proceedings of the 2022 IEEE International Conference on Web Services (ICWS), Barcelona, Spain, 11–15 July 2022; IEEE: Piscataway, NJ, USA, 2022; pp. 425–427. [Google Scholar]
  9. Beheshti, A.; Benatallah, B.; Sheng, Q.Z.; Schiliro, F. Intelligent knowledge lakes: The age of artificial intelligence and big data. In Proceedings of the International Conference on Web Information Systems Engineering, Amsterdam, The Netherlands, 20–24 October 2020; Springer: Berlin/Heidelberg, Germany, 2020; pp. 24–34. [Google Scholar]
  10. Zhang, D.; Cui, M.; Yang, Y.; Yang, P.; Xie, C.; Liu, D.; Yu, B.; Chen, Z. Knowledge Graph-based image classification refinement. IEEE Access 2019, 7, 57678–57690. [Google Scholar] [CrossRef]
  11. Gong, W.; Zhang, X.; Chen, Y.; He, Q.; Beheshti, A.; Xu, X.; Yan, C.; Qi, L. DAWAR: Diversity-aware web APIs recommendation for mashup creation based on correlation graph. In Proceedings of the 45th International ACM SIGIR Conference on Research and Development in Information Retrieval, Madrid, Spain, 11–15 July 2022; pp. 395–404. [Google Scholar]
  12. Keele, Staffs. Guidelines for Performing Systematic Literature Reviews in Software Engineering; EBSE Technical Report; ver. 2.3 ebse Technical Report; Keele University: Keele, UK, 2007. [Google Scholar]
  13. Sagheer, S.V.M.; George, S.N. A review on medical image denoising algorithms. Biomed. Signal Process. Control 2020, 61, 102036. [Google Scholar] [CrossRef]
  14. Brooks, T.; Mildenhall, B.; Xue, T.; Chen, J.; Sharlet, D.; Barron, J.T. Unprocessing images for learned raw denoising. In Proceedings of the IEEE/CVF Conference on Computer Vision and Pattern Recognition, Long Beach, CA, USA, 16–17 June 2019; pp. 11036–11045. [Google Scholar]
  15. Saafin, W.; Schaefer, G. Pre-processing techniques for colour digital pathology image analysis. In Proceedings of the Annual Conference on Medical Image Understanding and Analysis, Edinburgh, UK, 11–13 July 2017; Springer: Berlin/Heidelberg, Germany, 2017; pp. 551–560. [Google Scholar]
  16. Krig, S. Image pre-processing. In Computer Vision Metrics; Springer: Berlin/Heidelberg, Germany, 2016; pp. 35–74. [Google Scholar]
  17. Heilbronner, R.; Barrett, S. Pre-processing. In Image Analysis in Earth Sciences; Springer: Berlin/Heidelberg, Germany, 2014; pp. 59–73. [Google Scholar]
  18. Wang, Y.; Cao, Y.; Zha, Z.J.; Zhang, J.; Xiong, Z.; Zhang, W.; Wu, F. Progressive retinex: Mutually reinforced illumination-noise perception network for low-light image enhancement. In Proceedings of the 27th ACM International Conference on Multimedia, Nice, France, 21–25 October 2019; pp. 2015–2023. [Google Scholar]
  19. Heilbronner, R.; Barrett, S. Image Analysis in Earth Sciences: Microstructures and Textures of Earth Materials; Springer Science & Business Media: Berlin, Germany, 2013; Volume 129. [Google Scholar]
  20. Kim, W. Low-light image enhancement by diffusion pyramid with residuals. J. Vis. Commun. Image Represent. 2021, 81, 103364. [Google Scholar] [CrossRef]
  21. Pang, B.; Zhai, D.; Jiang, J.; Liu, X. Single image deraining via scale-space invariant attention neural network. In Proceedings of the 28th ACM International Conference on Multimedia, Virtual/Seattle, WA, USA, 12–16 October 2020; pp. 375–383. [Google Scholar]
  22. Liu, Y.; Yeoh, J.K.; Chua, D.K. Deep learning–based enhancement of motion blurred UAV concrete crack images. J. Comput. Civ. Eng. 2020, 34, 04020028. [Google Scholar] [CrossRef]
  23. Bai, C.; Liu, C.; Yu, X.; Peng, T.; Min, J.; Yan, S.; Dan, D.; Yao, B. Imaging enhancement of light-sheet fluorescence microscopy via deep learning. IEEE Photonics Technol. Lett. 2019, 31, 1803–1806. [Google Scholar] [CrossRef]
  24. Dong, J.; Dickfeld, T. Image integration in electroanatomic mapping. Herzschrittmachertherapie Elektrophysiologie 2007, 18, 122–130. [Google Scholar] [CrossRef] [PubMed]
  25. Zach, C.; Pock, T.; Bischof, H. A globally optimal algorithm for robust tv-l 1 range image integration. In Proceedings of the 2007 IEEE 11th International Conference on Computer Vision, Rio De Janeiro, Brazil, 14–21 October 2007; IEEE: Piscataway, NJ, USA, 2007; pp. 1–8. [Google Scholar]
  26. Dogra, A.; Kadry, S.; Goyal, B.; Agrawal, S. An efficient image integration algorithm for night mode vision applications. Multimed. Tools Appl. 2020, 79, 10995–11012. [Google Scholar] [CrossRef]
  27. Bavirisetti, D.P.; Dhuli, R. Multi-focus image fusion using multi-scale image decomposition and saliency detection. Ain Shams Eng. J. 2018, 9, 1103–1117. [Google Scholar] [CrossRef] [Green Version]
  28. Wang, C.; Xu, C.; Wang, C.; Tao, D. Perceptual adversarial networks for image-to-image transformation. IEEE Trans. Image Process. 2018, 27, 4066–4079. [Google Scholar] [CrossRef] [Green Version]
  29. Sarid, O.; Huss, E. Image formation and image transformation. Arts Psychother. 2011, 38, 252–255. [Google Scholar] [CrossRef]
  30. Jia, K.; Wang, X.; Tang, X. Image transformation based on learning dictionaries across image spaces. IEEE Trans. Pattern Anal. Mach. Intell. 2012, 35, 367–380. [Google Scholar] [CrossRef] [PubMed]
  31. Vial, A.; Stirling, D.; Field, M.; Ros, M.; Ritz, C.; Carolan, M.; Holloway, L.; Miller, A.A. The role of deep learning and radiomic feature extraction in cancer-specific predictive modelling: A review. Transl. Cancer Res. 2018, 7, 803–816. [Google Scholar] [CrossRef]
  32. Tofighi, G.; Venetsanopoulos, A.N.; Raahemifar, K.; Beheshti, S.; Mohammadi, H. Hand posture recognition using K-NN and Support Vector Machine classifiers evaluated on our proposed HandReader dataset. In Proceedings of the 2013 18th International Conference on Digital Signal Processing (DSP), Fira, Greece, 1–3 July 2013; IEEE: Piscataway, NJ, USA, 2013; pp. 1–5. [Google Scholar]
  33. Zhao, S.; Ge, D.; Zhao, J.; Xiang, W. Fingerprint pre-processing and feature engineering to enhance agricultural products categorization. Future Gener. Comput. Syst. 2021, 125, 944–948. [Google Scholar] [CrossRef]
  34. Heaton, J. An empirical analysis of feature engineering for predictive modeling. In Proceedings of the SoutheastCon 2016, Norfolk, VA, USA, 30 March–3 April 2016; IEEE: Piscataway, NJ, USA, 2016; pp. 1–6. [Google Scholar]
  35. Wiggers, K.L.; Britto, A.S.; Heutte, L.; Koerich, A.L.; Oliveira, L.E.S. Document image retrieval using deep features. In Proceedings of the 2018 International Joint Conference on Neural Networks (IJCNN), Rio de Janeiro, Brazil, 8–13 July 2018; IEEE: Piscataway, NJ, USA, 2018; pp. 1–8. [Google Scholar]
  36. Farhood, H.; He, X.; Jia, W.; Blumenstein, M.; Li, H. Counting people based on linear, weighted, and local random forests. In Proceedings of the 2017 International Conference on Digital Image Computing: Techniques and Applications (DICTA), Sydney, Australia, 29 November–1 December 2017; IEEE: Piscataway, NJ, USA, 2017; pp. 1–7. [Google Scholar]
  37. Singh, A.; Sharma, D.K. Image collection summarization: Past, present and future. In Data Visualization and Knowledge Engineering; Springer: Berlin/Heidelberg, Germany, 2020; pp. 49–78. [Google Scholar]
  38. Zou, Z.; Chen, K.; Shi, Z.; Guo, Y.; Ye, J. Object detection in 20 years: A survey. Proc. IEEE 2023, 99, 1–20. [Google Scholar] [CrossRef]
  39. Zou, X. A Review of object detection techniques. In Proceedings of the 2019 International Conference on Smart Grid and Electrical Automation (ICSGEA), Xiangtan, China, 10–11 August 2019; IEEE: Piscataway, NJ, USA, 2019; pp. 251–254. [Google Scholar]
  40. Ballard, D.H. Generalizing the Hough transform to detect arbitrary shapes. Pattern Recognit. 1981, 13, 111–122. [Google Scholar] [CrossRef] [Green Version]
  41. Harris, C.; Stephens, M. A combined corner and edge detector. In Proceedings of the Alvey Vision Conference, Manchester, UK, 31 August–2 September 1988; Citeseer: Manchester, UK, 1988; Volume 15, pp. 1–6. [Google Scholar]
  42. Lowe, D.G. Distinctive image features from scale-invariant keypoints. Int. J. Comput. Vis. 2004, 60, 91–110. [Google Scholar] [CrossRef]
  43. Bay, H.; Tuytelaars, T.; Gool, L.V. Surf: Speeded up robust features. In Proceedings of the European Conference on Computer Vision, Graz, Austria, 7–13 May 2006; Springer: Berlin/Heidelberg, Germany, 2006; pp. 404–417. [Google Scholar]
  44. Dalal, N.; Triggs, B. Histograms of oriented gradients for human detection. In Proceedings of the 2005 IEEE Computer Society Conference on Computer Vision and Pattern Recognition (CVPR’05), San Diego, CA, USA, 20–25 June 2005; IEEE: Piscataway, NJ, USA, 2005; Volume 1, pp. 886–893. [Google Scholar]
  45. Zhao, Z.Q.; Zheng, P.; Xu, S.; Wu, X. Object detection with deep learning: A review. IEEE Trans. Neural Netw. Learn. Syst. 2019, 30, 3212–3232. [Google Scholar] [CrossRef] [Green Version]
  46. He, K.; Zhang, X.; Ren, S.; Sun, J. Spatial pyramid pooling in deep convolutional networks for visual recognition. IEEE Trans. Pattern Anal. Mach. Intell. 2015, 37, 1904–1916. [Google Scholar] [CrossRef] [Green Version]
  47. Girshick, R. Fast r-cnn. In Proceedings of the IEEE International Conference on Computer Vision, Santiago, Chile, 7–13 December 2015; pp. 1440–1448. [Google Scholar]
  48. Girshick, R.; Donahue, J.; Darrell, T.; Malik, J. Rich feature hierarchies for accurate object detection and semantic segmentation. In Proceedings of the IEEE Conference on Computer Vision and Pattern Recognition, Columbus, OH, USA, 23–28 June 2014; pp. 580–587. [Google Scholar]
  49. Ren, S.; He, K.; Girshick, R.; Sun, J. Faster r-cnn: Towards real-time object detection with region proposal networks. Adv. Neural Inf. Process. Syst. 2015, 28, 91–99. [Google Scholar] [CrossRef] [PubMed] [Green Version]
  50. Redmon, J.; Divvala, S.; Girshick, R.; Farhadi, A. You only look once: Unified, real-time object detection. In Proceedings of the IEEE Conference on Computer Vision and Pattern Recognition, Las Vegas, NV, USA, 27–30 June 2016; pp. 779–788. [Google Scholar]
  51. Liu, W.; Anguelov, D.; Erhan, D.; Szegedy, C.; Reed, S.; Fu, C.Y.; Berg, A.C. Ssd: Single shot multibox detector. In Proceedings of the European Conference on Computer Vision, Amsterdam, The Netherlands, 11–14 October 2016; Springer: Berlin/Heidelberg, Germany, 2016; pp. 21–37. [Google Scholar]
  52. Lin, T.Y.; Goyal, P.; Girshick, R.; He, K.; Dollár, P. Focal loss for dense object detection. In Proceedings of the IEEE International Conference on Computer Vision, Venice, Italy, 22–29 October 2017; pp. 2980–2988. [Google Scholar]
  53. Dash, S.K.; Acharya, S.; Pakray, P.; Das, R.; Gelbukh, A. Topic-based image caption generation. Arab. J. Sci. Eng. 2020, 45, 3025–3034. [Google Scholar] [CrossRef]
  54. Hu, H.; Gu, J.; Zhang, Z.; Dai, J.; Wei, Y. Relation networks for object detection. In Proceedings of the IEEE Conference on Computer Vision and Pattern Recognition, Salt Lake City, UT, USA, 18–22 June 2018; pp. 3588–3597. [Google Scholar]
  55. Guo, H.; Zheng, K.; Fan, X.; Yu, H.; Wang, S. Visual attention consistency under image transforms for multi-label image classification. In Proceedings of the IEEE/CVF Conference on Computer Vision and Pattern Recognition, Long Beach, CA, USA, 15–20 June 2019; pp. 729–739. [Google Scholar]
  56. Ghiasi, G.; Lin, T.Y.; Le, Q.V. Nas-fpn: Learning scalable feature pyramid architecture for object detection. In Proceedings of the IEEE/CVF Conference on Computer Vision and Pattern Recognition, Long Beach, CA, USA, 15–20 June 2019; pp. 7036–7045. [Google Scholar]
  57. Carion, N.; Massa, F.; Synnaeve, G.; Usunier, N.; Kirillov, A.; Zagoruyko, S. End-to-end object detection with transformers. In Proceedings of the European Conference on Computer Vision, Glasgow, UK, 23–28 August 2020; Springer: Berlin/Heidelberg, Germany, 2020; pp. 213–229. [Google Scholar]
  58. Tan, M.; Pang, R.; Le, Q.V. Efficientdet: Scalable and efficient object detection. In Proceedings of the IEEE/CVF Conference on Computer Vision and Pattern Recognition, Seattle, WA, USA, 14–19 June 2020; pp. 10781–10790. [Google Scholar]
  59. Lotfi, F.; Jamzad, M.; Beigy, H. Automatic Image Annotation using Tag Relations and Graph Convolutional Networks. In Proceedings of the 2021 5th International Conference on Pattern Recognition and Image Analysis (IPRIA), Kashan, Iran, 28–29 April 2021; IEEE: Piscataway, NJ, USA, 2021; pp. 1–6. [Google Scholar]
  60. Joseph, K.; Khan, S.; Khan, F.S.; Balasubramanian, V.N. Towards open world object detection. In Proceedings of the IEEE/CVF Conference on Computer Vision and Pattern Recognition, Nashville, TN, USA, 19–25 June 2021; pp. 5830–5840. [Google Scholar]
  61. Lotfi, F.; Jamzad, M.; Beigy, H. Automatic Image Annotation Using Quantization Reweighting Function and Graph Neural Networks. In Proceedings of the International Conference on Service-Oriented Computing, Seville, Spain, 29 November–2 December 2022; Springer: Berlin/Heidelberg, Germany, 2022; pp. 46–60. [Google Scholar]
  62. Yang, P.; Luo, F.; Chen, P.; Li, L.; Yin, Z.; He, X.; Sun, X. Knowledgeable Storyteller: A Commonsense-Driven Generative Model for Visual Storytelling. In Proceedings of the IJCAI, Macao, China, 11–12 August 2019; Volume 3, p. 7. [Google Scholar]
  63. Speer, R.; Havasi, C. Representing general relational knowledge in conceptnet 5. In Proceedings of the LREC, Istanbul, Turkey, 23–25 May 2012; Volume 2012, pp. 3679–3786. [Google Scholar]
  64. Chen, H.; Huang, Y.; Takamura, H.; Nakayama, H. Commonsense knowledge aware concept selection for diverse and informative visual storytelling. In Proceedings of the AAAI Conference on Artificial Intelligence, Virtual, 2–9 February 2021; Volume 35, pp. 999–1008. [Google Scholar]
  65. Li, J.; Shi, H.; Tang, S.; Wu, F.; Zhuang, Y. Informative visual storytelling with cross-modal rules. In Proceedings of the 27th ACM International Conference on Multimedia, Nice, France, 21–25 October 2019; pp. 2314–2322. [Google Scholar]
  66. Aggarwal, C.C. Data classification. In Data Mining; Springer: Berlin/Heidelberg, Germany, 2015; pp. 285–344. [Google Scholar]
  67. Aggarwal, C.C.; Reddy, C.K. Data clustering. In Algorithms and Applications; Chapman & Hall/CRC Data Mining and Knowledge Discovery Series; Chapman & Hall: London, UK, 2014. [Google Scholar]
  68. Ahmed, M. Data summarization: A survey. Knowl. Inf. Syst. 2019, 58, 249–273. [Google Scholar] [CrossRef]
  69. Mao, J.; Xu, W.; Yang, Y.; Wang, J.; Huang, Z.; Yuille, A. Deep captioning with multimodal recurrent neural networks (m-rnn). arXiv 2014, arXiv:1412.6632. [Google Scholar]
  70. Karpathy, A.; Fei-Fei, L. Deep visual-semantic alignments for generating image descriptions. In Proceedings of the IEEE Conference on Computer Vision and Pattern Recognition, Boston, MA, USA, 7–12 June 2015; pp. 3128–3137. [Google Scholar]
  71. Vinyals, O.; Toshev, A.; Bengio, S.; Erhan, D. Show and tell: A neural image caption generator. In Proceedings of the IEEE Conference on Computer Vision and Pattern Recognition, Boston, MA, USA, 7–12 June 2015; pp. 3156–3164. [Google Scholar]
  72. Rennie, S.J.; Marcheret, E.; Mroueh, Y.; Ross, J.; Goel, V. Self-critical sequence training for image captioning. In Proceedings of the IEEE Conference on Computer Vision and Pattern Recognition, Honolulu, HI, USA, 21–26 July 2017; pp. 7008–7024. [Google Scholar]
  73. Ren, Z.; Wang, X.; Zhang, N.; Lv, X.; Li, L.J. Deep reinforcement learning-based image captioning with embedding reward. In Proceedings of the IEEE Conference on Computer Vision and Pattern Recognition, Honolulu, HI, USA, 21–26 July 2017; pp. 290–298. [Google Scholar]
  74. Gordon, D.; Kembhavi, A.; Rastegari, M.; Redmon, J.; Fox, D.; Farhadi, A. Iqa: Visual question answering in interactive environments. In Proceedings of the IEEE Conference on Computer Vision and Pattern Recognition, Salt Lake City, UT, USA, 18–22 June 2018; pp. 4089–4098. [Google Scholar]
  75. Patro, B.; Patel, S.; Namboodiri, V. Robust explanations for visual question answering. In Proceedings of the IEEE/CVF Winter Conference on Applications of Computer Vision, Snowmass Village, CO, USA, 1–5 March 2020; pp. 1577–1586. [Google Scholar]
  76. Wu, Q.; Wang, P.; Shen, C.; Reid, I.; Van Den Hengel, A. Are you talking to me? reasoned visual dialog generation through adversarial learning. In Proceedings of the IEEE Conference on Computer Vision and Pattern Recognition, Salt Lake City, UT, USA, 18–22 June 2018; pp. 6106–6115. [Google Scholar]
  77. Chen, C.; Mu, S.; Xiao, W.; Ye, Z.; Wu, L.; Ju, Q. Improving image captioning with conditional generative adversarial nets. In Proceedings of the AAAI Conference on Artificial Intelligence, Honolulu, HI, USA, 27 January–1 February 2019; Volume 33, pp. 8142–8150. [Google Scholar]
  78. Xu, K.; Ba, J.; Kiros, R.; Cho, K.; Courville, A.; Salakhudinov, R.; Zemel, R.; Bengio, Y. Show, attend and tell: Neural image caption generation with visual attention. In Proceedings of the International Conference on Machine Learning, Lille, France, 7–9 July 2015; 2015; pp. 2048–2057. [Google Scholar]
  79. Bahdanau, D.; Cho, K.; Bengio, Y. Neural machine translation by jointly learning to align and translate. arXiv 2014, arXiv:1409.0473. [Google Scholar]
  80. Ba, J.; Mnih, V.; Kavukcuoglu, K. Multiple object recognition with visual attention. arXiv 2014, arXiv:1412.7755. [Google Scholar]
  81. Mnih, V.; Heess, N.; Graves, A. Recurrent models of visual attention. Adv. Neural Inf. Process. Syst. 2014, 27, 2204–2212. [Google Scholar]
  82. Lu, J.; Xiong, C.; Parikh, D.; Socher, R. Knowing when to look: Adaptive attention via a visual sentinel for image captioning. In Proceedings of the IEEE Conference on Computer Vision and Pattern Recognition, Honolulu, HI, USA, 21–26 July 2017; pp. 375–383. [Google Scholar]
  83. Anderson, P.; He, X.; Buehler, C.; Teney, D.; Johnson, M.; Gould, S.; Zhang, L. Bottom-up and top-down attention for image captioning and visual question answering. In Proceedings of the IEEE Conference on Computer Vision and Pattern Recognition, Salt Lake City, UT, USA, 18–22 June 2018; pp. 6077–6086. [Google Scholar]
  84. Qin, Y.; Du, J.; Zhang, Y.; Lu, H. Look back and predict forward in image captioning. In Proceedings of the IEEE/CVF Conference on Computer Vision and Pattern Recognition, Long Beach, CA, USA, 16–17 June 2019; pp. 8367–8375. [Google Scholar]
  85. Ke, L.; Pei, W.; Li, R.; Shen, X.; Tai, Y.W. Reflective decoding network for image captioning. In Proceedings of the IEEE/CVF International Conference on Computer Vision, Seoul, Repulic of Korea, 27 October–2 November 2019; pp. 8888–8897. [Google Scholar]
  86. Huang, L.; Wang, W.; Chen, J.; Wei, X.Y. Attention on attention for image captioning. In Proceedings of the IEEE/CVF International Conference on Computer Vision, Seoul, Repulic of Korea, 27 October–2 November 2019; pp. 4634–4643. [Google Scholar]
  87. Guo, L.; Liu, J.; Zhu, X.; Yao, P.; Lu, S.; Lu, H. Normalized and geometry-aware self-attention network for image captioning. In Proceedings of the IEEE/CVF Conference on Computer Vision and Pattern Recognition, Seattle, WA, USA, 14–19 June 2020; pp. 10327–10336. [Google Scholar]
  88. Li, G.; Zhu, L.; Liu, P.; Yang, Y. Entangled transformer for image captioning. In Proceedings of the IEEE/CVF International Conference on Computer Vision, Seoul, Repulic of Korea, 27 October–2 November 2019; pp. 8928–8937. [Google Scholar]
  89. Yao, T.; Pan, Y.; Li, Y.; Mei, T. Exploring visual relationship for image captioning. In Proceedings of the European Conference on Computer Vision (ECCV), Munich, Germany, 8–14 September 2018; pp. 684–699. [Google Scholar]
  90. Yang, X.; Tang, K.; Zhang, H.; Cai, J. Auto-encoding scene graphs for image captioning. In Proceedings of the IEEE/CVF Conference on Computer Vision and Pattern Recognition, Long Beach, CA, USA, 16–17 June 2019; pp. 10685–10694. [Google Scholar]
  91. Yao, T.; Pan, Y.; Li, Y.; Mei, T. Hierarchy parsing for image captioning. In Proceedings of the IEEE/CVF International Conference on Computer Vision, Seoul, Repulic of Korea, 27 October–2 November 2019; pp. 2621–2629. [Google Scholar]
  92. Aneja, J.; Deshpande, A.; Schwing, A.G. Convolutional image captioning. In Proceedings of the IEEE Conference on Computer Vision and Pattern Recognition, Salt Lake City, UT, USA, 18–22 June 2018; pp. 5561–5570. [Google Scholar]
  93. Wang, Q.; Chan, A.B. Cnn+ cnn: Convolutional decoders for image captioning. arXiv 2018, arXiv:1805.09019. [Google Scholar]
  94. Herdade, S.; Kappeler, A.; Boakye, K.; Soares, J. Image captioning: Transforming objects into words. Adv. Neural Inf. Process. Syst. 2019, 32, 11135–11145. [Google Scholar]
  95. Luo, Y.; Ji, J.; Sun, X.; Cao, L.; Wu, Y.; Huang, F.; Lin, C.W.; Ji, R. Dual-level collaborative transformer for image captioning. arXiv 2021, arXiv:2101.06462. [Google Scholar] [CrossRef]
  96. Zhou, L.; Palangi, H.; Zhang, L.; Hu, H.; Corso, J.; Gao, J. Unified vision-language pre-training for image captioning and vqa. In Proceedings of the AAAI Conference on Artificial Intelligence, New York, NY, USA, 7–12 February 2020; Volume 34, pp. 13041–13049. [Google Scholar]
  97. Johnson, J.; Karpathy, A.; Fei-Fei, L. Densecap: Fully convolutional localization networks for dense captioning. In Proceedings of the IEEE Conference on Computer Vision and Pattern Recognition, Las Vegas, NV, USA, 27–30 June 2016; pp. 4565–4574. [Google Scholar]
  98. Yang, L.; Tang, K.; Yang, J.; Li, L.J. Dense captioning with joint inference and visual context. In Proceedings of the IEEE Conference on Computer Vision and Pattern Recognition, Honolulu, HI, USA, 21–26 July 2017; pp. 2193–2202. [Google Scholar]
  99. Kim, D.J.; Choi, J.; Oh, T.H.; Kweon, I.S. Dense relational captioning: Triple-stream networks for relationship-based captioning. In Proceedings of the IEEE/CVF Conference on Computer Vision and Pattern Recognition, Long Beach, CA, USA, 16–17 June 2019; pp. 6271–6280. [Google Scholar]
  100. Uehara, K.; Mori, Y.; Mukuta, Y.; Harada, T. ViNTER: Image Narrative Generation with Emotion-Arc-Aware Transformer. In Proceedings of the Companion Proceedings of the Web Conference 2022, Virtual Event/Lyon, France, 25–29 April 2022; pp. 716–725. [Google Scholar]
  101. Su, J.; Dai, Q.; Guerin, F.; Zhou, M. BERT-hLSTMs: BERT and hierarchical LSTMs for visual storytelling. Comput. Speech Lang. 2021, 67, 101169. [Google Scholar] [CrossRef]
  102. Riahi Samani, Z.; Ebrahimi Moghaddam, M. Image Collection Summarization Method Based on Semantic Hierarchies. AI 2020, 1, 209–228. [Google Scholar] [CrossRef]
  103. Sharma, V.; Kumar, A.; Agrawal, N.; Singh, P.; Kulshreshtha, R. Image summarization using topic modelling. In Proceedings of the 2015 IEEE International Conference on Signal and Image Processing Applications (ICSIPA), Kuala Lumpur, Malaysia, 19–21 October 2015; IEEE: Piscataway, NJ, USA, 2015; pp. 226–231. [Google Scholar]
  104. Camargo, J.E.; González, F.A. A multi-class kernel alignment method for image collection summarization. In Proceedings of the Iberoamerican Congress on Pattern Recognition, Guadalajara, Mexico, 15–18 November 2009; Springer: Berlin/Heidelberg, Germany, 2009; pp. 545–552. [Google Scholar]
  105. Sreelakshmi, P.; Manmadhan, S. Image Summarization Using Unsupervised Learning. In Proceedings of the 2021 7th International Conference on Advanced Computing and Communication Systems (ICACCS), Coimbatore, India, 19–20 March 2021; IEEE: Piscataway, NJ, USA, 2021; Volume 1, pp. 100–103. [Google Scholar]
  106. Chen, J.; Zhuge, H. Extractive summarization of documents with images based on multi-modal RNN. Future Gener. Comput. Syst. 2019, 99, 186–196. [Google Scholar] [CrossRef]
  107. Qian, X.; Li, M.; Ren, Y.; Jiang, S. Social media based event summarization by user–text–image co-clustering. Knowl. Based Syst. 2019, 164, 107–121. [Google Scholar] [CrossRef]
  108. Kuzovkin, D.; Pouli, T.; Cozot, R.; Meur, O.L.; Kervec, J.; Bouatouch, K. Context-aware clustering and assessment of photo collections. In Proceedings of the Symposium on Computational Aesthetics, Los Angeles, CA, USA, 29–30 July 2017; pp. 1–10. [Google Scholar]
  109. Camargo, J.E.; González, F.A. Multimodal image collection summarization using non-negative matrix factorization. In Proceedings of the 2011 6th Colombian Computing Congress (CCC), Manizales, Colombia, 4–6 May 2011; IEEE: Piscataway, NJ, USA, 2011; pp. 1–6. [Google Scholar]
  110. Huang, T.H.; Ferraro, F.; Mostafazadeh, N.; Misra, I.; Agrawal, A.; Devlin, J.; Girshick, R.; He, X.; Kohli, P.; Batra, D.; et al. Visual storytelling. In Proceedings of the 2016 Conference of the North American Chapter of the Association for Computational Linguistics: Human Language Technologies, San Diego, CA, USA, 12–17 June 2016; pp. 1233–1239. [Google Scholar]
  111. Yu, L.; Bansal, M.; Berg, T.L. Hierarchically-attentive rnn for album summarization and storytelling. arXiv 2017, arXiv:1708.02977. [Google Scholar]
  112. Wang, X.; Chen, W.; Wang, Y.F.; Wang, W.Y. No metrics are perfect: Adversarial reward learning for visual storytelling. arXiv 2018, arXiv:1804.09160. [Google Scholar]
  113. Wang, J.; Fu, J.; Tang, J.; Li, Z.; Mei, T. Show, reward and tell: Automatic generation of narrative paragraph from photo stream by adversarial training. In Proceedings of the AAAI Conference on Artificial Intelligence, New Orleans, LA, USA, 2–7 February 2018; Volume 32. [Google Scholar]
  114. Huang, Q.; Gan, Z.; Celikyilmaz, A.; Wu, D.; Wang, J.; He, X. Hierarchically structured reinforcement learning for topically coherent visual story generation. In Proceedings of the AAAI Conference on Artificial Intelligence, Honolulu, HI, USA, 27 January–1 February 2019; Volume 33, pp. 8465–8472. [Google Scholar]
  115. Hsu, C.C.; Chen, Z.Y.; Hsu, C.Y.; Li, C.C.; Lin, T.Y.; Huang, T.H.; Ku, L.W. Knowledge-enriched visual storytelling. In Proceedings of the AAAI Conference on Artificial Intelligence, New York, NY, USA, 7–12 February 2020; Volume 34, pp. 7952–7960. [Google Scholar]
  116. Jung, Y.; Kim, D.; Woo, S.; Kim, K.; Kim, S.; Kweon, I.S. Hide-and-tell: Learning to bridge photo streams for visual storytelling. In Proceedings of the AAAI Conference on Artificial Intelligence, New York, NY, USA, 7–12 February 2020; Volume 34, pp. 11213–11220. [Google Scholar]
  117. Hu, J.; Cheng, Y.; Gan, Z.; Liu, J.; Gao, J.; Neubig, G. What makes a good story? Designing composite rewards for visual storytelling. In Proceedings of the AAAI Conference on Artificial Intelligence, New York, NY, USA, 7–12 February 2020; Volume 34, pp. 7969–7976. [Google Scholar]
  118. Yu, Y.; Chung, J.; Yun, H.; Kim, J.; Kim, G. Transitional Adaptation of Pretrained Models for Visual Storytelling. In Proceedings of the IEEE/CVF Conference on Computer Vision and Pattern Recognition, Nashville, TN, USA, 19–25 June 2021; pp. 12658–12668. [Google Scholar]
  119. Lukin, S.M.; Hobbs, R.; Voss, C.R. A pipeline for creative visual storytelling. arXiv 2018, arXiv:1807.08077. [Google Scholar]
  120. Xu, C.; Yang, M.; Li, C.; Shen, Y.; Ao, X.; Xu, R. Imagine, Reason and Write: Visual Storytelling with Graph Knowledge and Relational Reasoning. In Proceedings of the AAAI Conference on Artificial Intelligence, Virtual, 2–9 February 2021; Volume 35, pp. 3022–3029. [Google Scholar]
  121. Wang, E.; Han, C.; Poon, J. RoViST: Learning Robust Metrics for Visual Storytelling. arXiv 2022, arXiv:2205.03774. [Google Scholar]
  122. Li, T.; Wang, H.; He, B.; Chen, C.W. Knowledge-enriched attention network with group-wise semantic for visual storytelling. IEEE Trans. Pattern Anal. Mach. Intell. 2022; Early Access. [Google Scholar] [CrossRef]
  123. Knaflic, C.N. Storytelling with Data: Let’s Practice! John Wiley & Sons: Hoboken, NJ, USA, 2019. [Google Scholar]
  124. Toker, D.; Conati, C.; Carenini, G.; Haraty, M. Towards adaptive information visualization: On the influence of user characteristics. In Proceedings of the International Conference on User Modeling, Adaptation, and Personalization, Montreal, QC, Canada, 16–20 July 2012; Springer: Berlin/Heidelberg, Germany, 2012; pp. 274–285. [Google Scholar]
  125. Papineni, K.; Roukos, S.; Ward, T.; Zhu, W.J. Bleu: A method for automatic evaluation of machine translation. In Proceedings of the 40th Annual Meeting of the Association for Computational Linguistics, Philadelphia, PA, USA, 7–12 July 2002; pp. 311–318. [Google Scholar]
  126. Banerjee, S.; Lavie, A. METEOR: An automatic metric for MT evaluation with improved correlation with human judgments. In Proceedings of the ACL Workshop on Intrinsic and Extrinsic Evaluation Measures for Machine Translation and/or Summarization, Ann Arbor, MI, USA, 29 June 2005; pp. 65–72. [Google Scholar]
  127. Anderson, P.; Fernando, B.; Johnson, M.; Gould, S. Spice: Semantic propositional image caption evaluation. In Proceedings of the European Conference on Computer Vision, Amsterdam, The Netherlands, 11–14 October 2016; Springer: Berlin/Heidelberg, Germany, 2016; pp. 382–398. [Google Scholar]
  128. Vedantam, R.; Lawrence Zitnick, C.; Parikh, D. Cider: Consensus-based image description evaluation. In Proceedings of the IEEE Conference on Computer Vision and Pattern Recognition, Boston, MA, USA, 7–12 June 2015; pp. 4566–4575. [Google Scholar]
  129. Yao, L.; Peng, N.; Weischedel, R.; Knight, K.; Zhao, D.; Yan, R. Plan-and-write: Towards better automatic storytelling. In Proceedings of the AAAI Conference on Artificial Intelligence, Honolulu, HI, USA, 27 January–1 February 2019; Volume 33, pp. 7378–7385. [Google Scholar]
  130. Chen, Y.C.; Bansal, M. Fast abstractive summarization with reinforce-selected sentence rewriting. arXiv 2018, arXiv:1805.11080. [Google Scholar]
  131. Aafaq, N.; Mian, A.; Liu, W.; Gilani, S.Z.; Shah, M. Video description: A survey of methods, datasets, and evaluation metrics. ACM Comput. Surv. (CSUR) 2019, 52, 1–37. [Google Scholar] [CrossRef] [Green Version]
  132. Kilickaya, M.; Erdem, A.; Ikizler-Cinbis, N.; Erdem, E. Re-evaluating automatic metrics for image captioning. arXiv 2016, arXiv:1612.07600. [Google Scholar]
  133. Sai, A.B.; Mohankumar, A.K.; Khapra, M.M. A survey of evaluation metrics used for NLG systems. ACM Comput. Surv. (CSUR) 2022, 55, 1–39. [Google Scholar] [CrossRef]
  134. Engel, J.; Gerretzen, J.; Szymańska, E.; Jansen, J.J.; Downey, G.; Blanchet, L.; Buydens, L.M. Breaking with trends in pre-processing? TrAC Trends Anal. Chem. 2013, 50, 96–106. [Google Scholar] [CrossRef]
  135. Hemanth, D.J.; Anitha, J. Image pre-processing and feature extraction techniques for magnetic resonance brain image analysis. In Proceedings of the International Conference on Future Generation Communication and Networking, London, UK, 12–14 December 2012; Springer: Berlin/Heidelberg, Germany, 2012; pp. 349–356. [Google Scholar]
  136. Rajesh, S.D.; Almeida, J.M.; Martins, A. Image Cleaning and Enhancement Technique for Underwater Mining. In Proceedings of the OCEANS 2019, Marseille, France, 17–20 June 2019; IEEE: Piscataway, NJ, USA, 2019; pp. 1–6. [Google Scholar]
  137. Jiang, Z.; Zhang, Y.; Zou, D.; Ren, J.; Lv, J.; Liu, Y. Learning event-based motion deblurring. In Proceedings of the IEEE/CVF Conference on Computer Vision and Pattern Recognition, Seattle, WA, USA, 14–19 June 2020; pp. 3320–3329. [Google Scholar]
  138. Uijlings, J.R.; Van De Sande, K.E.; Gevers, T.; Smeulders, A.W. Selective search for object recognition. Int. J. Comput. Vis. 2013, 104, 154–171. [Google Scholar] [CrossRef] [Green Version]
  139. Lazebnik, S.; Schmid, C.; Ponce, J. Beyond bags of features: Spatial pyramid matching for recognizing natural scene categories. In Proceedings of the 2006 IEEE Computer Society Conference on Computer Vision and Pattern Recognition (CVPR’06), New York, NY, USA, 17–22 June 2006; IEEE: Piscataway, NJ, USA, 2006; Volume 2, pp. 2169–2178. [Google Scholar]
  140. Shin, A.; Ushiku, Y.; Harada, T. Customized Image Narrative Generation via Interactive Visual Question Generation and Answering. In Proceedings of the IEEE Conference on Computer Vision and Pattern Recognition, Salt Lake City, UT, USA, 18–22 June 2018; pp. 8925–8933. [Google Scholar]
  141. Szegedy, C.; Liu, W.; Jia, Y.; Sermanet, P.; Reed, S.; Anguelov, D.; Erhan, D.; Vanhoucke, V.; Rabinovich, A. Going deeper with convolutions. In Proceedings of the IEEE Conference on Computer Vision and Pattern Recognition, Boston, MA, USA, 7–12 June 2015; pp. 1–9. [Google Scholar]
  142. Krizhevsky, A.; Sutskever, I.; Hinton, G.E. Imagenet classification with deep convolutional neural networks. Adv. Neural Inf. Process. Syst. 2012, 25, 1106–1114. [Google Scholar] [CrossRef] [Green Version]
  143. Fang, H.; Gupta, S.; Iandola, F.; Srivastava, R.K.; Deng, L.; Dollár, P.; Gao, J.; He, X.; Mitchell, M.; Platt, J.C.; et al. From captions to visual concepts and back. In Proceedings of the IEEE Conference on Computer Vision and Pattern Recognition, Boston, MA, USA, 7–12 June 2015; pp. 1473–1482. [Google Scholar]
  144. Wu, Q.; Shen, C.; Liu, L.; Dick, A.; Van Den Hengel, A. What value do explicit high level concepts have in vision to language problems? In Proceedings of the IEEE Conference on Computer Vision and Pattern Recognition, Las Vegas, NV, USA, 27–30 June 2016; pp. 203–212. [Google Scholar]
  145. Li, Y.; Duan, N.; Zhou, B.; Chu, X.; Ouyang, W.; Wang, X.; Zhou, M. Visual question generation as dual task of visual question answering. In Proceedings of the IEEE Conference on Computer Vision and Pattern Recognition, Salt Lake City, UT, USA, 18–22 June 2018; pp. 6116–6124. [Google Scholar]
  146. Kipf, T.N.; Welling, M. Semi-supervised classification with graph convolutional networks. arXiv 2016, arXiv:1609.02907. [Google Scholar]
  147. Malakan, Z.M.; Hassan, G.M.; Mian, A. Vision Transformer Based Model for Describing a Set of Images as a Story. In Proceedings of the AI 2022: Advances in Artificial Intelligence: 35th Australasian Joint Conference, AI 2022, Perth, WA, Australia, 5–8 December 2022; Springer: Berlin/Heidelberg, Germany, 2022; pp. 15–28. [Google Scholar]
  148. Cao, S.; An, G.; Zheng, Z.; Wang, Z. Vision-Enhanced and Consensus-Aware Transformer for Image Captioning. IEEE Trans. Circuits Syst. Video Technol. 2022, 32, 7005–7018. [Google Scholar] [CrossRef]
  149. Fang, Z.; Wang, J.; Hu, X.; Liang, L.; Gan, Z.; Wang, L.; Yang, Y.; Liu, Z. Injecting semantic concepts into end-to-end image captioning. In Proceedings of the IEEE/CVF Conference on Computer Vision and Pattern Recognition, New Orleans, LA, USA, 18–24 June 2022; pp. 18009–18019. [Google Scholar]
  150. Dosovitskiy, A.; Beyer, L.; Kolesnikov, A.; Weissenborn, D.; Zhai, X.; Unterthiner, T.; Dehghani, M.; Minderer, M.; Heigold, G.; Gelly, S.; et al. An image is worth 16x16 words: Transformers for image recognition at scale. arXiv 2020, arXiv:2010.11929. [Google Scholar]
  151. Vinyals, O.; Toshev, A.; Bengio, S.; Erhan, D. Show and tell: Lessons learned from the 2015 mscoco image captioning challenge. IEEE Trans. Pattern Anal. Mach. Intell. 2016, 39, 652–663. [Google Scholar] [CrossRef] [Green Version]
  152. Hochreiter, S.; Schmidhuber, J. Long short-term memory. Neural Comput. 1997, 9, 1735–1780. [Google Scholar] [CrossRef] [PubMed]
  153. Donahue, J.; Anne Hendricks, L.; Guadarrama, S.; Rohrbach, M.; Venugopalan, S.; Saenko, K.; Darrell, T. Long-term recurrent convolutional networks for visual recognition and description. In Proceedings of the IEEE Conference on Computer Vision and Pattern Recognition, Boston, MA, USA, 7–12 June 2015; pp. 2625–2634. [Google Scholar]
  154. Gu, J.; Wang, G.; Cai, J.; Chen, T. An empirical study of language cnn for image captioning. In Proceedings of the IEEE International Conference on Computer Vision, Venice, Italy, 22–29 October 2017; pp. 1222–1231. [Google Scholar]
  155. Devlin, J.; Chang, M.W.; Lee, K.; Toutanova, K. Bert: Pre-training of deep bidirectional transformers for language understanding. arXiv 2018, arXiv:1810.04805. [Google Scholar]
  156. Zhu, Z.; Wei, Y.; Wang, J.; Gan, Z.; Zhang, Z.; Wang, L.; Hua, G.; Wang, L.; Liu, Z.; Hu, H. Exploring Discrete Diffusion Models for Image Captioning. arXiv 2022, arXiv:2211.11694. [Google Scholar]
  157. Luo, J.; Li, Y.; Pan, Y.; Yao, T.; Feng, J.; Chao, H.; Mei, T. Semantic-Conditional Diffusion Networks for Image Captioning. arXiv 2022, arXiv:2212.03099. [Google Scholar]
  158. Xu, S. CLIP-Diffusion-LM: Apply Diffusion Model on Image Captioning. arXiv 2022, arXiv:2210.04559. [Google Scholar]
  159. Cheung, J.C.K.; Li, X. Sequence clustering and labeling for unsupervised query intent discovery. In Proceedings of the Fifth ACM International Conference on Web Search and Data Mining, Seattle, WA, USA, 8–12 February 2012; pp. 383–392. [Google Scholar]
  160. Vedula, N.; Lipka, N.; Maneriker, P.; Parthasarathy, S. Towards open intent discovery for conversational text. arXiv 2019, arXiv:1904.08524. [Google Scholar]
  161. Narayanan, A.; Chandramohan, M.; Venkatesan, R.; Chen, L.; Liu, Y.; Jaiswal, S. graph2vec: Learning distributed representations of graphs. arXiv 2017, arXiv:1707.05005. [Google Scholar]
  162. Beheshti, A.; Benatallah, B.; Nouri, R.; Chhieng, V.M.; Xiong, H.; Zhao, X. Coredb: A data lake service. In Proceedings of the 2017 ACM on Conference on Information and Knowledge Management, Singapore, 6–10 November 2017; pp. 2451–2454. [Google Scholar]
  163. Beheshti, A.; Benatallah, B.; Nouri, R.; Tabebordbar, A. CoreKG: A knowledge lake service. Proc. VLDB Endow. 2018, 11, 1942–1945. [Google Scholar] [CrossRef]
  164. Li, N.; Liu, B.; Han, Z.; Liu, Y.S.; Fu, J. Emotion reinforced visual storytelling. In Proceedings of the 2019 on International Conference on Multimedia Retrieval, Ottawa, ON, Canada, 10–13 June 2019; pp. 297–305. [Google Scholar]
  165. Hsu, C.Y.; Chu, Y.W.; Huang, T.H.; Ku, L.W. Plot and Rework: Modeling Storylines for Visual Storytelling. arXiv 2021, arXiv:2105.06950. [Google Scholar]
  166. Nahian, M.; Al, S.; Tasrin, T.; Gandhi, S.; Gaines, R.; Harrison, B. A hierarchical approach for visual storytelling using image description. In Proceedings of the International Conference on Interactive Digital Storytelling, Little Cottonwood Canyon, UT, USA, 19–22 November 2019; Springer: Berlin/Heidelberg, Germany, 2019; pp. 304–317. [Google Scholar]
  167. Kim, T.; Heo, M.O.; Son, S.; Park, K.W.; Zhang, B.T. Glac net: Glocal attention cascading networks for multi-image cued story generation. arXiv 2018, arXiv:1805.10973. [Google Scholar]
  168. Wang, R.; Wei, Z.; Li, P.; Zhang, Q.; Huang, X. Storytelling from an image stream using scene graphs. In Proceedings of the AAAI Conference on Artificial Intelligence, New York, NY, USA, 7–12 February 2020; Volume 34, pp. 9185–9192. [Google Scholar]
  169. Zhang, B.; Hu, H.; Sha, F. Visual storytelling via predicting anchor word embeddings in the stories. arXiv 2020, arXiv:2001.04541. [Google Scholar]
  170. Gonzalez-Rico, D.; Fuentes-Pineda, G. Contextualize, show and tell: A neural visual storyteller. arXiv 2018, arXiv:1806.00738. [Google Scholar]
  171. Wang, P.; Zamora, J.; Liu, J.; Ilievski, F.; Chen, M.; Ren, X. Contextualized scene imagination for generative commonsense reasoning. arXiv 2021, arXiv:2112.06318. [Google Scholar]
  172. Smilevski, M.; Lalkovski, I.; Madjarov, G. Stories for images-in-sequence by using visual and narrative components. In Proceedings of the International Conference on Telecommunications, Saint Malo, France, 26–28 June 2018; Springer: Berlin/Heidelberg, Germany, 2018; pp. 148–159. [Google Scholar]
  173. Chandu, K.; Nyberg, E.; Black, A.W. Storyboarding of recipes: Grounded contextual generation. In Proceedings of the 57th Annual Meeting of the Association for Computational Linguistics, Florence, Italy, 28 July–2 August 2019; pp. 6040–6046. [Google Scholar]
  174. Salvador, A.; Gundogdu, E.; Bazzani, L.; Donoser, M. Revamping cross-modal recipe retrieval with hierarchical transformers and self-supervised learning. In Proceedings of the IEEE/CVF Conference on Computer Vision and Pattern Recognition, Nashville, TN, USA, 19–25 June 2021; pp. 15475–15484. [Google Scholar]
  175. Nishimura, T.; Hashimoto, A.; Ushiku, Y.; Kameko, H.; Yamakata, Y.; Mori, S. Structure-aware procedural text generation from an image sequence. IEEE Access 2020, 9, 2125–2141. [Google Scholar] [CrossRef]
  176. Qi, M.; Qin, J.; Huang, D.; Shen, Z.; Yang, Y.; Luo, J. Latent Memory-augmented Graph Transformer for Visual Storytelling. In Proceedings of the 29th ACM International Conference on Multimedia, Virtual, 20–24 October 2021; pp. 4892–4901. [Google Scholar]
  177. Hong, X.; Shetty, R.; Sayeed, A.; Mehra, K.; Demberg, V.; Schiele, B. Diverse and Relevant Visual Storytelling with Scene Graph Embeddings. In Proceedings of the 24th Conference on Computational Natural Language Learning, Online, 19–20 November 2020; pp. 420–430. [Google Scholar]
  178. Joana, K.; Chan, S.W.; Chu, S.K. Quality assessment for digital stories by young authors. Data Inf. Manag. 2021, 5, 174–183. [Google Scholar]
  179. Kusner, M.; Sun, Y.; Kolkin, N.; Weinberger, K. From word embeddings to document distances. In Proceedings of the International Conference on Machine Learning, Lille, France, 7–9 July 2015; pp. 957–966. [Google Scholar]
  180. Lin, C.Y. Rouge: A package for automatic evaluation of summaries. In Text Summarization Branches Out; Association for Computational Linguistics: Barcelona, Spain, 2004; pp. 74–81. [Google Scholar]
  181. Hsu, T.Y.; Huang, C.Y.; Hsu, Y.C.; Huang, T.H. Visual story post-editing. arXiv 2019, arXiv:1906.01764. [Google Scholar]
  182. Ravi, H.; Kafle, K.; Cohen, S.; Brandt, J.; Kapadia, M. AESOP: Abstract Encoding of Stories, Objects, and Pictures. In Proceedings of the IEEE/CVF International Conference on Computer Vision, Montreal, QC, Canada, 10–17 October 2021; pp. 2052–2063. [Google Scholar]
  183. Hsu, C.Y.; Chu, Y.W.; Chen, V.; Lo, K.C.; Chen, C.; Huang, T.H.; Ku, L.W. Learning to Rank Visual Stories From Human Ranking Data. In Proceedings of the 60th Annual Meeting of the Association for Computational Linguistics (Volume 1: Long Papers), Dublin, Ireland, 22–27 May 2022; pp. 6365–6378. [Google Scholar]
  184. Marin, J.; Biswas, A.; Ofli, F.; Hynes, N.; Salvador, A.; Aytar, Y.; Weber, I.; Torralba, A. Recipe1m+: A dataset for learning cross-modal embeddings for cooking recipes and food images. IEEE Trans. Pattern Anal. Mach. Intell. 2019, 43, 187–203. [Google Scholar] [CrossRef] [Green Version]
  185. Wang, H.; Lin, G.; Hoi, S.C.; Miao, C. Decomposed generation networks with structure prediction for recipe generation from food images. arXiv 2020, arXiv:2007.13374. [Google Scholar]
  186. Nishimura, T.; Hashimoto, A.; Ushiku, Y.; Kameko, H.; Mori, S. Recipe Generation from Unsegmented Cooking Videos. arXiv 2022, arXiv:2209.10134. [Google Scholar]
  187. Fain, M.; Twomey, N.; Ponikar, A.; Fox, R.; Bollegala, D. Dividing and conquering cross-modal recipe retrieval: From nearest neighbours baselines to sota. arXiv 2019, arXiv:1911.12763. [Google Scholar]
  188. Sakib, M.S.; Paulius, D.; Sun, Y. Approximate task tree retrieval in a knowledge network for robotic cooking. IEEE Robot. Autom. Lett. 2022, 7, 11492–11499. [Google Scholar] [CrossRef]
Figure 1. An end-to-end storytelling example. Storytelling with image data could be a critical tool in preventing events like the 2016 Brussels bombings. By analyzing and connecting images from various sources, including security cameras and social media, authorities can identify potential threats and act preemptively to ensure public safety.
Algorithms 16 00135 g001
Figure 2. The proposed taxonomy for storytelling with image data.
Algorithms 16 00135 g002
Figure 3. Storytelling with image data research questions/motivations and keywords word cloud. (a) Research questions/motivations word cloud. (b) Search keywords word cloud.
Algorithms 16 00135 g003
Figure 4. Yearwise distribution of the selected articles.
Algorithms 16 00135 g004
Figure 5. Quality assessment process.
Algorithms 16 00135 g005
Table 1. Research questions (RQs) examined in this survey.
IDResearch QuestionDescription and Main Motivation
RQ1What is storytelling with image data, and how can it contribute to understanding images?Storytelling with image data aims to generate a coherent story based on a set of relevant images. The main steps to understanding image data are curation, summarization, and presentation in a succinct and consumable manner to end-users. Storytelling with image data is therefore considered an appropriate metaphor for capturing and representing the temporal/sequential order of key events.
RQ2How is storytelling with image data different from image/video captioning methods?Storytelling with image data could differ from image/video captioning, classification, and labeling tasks. In storytelling, the objective is to describe a set of images subjectively. Due to different understandings, a data analyst may create various narratives for a set of images. Based on the combinations of these narratives and the goals of an analyst, personalized and customized stories could be generated.
RQ3What are the differences between storytelling with a set of related images rather than a single image?Storytelling with a single image could differ from storytelling with a set of images. Multiple images generate more features and consist of more dimensions, such as time and location, resulting in diverse knowledge and context-aware narratives. For example, imagine a single image showing a nervous woman in a meeting vs. multiple images depicting her activities, such as waking up, having breakfast with family, going to work, being late and stuck in traffic, being in a meeting nervously, and finally going back home.
RQ4What are the technical challenges we face in storytelling with image data?Storytelling mainly focuses on understanding a set of related images. There is a plethora of research in storytelling with textual data, which is well-matured, and there has been significant progress in this field. It can develop, focus, and deliver critical concepts from an unstructured corpus into a narrative. However, the field of storytelling with image data is at an early stage. The challenges in storytelling fundamentally differ from simple text generation based on an image. Filling in the visual gap between the images with a subjective story is the main challenge of storytelling with image data.
RQ5What techniques have been used in storytelling with image data?Although scattered work has been conducted in storytelling with image data, this issue has not yet been coined. Object extraction, image captioning, labeling, and annotation are some of the leading practices in this field. We take one step forward and combine them to provide a detailed view at multiple levels to help analysts to understand image data. In summary, we combine data with narratives to reduce the ambiguity of data, connect data with context, and describe a specific interpretation.
RQ6What are the applications of storytelling with image data, and how can they provide value for businesses?We believe storytelling with image data is essential for advancing AI towards a more human-like understanding. The need for understanding the massive amount of image data published on social media platforms, IoT devices such as CCTV cameras, smart cars, dash cams, and video captioning for the visually or hearing impaired is strongly felt. Storytelling could help businesses to build personalized stories. For example, numerous images/videos are captured by various CCTVs or at the crime scene, which could help with the police investigation of crimes. Accordingly, instead of individuals spending a lot of time looking for a specific clue, storytelling could help speed up the investigation process and discover rich insights.
RQ7How can the quality of the stories be assessed?Researchers should ensure that a high-quality story (a semantically and logically coherent story that accurately describes the objects in a given set of images and engages the analyst) is generated, since trust is essential in storytelling with data. For example, we can point out stories generated around fake news based on a set of images. Moreover, story quality assessment could also be automated by using human in the loop.
Table 2. Classification of selected papers in this survey.
CategorySubcategoryLiteratureTime PeriodNo.
Curation: Cleaning and PreprocessingImage Correction[13,14,15,16,17][2014–2020]5
Image Enhancement[18,19,20,21,22,23][2013–2021]6
Image Integration[24,25,26,27][2007–2020]4
Image Transformation[28,29,30][2011–2018]3
Image Preparation for Feature Extraction[16,31,32,33,34,35,36,37][2013–2021]8
Curation: Adding ValueExtraction[38,39,40,41,42,43,44,45,46,47,48,49,50,51,52,53,54,55,56,57,58,59,60,61][1981–2022]24
Enrichment and Linking[62,63,64,65][2012–2021]4
Story modelingOrganizing and summarizing Feature Data[66,67,68][2014–2019]3
Narrative Engineering[49,69,70,71,72,73,74,75,76,77,78,79,80,81,82,83,84,85,86,87,88,89,90,91,92,93,94,95,96,97,98,99,100][2014–2022]33
Intelligent Narrative DiscoveryImage Collection Summarization[37,101,102,103,104,105,106,107,108,109][2009–2021]10
Story CreationFramework and Techniques[62,110,111,112,113,114,115,116,117,118,119,120,121,122][2016–2022]14
Story Presentation and QueryingIntelligent Widget/Visualization[6,123,124][2012–2020]3
Quality AssessmentAutomatic Assessment[112,117,125,126,127,128,129,130,131,132][2002–2020]10
Human Assessment[112,117,131,132,133][2016–2020]5
Table 3. Two-stage object detection models.
ModelRegion Finding MethodFeature Extraction ModelClassifier
R-CNN [48]Selective SearchCNNSVM
SSP-Net [46]Edge BoxCNNSVM
Fast R-CNN [47]Selective SearchCNNSoftmax Layer
Faster R-CNN [49]Region Proposal NetworkCNNSoftmax Layer
ORE [60]Region Proposal NetworkCNNEnergy-based Layer
Table 4. Storytelling with Image Data Models. The check marks demonstrate that the model employs and supports the corresponding module and the cross marks depict the opposite of this case.
No.ModelRelevant PhasesCNNRNNGNNGANRLTRTCN
1[110]1, 4, 6×××××
2[111]1, 4, 6×××××
3[112]1, 4, 6×××
4[114]1, 4, 6××××
5[62]1, 4, 6×××××
6[115]1, 4, 6××××
7[116]1, 4, 6×××××
8[117]1, 4, 6××××
9[118]1, 4, 6××××
10[120]1, 4, 6××××
11[65]1, 4, 6×××××
12[164]1, 4, 6×××
13[165]1, 4, 6×××
14[121]1, 4, 6×××××
15[166]1, 4, 6×××××
16[167]1, 4, 6×××××
17[168]1, 4, 6×××
18[122]1, 4, 6×××××
19[64]1, 4, 6×××××
20[101]1, 4, 6××××
21[169]1, 4, 6×××××
22[170]1, 4, 6×××××
Table 5. An overview of the assessment metrics taken into account for this research work.
Name of MetricDeveloped to EvaluateTechnique
BLEU [125]Automatic translationn-gram accuracy
METEOR [126]Automatic translationn-gram with matching of synonyms
ROUGE [180]Documentation summaryn-gram recall
SPICE [127]Image descriptionScene-to-synonym correspondence
CIDEr [128]Image descriptiontf-idf weighted n-gram correlation
Table 6. An overview of the datasets.
DatasetDescriptionReferences
VIST [110] (2016)40,098 train, 4988 validation, and 5050 test samples[65,101,110,111,112,113,114,115,116,117,120,164,165,167,181]
VIST-Edit1 [181] (2019)14,905 human-edited versions of 2981 generated stories[115,121,165,181]
AESOP [182] (2021)7062 stories containing 21,186 abstract visual scenes with corresponding text[182]
VHED [183] (2022)11,208 train, 1351 validation, and 1316 test samples[183]
Cooking [173] (2019)16,441 recipes with 160,479 photos with 80% train, 10% validation, and 10% test[173,174,175,185,186]
Recipe1M+ [184] (2019)Over 1 million recipes and 13 million food images[184,187,188]
Disclaimer/Publisher’s Note: The statements, opinions and data contained in all publications are solely those of the individual author(s) and contributor(s) and not of MDPI and/or the editor(s). MDPI and/or the editor(s) disclaim responsibility for any injury to people or property resulting from any ideas, methods, instructions or products referred to in the content.

