
Correlation Analysis of Factors Affecting Firm Performance and Employees Wellbeing: Application of Advanced Machine Learning Analysis

 ,
, 
Abstract
:1. Introduction
2. Materials and Methods
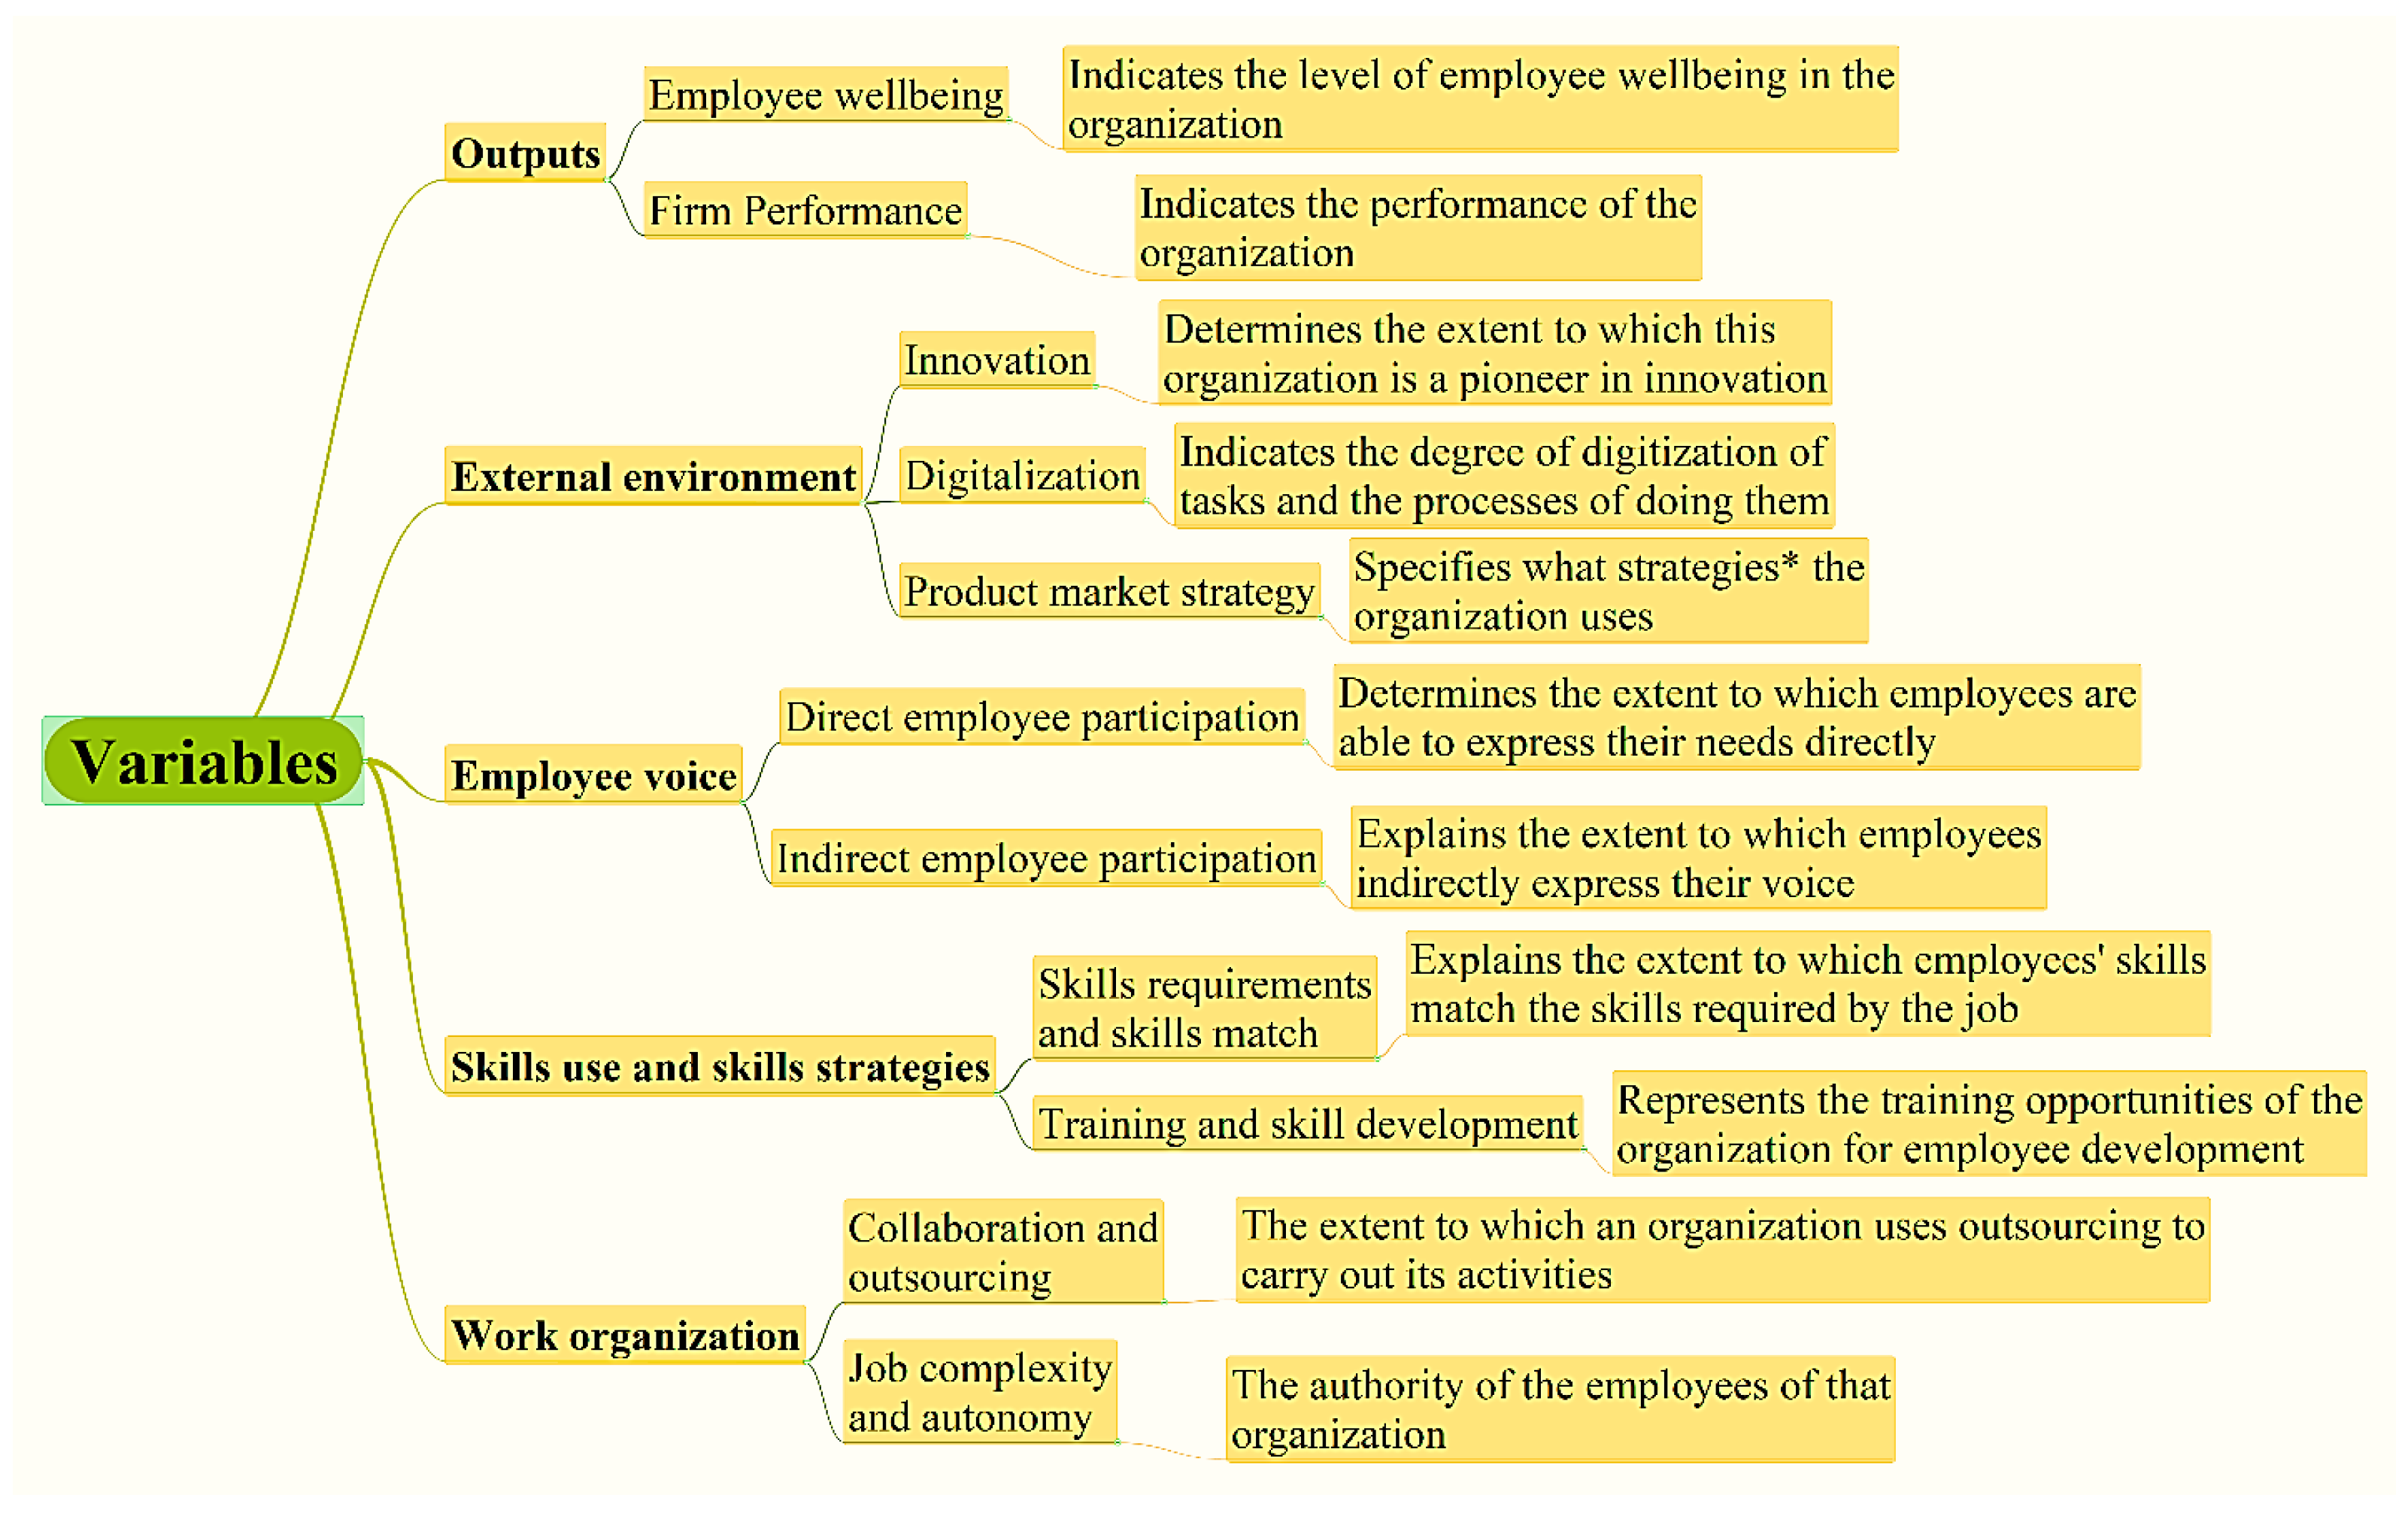
2.1. Dataset Description
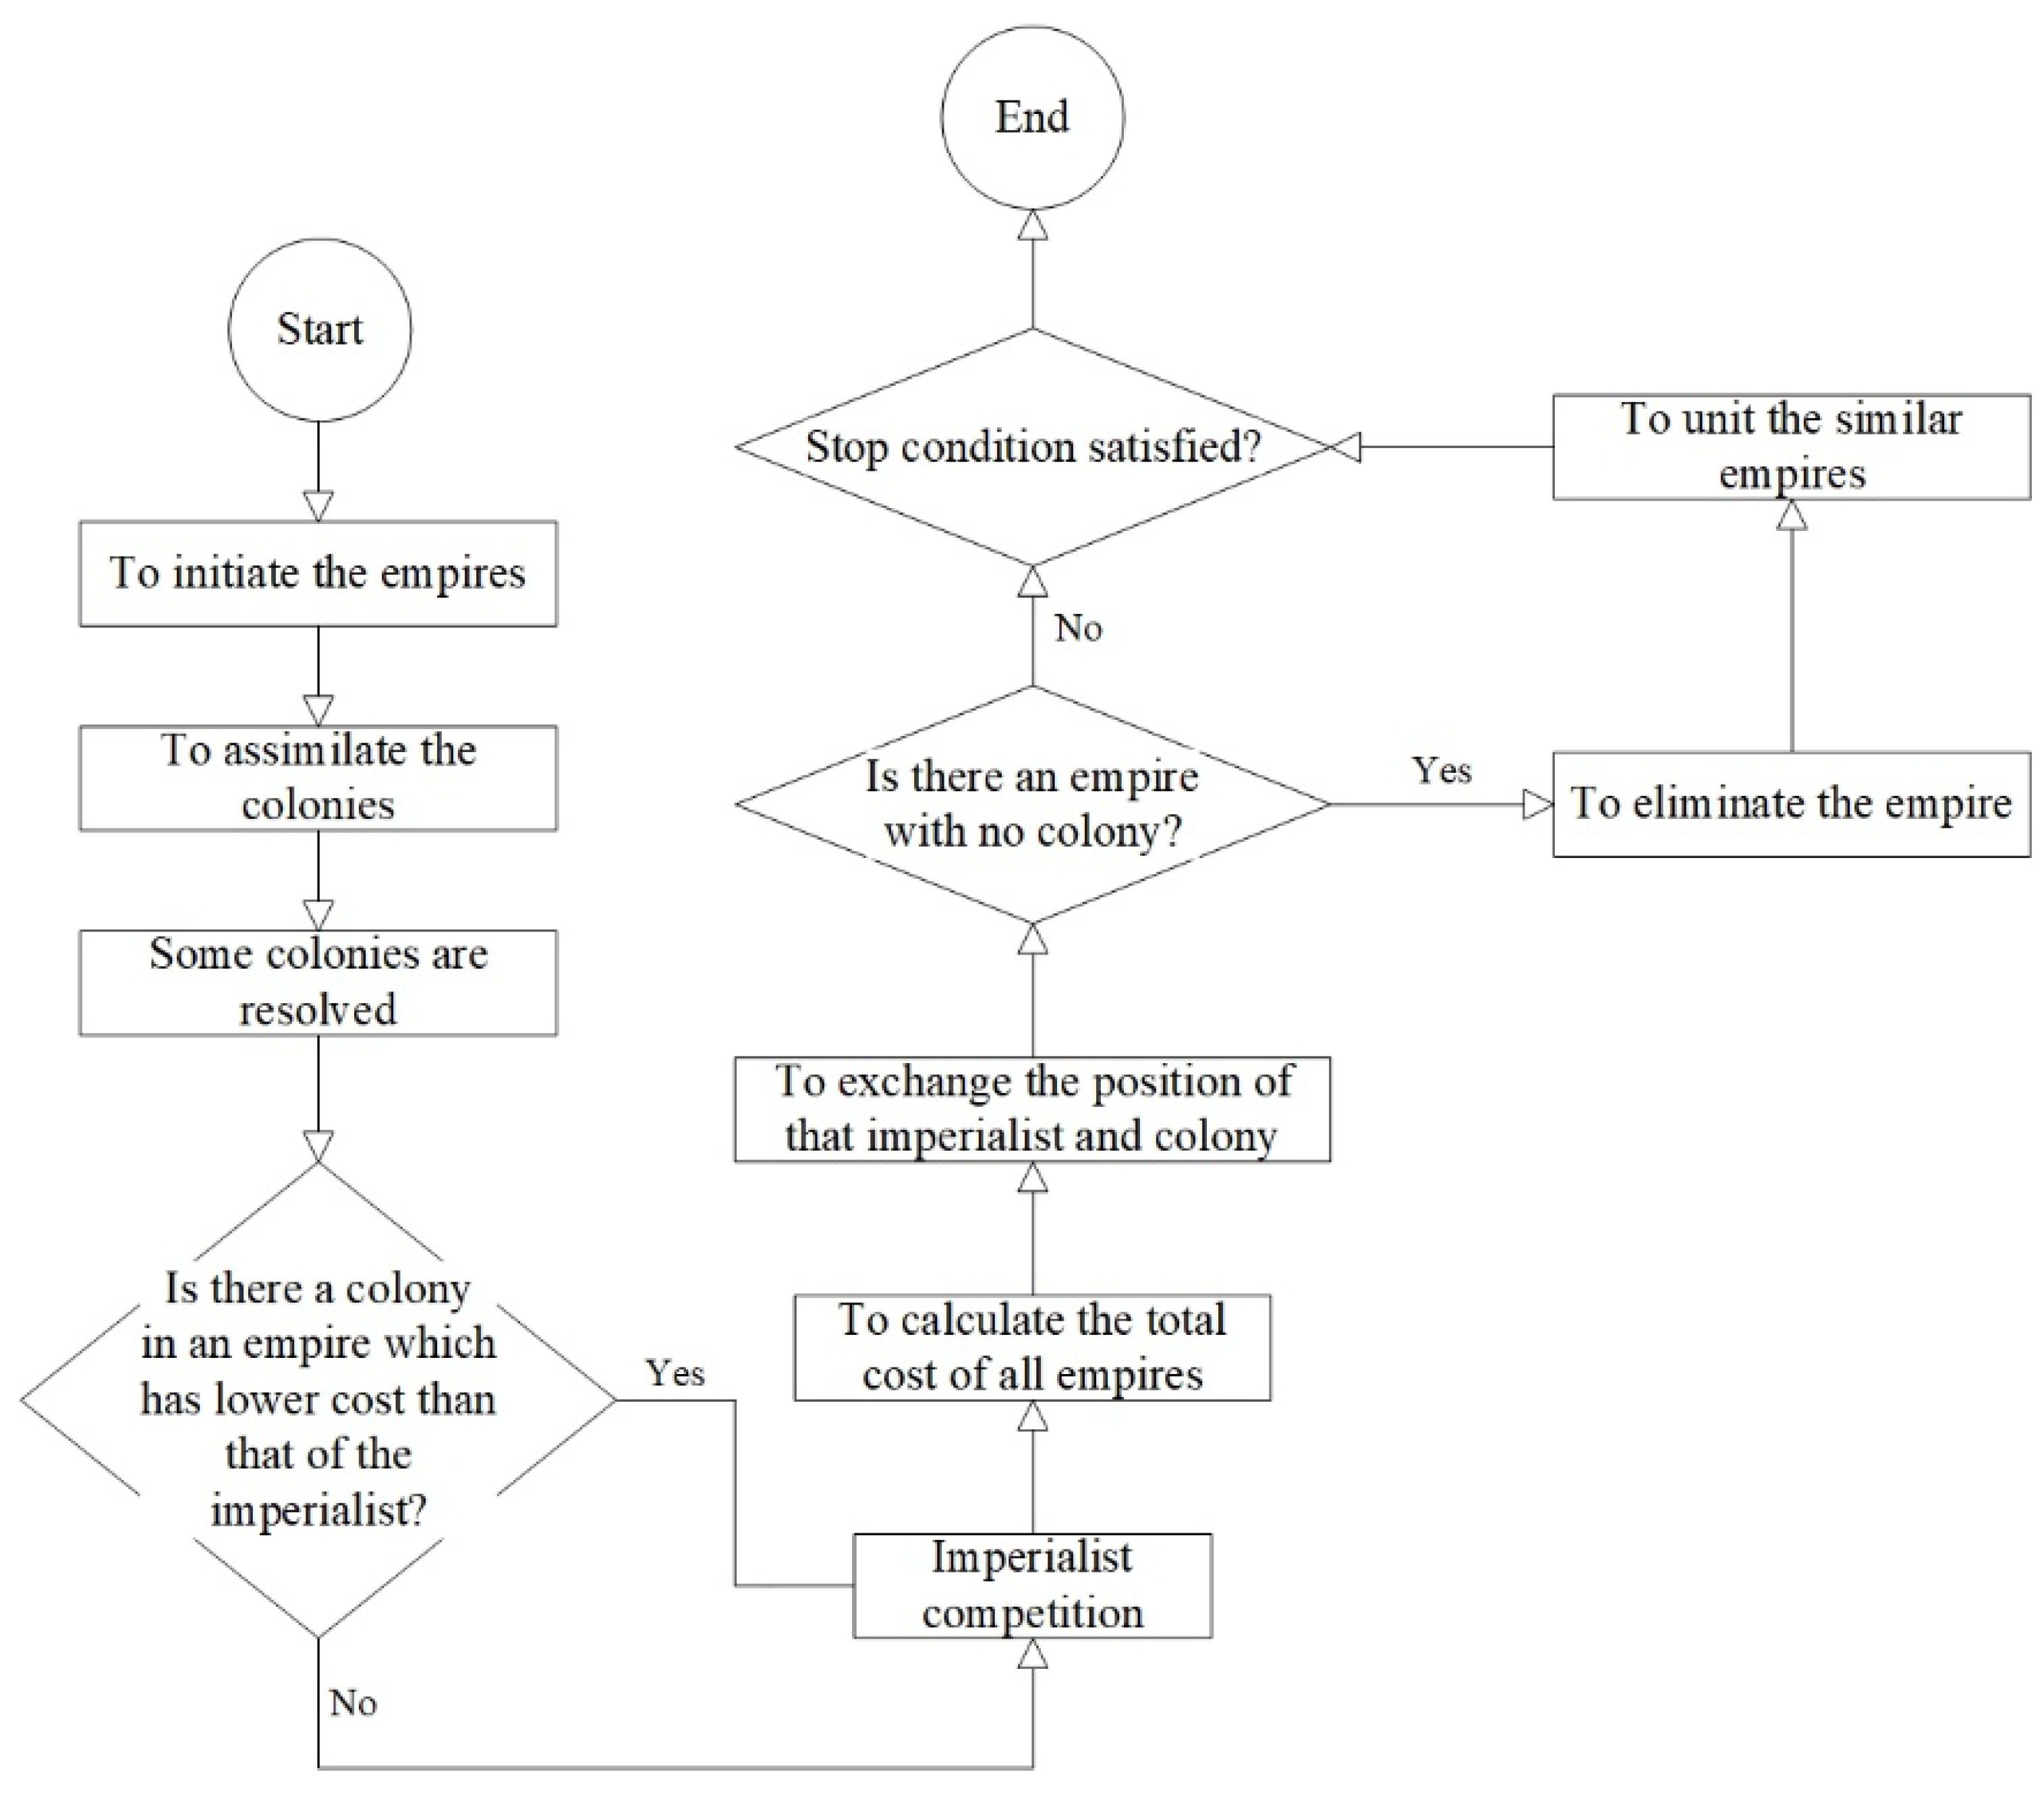
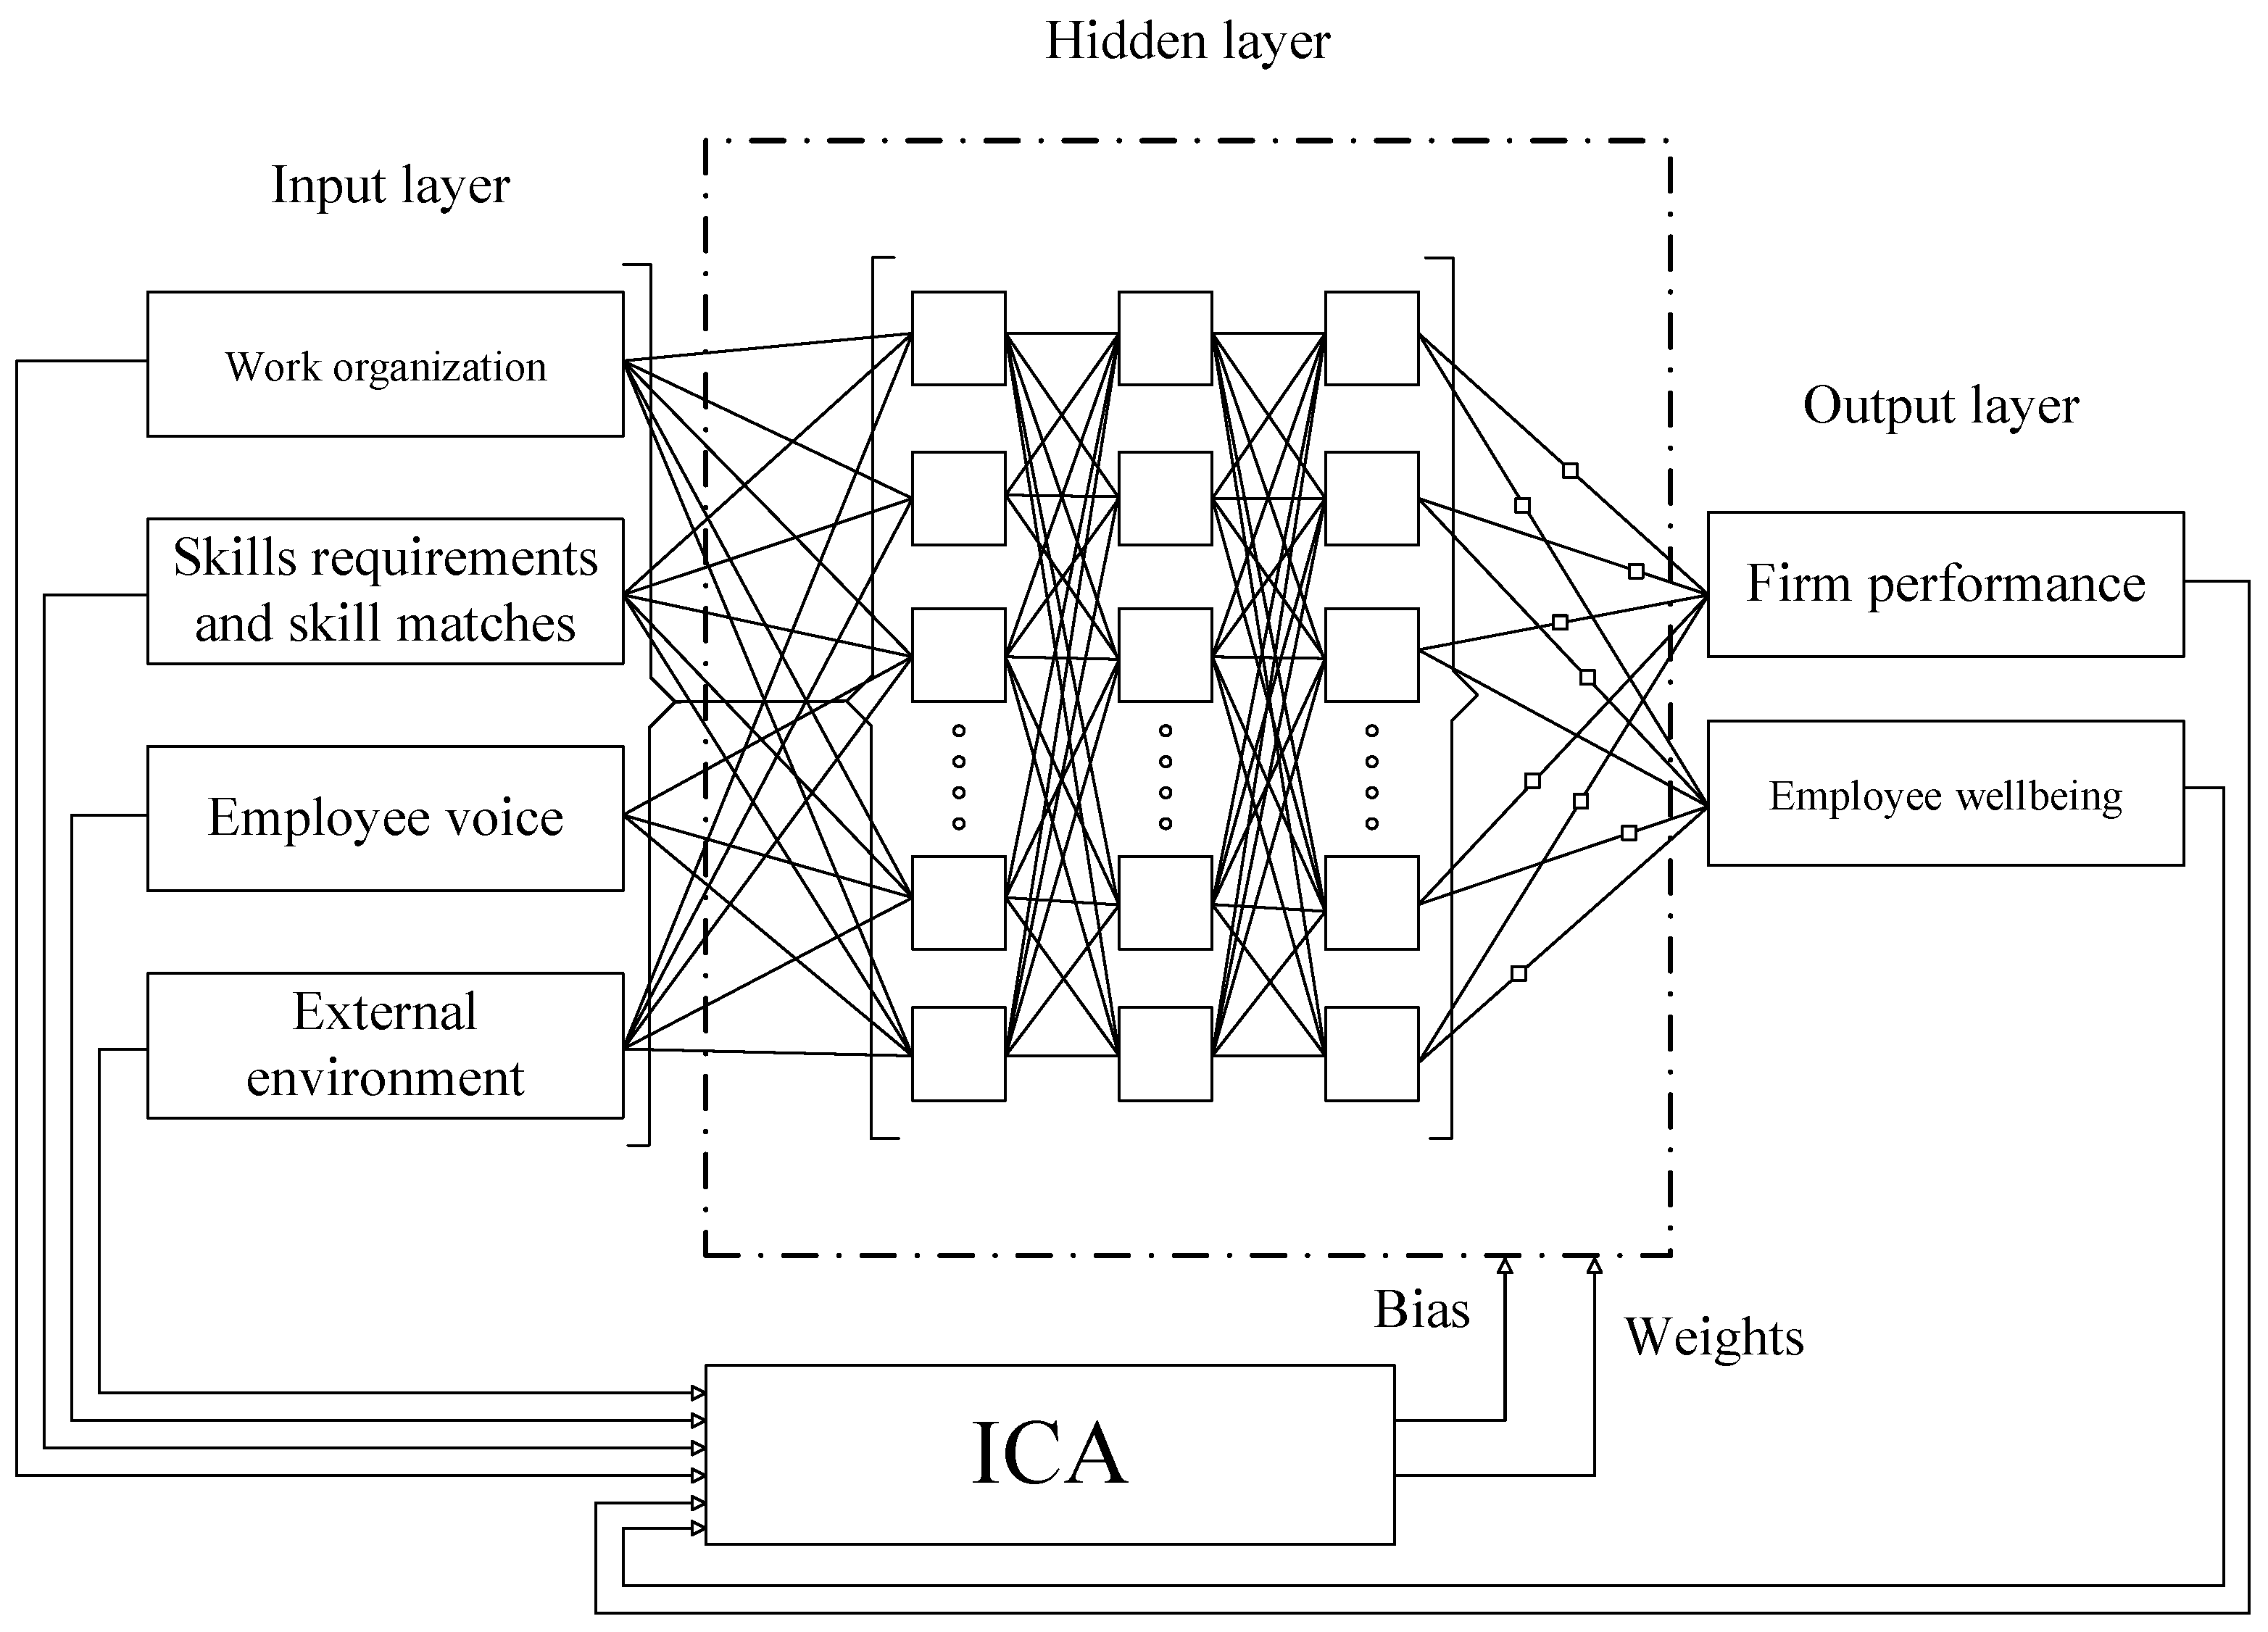
2.2. Machine Learning Method
3. Results
3.1. Mean Value Analysis
3.2. Modeling Results
4. Conclusions
Author Contributions
Funding
Institutional Review Board Statement
Informed Consent Statement
Data Availability Statement
Conflicts of Interest
References
- Farzianpour, F.; Aghababa, S.; Delgoshaei, B.; Haghgoo, M. Performance evaluation a teaching hospital affiliated to Tehran University of medical sciences based on baldrige excellence model. Am. J. Econ. Bus. Adm. 2011, 3, 277. [Google Scholar] [CrossRef]
- Chang, W.J.A.; Huang, T.C. Relationship between strategic human resource management and firm performance. Int. J. Manpow. 2005, 26, 434–449. [Google Scholar] [CrossRef]
- Marr, B.; Schiuma, G. Business performance measurement–past, present and future. Manag. Decis. 2003, 41, 680–687. [Google Scholar] [CrossRef]
- Morgan, A.; Colebourne, D.; Thomas, B. The development of ICT advisors for SME businesses: An innovative approach. Technovation 2006, 26, 980–987. [Google Scholar] [CrossRef]
- Maranto-Vargas, D.; Rangel, R.G.-T. Development of internal resources and capabilities as sources of differentiation of SME under increased global competition: A field study in Mexico. Technol. Forecast. Soc. Change 2007, 74, 90–99. [Google Scholar] [CrossRef]
- Lee, H.; Kim, J.; Kim, J. Determinants of success for application service provider: An empirical test in small businesses. Int. J. Hum. Comput. Stud. 2007, 65, 796–815. [Google Scholar] [CrossRef]
- Zare, M. The relationship between commanding leadership style and personality traits of nursing managers of hospitals affiliated to Tehran Medical Sciences Universities in 2014–2015. Med. Sci. J. Islam. Azad Univ.-Tehran Med. Branch 2016, 26, 238–247. [Google Scholar]
- Jacobs, G.; Hoste, V.J.L.R. SENTiVENT: Enabling supervised information extraction of company-specific events in economic and financial news. Comput. Humanit. 2022, 56, 225–257. [Google Scholar] [CrossRef]
- Elsharkawy, M.; Sharafeldeen, A.; Soliman, A.; Khalifa, F.; Ghazal, M.; El-Daydamony, E.; Atwan, A.; Sandhu, H.S.; El-Baz, A.J.D. A novel computer-aided diagnostic system for early detection of diabetic retinopathy using 3D-OCT higher-order spatial appearance model. Diagnostics 2022, 12, 461. [Google Scholar] [CrossRef]
- Meng, Y.; Shao, C.J.M.S.; Processing, S. Physics-informed ensemble learning for online joint strength prediction in ultrasonic metal welding. Mech. Syst. Signal Process. 2022, 181, 109473. [Google Scholar] [CrossRef]
- Sargent, B.; Jafari, M.; Marquez, G.; Mehta, A.S.; Sun, Y.-H.; Yang, H.-y.; Zhu, K.; Isseroff, R.R.; Zhao, M.; Gomez, M. A machine learning based model accurately predicts cellular response to electric fields in multiple cell types. Sci. Rep. 2022, 12, 9912. [Google Scholar] [CrossRef]
- Song, W.; Zou, S.; Tian, Y.; Fong, S. Classifying 3D objects in LiDAR point clouds with a back-propagation neural network. Human-Centric Comput. Inf. Sci. 2018, 8, 29. [Google Scholar] [CrossRef]
- Fredström, A.; Parida, V.; Wincent, J.; Sjödin, D.; Oghazi, P.J.T.F.; Change, S. What is the Market Value of Artificial Intelligence and Machine Learning? The Role of Innovativeness and Collaboration for Performance. Technol. Forecast. Soc. Chang. 2022, 180, 121716. [Google Scholar] [CrossRef]
- Shaaban, A.G.; Khafagy, M.H.; Elmasry, M.A.; El-Bei, H.H.; Ibrahim, M.H. Knowledge discovery in manufacturing datasets using data mining techniques to improve business performance. Indones. J. Electr. Eng. Comput. Sci. 2022, 26, 1736–1746. [Google Scholar] [CrossRef]
- Ahmed, A.A.A.; Agarwal, S.; Kurniawan, I.G.A.; Anantadjaya, S.P.; Krishnan, C. Business boosting through sentiment analysis using Artificial Intelligence approach. Int. J. Syst. Assur. Eng. Manag. 2022, 13, 699–709. [Google Scholar] [CrossRef]
- Van Houten, G.; Russo, G. European Company Survey 2019: Workplace Practices Unlocking Employee Potential; Eurofound: Brussels, Belgium, 2020. [Google Scholar]
- Eurofound; Cedefop. European Company Survey 2019 Series; Publications Office of the European Union: Luxembourg, 2020; ISBN 978-92-897-2107-3. Available online: https://www.cedefop.europa.eu/en/publications/2228 (accessed on 12 April 2022).
- Valeyre, A.; Lorenz, E.; Cartron, D.; Csizmadia, P.; Gollac, M.; Illéssy, M.; Makó, C. Munkaszervezeti modellek Európában és az emberierőforrás-gazdálkodás néhány jellemzője Kísérlet a munkaszervezetek nemzetközi paradigmatérképének elkészítésére (II. rész). Vez. Bp. Manag. Rev. 2009, 40, 36–51. [Google Scholar] [CrossRef]
- Haapakorpi, A.; Alasoini, T. Work organization and technology: Introduction to the theme of the special issue. Nord. J. Work. Life Stud. 2018, 8, S3. [Google Scholar] [CrossRef]
- Khosravi, A.; Syri, S.J.J.o.C.P. Modeling of geothermal power system equipped with absorption refrigeration and solar energy using multilayer perceptron neural network optimized with imperialist competitive algorithm. J. Clean. Prod. 2020, 276, 124216. [Google Scholar] [CrossRef]
- Pham, D.T.; Sagiroglu, S. Training multilayered perceptrons for pattern recognition: A comparative study of four training algorithms. Int. J. Mach. Tools Manuf. 2001, 41, 419–430. [Google Scholar] [CrossRef]
- Plunkett, K.; Marchman, V. U-shaped learning and frequency effects in a multilayered perceptron: Implications for child language acquisition. Cognition 1991, 38, 487–526. [Google Scholar] [CrossRef]
- Shepherd, A.J. Second-Order Methods for Neural Networks: Fast and Reliable Training Methods for Multi-Layer Perceptrons; Springer Science & Business Media: Berlin/Heidelberg, Germany, 2012. [Google Scholar]
- Taud, H.; Mas, J. Multilayer perceptron (MLP). In Geomatic Approaches for Modeling Land Change Scenarios; Springer: Berlin/Heidelberg, Germany, 2018; pp. 451–455. [Google Scholar]
- Atashpaz-Gargari, E.; Lucas, C. Imperialist competitive algorithm: An algorithm for optimization inspired by imperialistic competition. In Proceedings of the 2007 IEEE Congress on Evolutionary Computation, Singapore, 25–28 September 2007; pp. 4661–4667. [Google Scholar]
- Zadeh Shirazi, A.; Mohammadi, Z. A hybrid intelligent model combining ANN and imperialist competitive algorithm for prediction of corrosion rate in 3C steel under seawater environment. Neural Comput. Appl. 2017, 28, 3455–3464. [Google Scholar] [CrossRef]
- Kim, G.G.; Choi, J.H.; Park, S.Y.; Bhang, B.G.; Nam, W.J.; Cha, H.L.; Park, N.; Ahn, H.-K. Prediction model for PV performance with correlation analysis of environmental variables. IEEE J. Photovolt. 2019, 9, 832–841. [Google Scholar] [CrossRef]
- Ahmad, T.; Chen, H.J.E. Short and medium-term forecasting of cooling and heating load demand in building environment with data-mining based approaches. Energy Build. 2018, 166, 460–476. [Google Scholar] [CrossRef]
- Roy, S.S.; Samui, P.; Nagtode, I.; Jain, H.; Shivaramakrishnan, V.; Mohammadi-Ivatloo, B. Forecasting heating and cooling loads of buildings: A comparative performance analysis. J. Ambient Intell. Humaniz. Comput. 2020, 11, 1253–1264. [Google Scholar] [CrossRef]
- Roy, S.; Banerjee, R.; Bose, P.K. Performance and exhaust emissions prediction of a CRDI assisted single cylinder diesel engine coupled with EGR using artificial neural network. Appl. Energy 2014, 119, 330–340. [Google Scholar] [CrossRef]
- Kertész, G.; Szénási, S.; Vámossy, Z. Comparative analysis of image projection-based descriptors in Siamese neural networks. Adv. Eng. Softw. 2021, 154, 102963. [Google Scholar] [CrossRef]


| Order | Neuron Arrangements for Hidden Layer | No. of Countries | No. of ITERATIONS | Prodvol_68 | Profit_69 | Profplan_70 | Chempfut_71 | Sickleave_59 | Lowmot_60 | Retainemp_62 | Qwprel_63 |
|---|---|---|---|---|---|---|---|---|---|---|---|
| 1 | 20-10 | 100 | 1000 | 7.314 | 6.706 | 5.304 | 6.903 | 5.801 | 5.756 | 7.423 | 8.123 |
| 2 | 20-10 | 200 | 1000 | 6.001 | 5.804 | 5.112 | 6.209 | 5.111 | 5.569 | 7.057 | 7.912 |
| 3 | 20-10 | 300 | 1000 | 5.905 | 5.586 | 4.920 | 6.017 | 5.765 | 5.554 | 6.929 | 7.178 |
| 4 | 20-10-5 | 100 | 1000 | 5.271 | 5.002 | 5.000 | 5.343 | 5.887 | 5.021 | 6.045 | 6.213 |
| 5 | 20-10-5 | 200 | 1000 | 4.364 | 4.632 | 4.323 | 5.009 | 5.521 | 4.982 | 5.944 | 5.965 |
| 6 | 20-10-5 | 300 | 1000 | 4.133 | 4.895 | 3.903 | 4.522 | 5.108 | 4.020 | 5.420 | 5.651 |
| 7 | 30-20 | 100 | 1000 | 4.199 | 4.555 | 3.429 | 4.043 | 4.822 | 3.858 | 5.010 | 5.400 |
| 8 | 30-20 | 200 | 1000 | 3.906 | 4.004 | 3.005 | 3.788 | 4.011 | 3.201 | 4.831 | 5.187 |
| 9 | 30-20 | 300 | 1000 | 3.819 | 3.777 | 2.487 | 3.115 | 3.333 | 2.871 | 4.338 | 4.876 |
| 10 | 30-20-10 | 100 | 1000 | 3.542 | 3.008 | 1.999 | 2.911 | 2.024 | 2.006 | 3.999 | 4.077 |
| 11 | 30-20-10 | 200 | 1000 | 2.788 | 2.001 | 1.461 | 2.700 | 1.211 | 1.458 | 3.503 | 3.522 |
| 12 | 30-20-10 | 300 | 1000 | 2.033 | 1.366 | 1.103 | 2.231 | 0.899 | 0.700 | 3.114 | 2.900 |
| Order | Neuron Arrangements for Hidden Layer | No. of Countries | No. of Iterations | Prodvol_68 | Profit_69 | Profplan_70 | Chempfut_71 | Sickleave_59 | Lowmot_60 | Retainemp_62 | Qwprel_63 |
|---|---|---|---|---|---|---|---|---|---|---|---|
| 1 | 20-10 | 100 | 1000 | 7.113 | 0.899 | 4.161 | 2.100 | 1.422 | 4.198 | 0.0500 | 0.903 |
| 2 | 20-10 | 200 | 1000 | 6.001 | 0.702 | 3.604 | 1.912 | 1.310 | 3.698 | 0.048 | 0.803 |
| 3 | 20-10 | 300 | 1000 | 5.434 | 0.732 | 3.169 | 1.808 | 1.278 | 3.121 | 0.031 | 0.800 |
| 4 | 20-10-5 | 100 | 1000 | 5.005 | 0.693 | 2.234 | 1.721 | 1.162 | 2.891 | 0.020 | 0.731 |
| 5 | 20-10-5 | 200 | 1000 | 4.777 | 0.613 | 1.906 | 1.600 | 1.001 | 2.400 | 0.008 | 0.605 |
| 6 | 20-10-5 | 300 | 1000 | 4.100 | 0.501 | 1.333 | 1.449 | 0.912 | 2.005 | 0.006 | 0.500 |
| 7 | 30-20 | 100 | 1000 | 3.356 | 0.412 | 1.125 | 1.228 | 0.900 | 1.977 | 0.004 | 0.389 |
| 8 | 30-20 | 200 | 1000 | 2.988 | 0.290 | 0.996 | 0.991 | 0.787 | 1.822 | 0.003 | 0.201 |
| 9 | 30-20 | 300 | 1000 | 2.401 | 0.056 | 0.721 | 0.620 | 0.422 | 1.701 | 0.003 | 0.142 |
| 10 | 30-20-10 | 100 | 1000 | 1.889 | 0.014 | 0.506 | 0.399 | 0.211 | 1.498 | 0.002 | 0.099 |
| 11 | 30-20-10 | 200 | 1000 | 0.987 | 0.0009 | 0.422 | 0.100 | 0.098 | 1.032 | 0.001 | 0.049 |
| 12 | 30-20-10 | 300 | 1000 | 0.301 | 0.0005 | 0.297 | 0.0403 | 0.014 | 0.432 | 0.0000 | 0.013 |
| Order | Neuron Arrangements for Hidden Layer | No. of Countries | No. of Iterations | Prodvol_68 | Profit_69 | Profplan_70 | Chempfut_71 | Sickleave_59 | Lowmot_60 | Retainemp_62 | Qwprel_63 |
|---|---|---|---|---|---|---|---|---|---|---|---|
| 1 | 20-10 | 100 | 1000 | 5.014 | 6.891 | 2.093 | 3.618 | 2.948 | 2.094 | 3.577 | 2.051 |
| 2 | 20-10 | 200 | 1000 | 4.194 | 5.792 | 1.999 | 3.321 | 2.431 | 1.901 | 3.113 | 1.901 |
| 3 | 20-10 | 300 | 1000 | 3.900 | 5.299 | 1.891 | 2.965 | 2.131 | 1.872 | 2.976 | 1.878 |
| 4 | 20-10-5 | 100 | 1000 | 3.564 | 5.014 | 1.700 | 2.432 | 1.990 | 1.789 | 2.667 | 1.750 |
| 5 | 20-10-5 | 200 | 1000 | 3.109 | 4.842 | 1.509 | 2.006 | 1.776 | 1.609 | 2.067 | 1.450 |
| 6 | 20-10-5 | 300 | 1000 | 2.942 | 4.511 | 1.400 | 1.891 | 1.540 | 1.430 | 1.645 | 1.251 |
| 7 | 30-20 | 100 | 1000 | 2.777 | 3.888 | 1.294 | 1.603 | 1.345 | 1.202 | 1.236 | 1.051 |
| 8 | 30-20 | 200 | 1000 | 2.001 | 3.001 | 1.010 | 1.590 | 1.223 | 1.029 | 1.069 | 0.905 |
| 9 | 30-20 | 300 | 1000 | 1.666 | 2.118 | 0.822 | 1.333 | 1.005 | 0.999 | 0.907 | 0.850 |
| 10 | 30-20-10 | 100 | 1000 | 1.213 | 1.542 | 0.555 | 1.003 | 0.899 | 0.621 | 0.700 | 0.502 |
| 11 | 30-20-10 | 200 | 1000 | 0.801 | 1.002 | 0.282 | 0.872 | 0.567 | 0.328 | 0.699 | 0.200 |
| 12 | 30-20-10 | 300 | 1000 | 0.488 | 0.719 | 0.099 | 0.444 | 0.302 | 0.121 | 0.586 | 0.099 |
| Order | Neuron Arrangements for Hidden Layer | No. of Countries | No. of Iterations | Prodvol_68 | Profit_69 | Profplan_70 | Chempfut_71 | Sickleave_59 | Lowmot_60 | Retainemp_62 | Qwprel_63 |
|---|---|---|---|---|---|---|---|---|---|---|---|
| 1 | 20-10 | 100 | 1000 | 7.5194 | 5.9298 | 5.4228 | 4.9581 | 5.268 | 5.142 | 7.074 | 6.141 |
| 2 | 20-10 | 200 | 1000 | 6.944 | 5.268 | 5.005 | 4.101 | 4.811 | 4.992 | 6.714 | 5.800 |
| 3 | 20-10 | 300 | 1000 | 6.532 | 4.999 | 4.898 | 3.911 | 4.333 | 4.215 | 6.001 | 5.150 |
| 4 | 20-10-5 | 100 | 1000 | 6.001 | 4.708 | 4.451 | 3.526 | 4.089 | 4.000 | 5.704 | 4.845 |
| 5 | 20-10-5 | 200 | 1000 | 5.823 | 4.277 | 4.021 | 3.051 | 3.698 | 3.482 | 5.048 | 4.101 |
| 6 | 20-10-5 | 300 | 1000 | 5.104 | 3.810 | 3.709 | 2.508 | 3.064 | 3.100 | 4.571 | 3.811 |
| 7 | 30-20 | 100 | 1000 | 4.601 | 3.021 | 3.202 | 1.968 | 2.939 | 2.777 | 4.061 | 3.112 |
| 8 | 30-20 | 200 | 1000 | 3.904 | 2.987 | 2.658 | 1.501 | 2.282 | 2.452 | 3.379 | 2.642 |
| 9 | 30-20 | 300 | 1000 | 3.101 | 2.892 | 2.202 | 1.331 | 2.008 | 2.012 | 3.005 | 2.465 |
| 10 | 30-20-10 | 100 | 1000 | 2.400 | 2.598 | 2.002 | 1.111 | 1.841 | 1.723 | 2.893 | 2.001 |
| 11 | 30-20-10 | 200 | 1000 | 2.000 | 2.220 | 1.777 | 1.032 | 1.570 | 1.404 | 2.500 | 1.555 |
| 12 | 30-20-10 | 300 | 1000 | 1.999 | 1.872 | 1.383 | 0.876 | 1.380 | 1.130 | 2.170 | 1.132 |
| Parameter | Minimum | Maximum | Mean | Std. Deviation |
|---|---|---|---|---|
| sickleave_59 | 1 | 2 | 1.745542 | 0.435606 |
| lowmot_60 | 1 | 2 | 1.78235 | 0.412695 |
| retainemp_62 | 1 | 2 | 1.3123 | 0.463484 |
| qwprel_63 | 1 | 2 | 1.859625 | 0.347415 |
| prodvol_68 | 1 | 2 | 1.501143 | 0.500056 |
| profit_69 | 1 | 2 | 1.714906 | 0.451511 |
| profplan_70 | 1 | 2 | 1.807727 | 0.394131 |
| chempfut_71 | 1 | 2 | 1.322359 | 0.467433 |
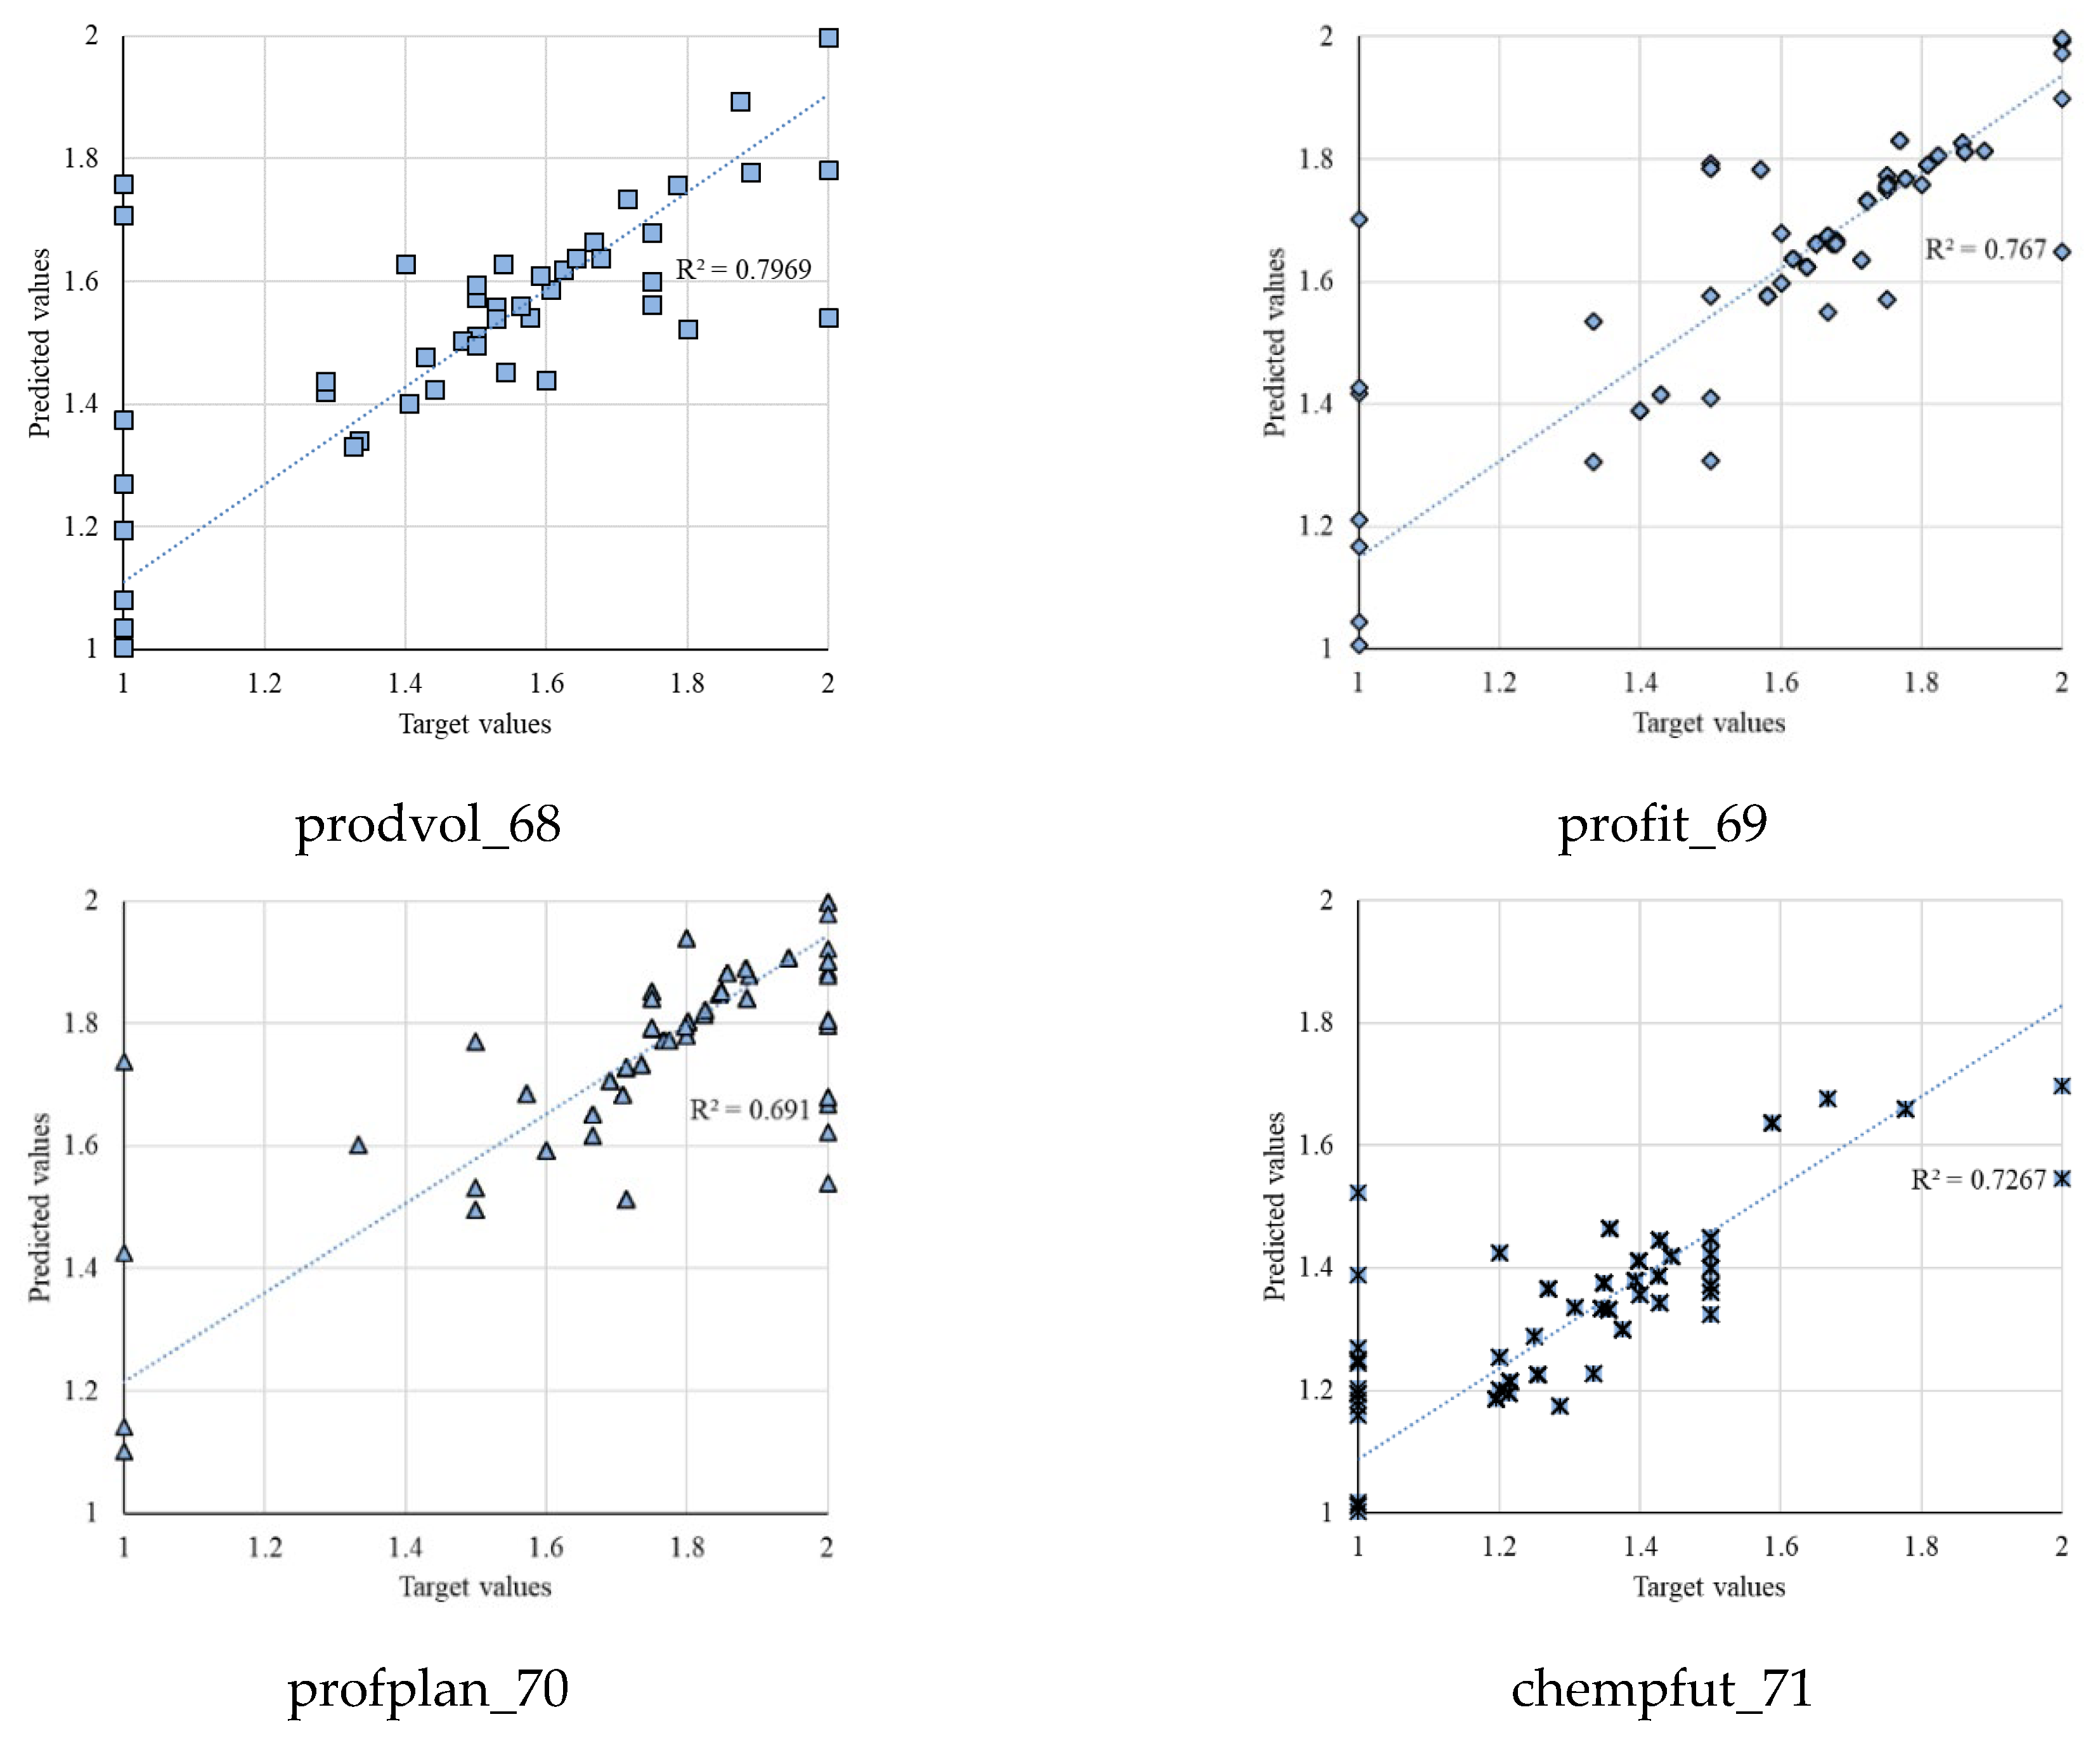
| Work Organization | Prodvol_68 | Profit_69 | Profplan_70 | Chempfut_71 | Average |
|---|---|---|---|---|---|
| MAPE | 2.217 | 1.546 | 1.230 | 2.857 | 1.962 |
| MSE | 0.004 | 0.003 | 0.003 | 0.004 | 0.004 |
| RMSE | 0.064 | 0.058 | 0.057 | 0.063 | 0.060 |
| R | 0.893 | 0.876 | 0.831 | 0.852 | 0.863 |
| R2 | 0.797 | 0.767 | 0.691 | 0.727 | 0.745 |
| Work Organization | Sickleave_59 | Lowmot_60 | Retainemp_62 | Qwprel_63 | Average |
|---|---|---|---|---|---|
| MAPE | 0.727 | 0.842 | 3.209 | 1.045 | 1.456 |
| MSE | 0.002 | 0.001 | 0.006 | 0.002 | 0.003 |
| RMSE | 0.044 | 0.036 | 0.078 | 0.047 | 0.051 |
| R | 0.904 | 0.797 | 0.682 | 0.821 | 0.801 |
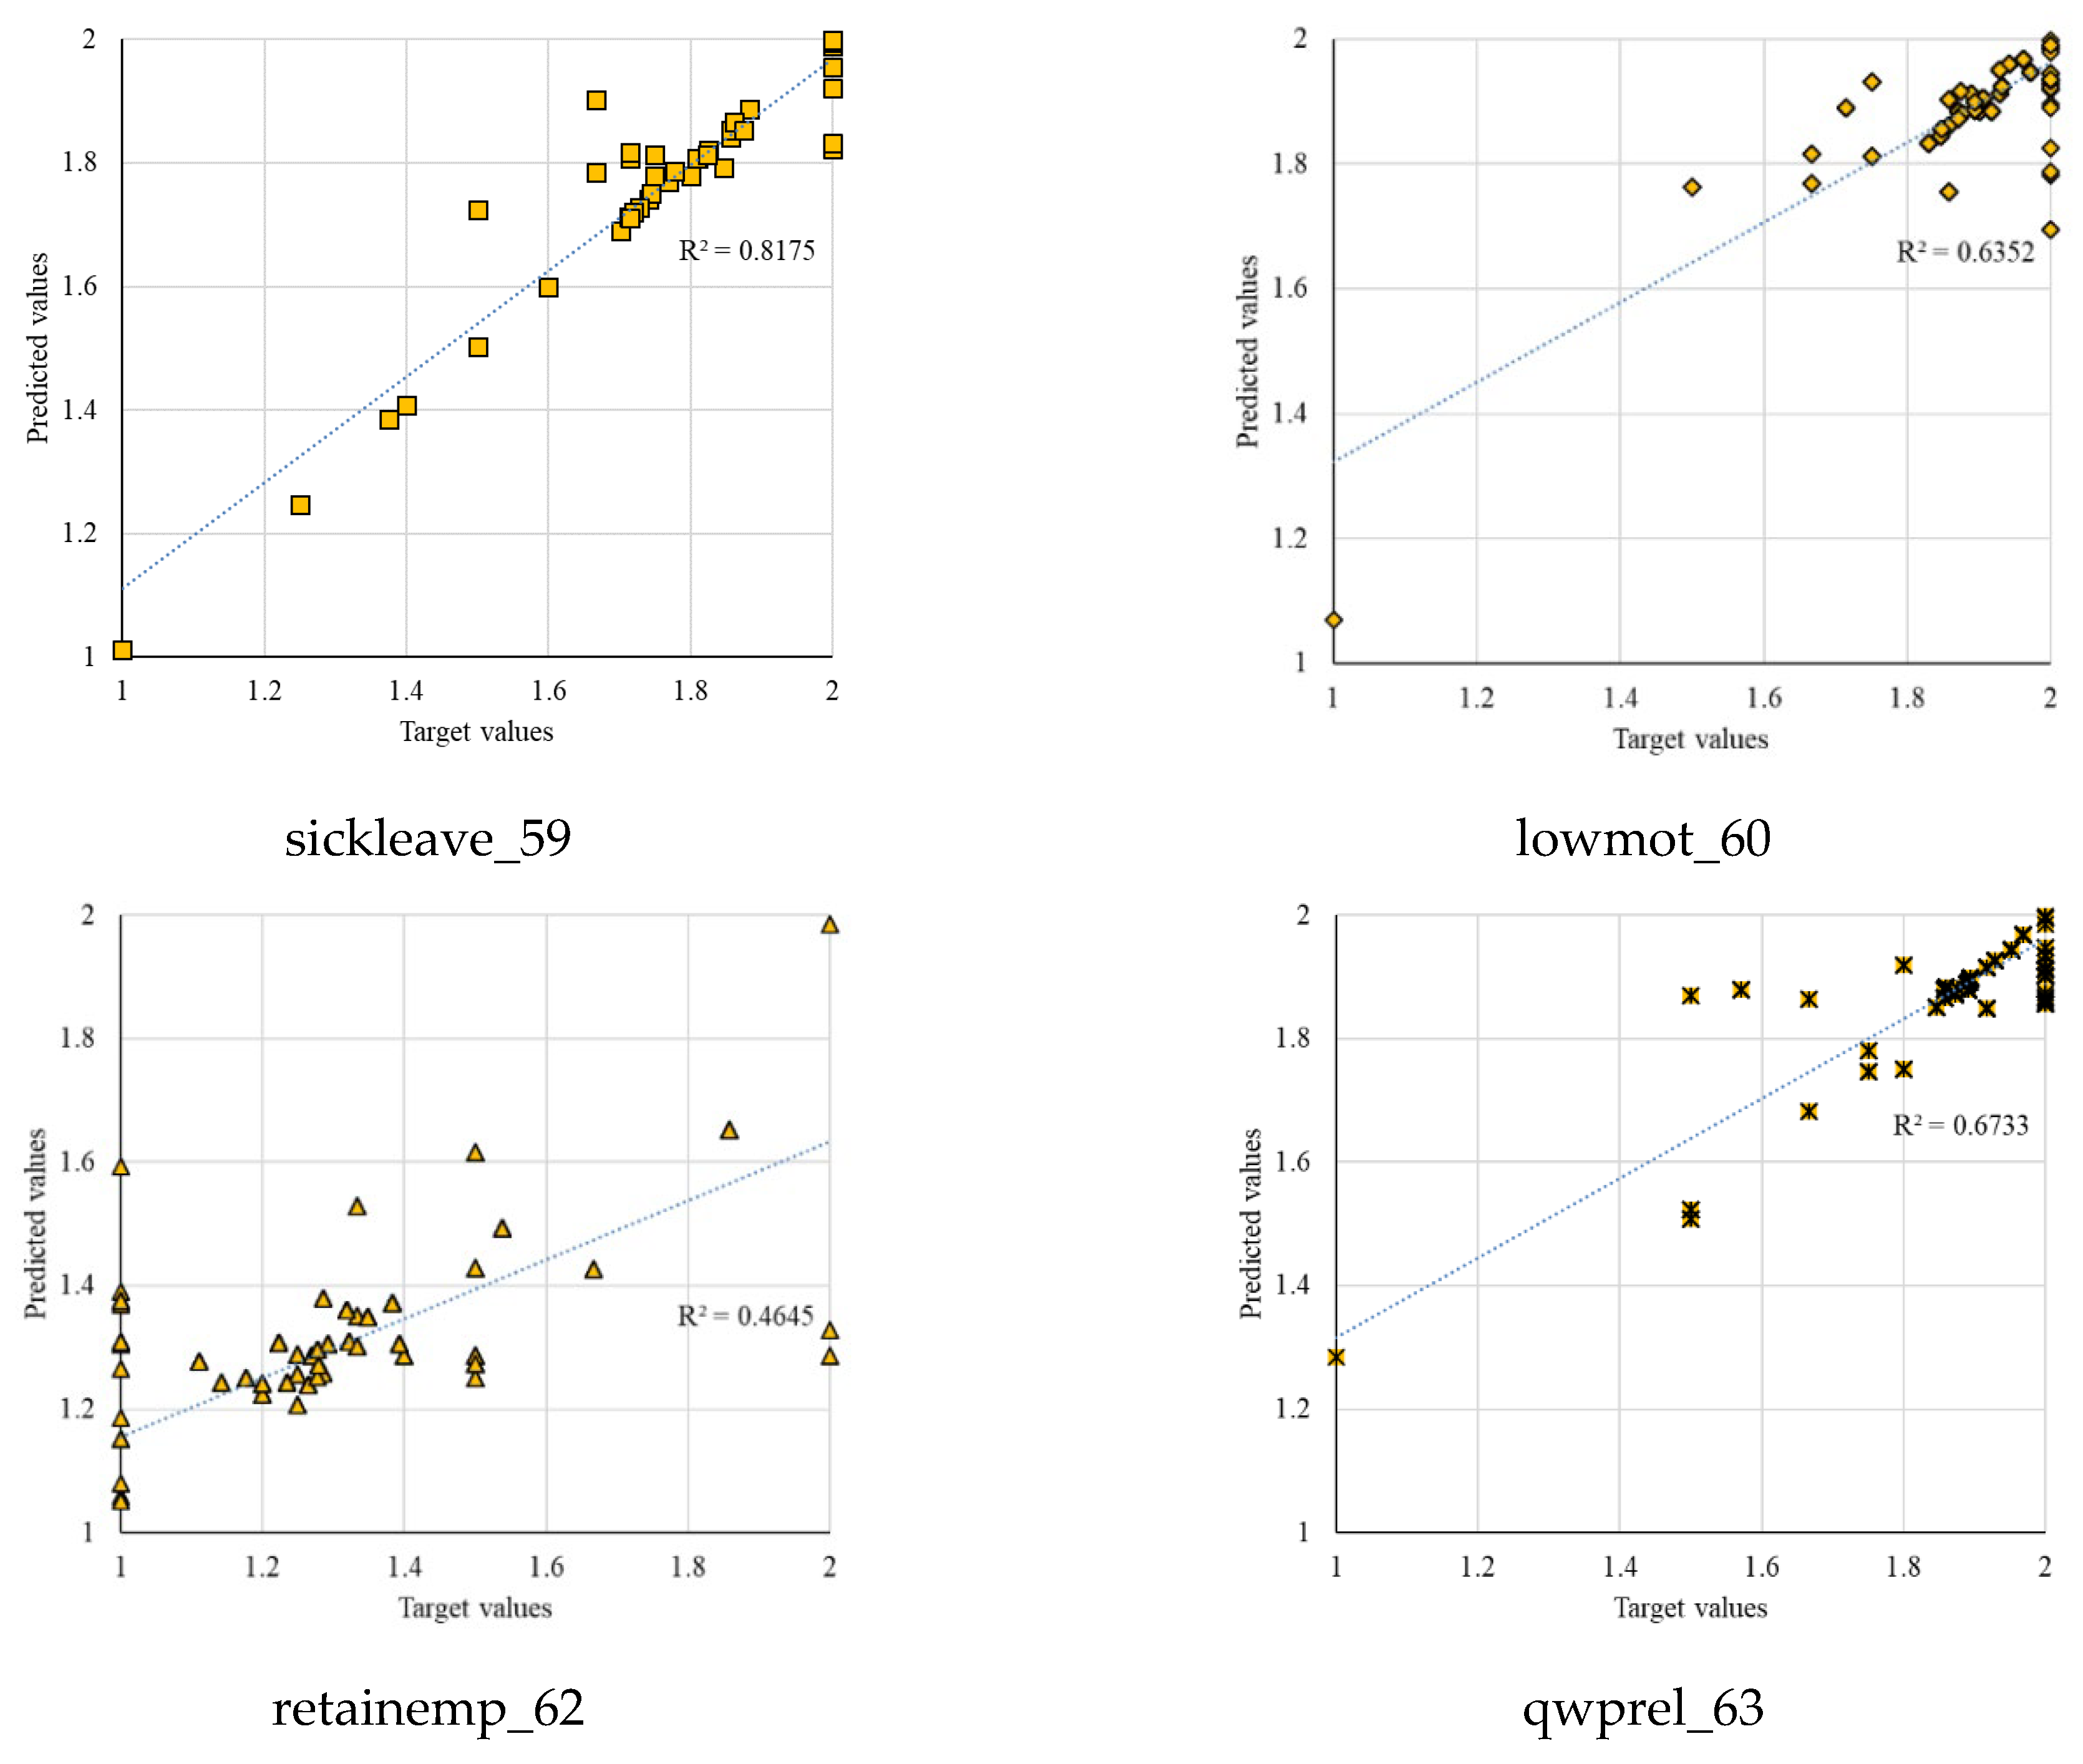
| R2 | 0.818 | 0.635 | 0.464 | 0.673 | 0.648 |
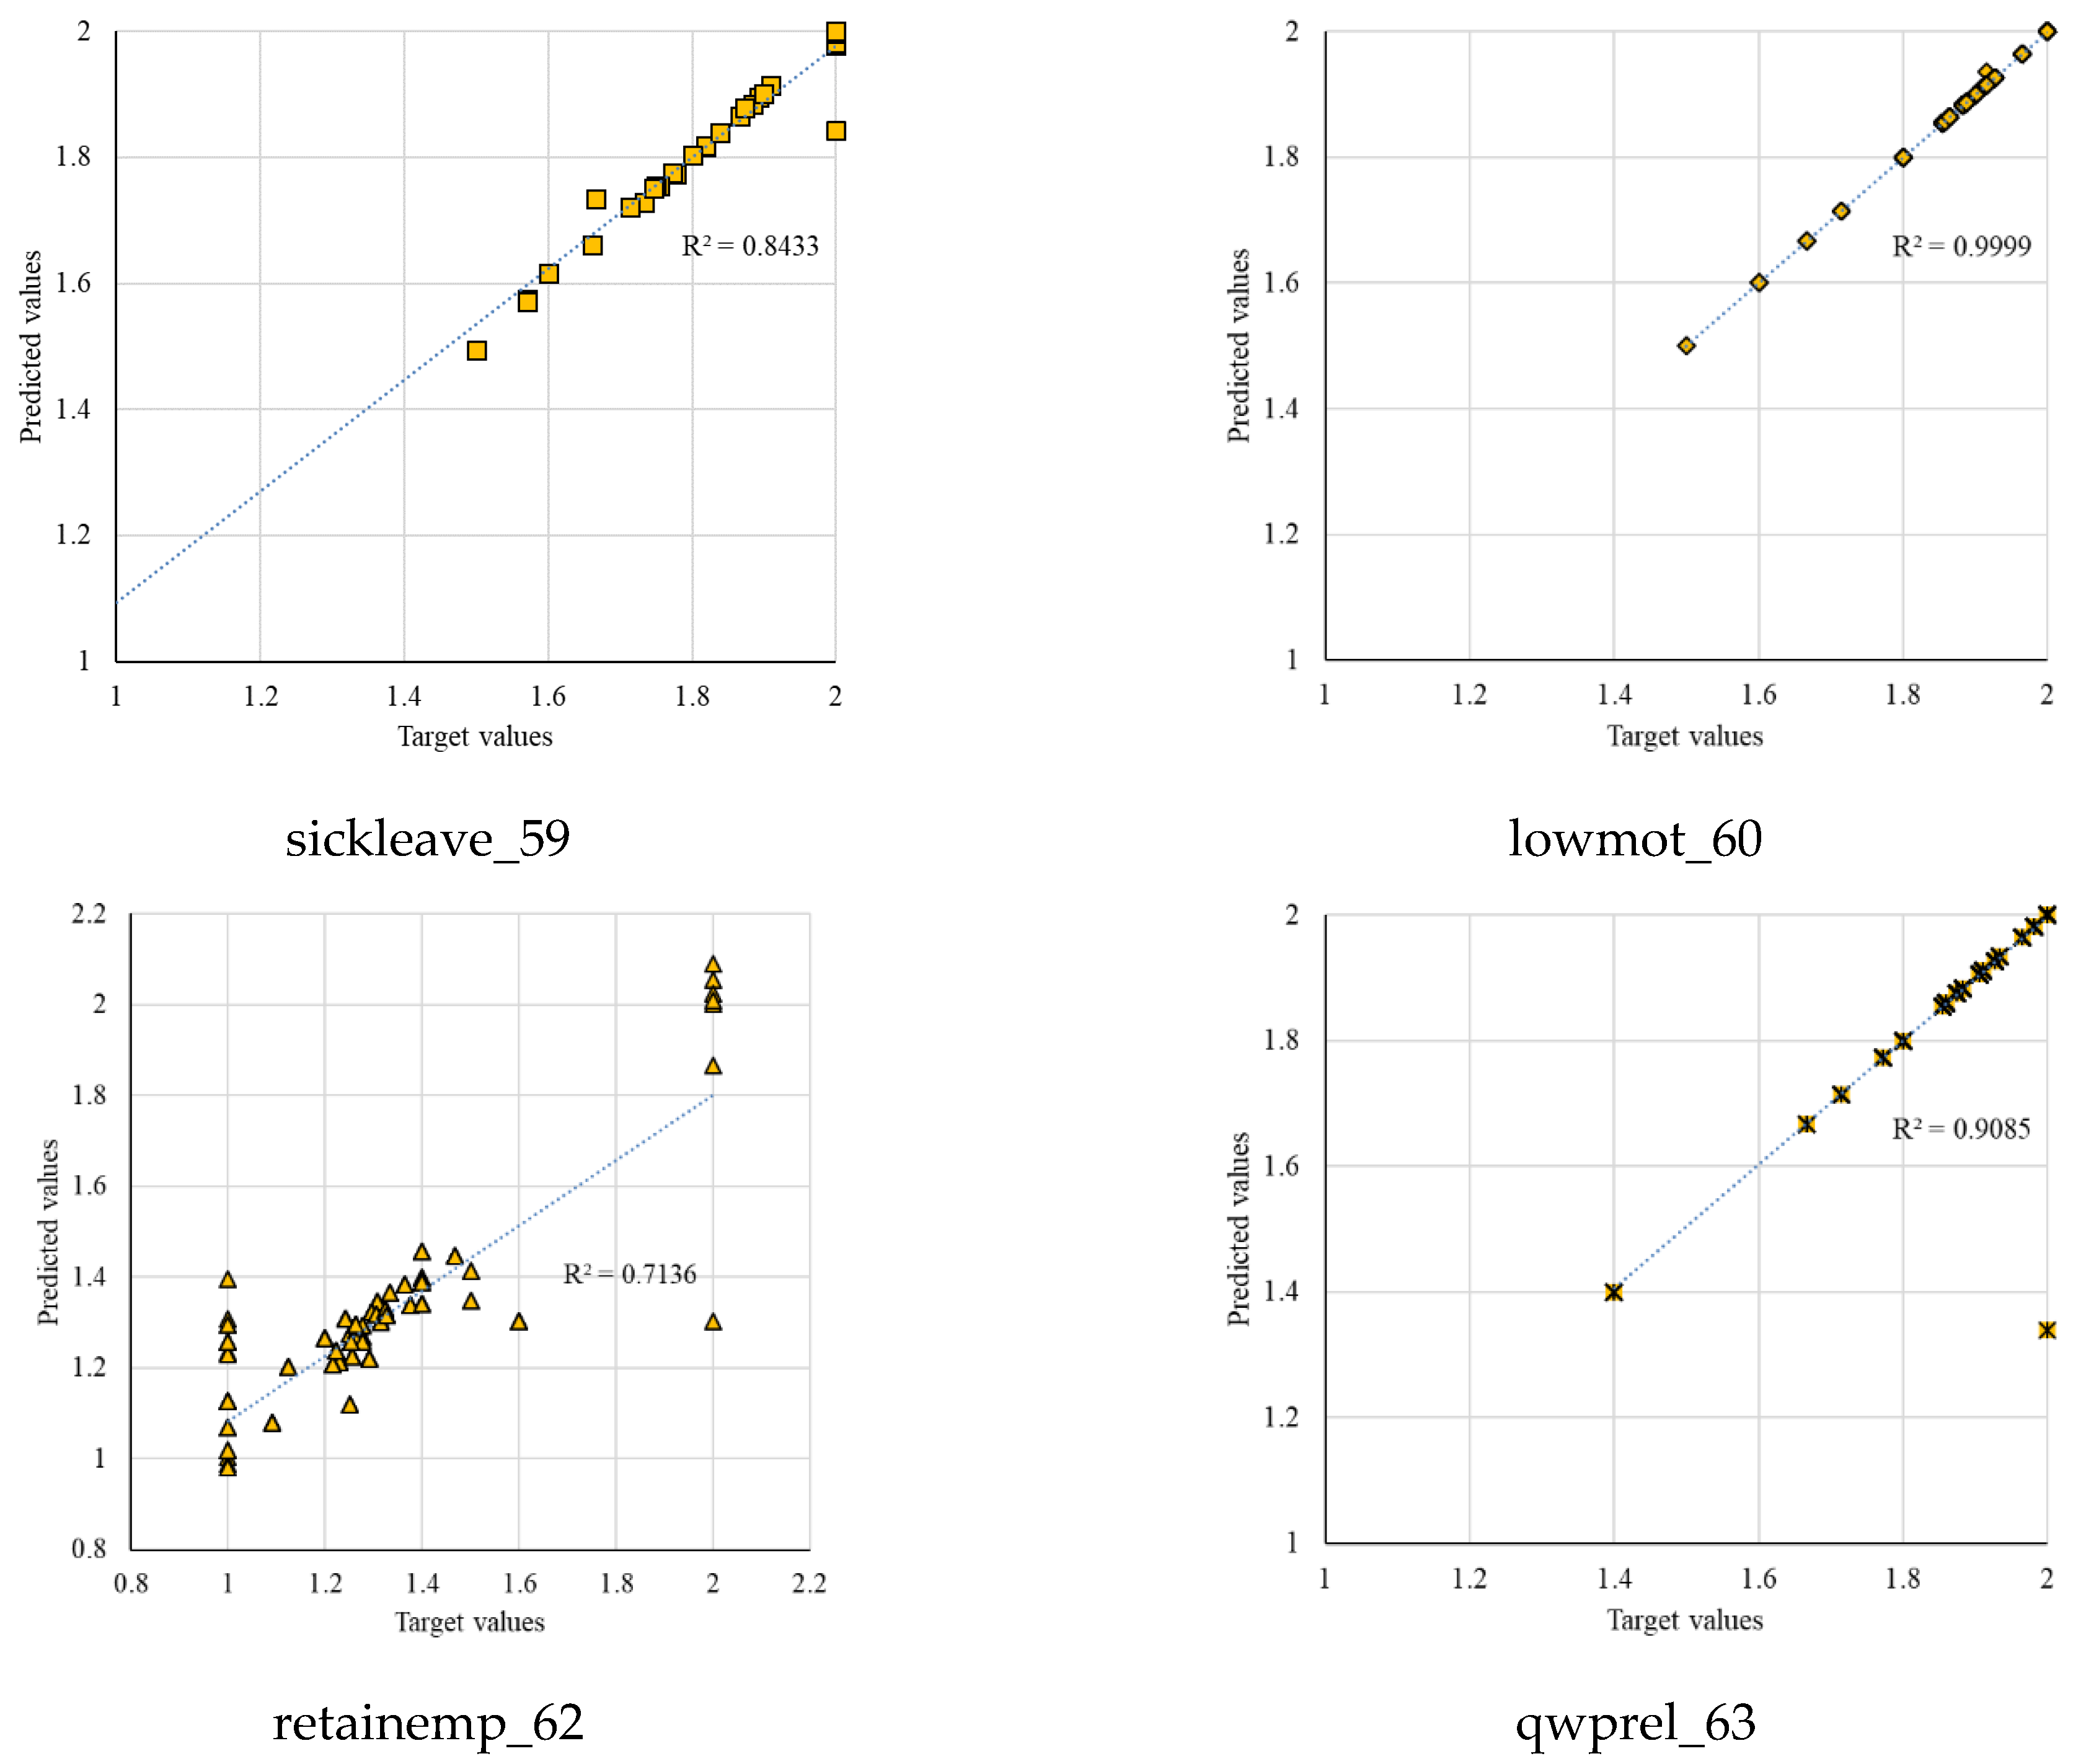
| Skills Requirements and Skill Matches | Prodvol_68 | Profit_69 | Profplan_70 | Chempfut_71 | Average |
|---|---|---|---|---|---|
| MAPE | 0.0084 | 0.7622 | 0.0000 | 0.0293 | 0.2000 |
| MSE | 0.0001 | 0.0010 | 0.0001 | 0.0001 | 0.0002 |
| RMSE | 0.0004 | 0.0310 | 0.0001 | 0.0038 | 0.0088 |
| R | 0.9996 | 0.9426 | 0.9997 | 0.9992 | 0.9854 |
| R2 | 0.9999 | 0.8885 | 0.9999 | 0.9983 | 0.9717 |
| Skills Requirements and Skill Matches | Sickleave_59 | Lowmot_60 | Retainemp_62 | Qwprel_63 | Average |
|---|---|---|---|---|---|
| MAPE | 0.3338 | 0.0002 | 0.4586 | 0.0330 | 0.2064 |
| MSE | 0.0012 | 0.0001 | 0.0023 | 0.0004 | 0.0010 |
| RMSE | 0.0351 | 0.0001 | 0.0482 | 0.0209 | 0.0260 |
| R | 0.9183 | 0.9996 | 0.7196 | 0.9531 | 0.8978 |
| R2 | 0.8433 | 0.9999 | 0.5178 | 0.9085 | 0.8174 |
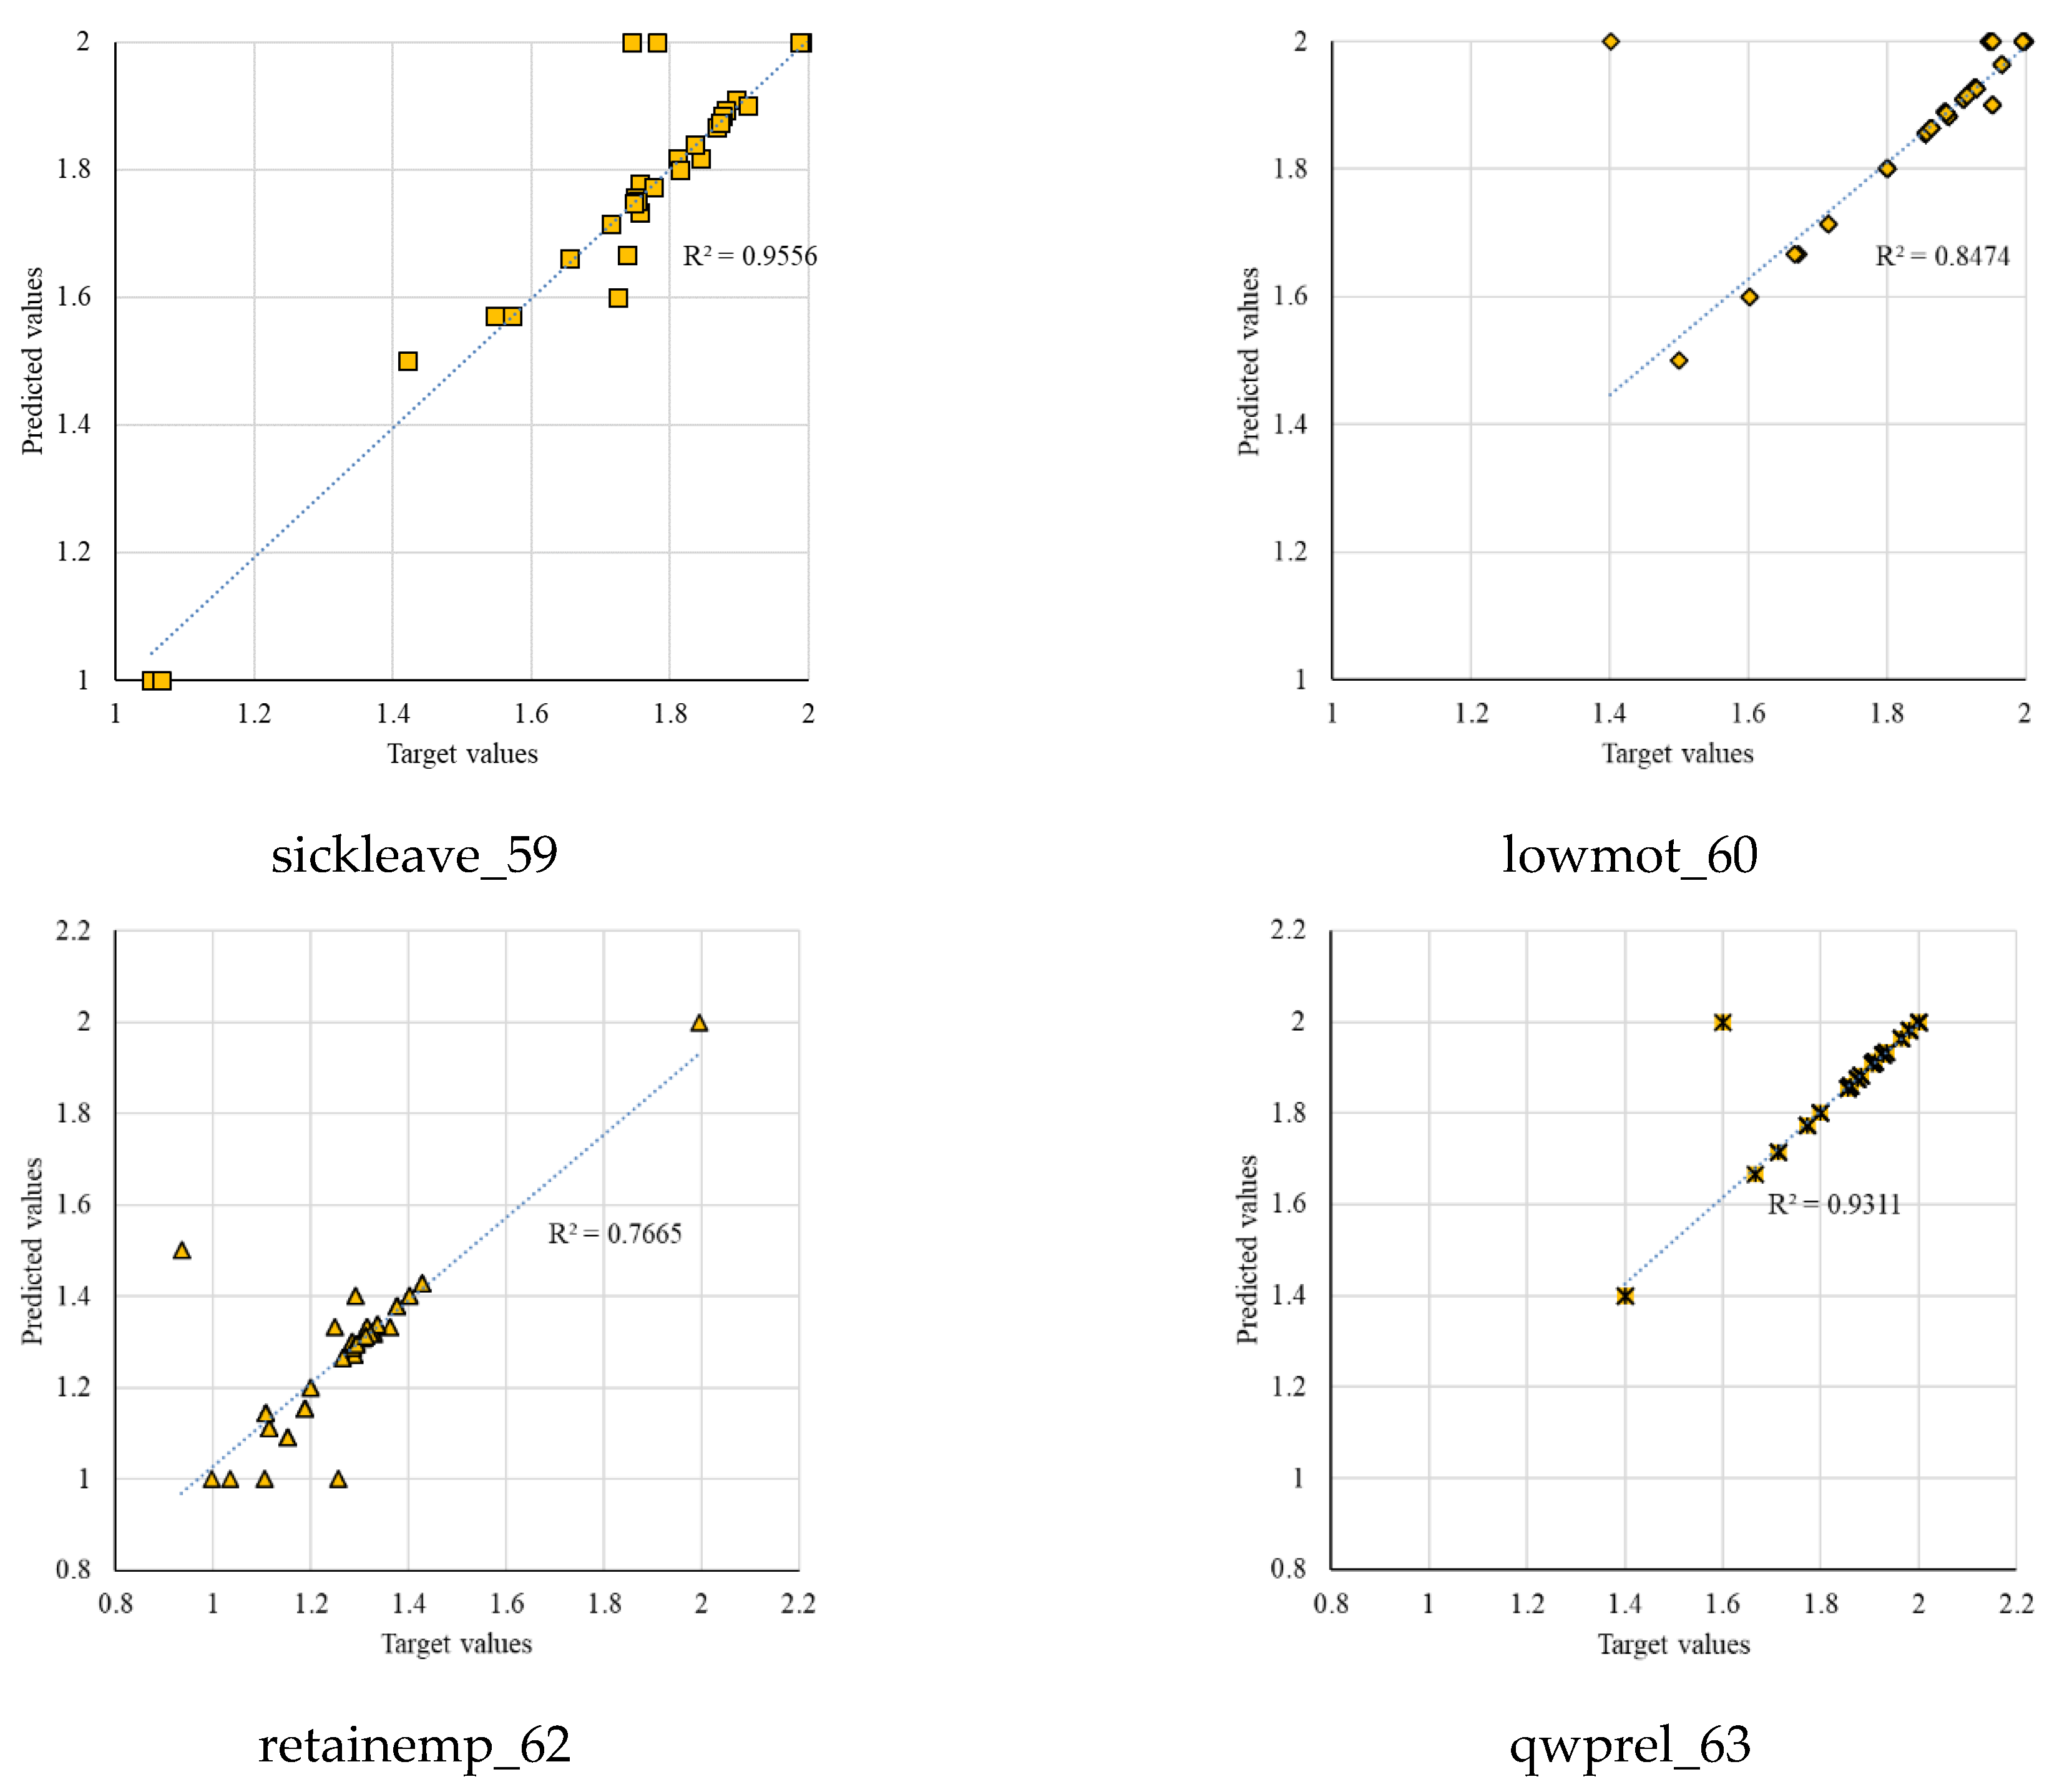
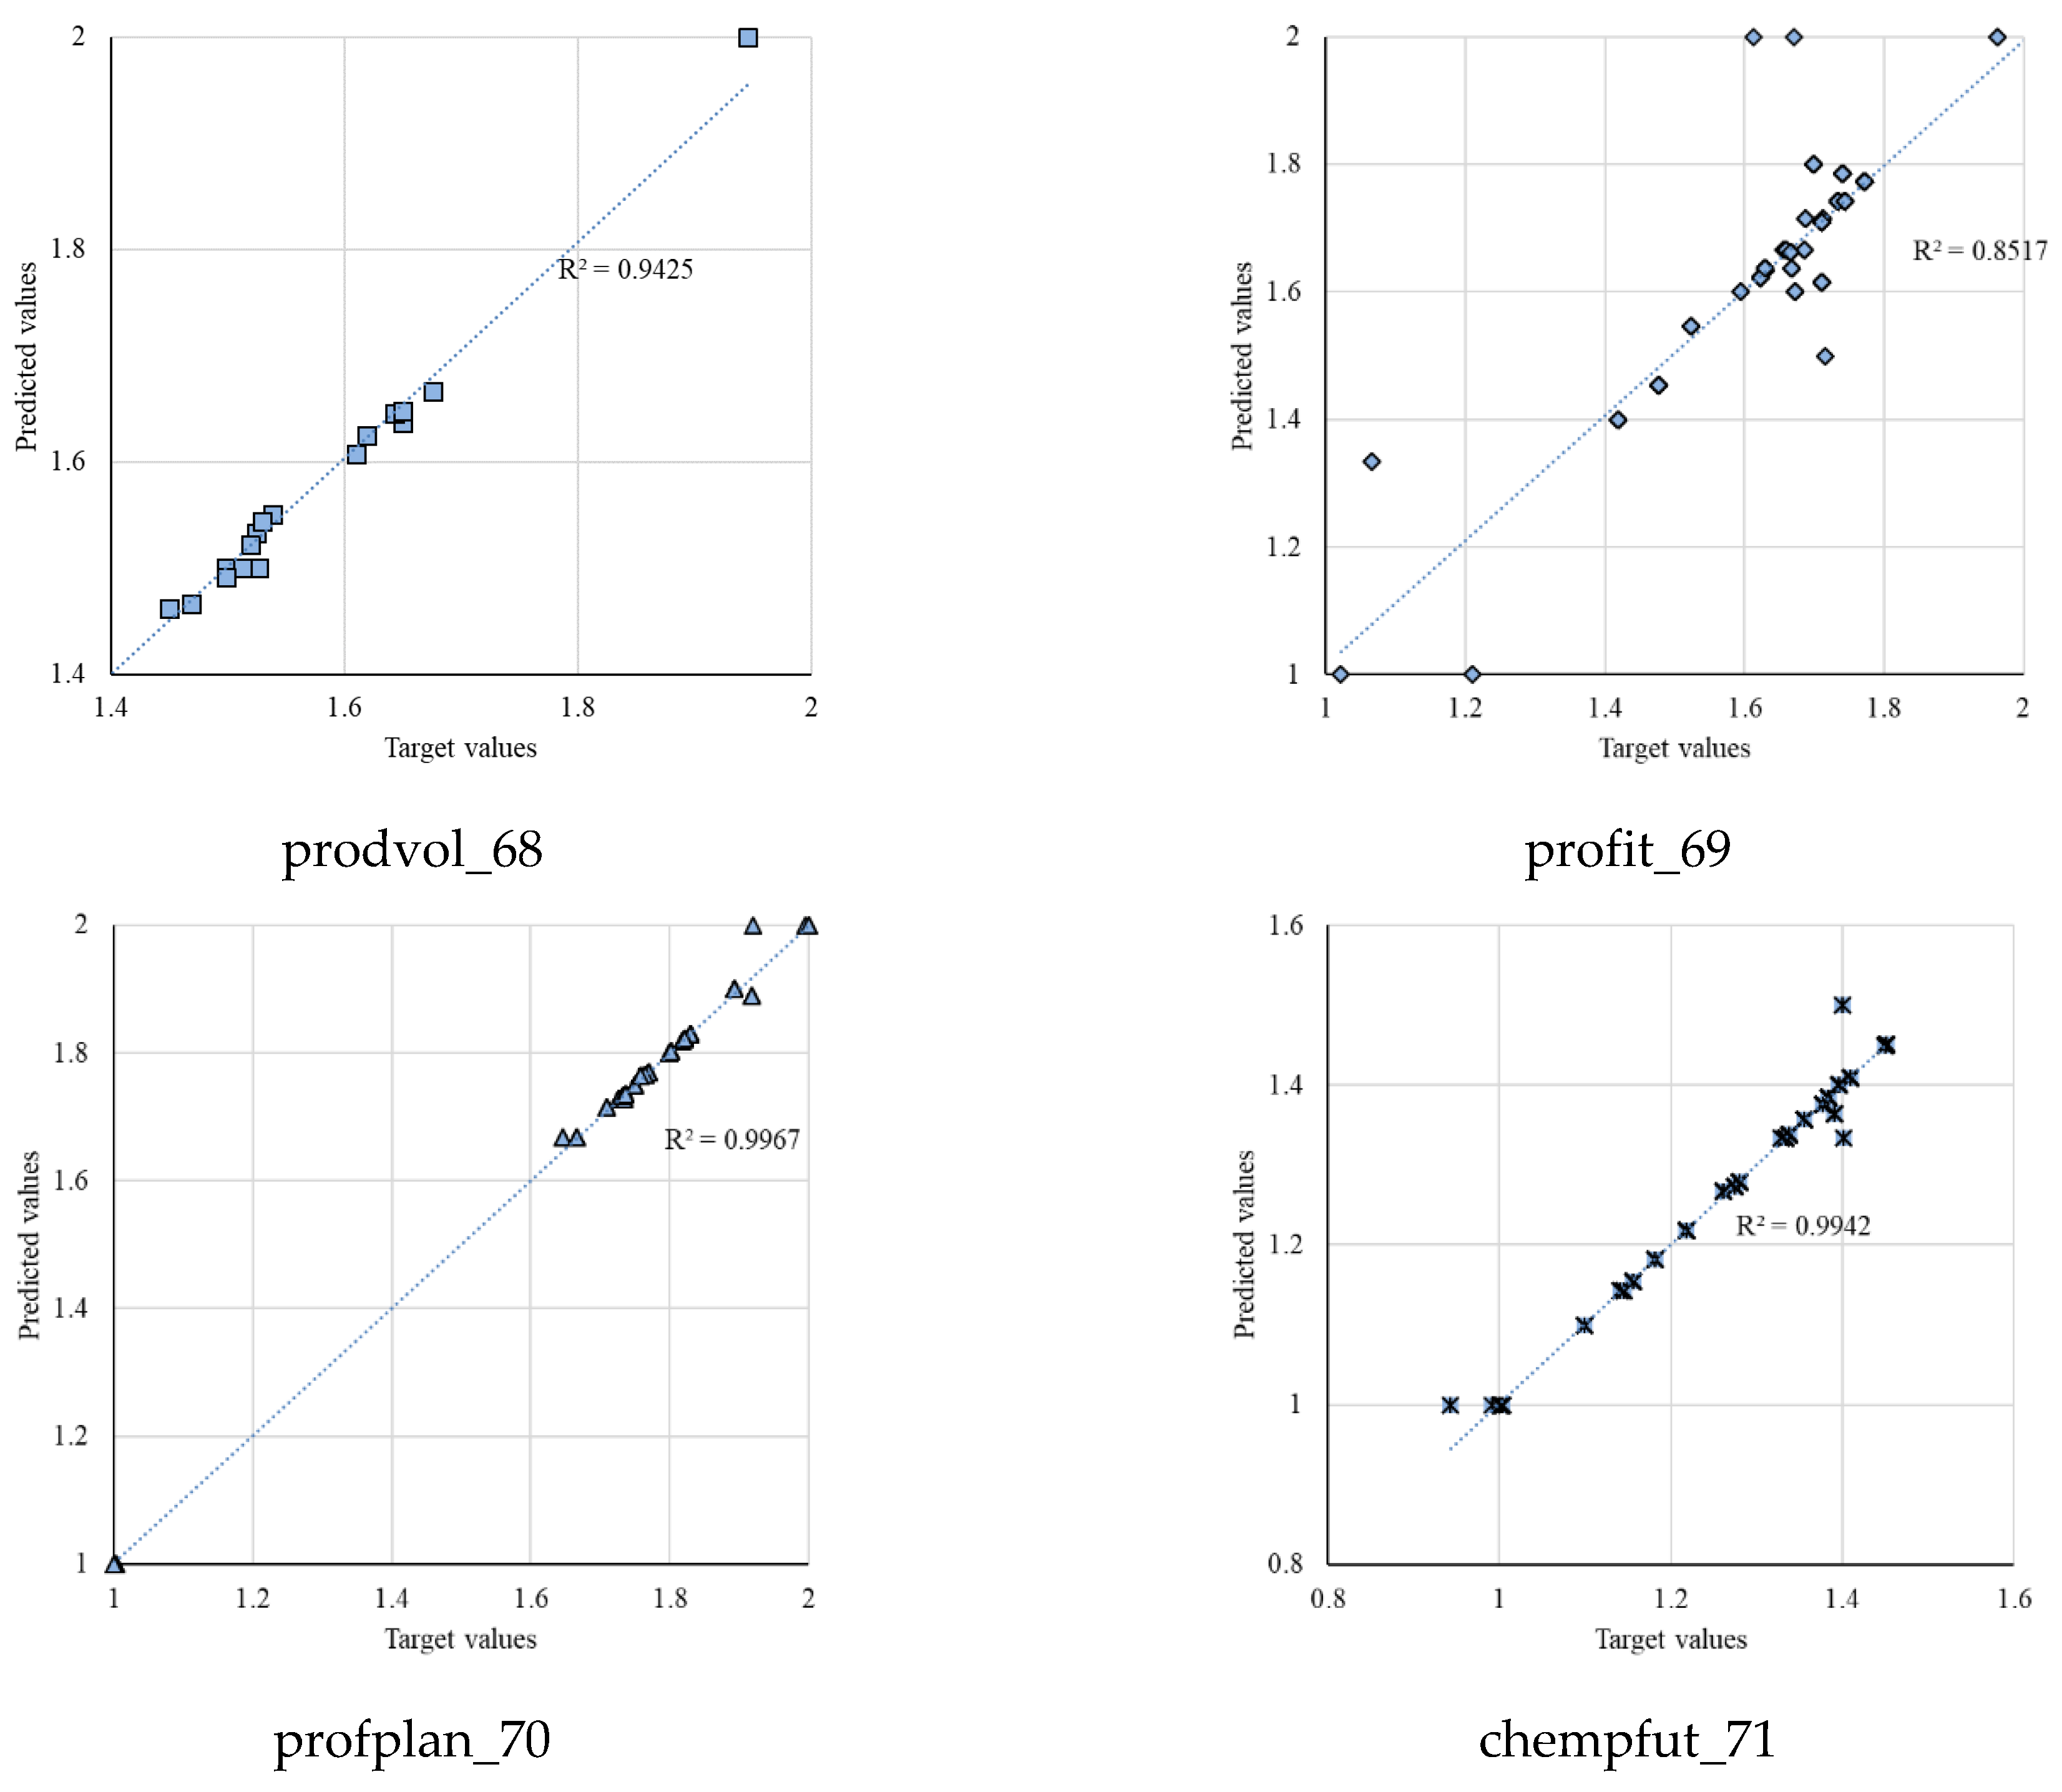
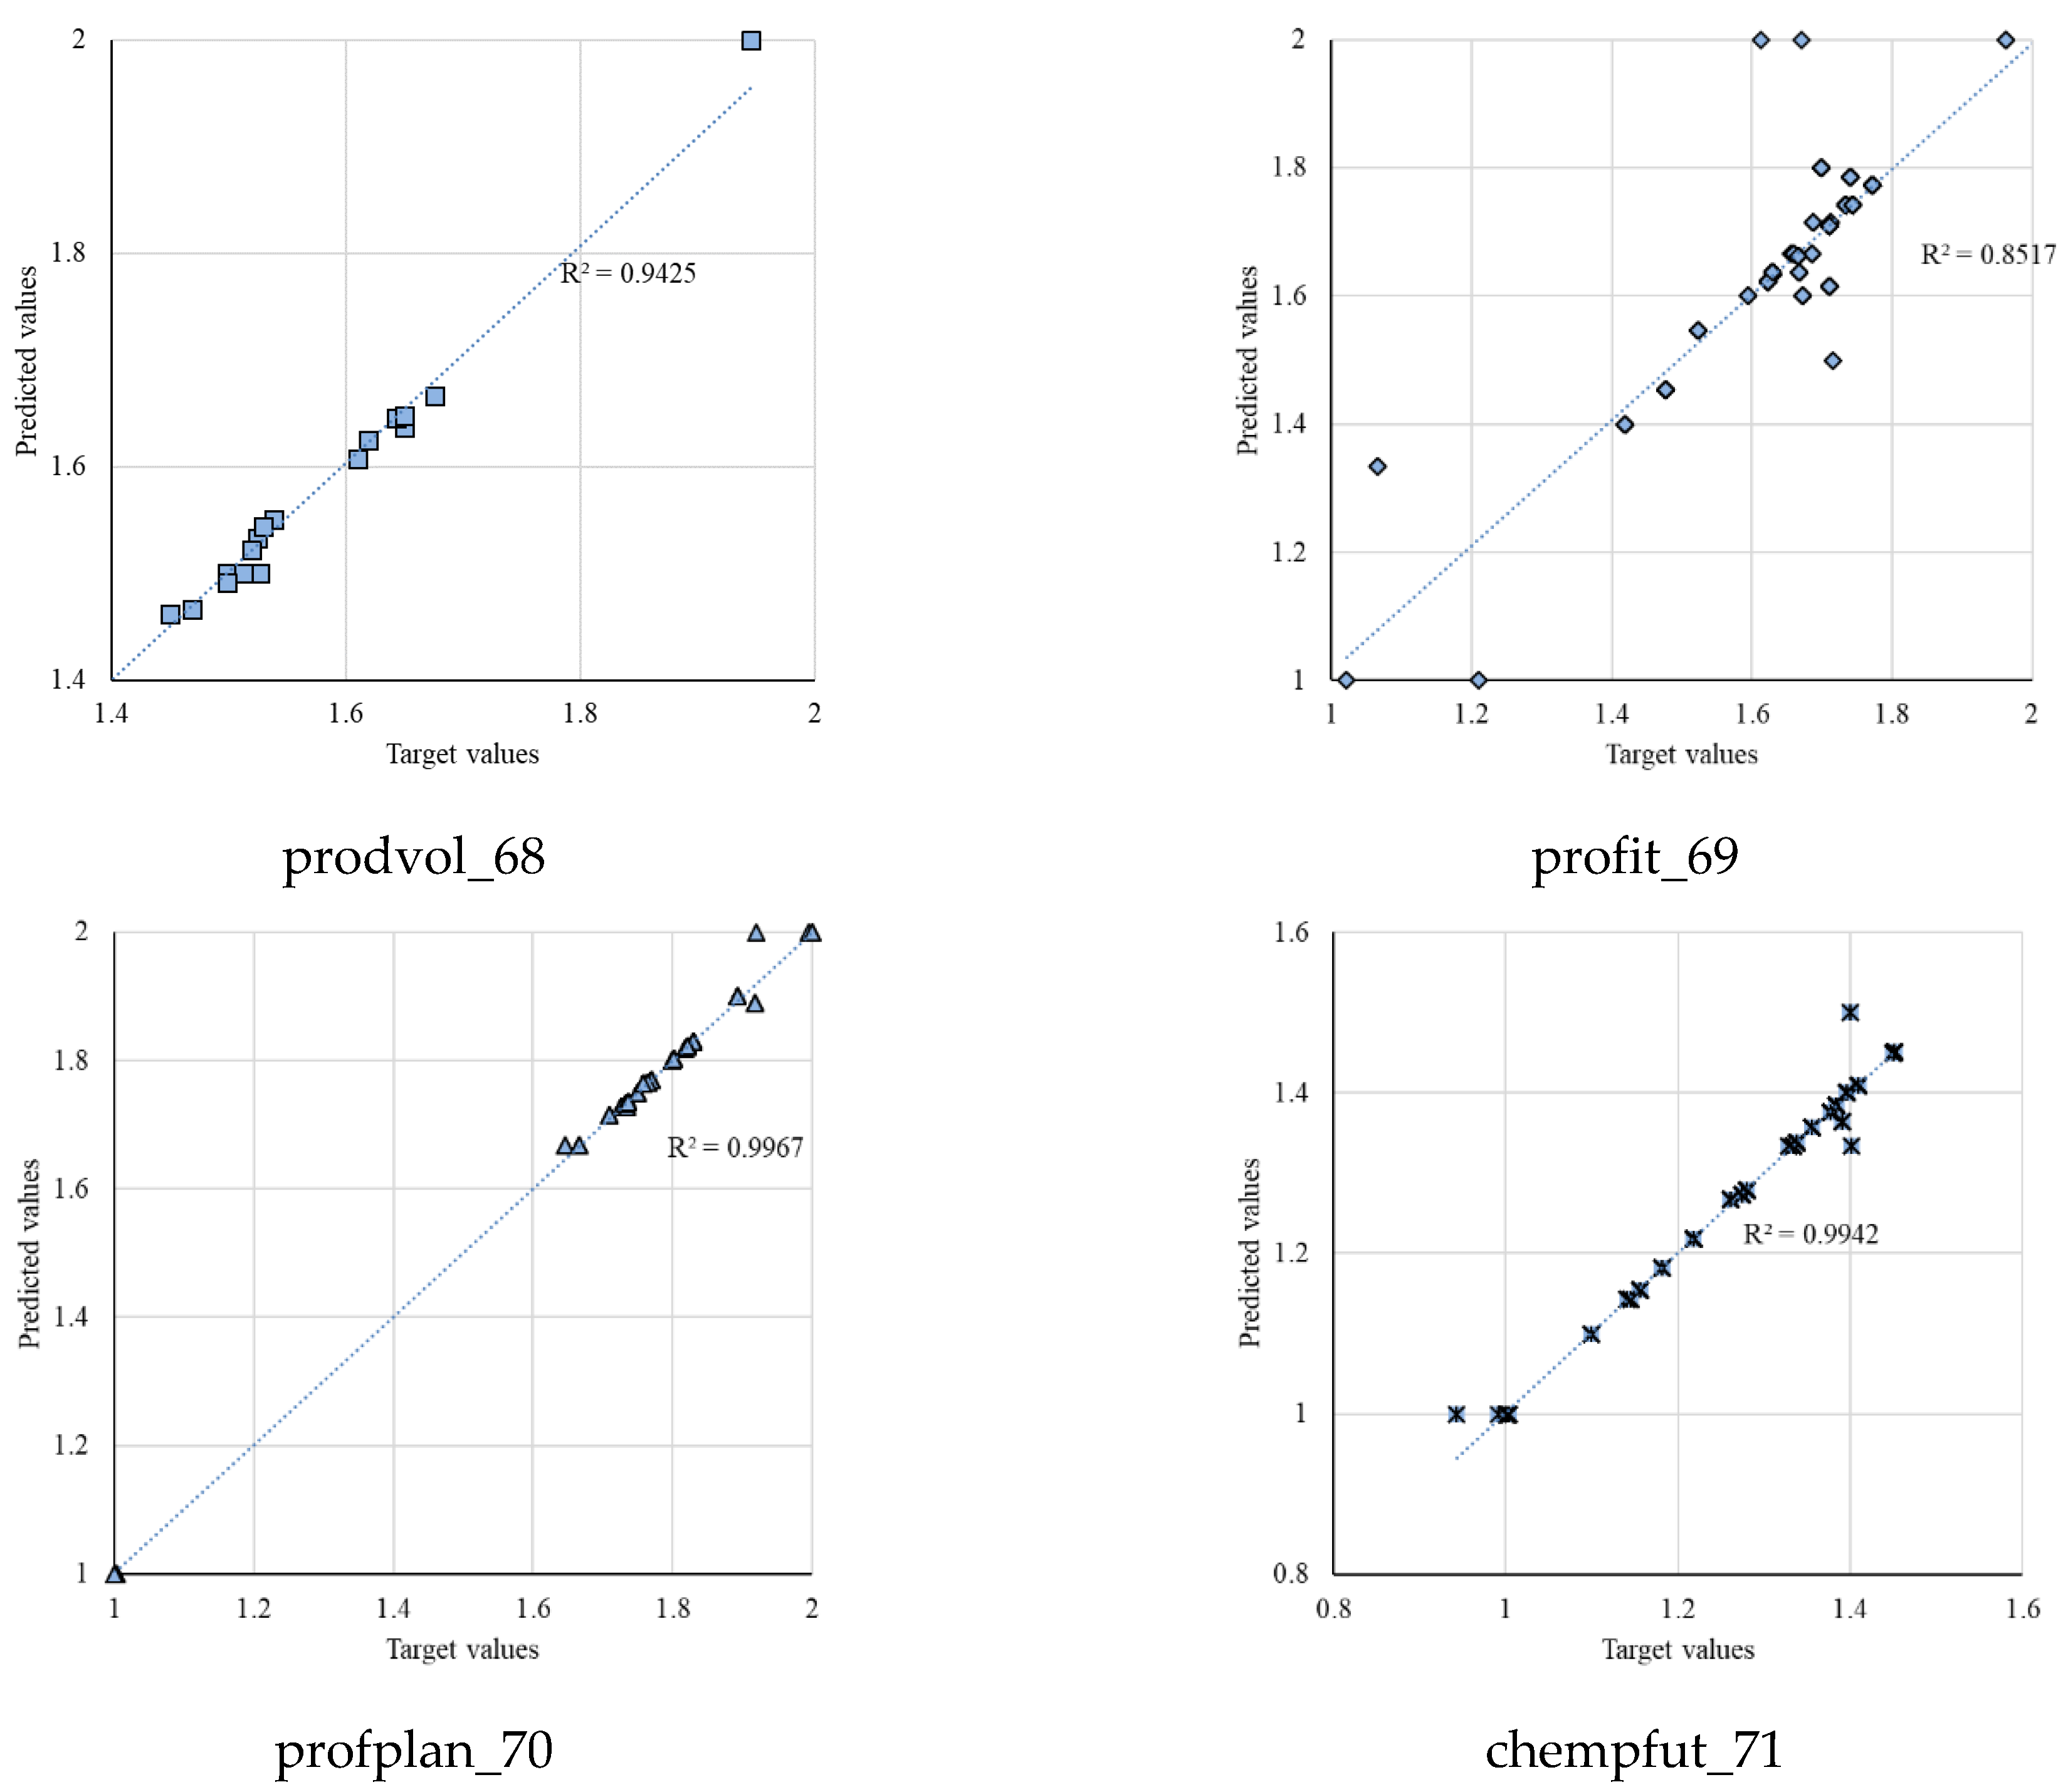
| Employee Voice | Prodvol_68 | Profit_69 | Profplan_70 | Chempfut_71 | Average |
|---|---|---|---|---|---|
| MAPE | 0.5149 | 0.8209 | 0.0990 | 0.1306 | 0.3914 |
| MSE | 0.0008 | 0.0013 | 0.0000 | 0.0001 | 0.0005 |
| RMSE | 0.0284 | 0.0356 | 0.0046 | 0.0071 | 0.0189 |
| R | 0.9708 | 0.9229 | 0.9983 | 0.9971 | 0.9723 |
| R2 | 0.9425 | 0.8517 | 0.9967 | 0.9942 | 0.9462 |
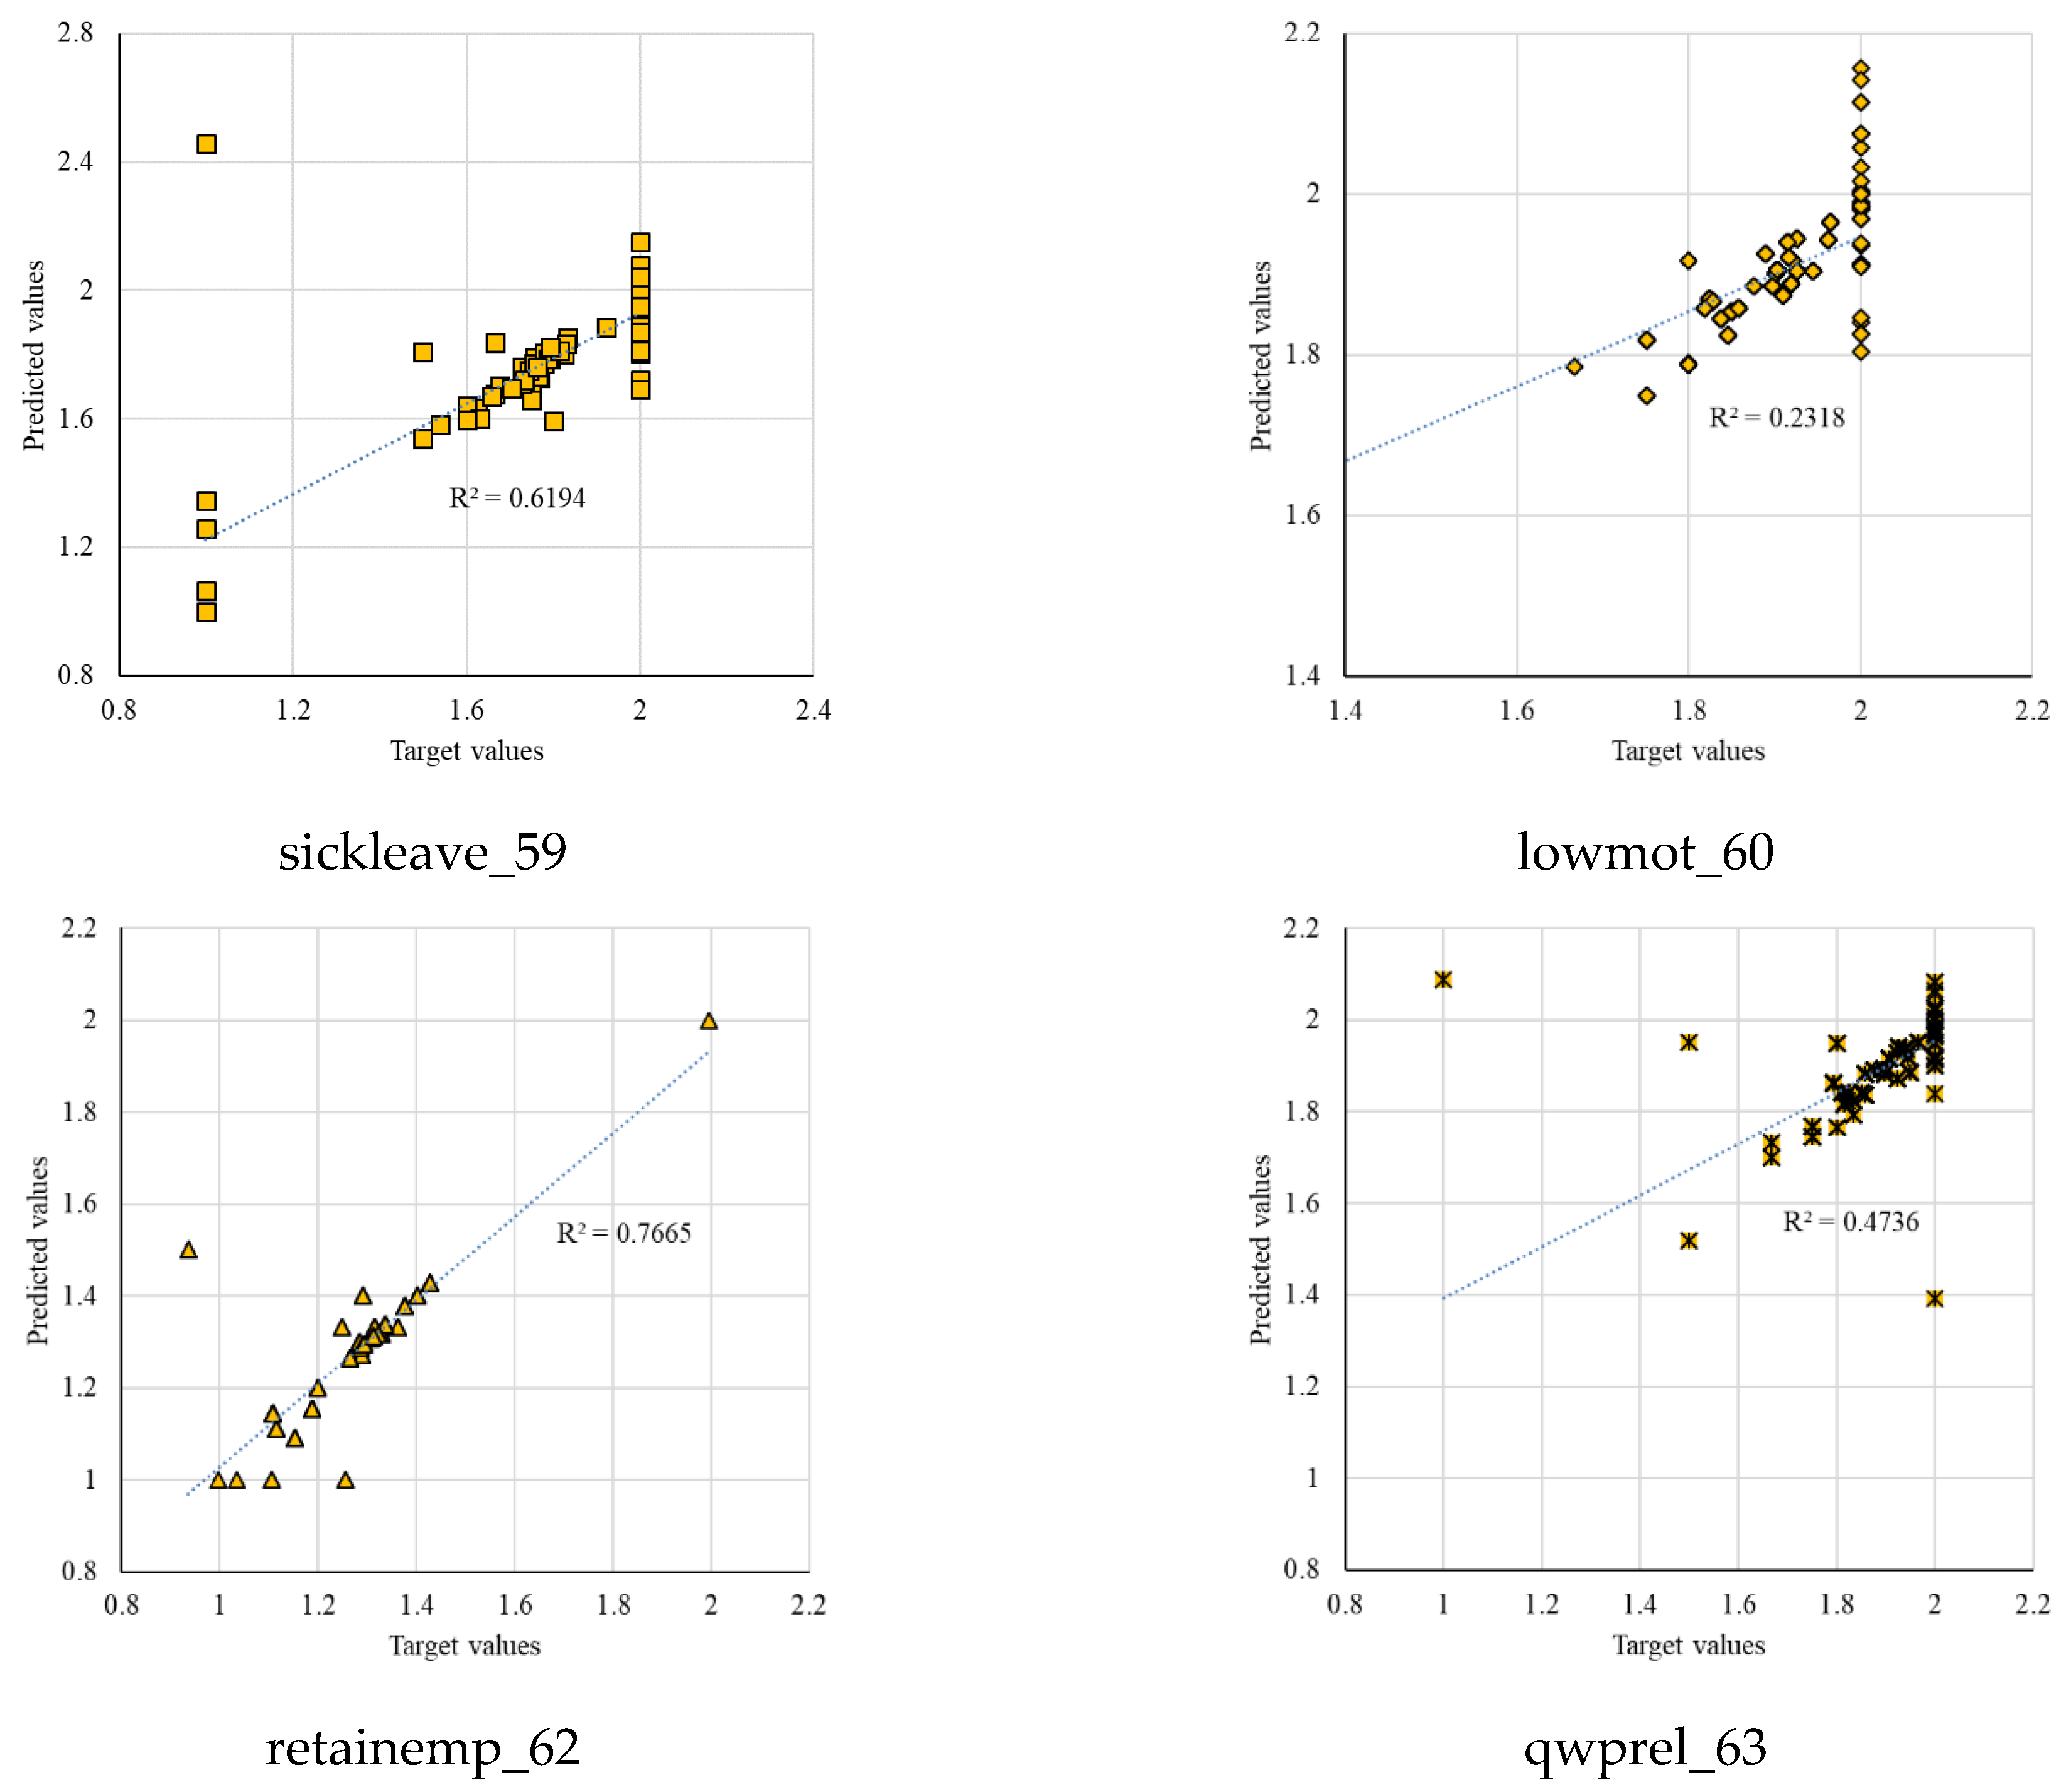
| Employee Voice | Sickleave_59 | Lowmot_60 | Retainemp_62 | Qwprel_63 | Average |
|---|---|---|---|---|---|
| MAPE | 0.3384 | 0.2290 | 0.6067 | 0.0500 | 0.3060 |
| MSE | 0.0003 | 0.0005 | 0.0010 | 0.0003 | 0.0005 |
| RMSE | 0.0185 | 0.0219 | 0.0316 | 0.0179 | 0.0225 |
| R | 0.9775 | 0.9205 | 0.8755 | 0.9649 | 0.9346 |
| R2 | 0.9556 | 0.8474 | 0.7665 | 0.9311 | 0.8752 |
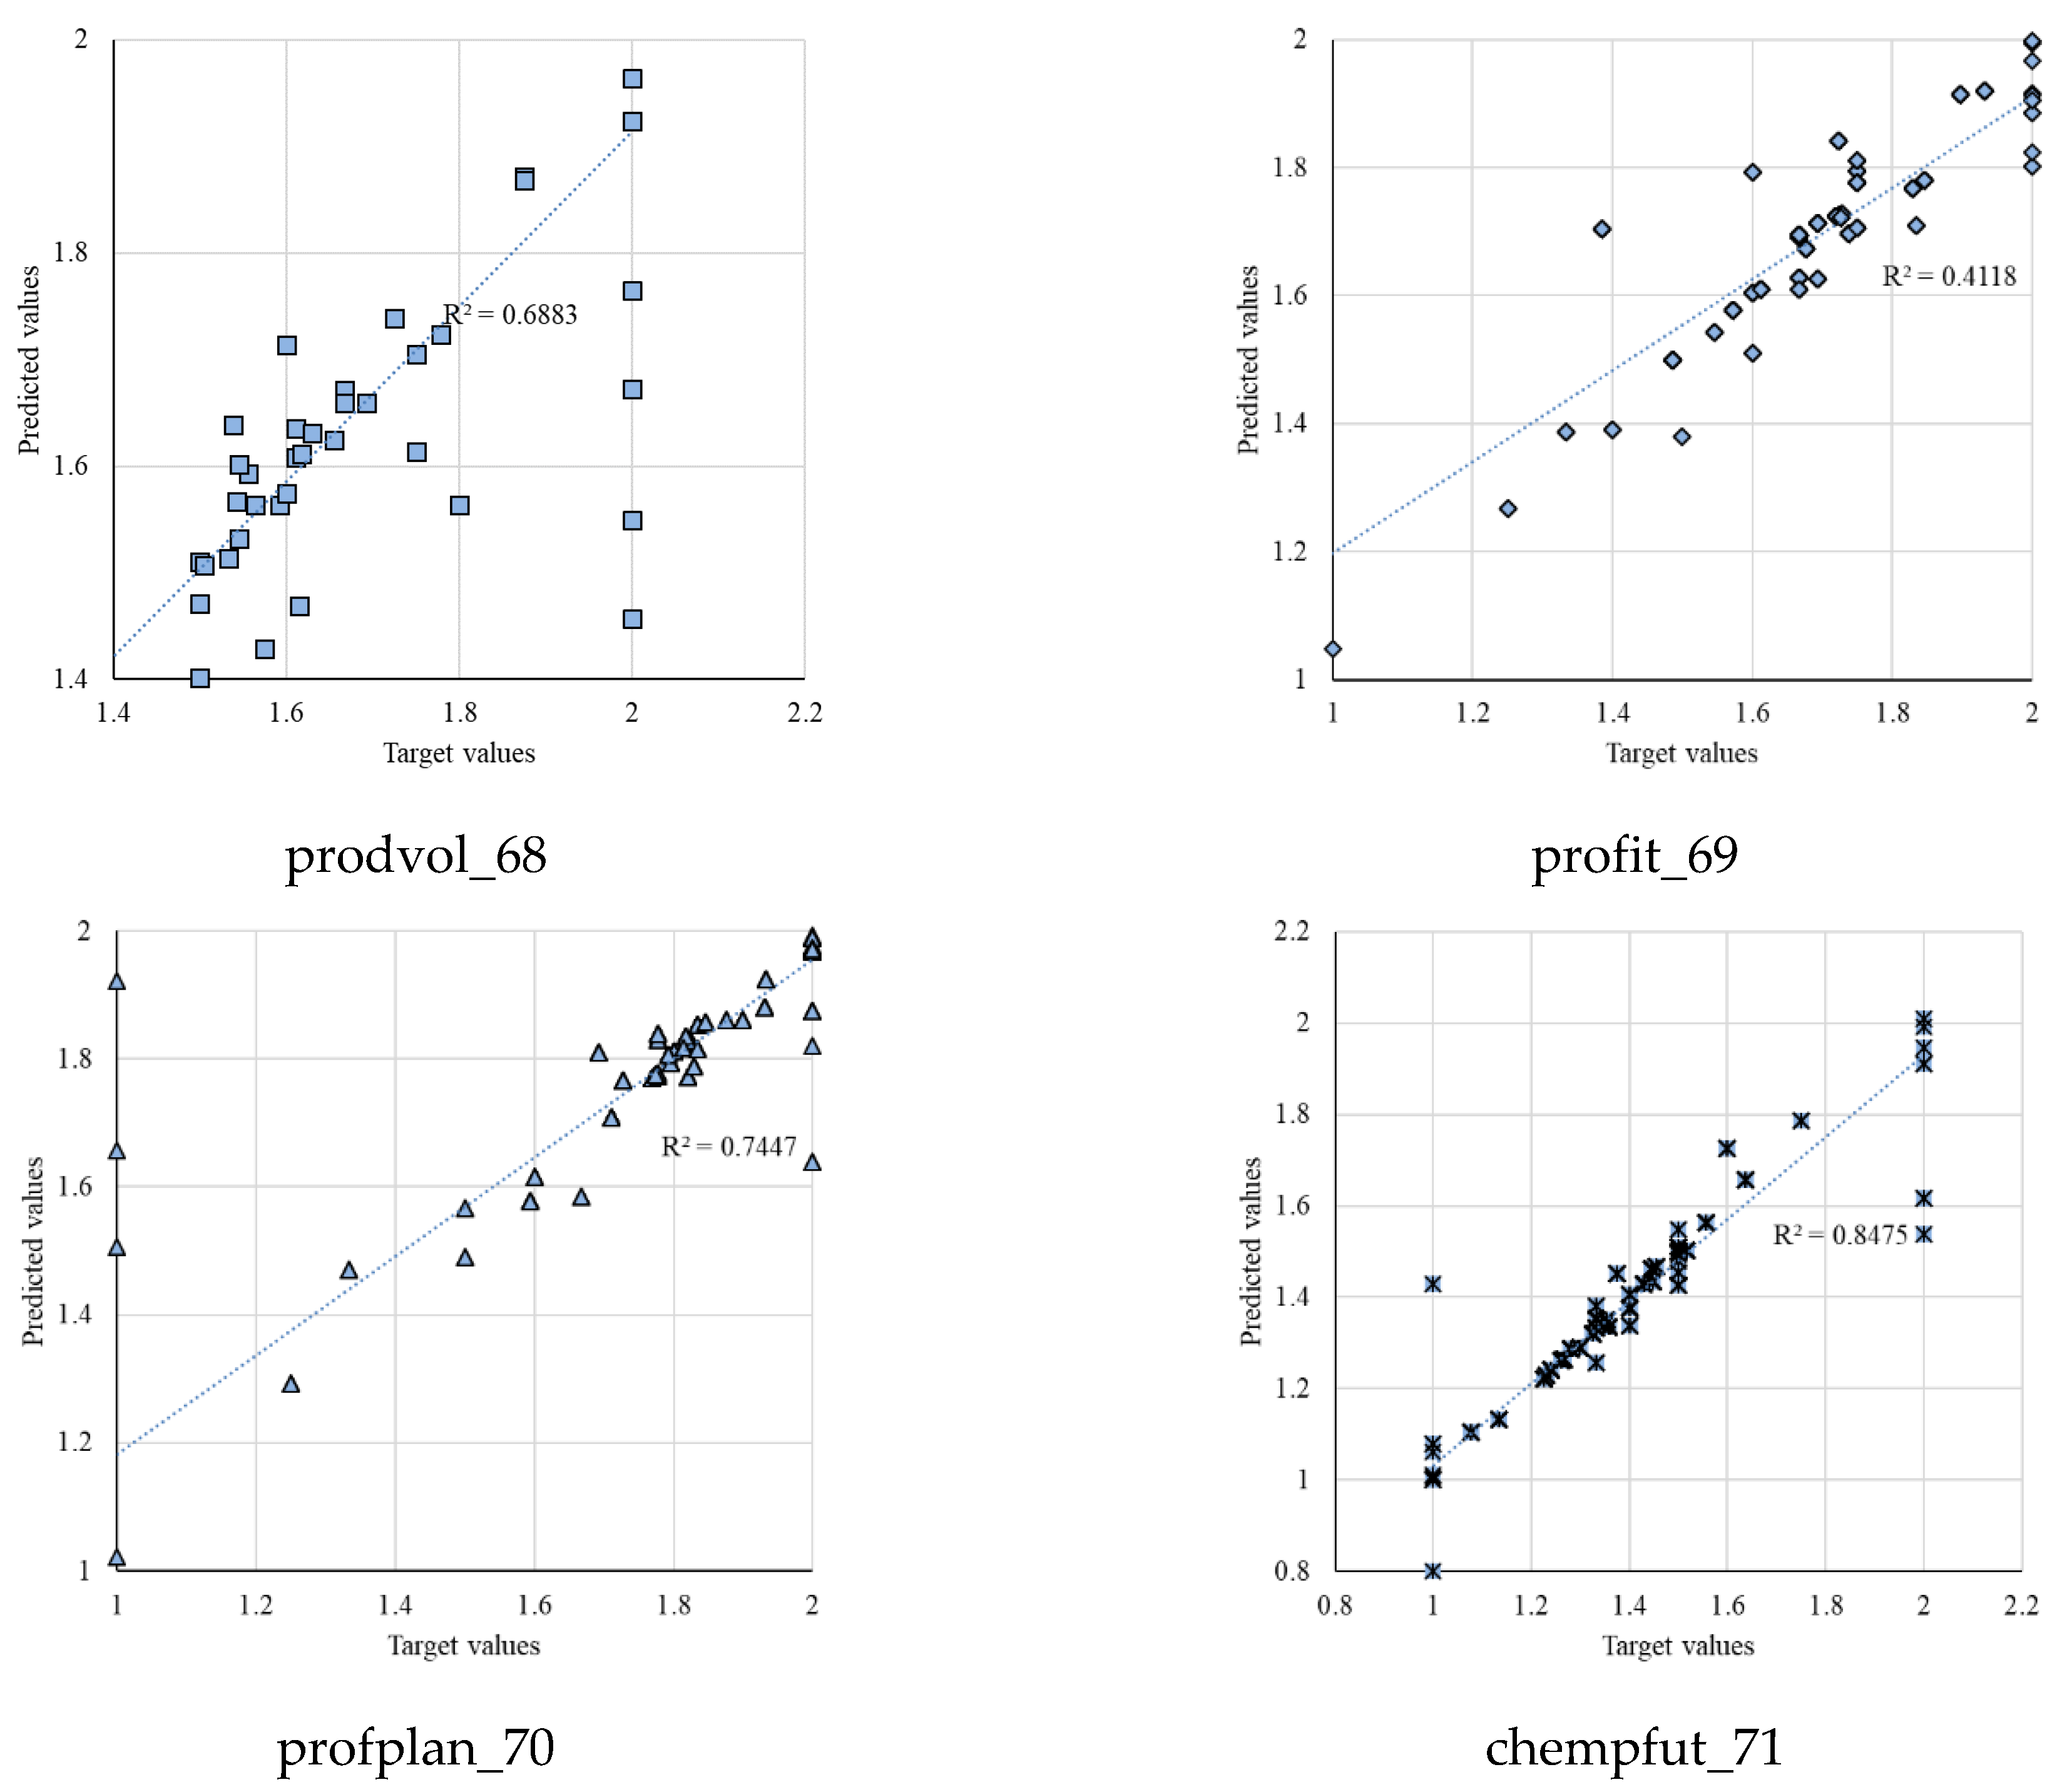
| External Environment | Prodvol_68 | Profit_69 | Profplan_70 | Chempfut_71 | Average |
|---|---|---|---|---|---|
| MAPE | 2.5194 | 1.9298 | 1.4228 | 0.9581 | 1.7075 |
| MSE | 0.0081 | 0.0130 | 0.0031 | 0.0027 | 0.0067 |
| RMSE | 0.0898 | 0.1139 | 0.0560 | 0.0516 | 0.0778 |
| R | 0.8296 | 0.6417 | 0.8629 | 0.9206 | 0.8137 |
| R2 | 0.6883 | 0.4118 | 0.7447 | 0.8475 | 0.6731 |
| External Environment | Sickleave_59 | Lowmot_60 | Retainemp_62 | Qwprel_63 | Average |
|---|---|---|---|---|---|
| MAPE | 1.268 | 1.142 | 2.074 | 1.141 | 1.4062 |
| MSE | 0.004 | 0.004 | 0.003 | 0.003 | 0.0033 |
| RMSE | 0.061 | 0.061 | 0.052 | 0.053 | 0.0569 |
| R | 0.787 | 0.481 | 0.845 | 0.688 | 0.7003 |
| R2 | 0.619 | 0.232 | 0.714 | 0.474 | 0.5096 |
Publisher’s Note: MDPI stays neutral with regard to jurisdictional claims in published maps and institutional affiliations. |
© 2022 by the authors. Licensee MDPI, Basel, Switzerland. This article is an open access article distributed under the terms and conditions of the Creative Commons Attribution (CC BY) license (https://creativecommons.org/licenses/by/4.0/).
Share and Cite
Pap, J.; Mako, C.; Illessy, M.; Dedaj, Z.; Ardabili, S.; Torok, B.; Mosavi, A. Correlation Analysis of Factors Affecting Firm Performance and Employees Wellbeing: Application of Advanced Machine Learning Analysis. Algorithms 2022, 15, 300. https://doi.org/10.3390/a15090300
Pap J, Mako C, Illessy M, Dedaj Z, Ardabili S, Torok B, Mosavi A. Correlation Analysis of Factors Affecting Firm Performance and Employees Wellbeing: Application of Advanced Machine Learning Analysis. Algorithms. 2022; 15(9):300. https://doi.org/10.3390/a15090300
Chicago/Turabian StylePap, Jozsef, Csaba Mako, Miklos Illessy, Zef Dedaj, Sina Ardabili, Bernat Torok, and Amir Mosavi. 2022. "Correlation Analysis of Factors Affecting Firm Performance and Employees Wellbeing: Application of Advanced Machine Learning Analysis" Algorithms 15, no. 9: 300. https://doi.org/10.3390/a15090300