
A Proposal of Printed Table Digitization Algorithm with Image Processing


 ,
, 
Abstract
:1. Introduction
2. Related Works in the Literature
3. Adopted Technologies
3.1. OpenCV
- Recognize every intersection of the horizontal line and the vertical line to find the location of the cells in the table.
- Divide the table into a collection of rectangles using the intersections.
- Arrange the rectangles from left to right and top to bottom by recognizing the boundary of the horizontal and vertical lines.
- Recognized rectangles sometimes are too large or too small. The rectangle will have multiple cells if it is too large, and it will have none if it is too small. In order to prevent both of these situations, we restrict the rectangle’s size range.
3.2. Tesseract
4. Target Table Layout
4.1. Table Layout
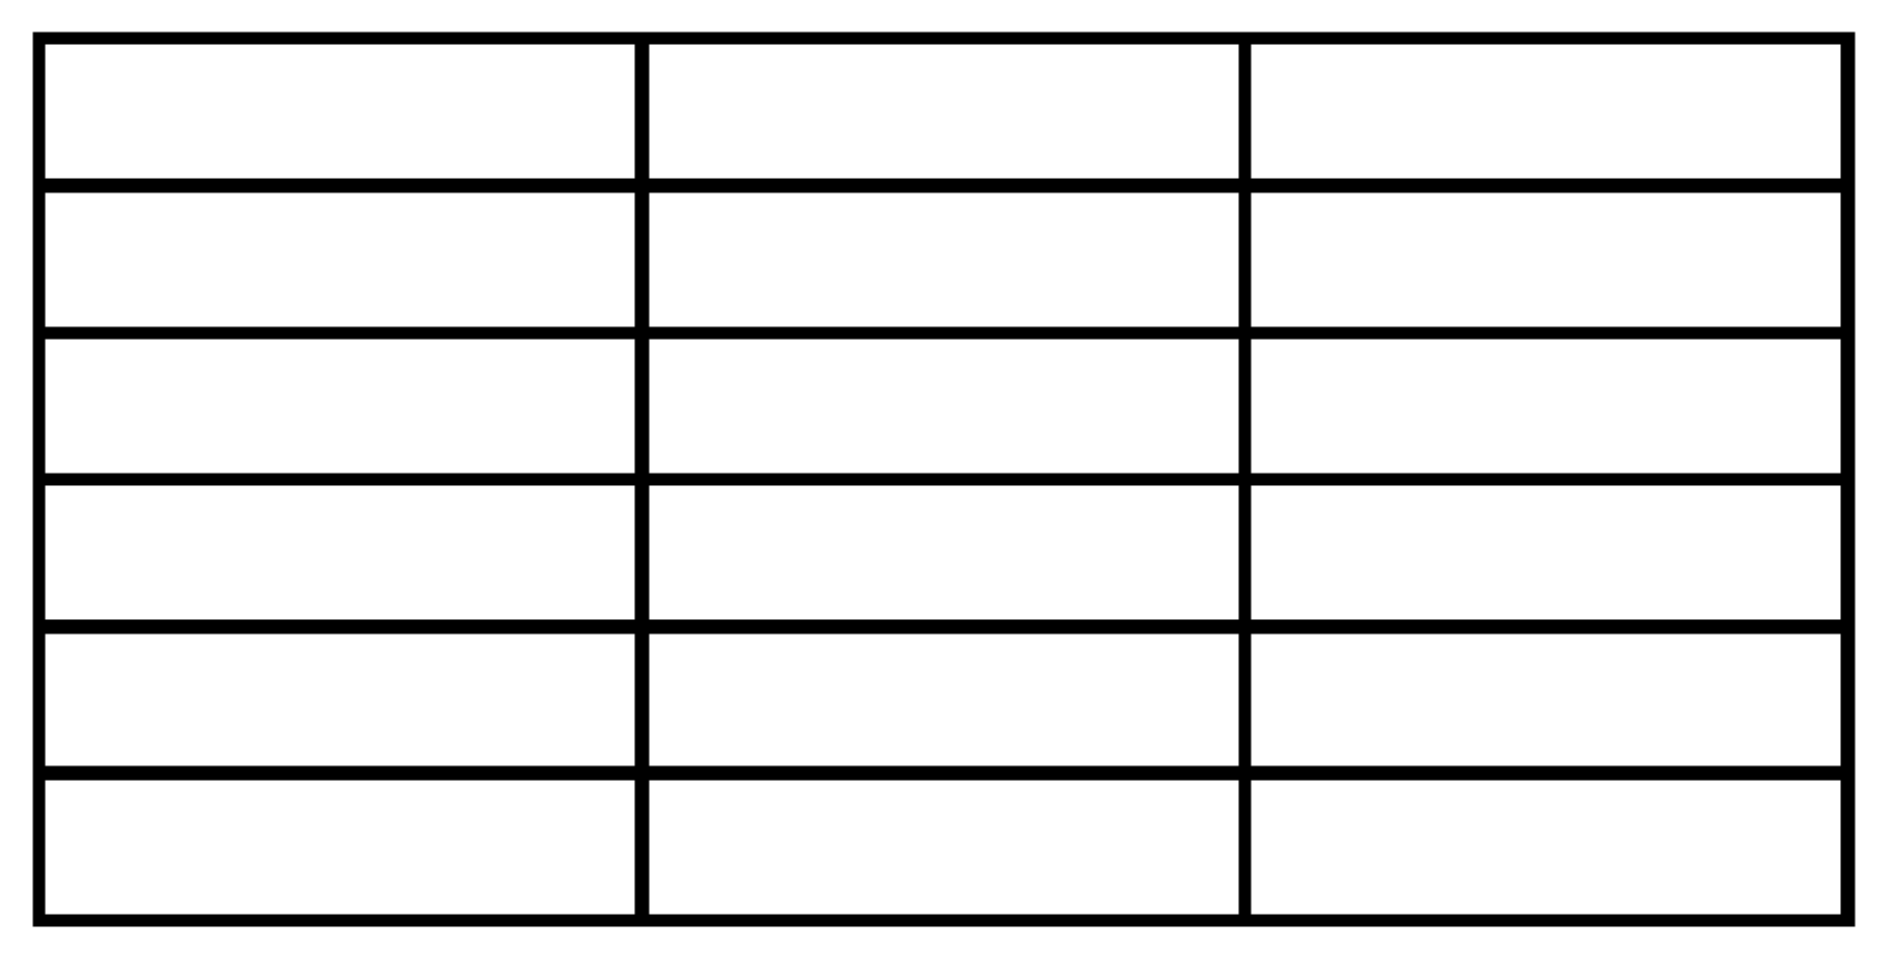
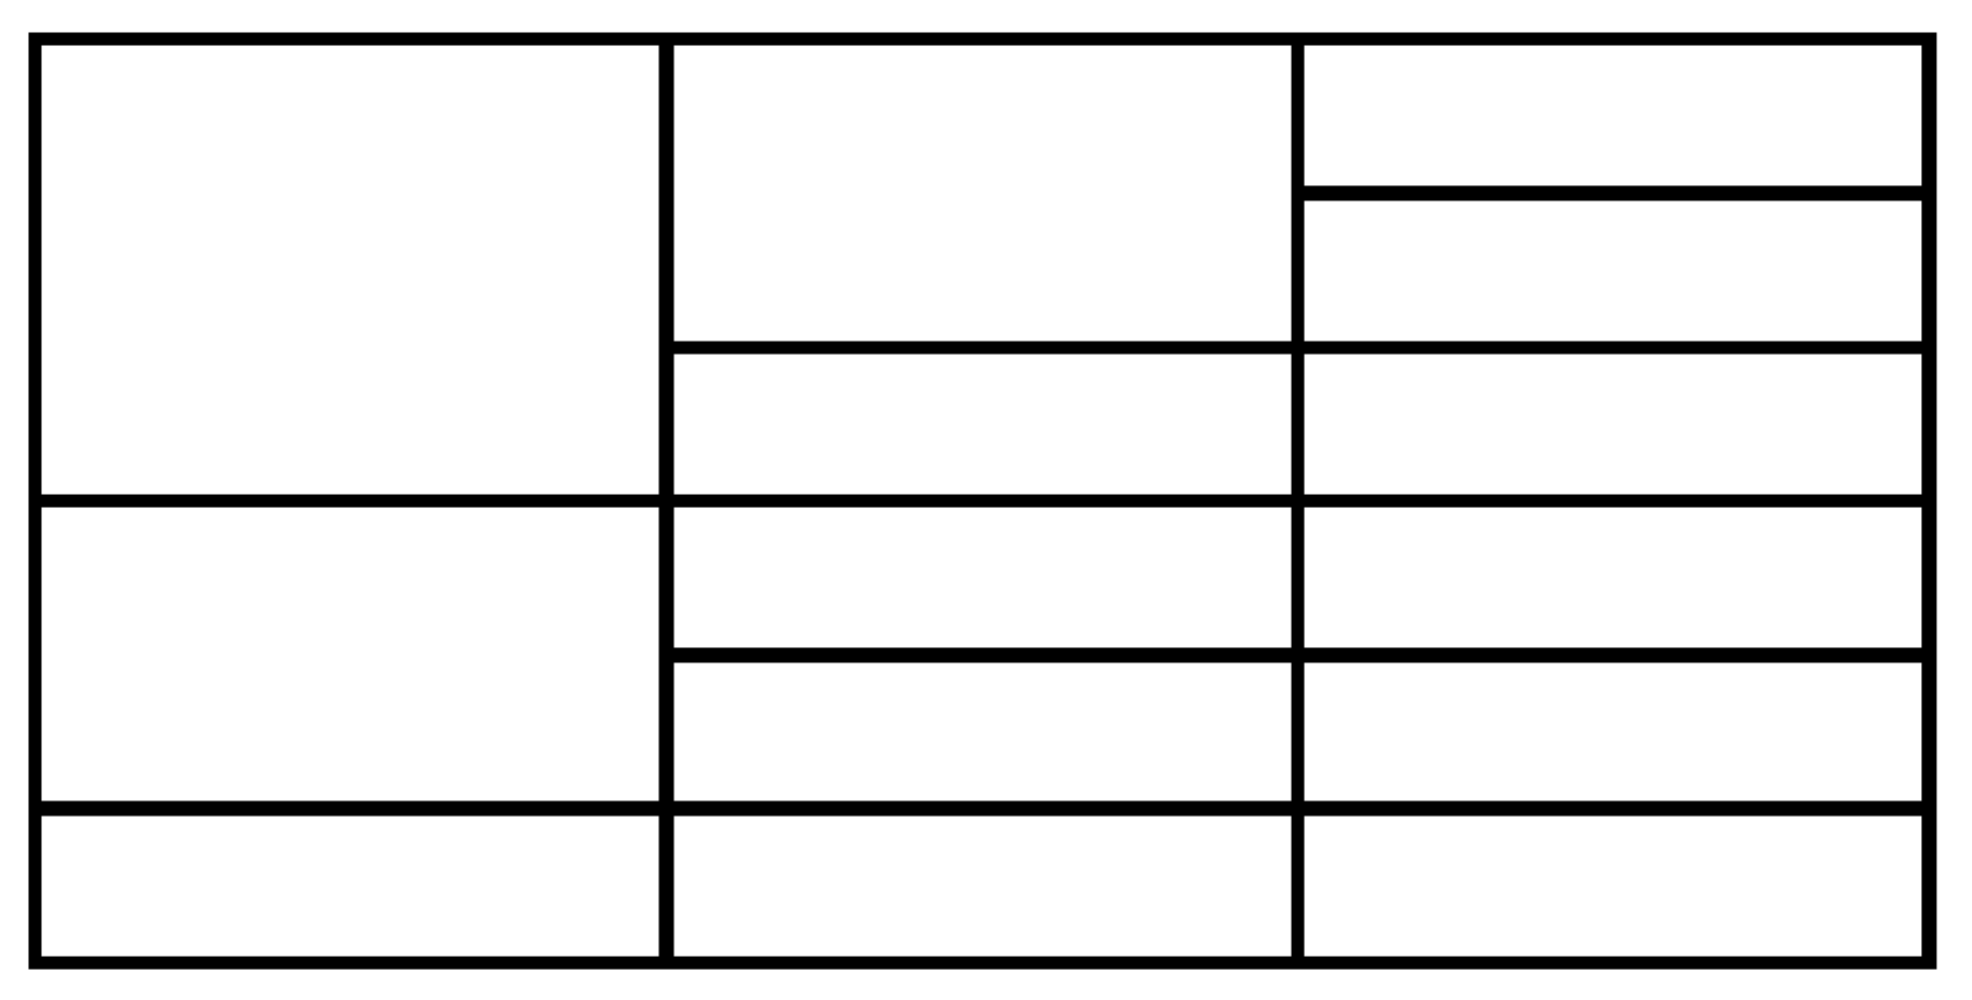
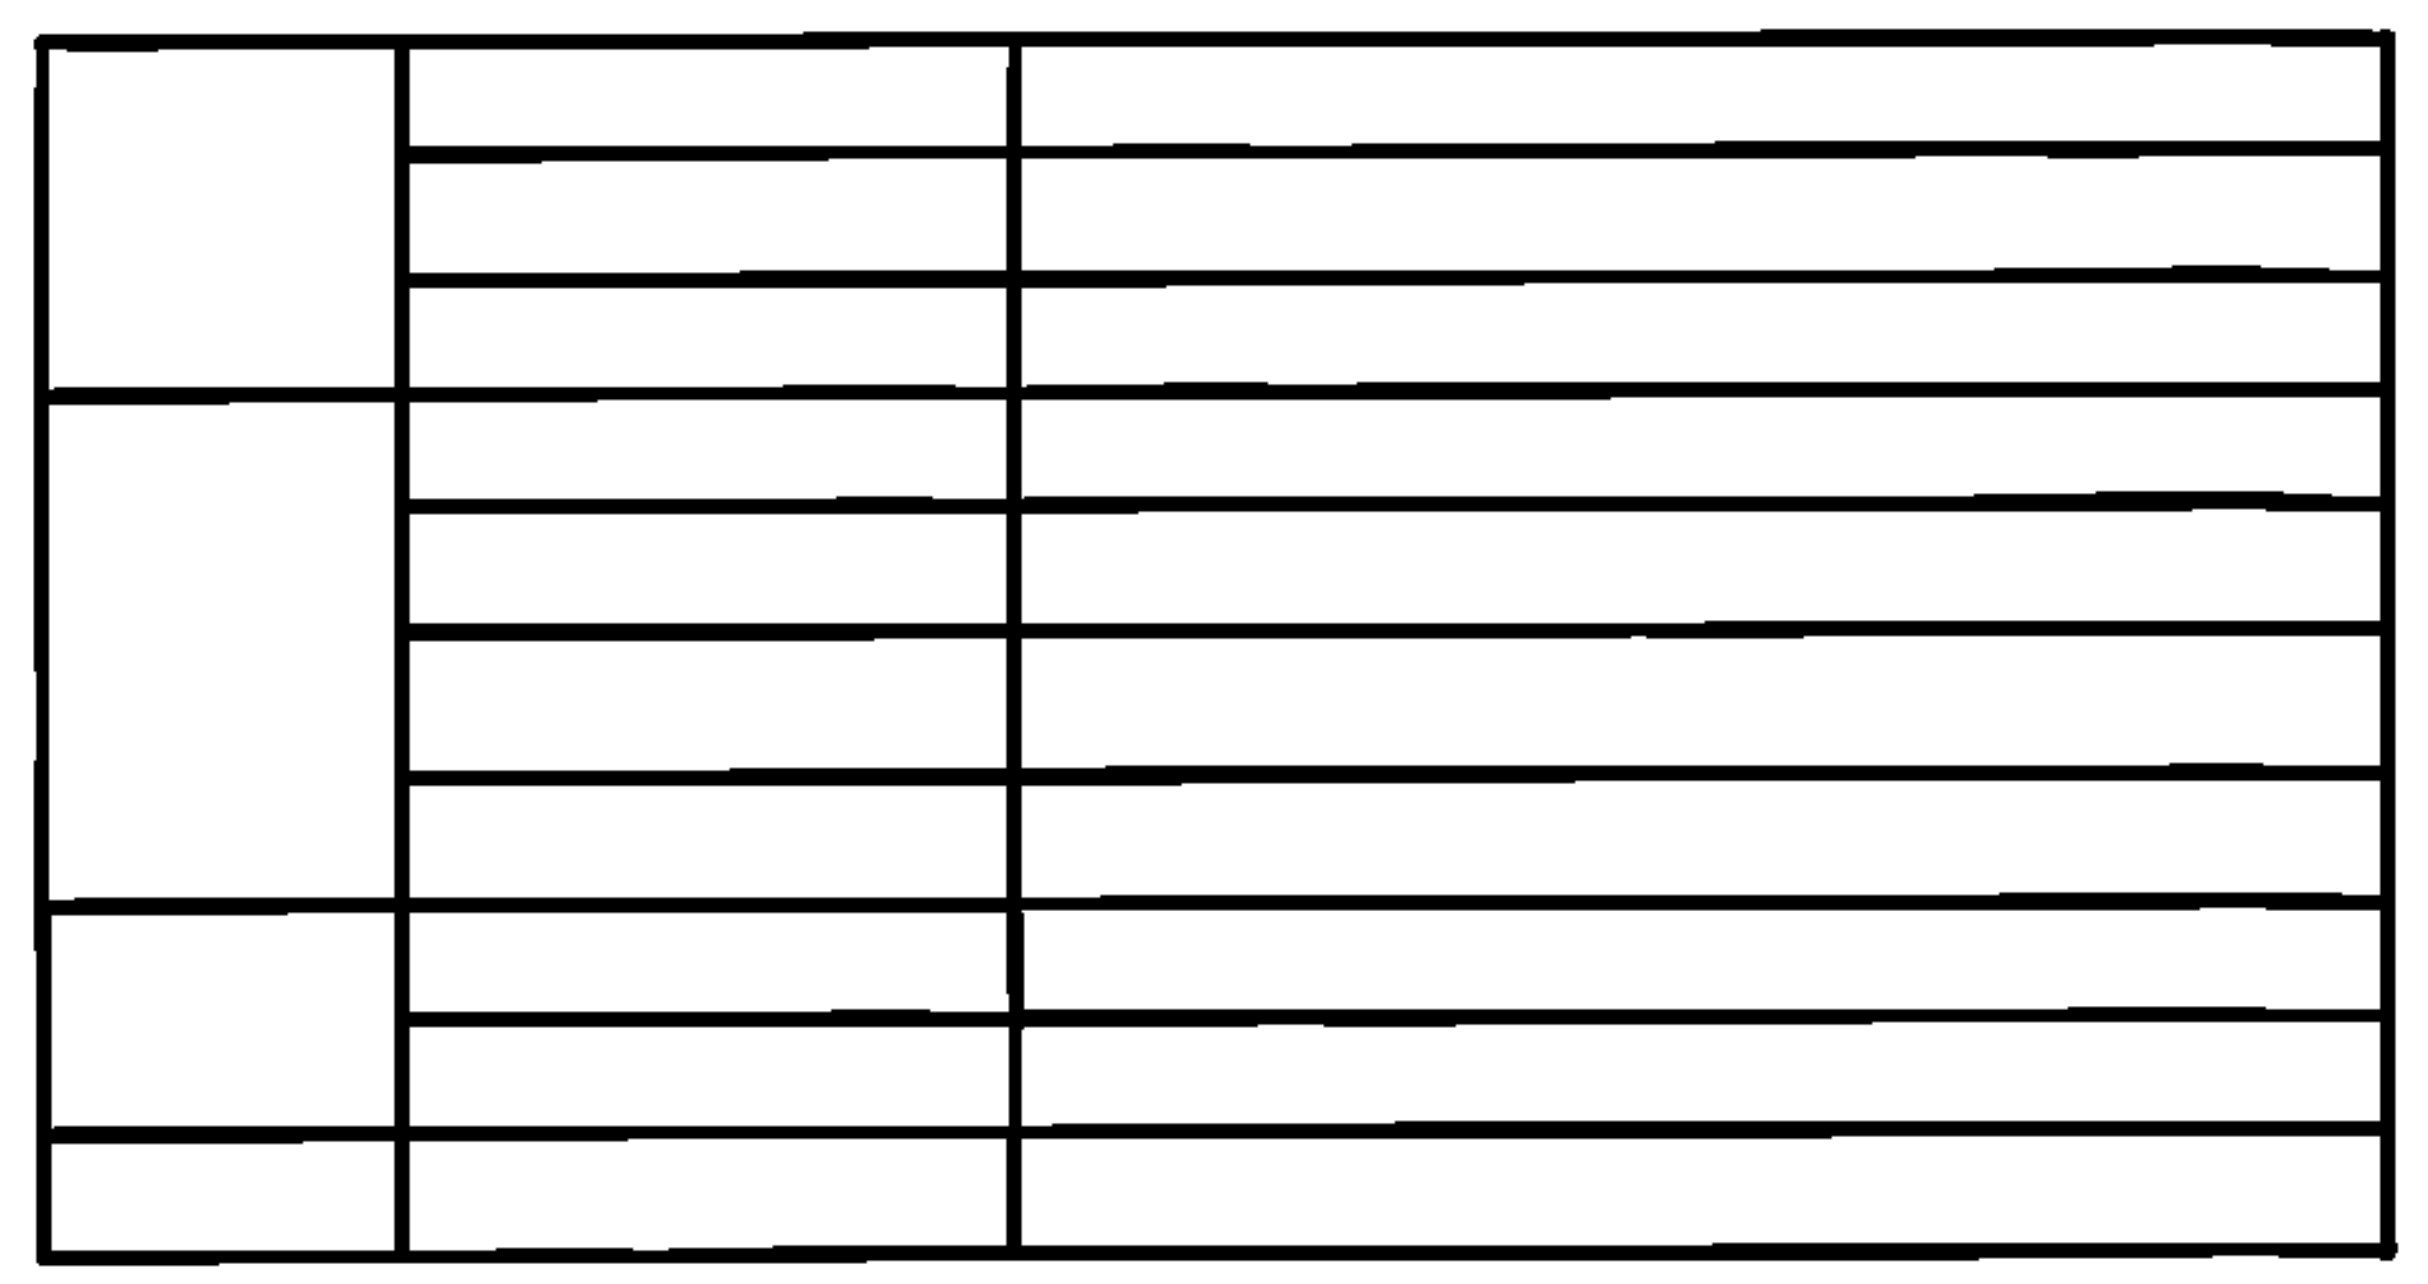
- The table basically has a grid structure of multiple rows and multiple columns.
- Two adjacent horizontal lines make one row, and two adjacent vertical lines make one column in the table.
- All the vertical lines connect the top horizontal line and the bottom horizontal line.
- Some horizontal lines including the top one and the bottom one connect the leftmost vertical line and the rightmost vertical line.
- Other horizontal lines connect the intermediate vertical line and the rightmost vertical line.
- A cell represents the rectangle area surrounded by two adjacent horizontal lines and two adjacent vertical lines.
- The number of cells in every row is equal.
- The number of cells in one column may be different by the column.
- A cell has one or multiple cells at the right neighbor and has one cell at the top/ bottom neighbors.
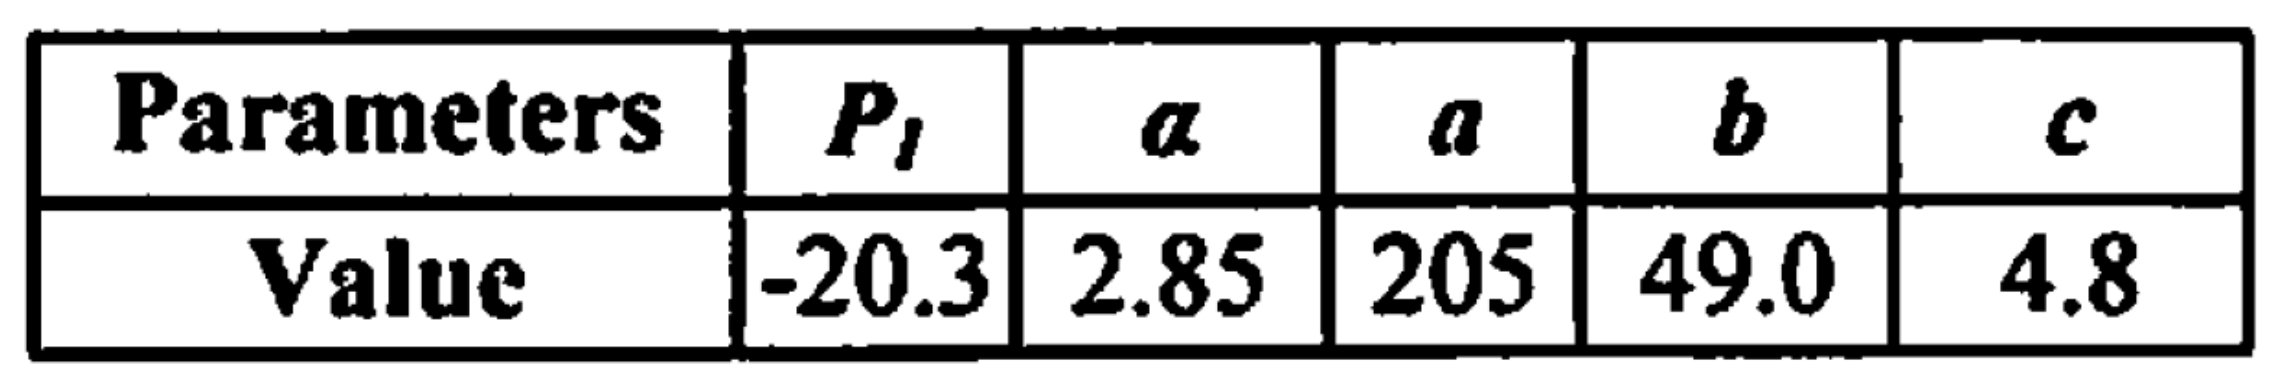
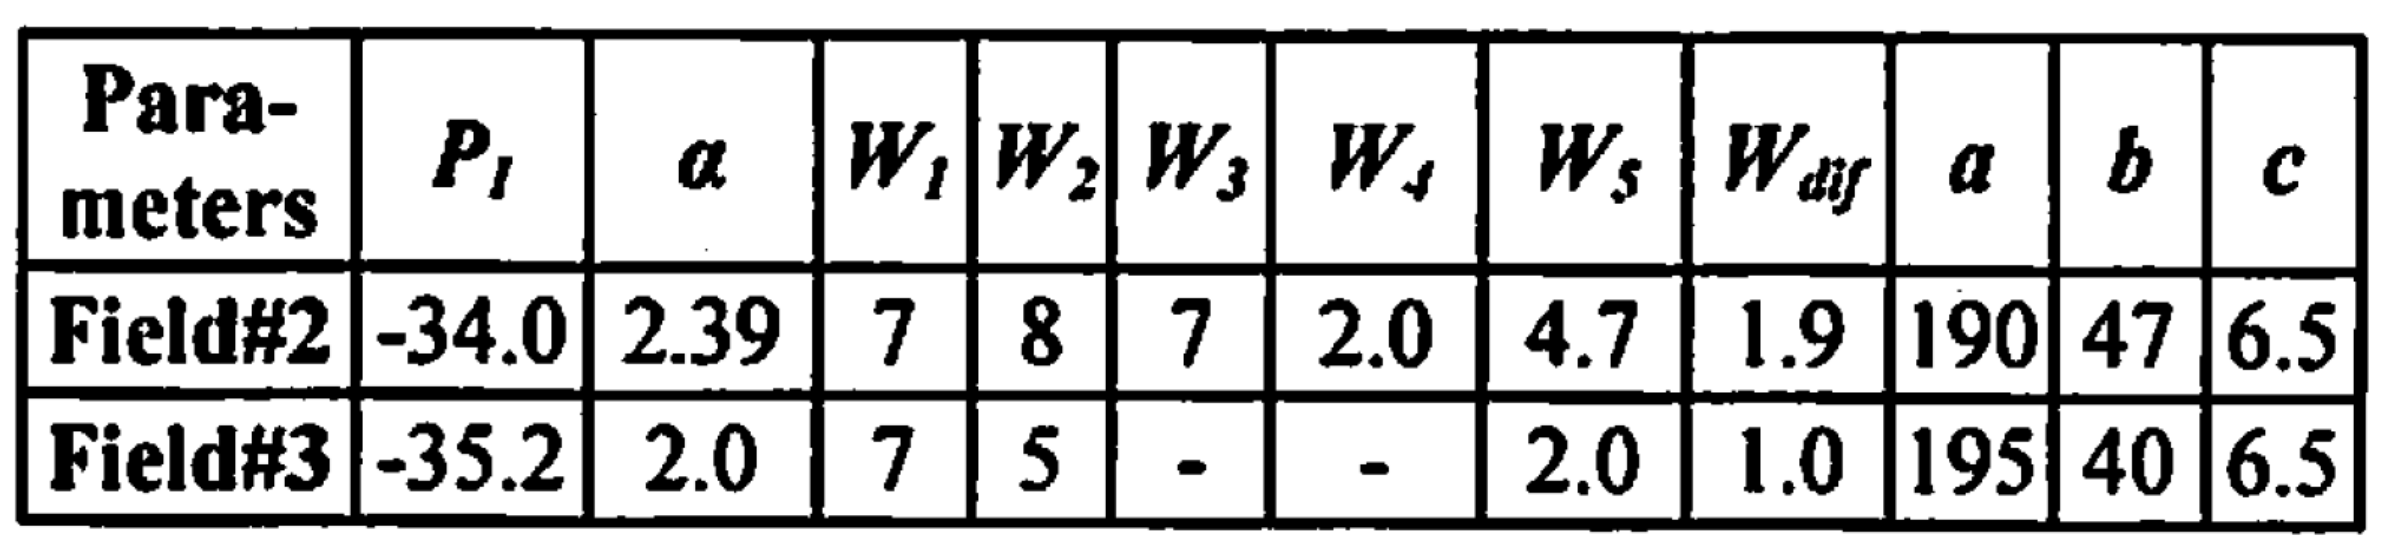
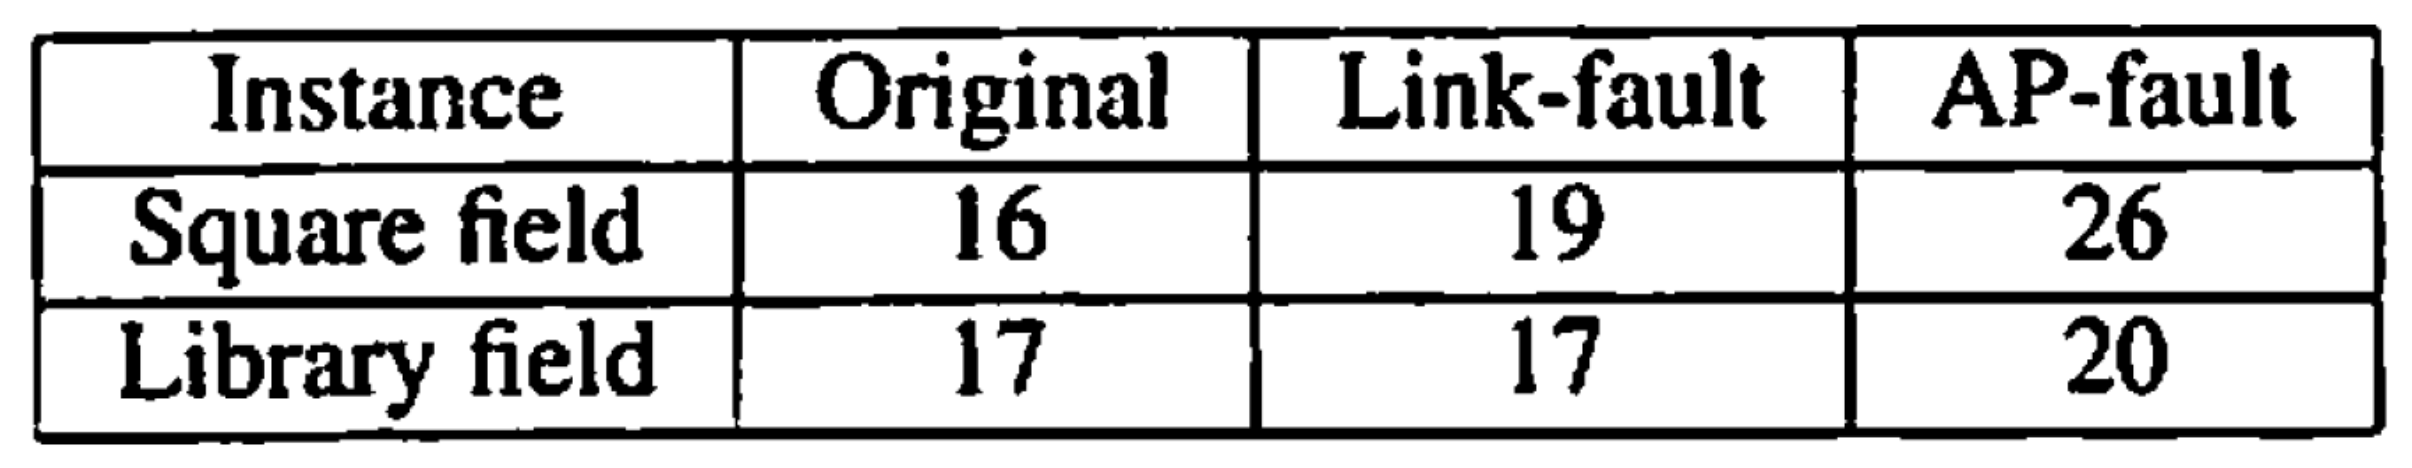
4.2. Example Table
4.3. Topology Information
5. Proposed Algorithm
5.1. Symbols in Algorithm
- I: the scanned color image of the paper.
- : reversed binary image of I.
- : the definition of a vertical kernel for detecting all vertical lines in an image.
- : the definition of a horizontal kernel for detecting all horizontal lines in an image.
- : the binary image with only vertical lines of I.
- : the vertical lines of .
- : the binary image with only horizontal lines of I.
- : the horizontal line of .
- : combine and .
- : the contours of .
- : each contour of .
- : the rectangles of .
- R: the array of .
- : the sorting result of .
- : the R after sorting.
- : the array of rectangular which only contains a single cell.
- : each Cell class.
- C: the array of
- : the horizontal coordinate of .
- : the vertical coordinates of .
- : the width of .
- : the height of .
- : the name of that uses pytesseract to recognize.
- : the number of rows in I.
- : the root node of the cardinal tree.
- : the of each column, for example, when , we have , when , we have
- : the of each column, for example, is the next class of .
- : the structure of I’s table.
- E: the output Excel table.
5.2. Procedure in Algorithm
- (1)
- Make the color image I of each table by scanning the paper.
- (2)
- Transform the color image I into the black-and-white binary image by applying the thresholds function in OpenCV to I.
- (3)
- Reference [9], obtain the vertical kernel and the horizontal kernel by applying the getStructuringElement function in OpenCV to .
- (4)
- (5)
- Extract the vertical lines by applying the dilate function in OpenCV to .
- (6)
- (7)
- Extract the horizontal lines by applying the dilate function in OpenCV to .
- (8)
- Make the binary image that represents the table frame by combining the vertical lines and the horizontal lines into one image, applying the addWeighted function in OpenCV to and . Figure 7 shows the table frame image.
- (9)
- Obtain the contour information of each cell in the table and store them in the array by applying the findContours function in OpenCV to .
- (10)
- Find the rectangular for each contour of by applying the boundingRect function in OpenCV to every contour of , and make the array R of .
- (11)
- Sort in R from the leftmost one to the rightmost one according to the coordinates of by applying the zip method and the sort method in Python to R, and make the array and the array .
- (12)
- Remove all excessively large or small rectangles in , to avoid rectangles that contain multiple cells or have no cells. Produce the with every rectangle containing a cell.
- (13)
- Create Cell. Create class for each rectangle in , collect , , and of each rectangle in , and put them into as member variables.
- (14)
- Obtain the character recognition result by applying the imagetostring function in pytesseract to each cell.
- (15)
- Sort the , in which the and of each are arranged from left to right and from top to bottom. Arrange with similar into a column in the order of from small to large to output
- (16)
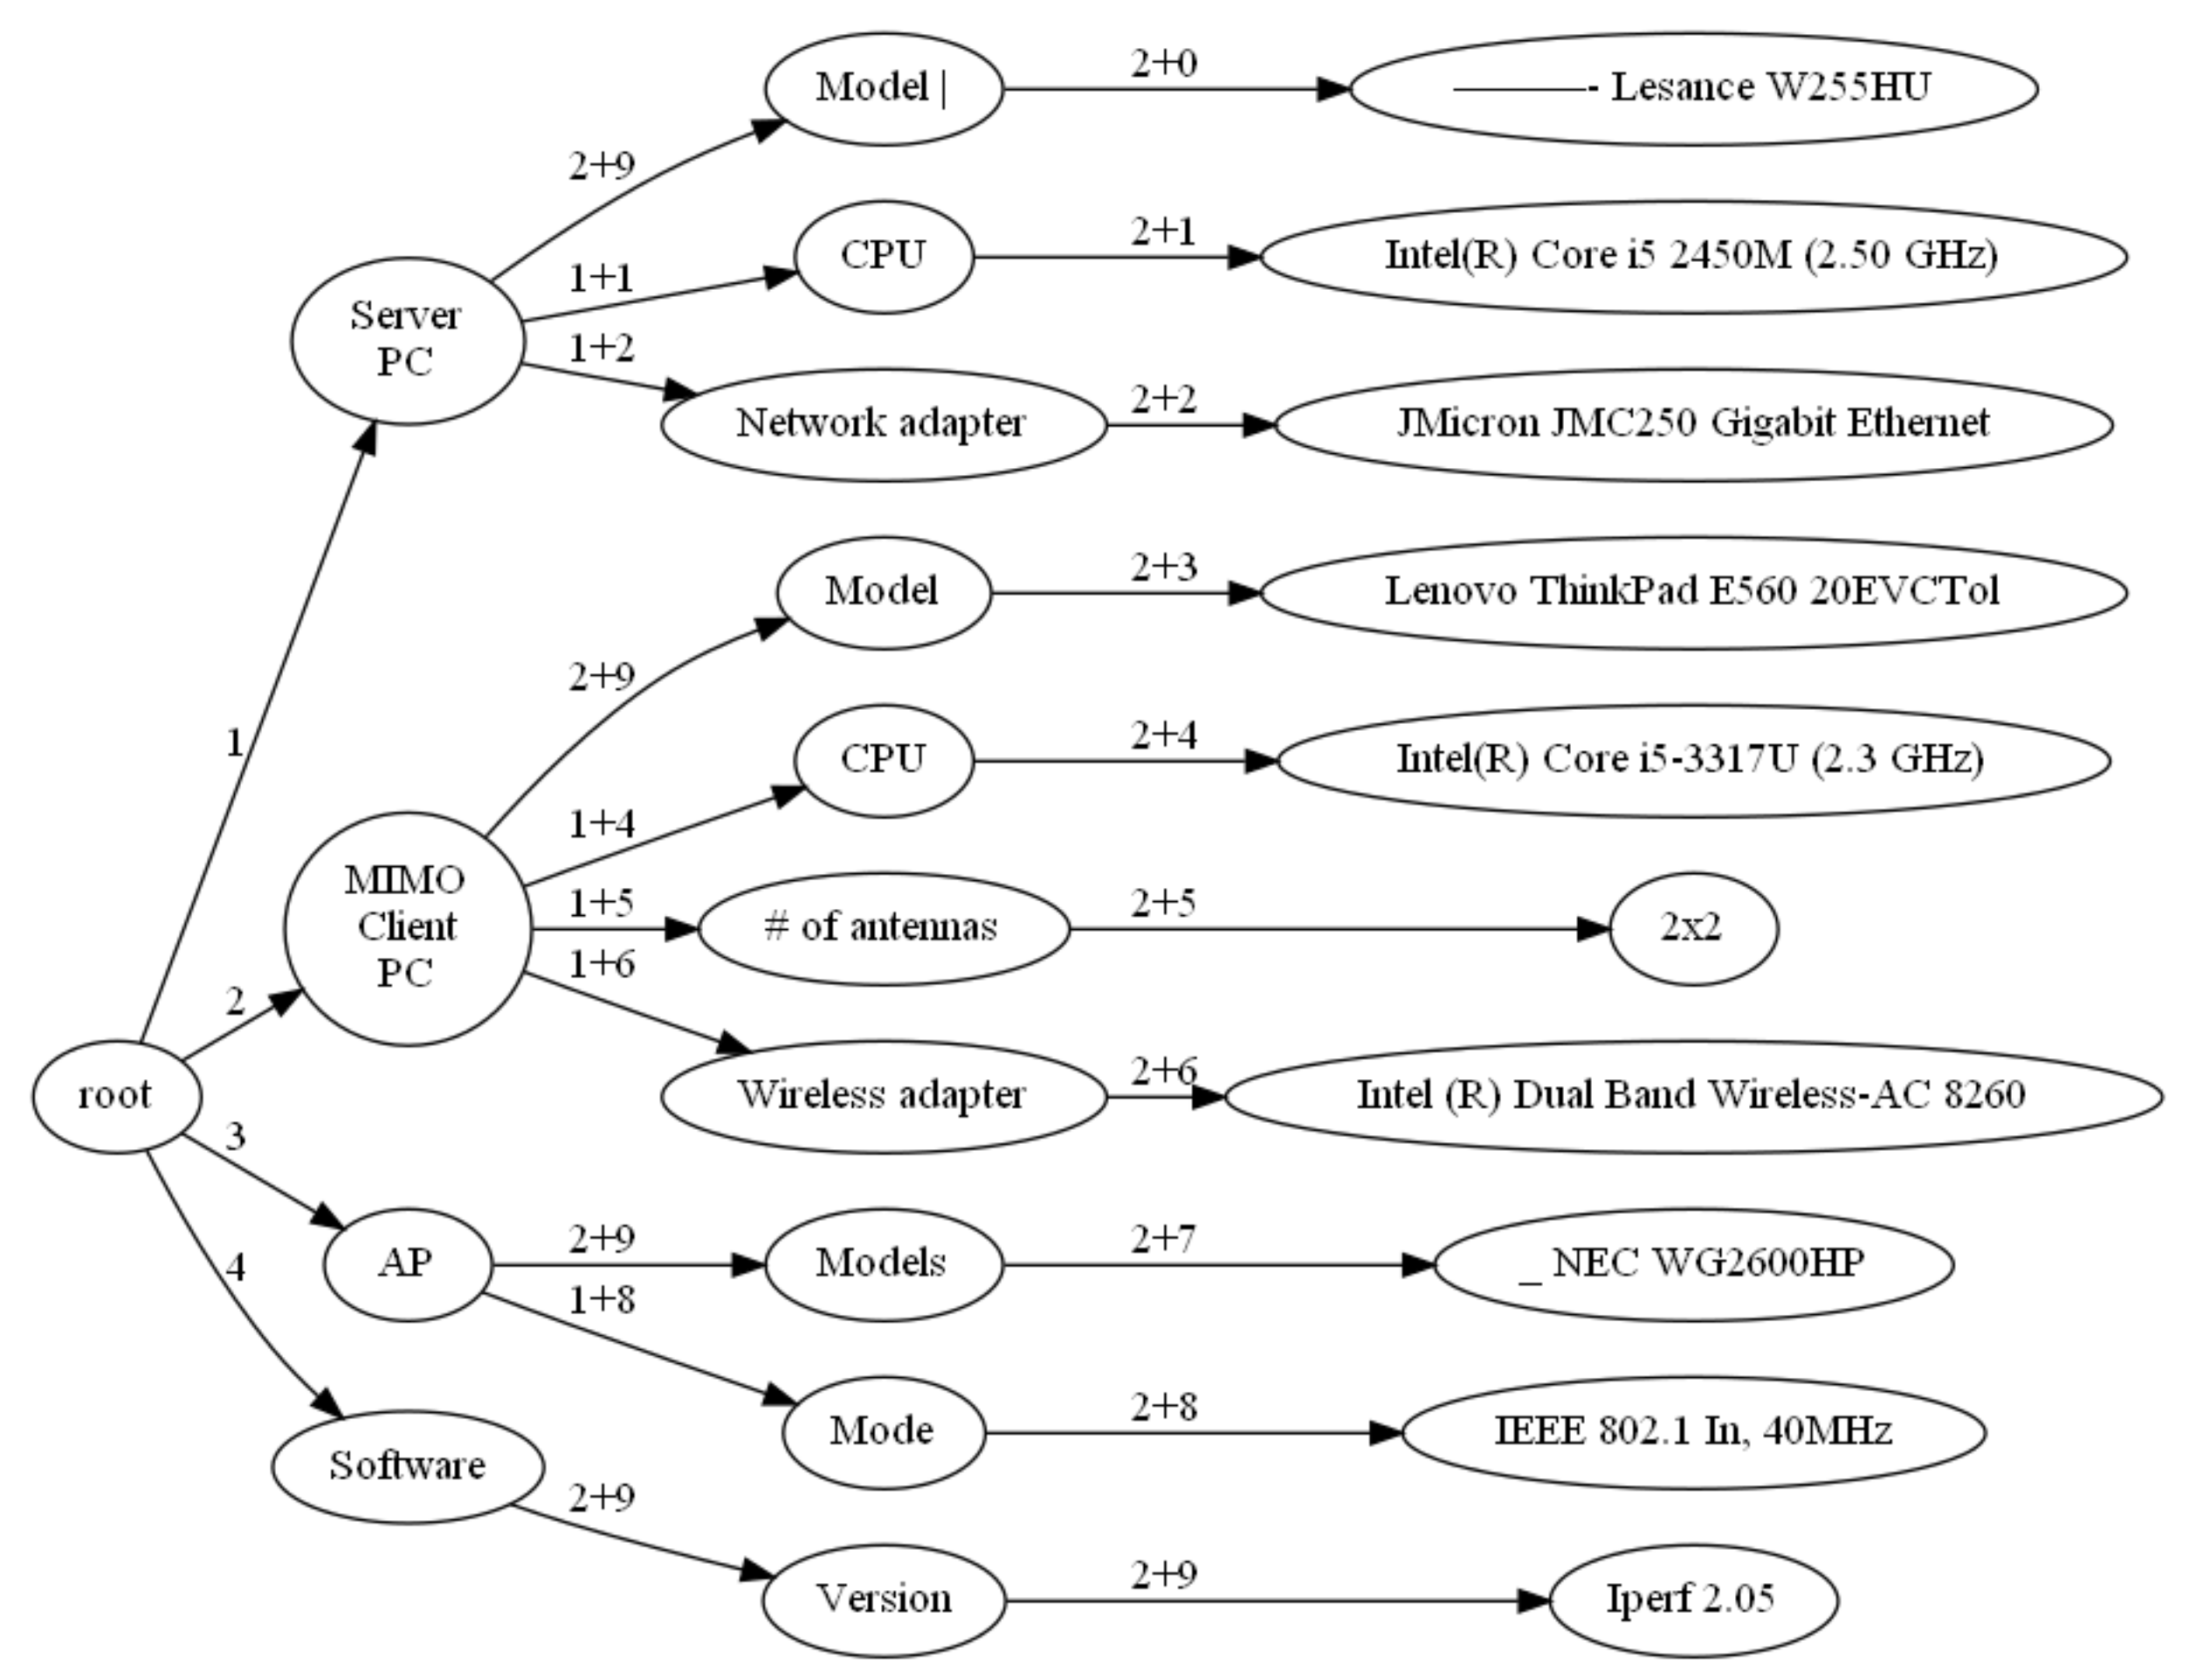
- Create the multi-tree class to describe the structure of the table with the root node . The child nodes of this root node are all with a row equal to 1.
- (17)
- Confirm the child node of , if ’s is approximately equal to ’s , the child node of is . Otherwise, let ’s plus ’s , and make the sum of ’s and ’s compare with ’s . If the two are approximately equal, the child node of is and . If the two are not approximately equal, it can be done again in the above way.
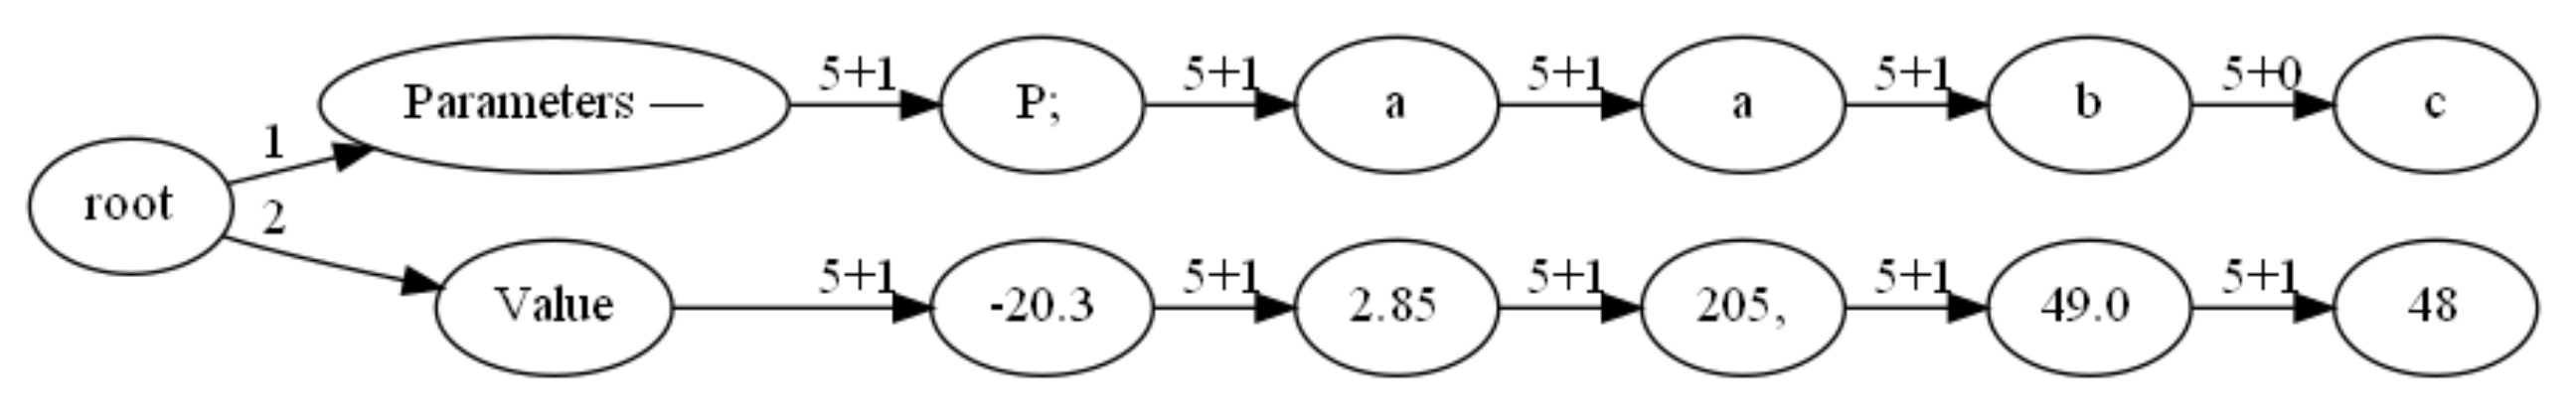
- (18)
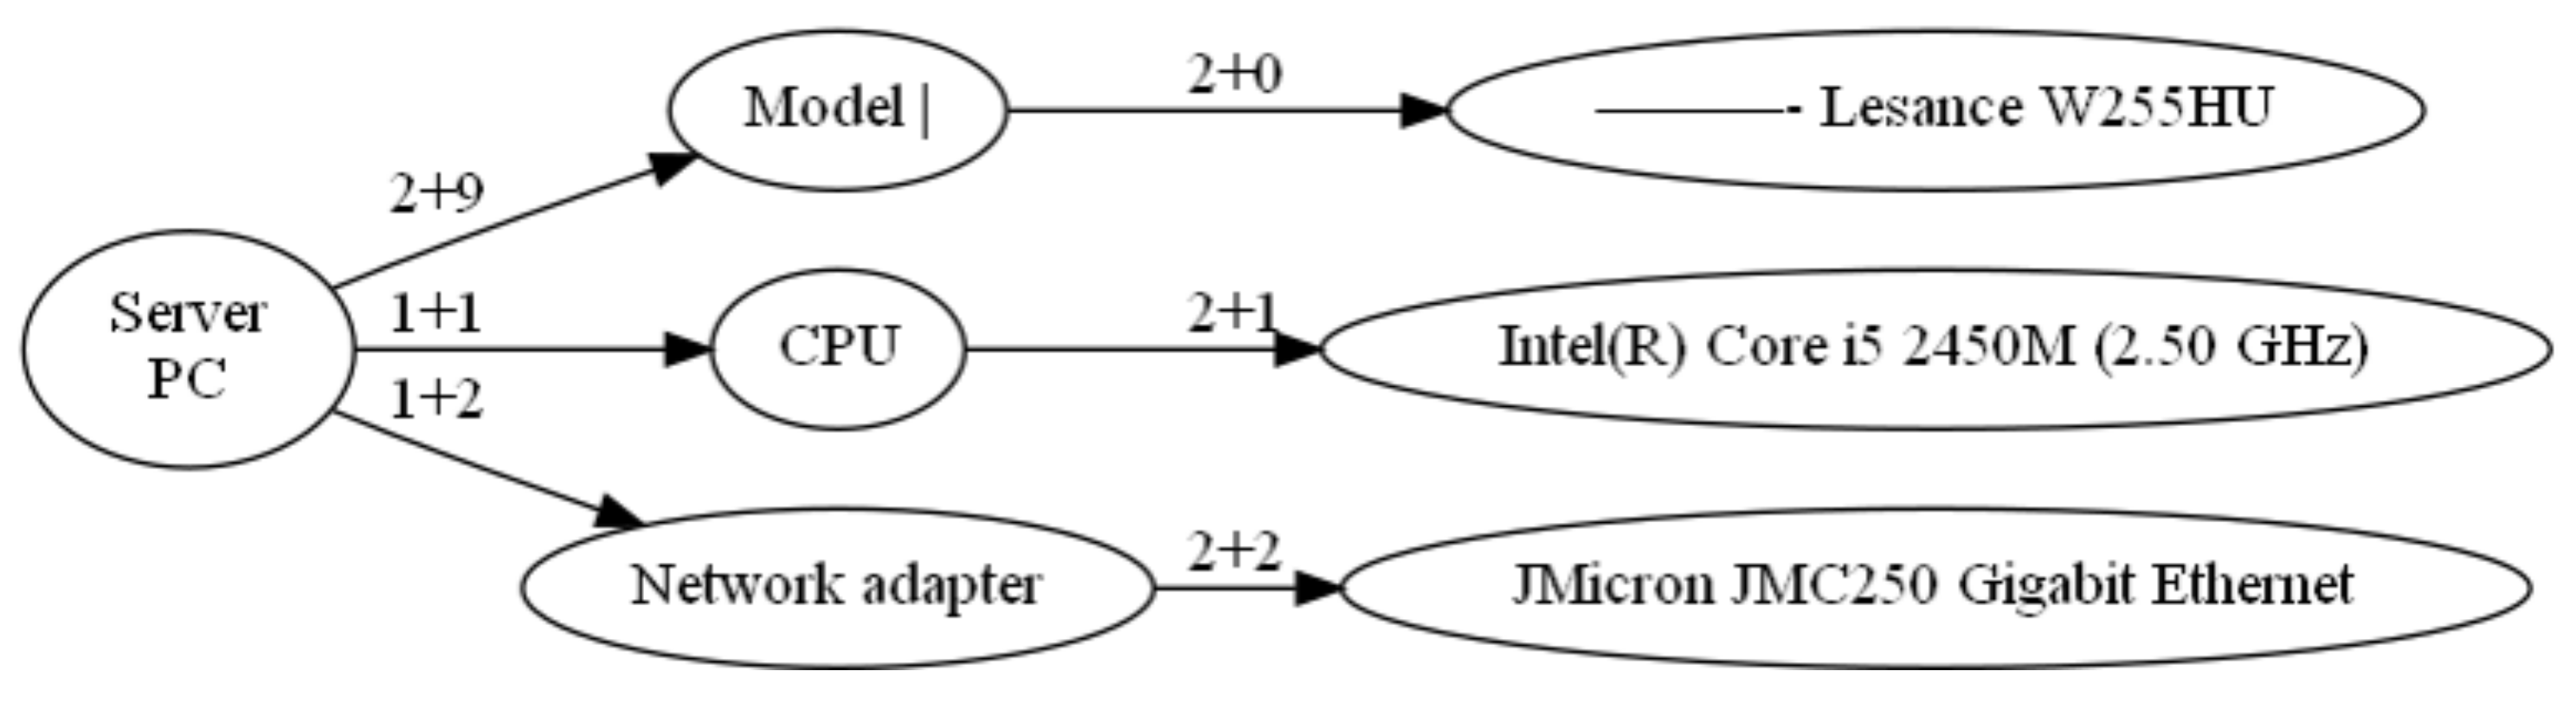
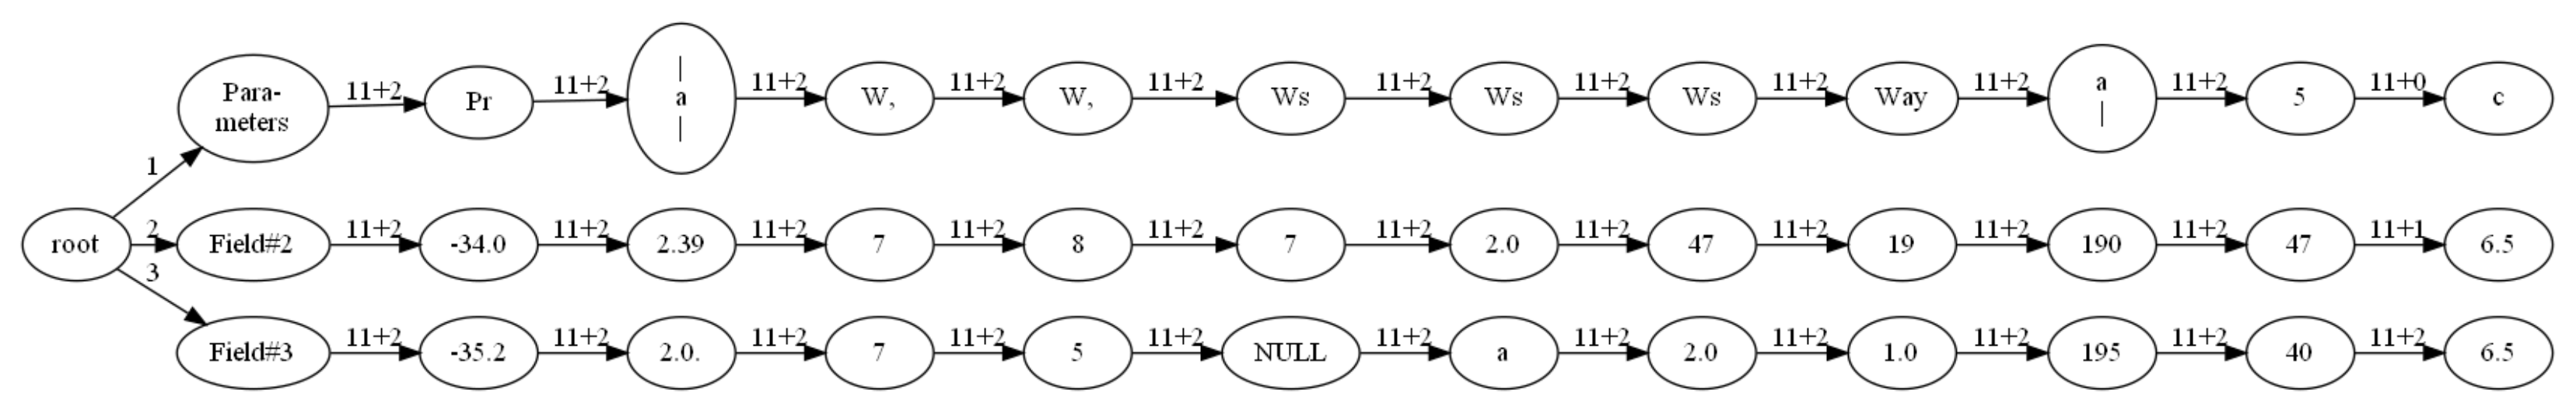
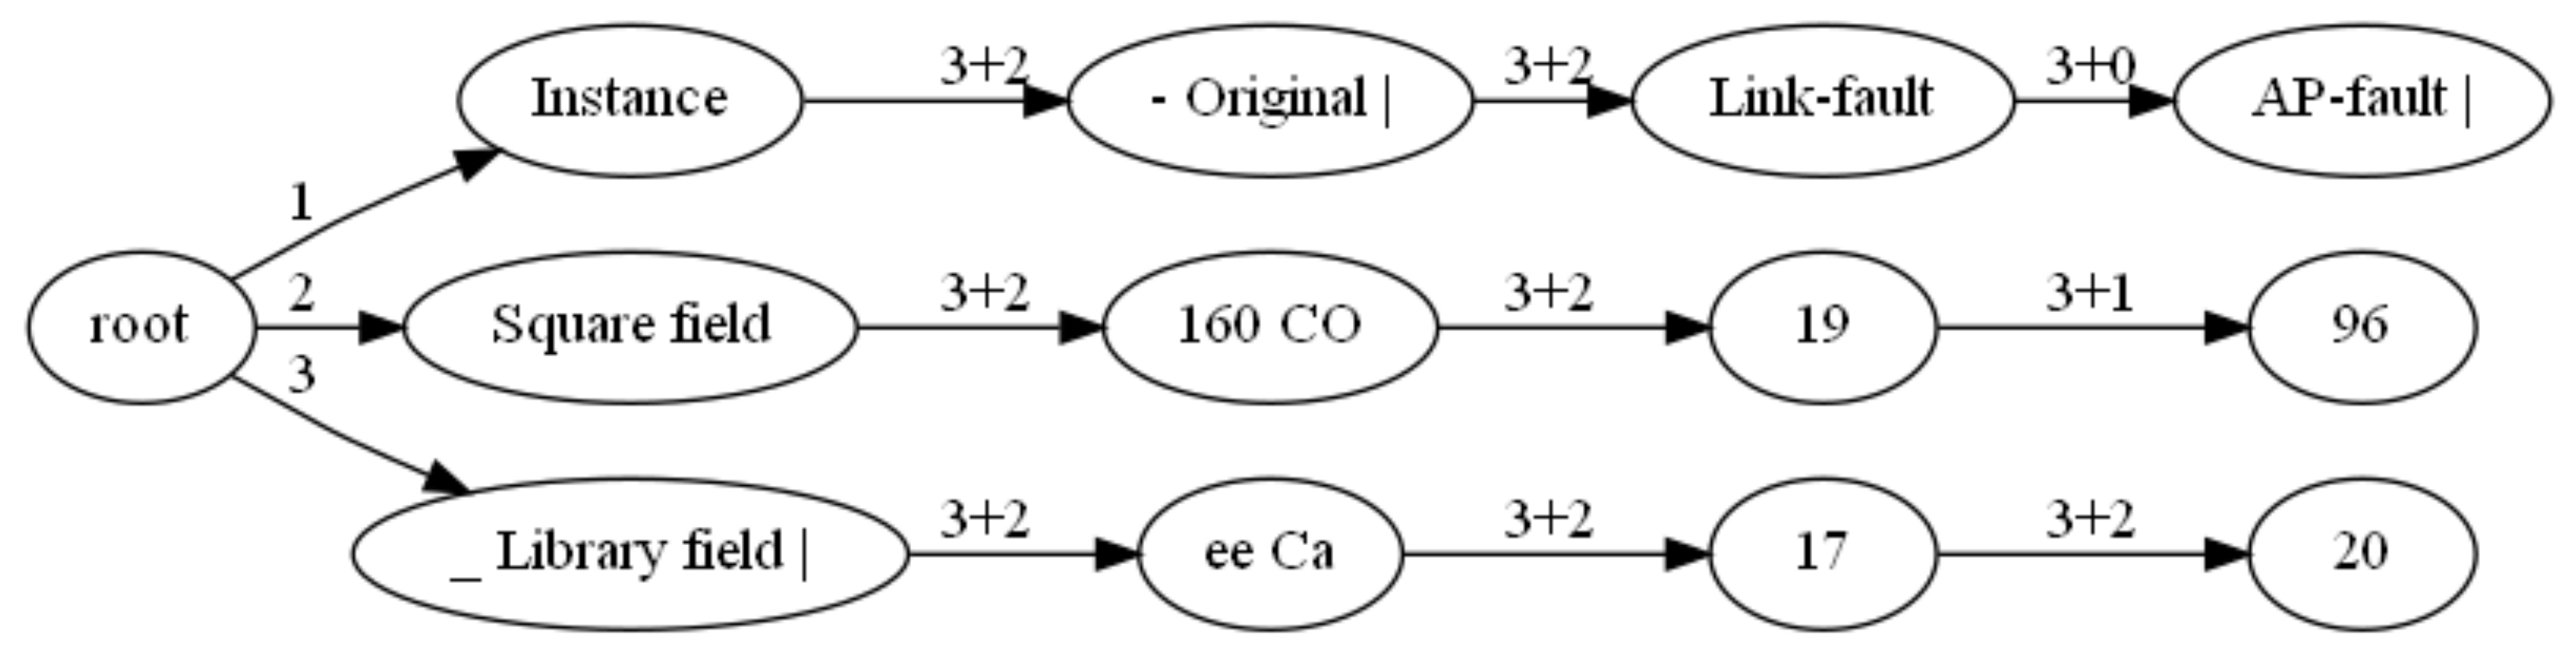
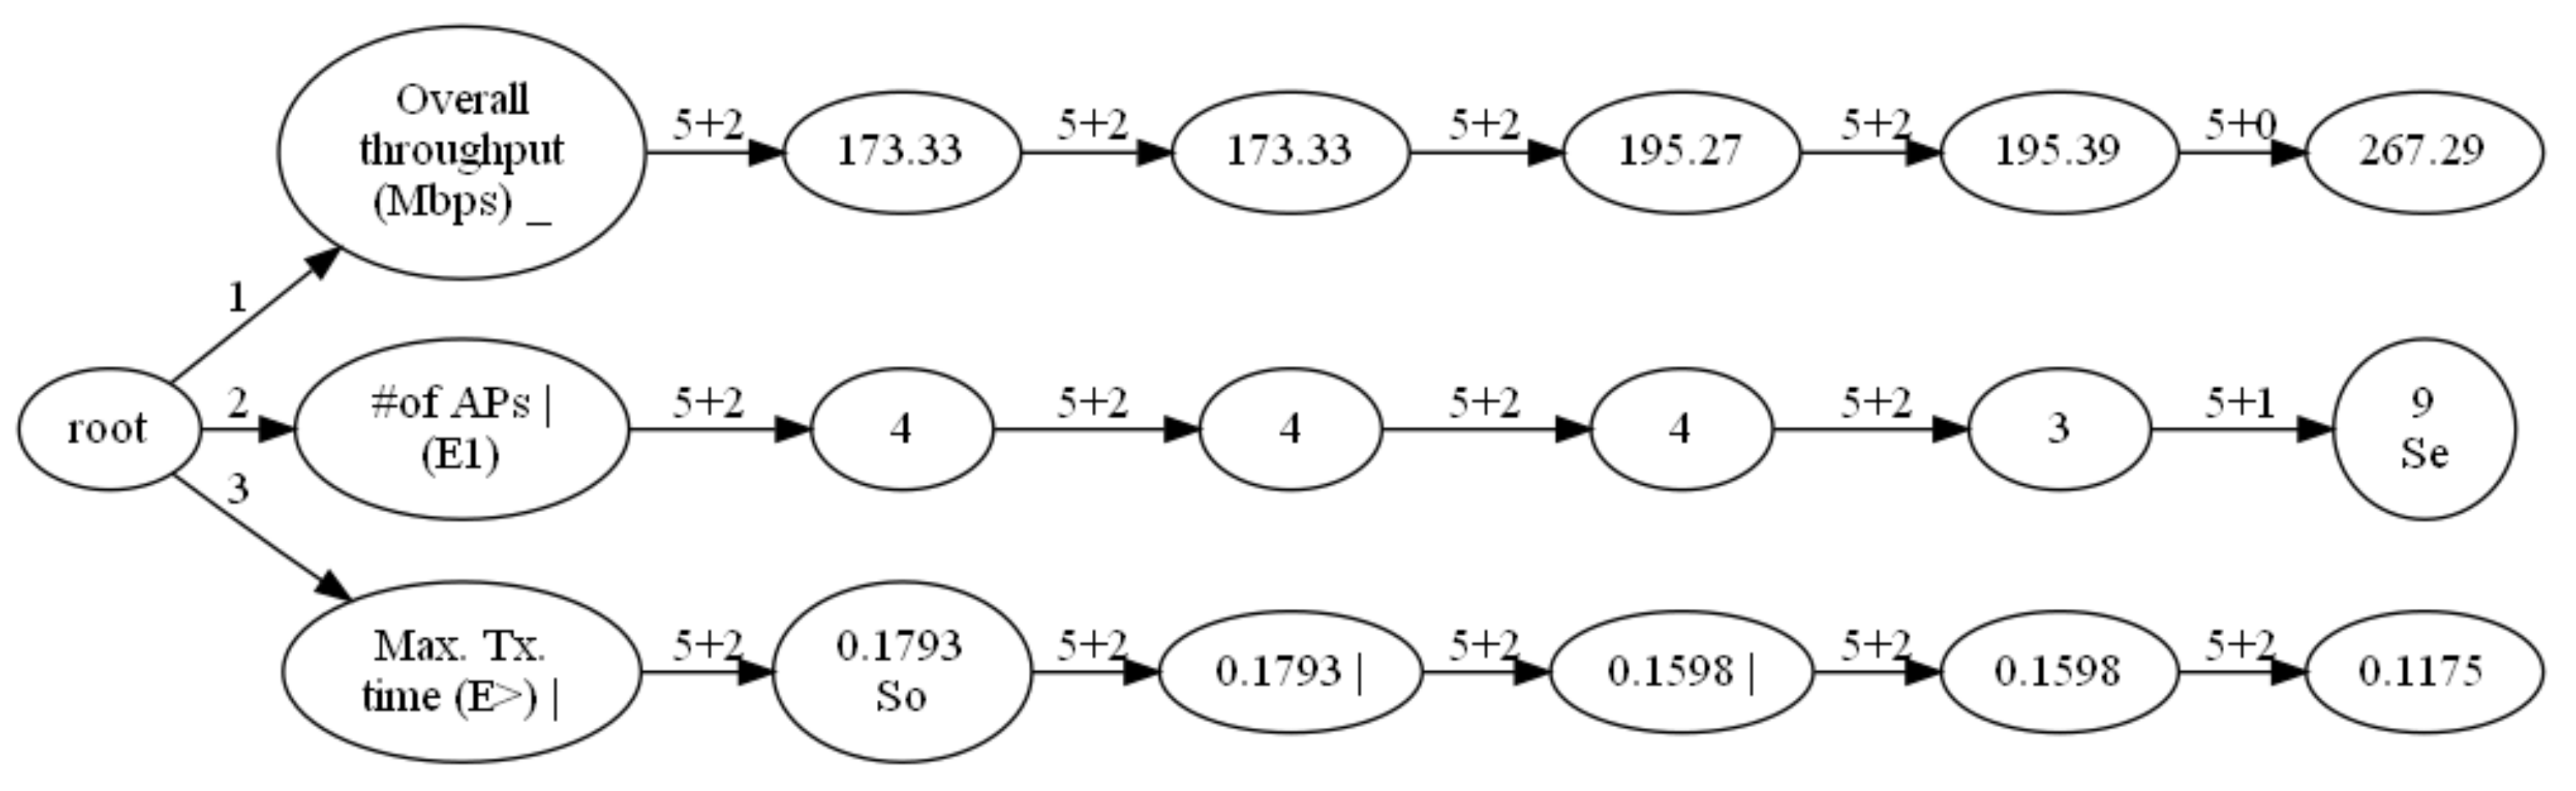
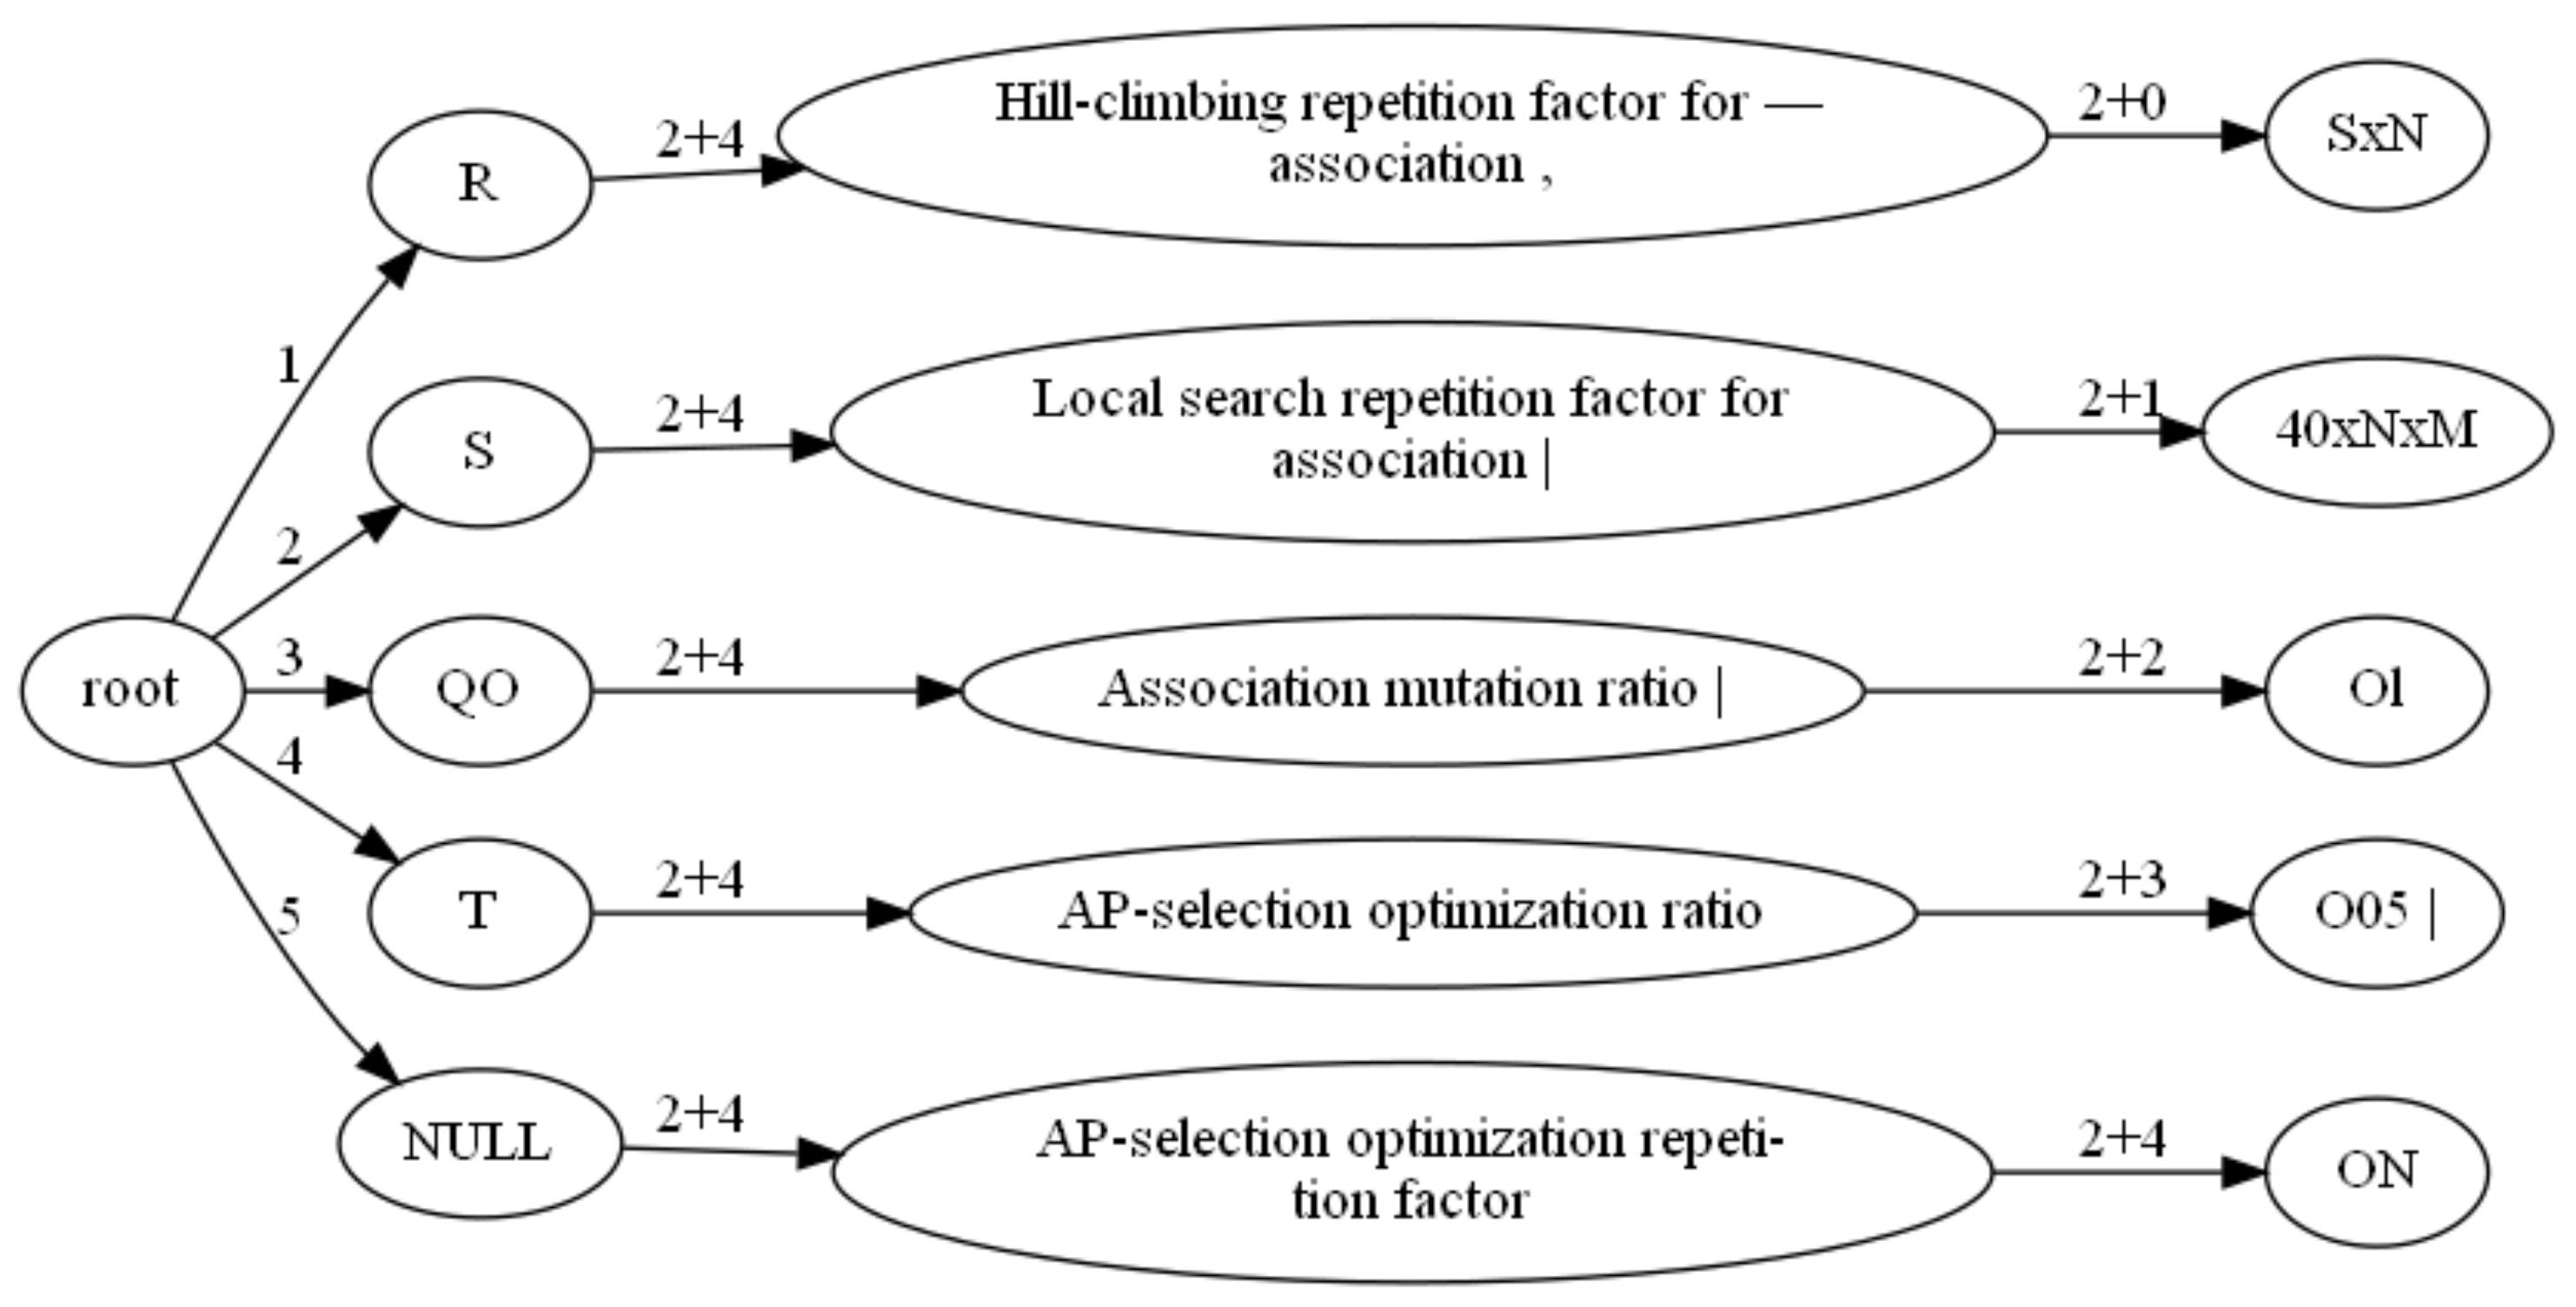
- Follow the previous step to get the child node of , the child node of , up to the last column, and obtain the tree composed of , which represents the structure of the table cell structure. Figure 8 shows the tree.
- (19)
- Preorder the and put each ’s in the leaf node’s in the order from the root node to the leaf node. Each leaf node’s contains one row of the table, and then output each leaf node’s in order to get the list of table information.
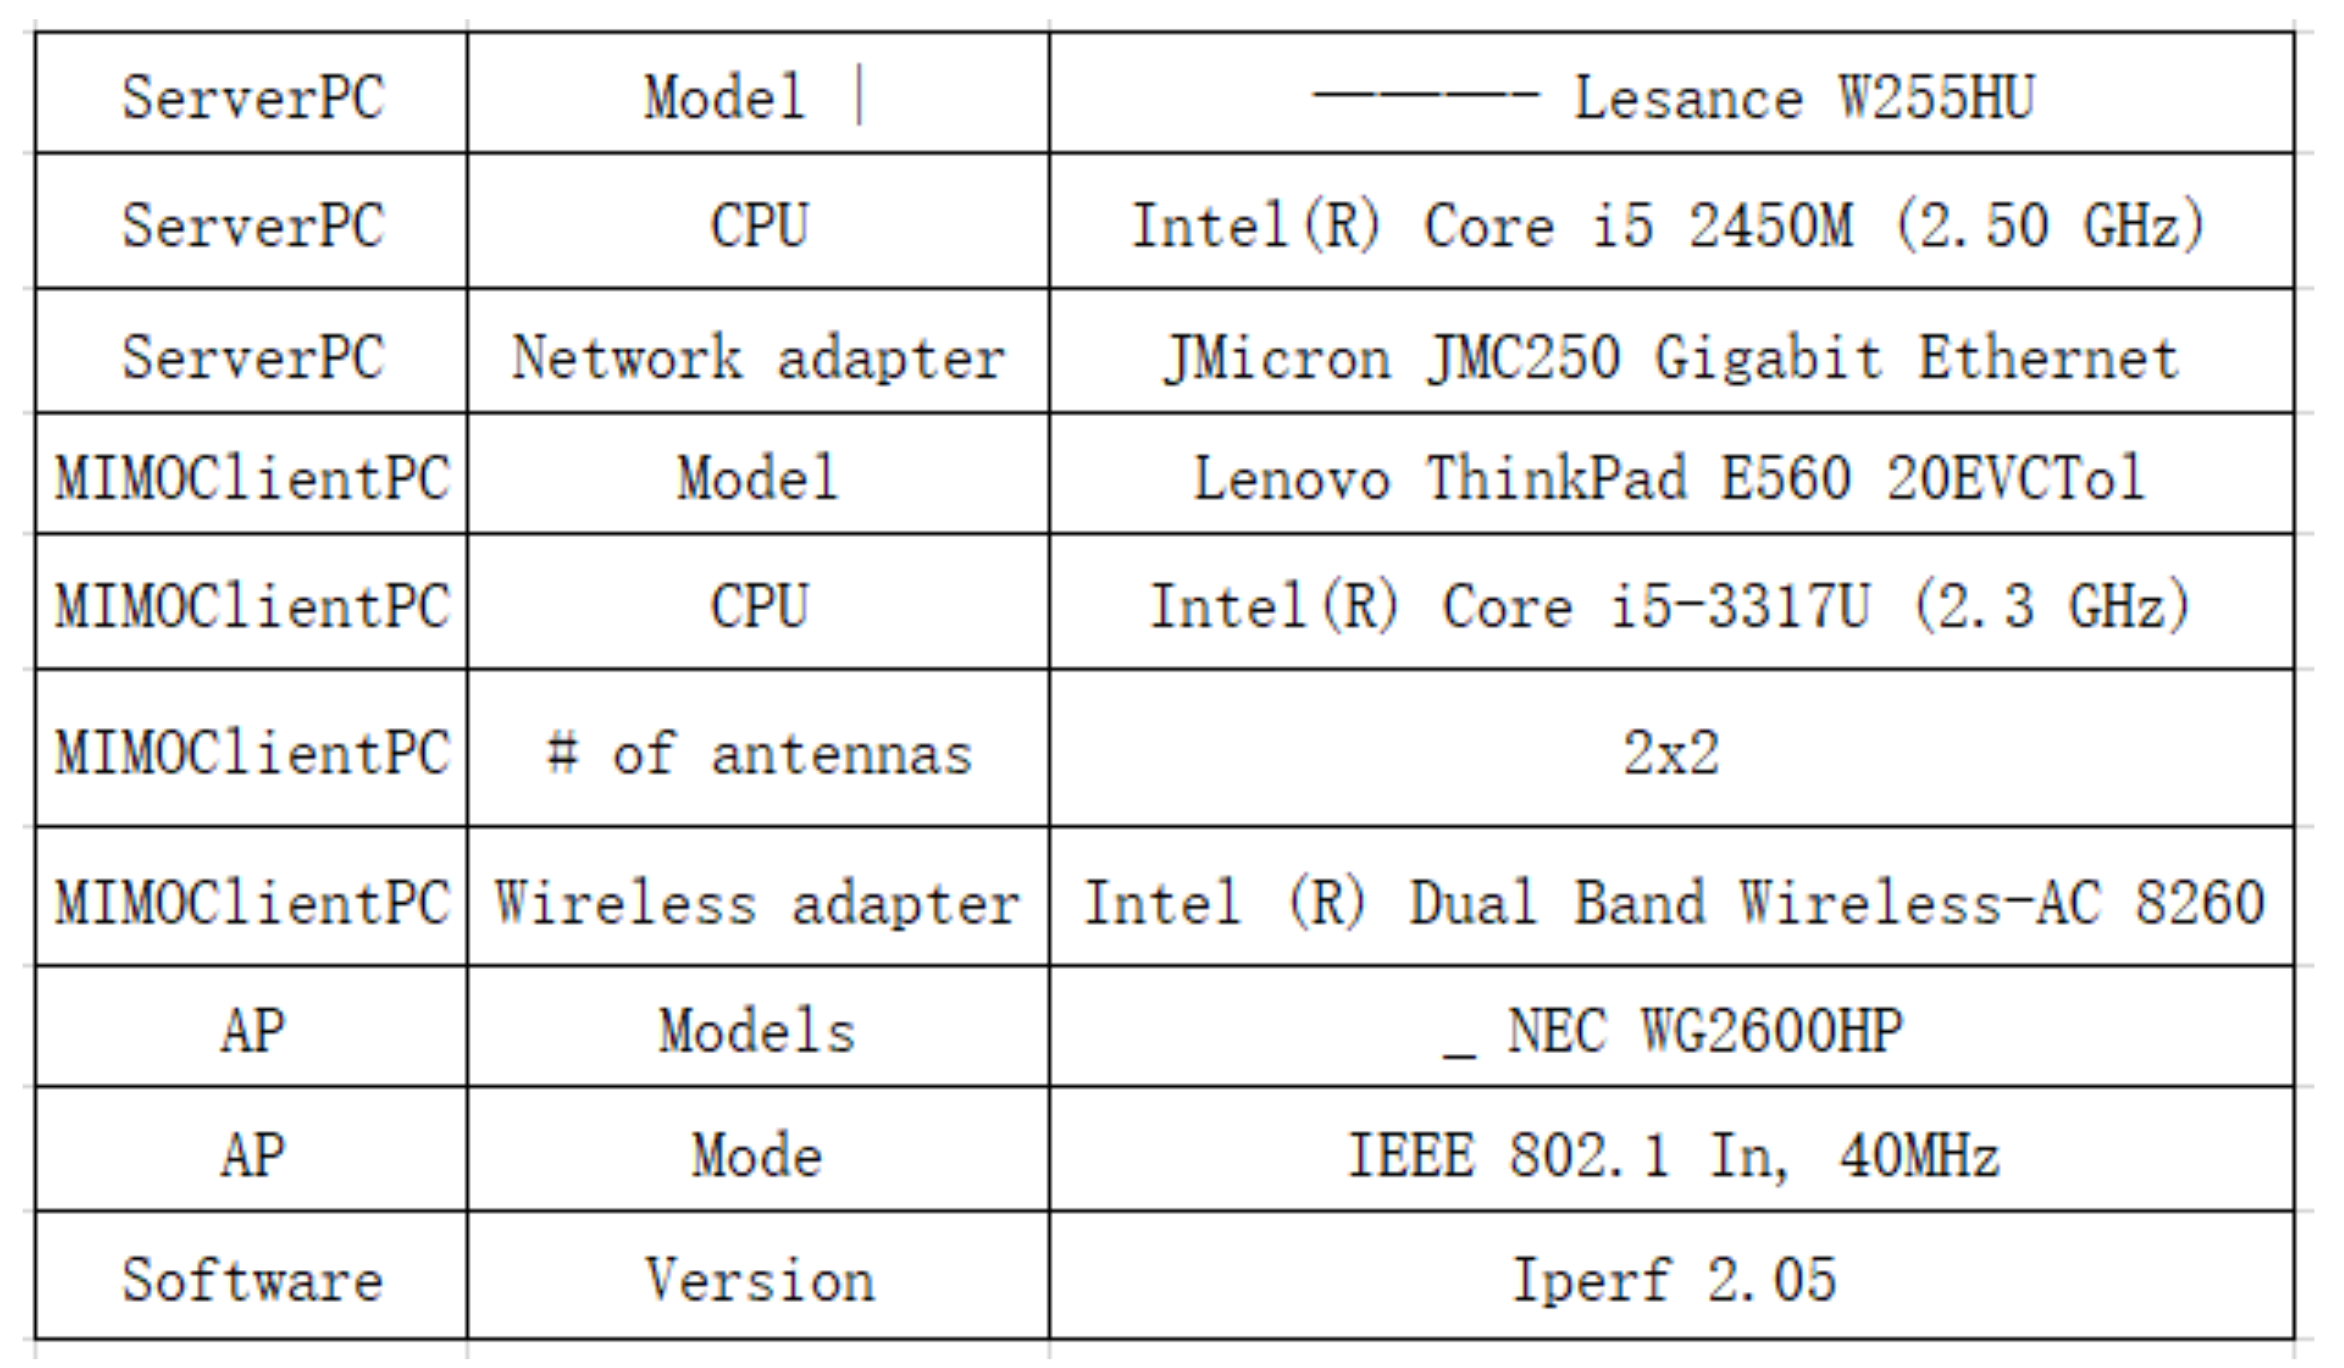
- (20)
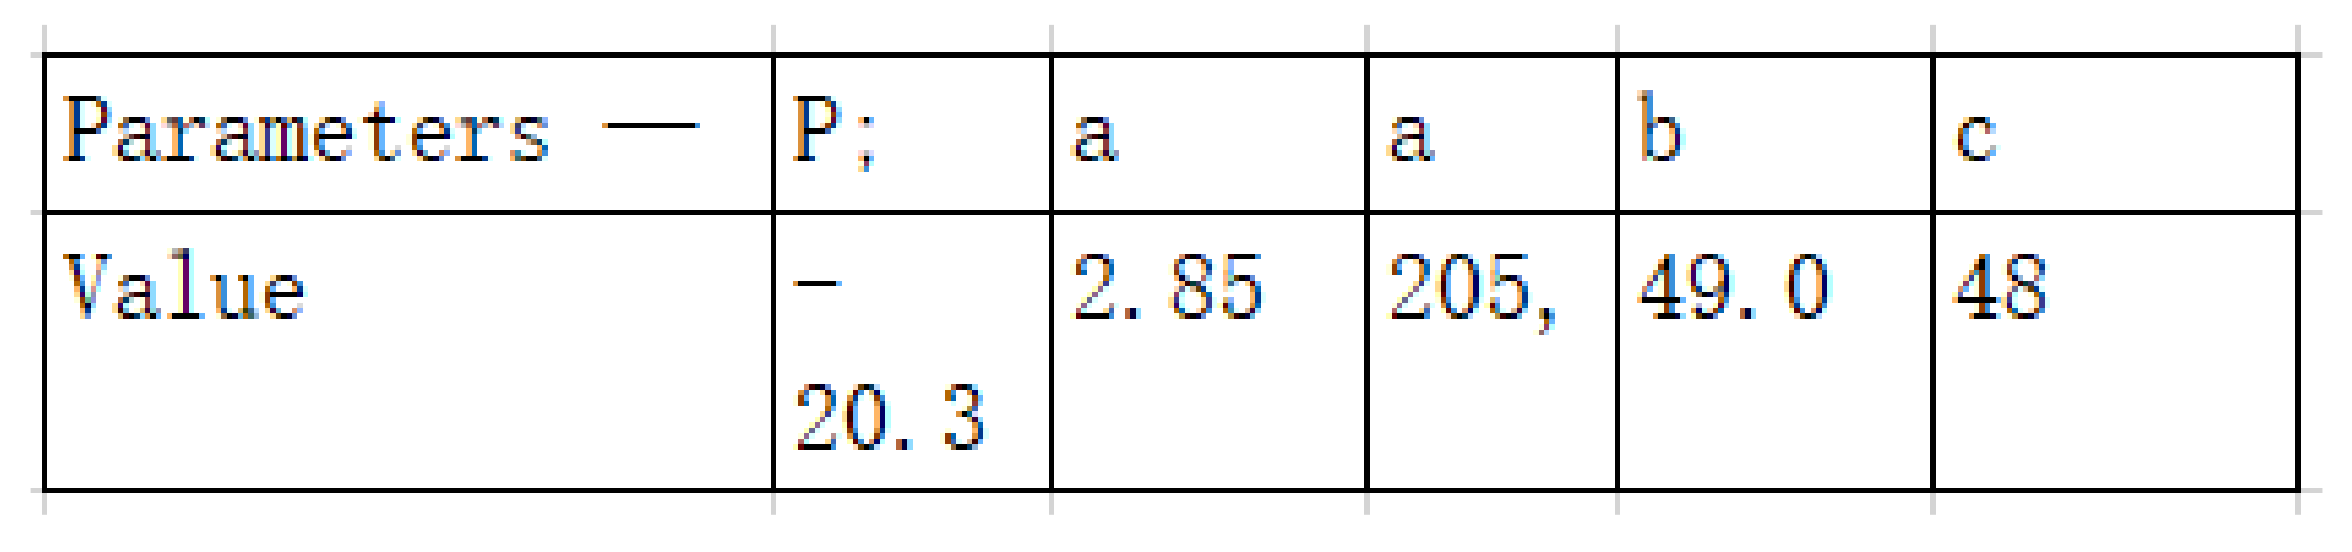
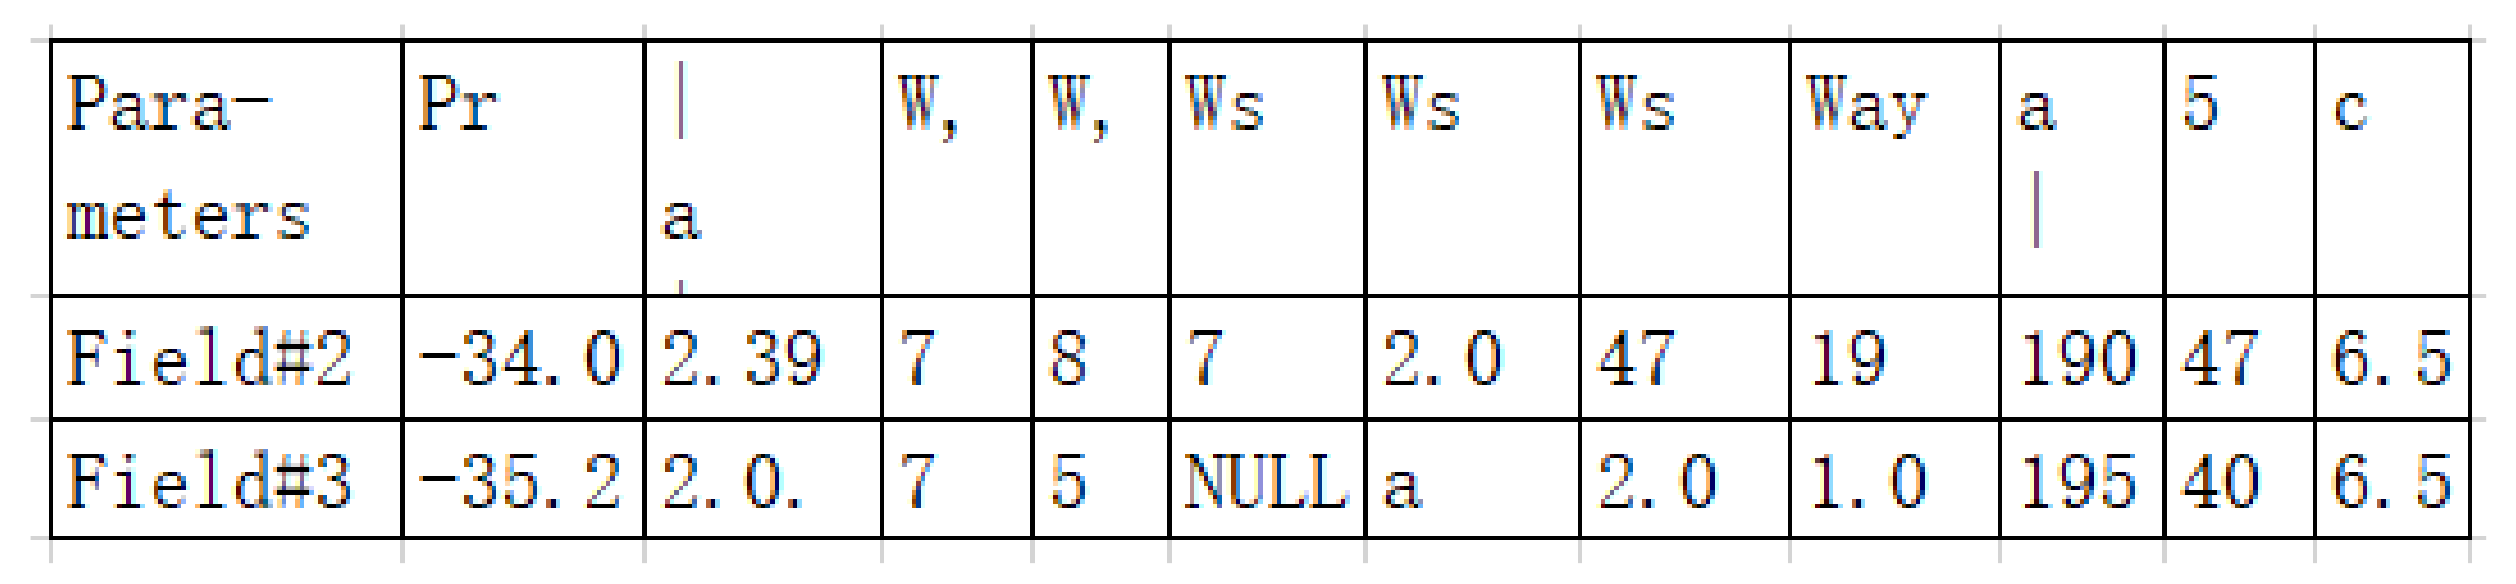
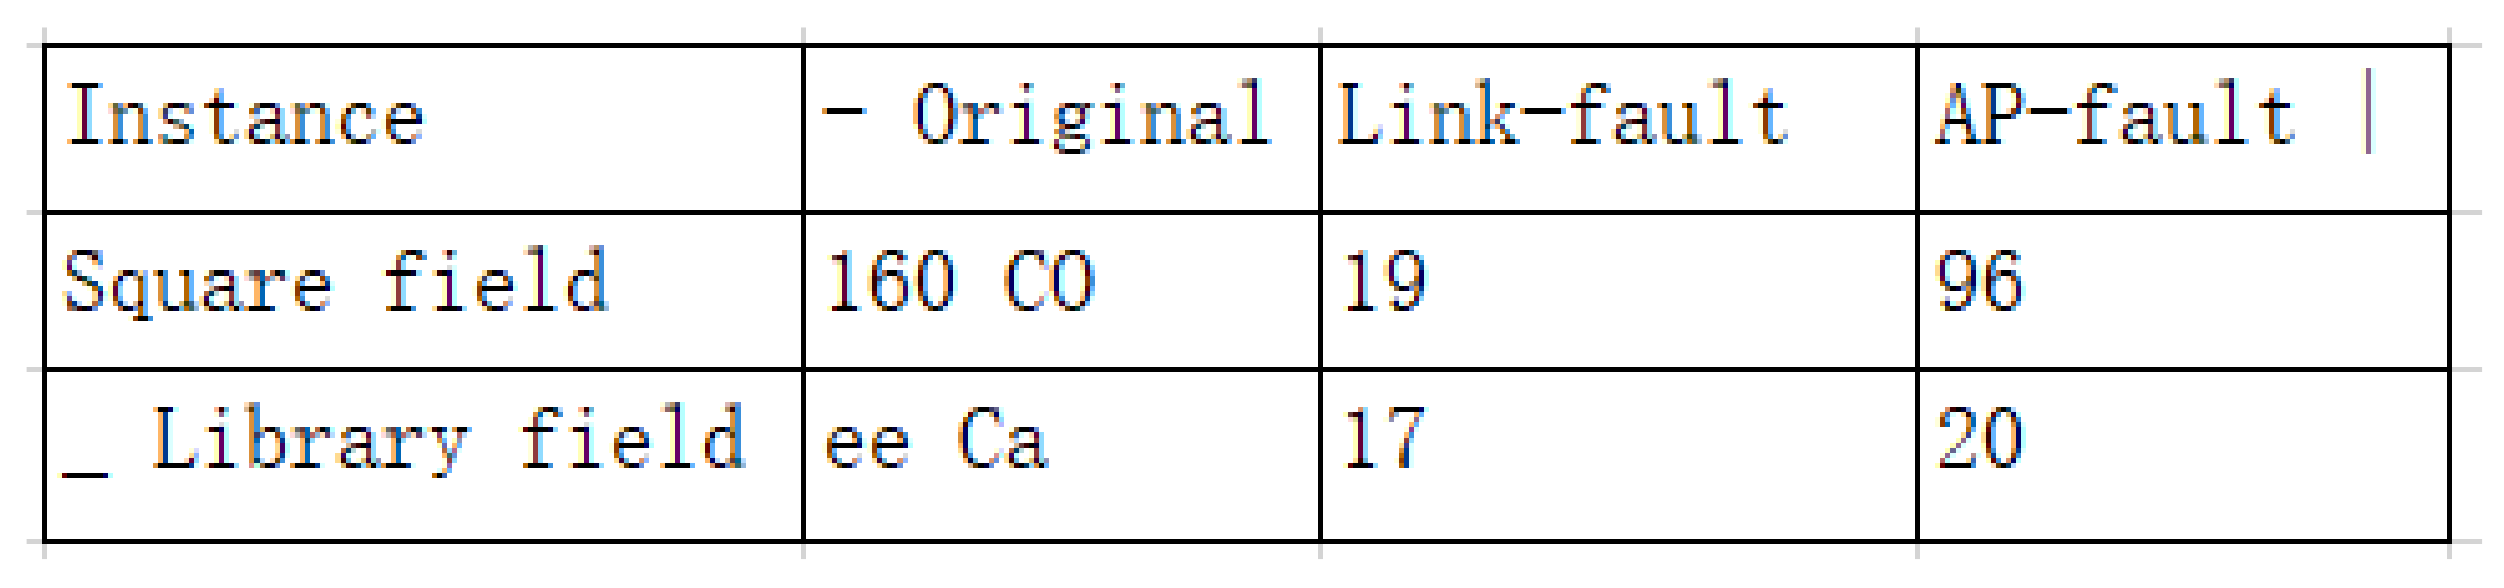
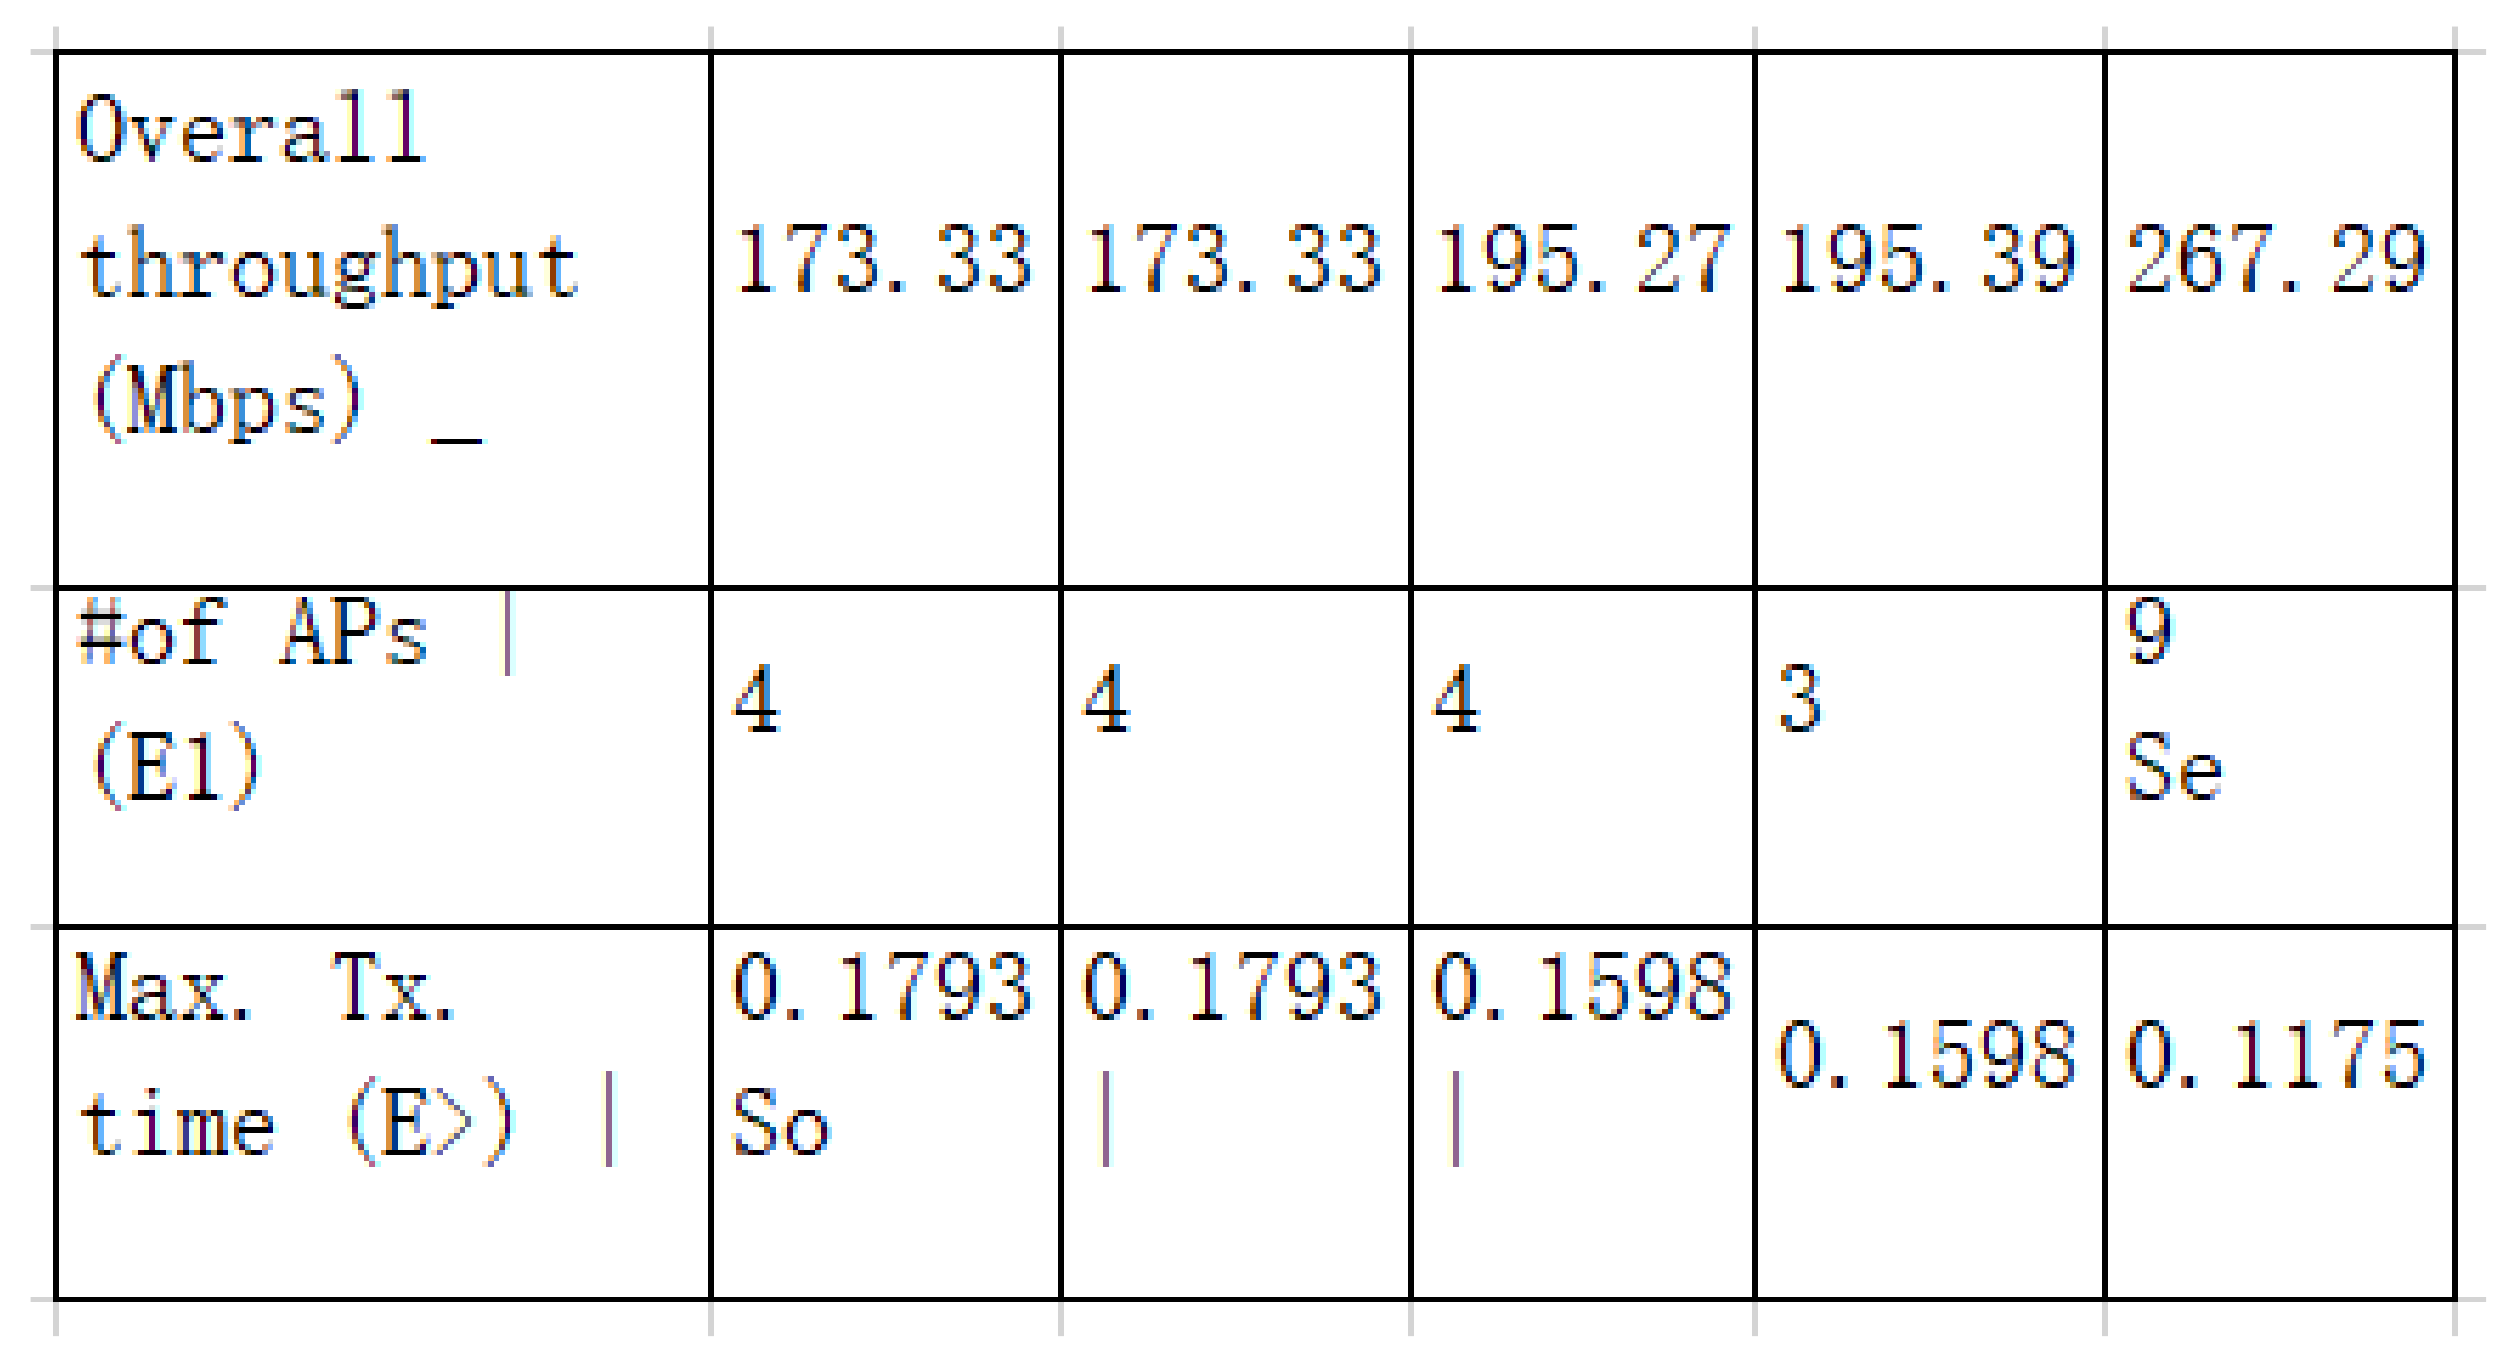
- Convert the list to the Excel table E using openpyxl package and output it. Figure 9 shows this Excel file.
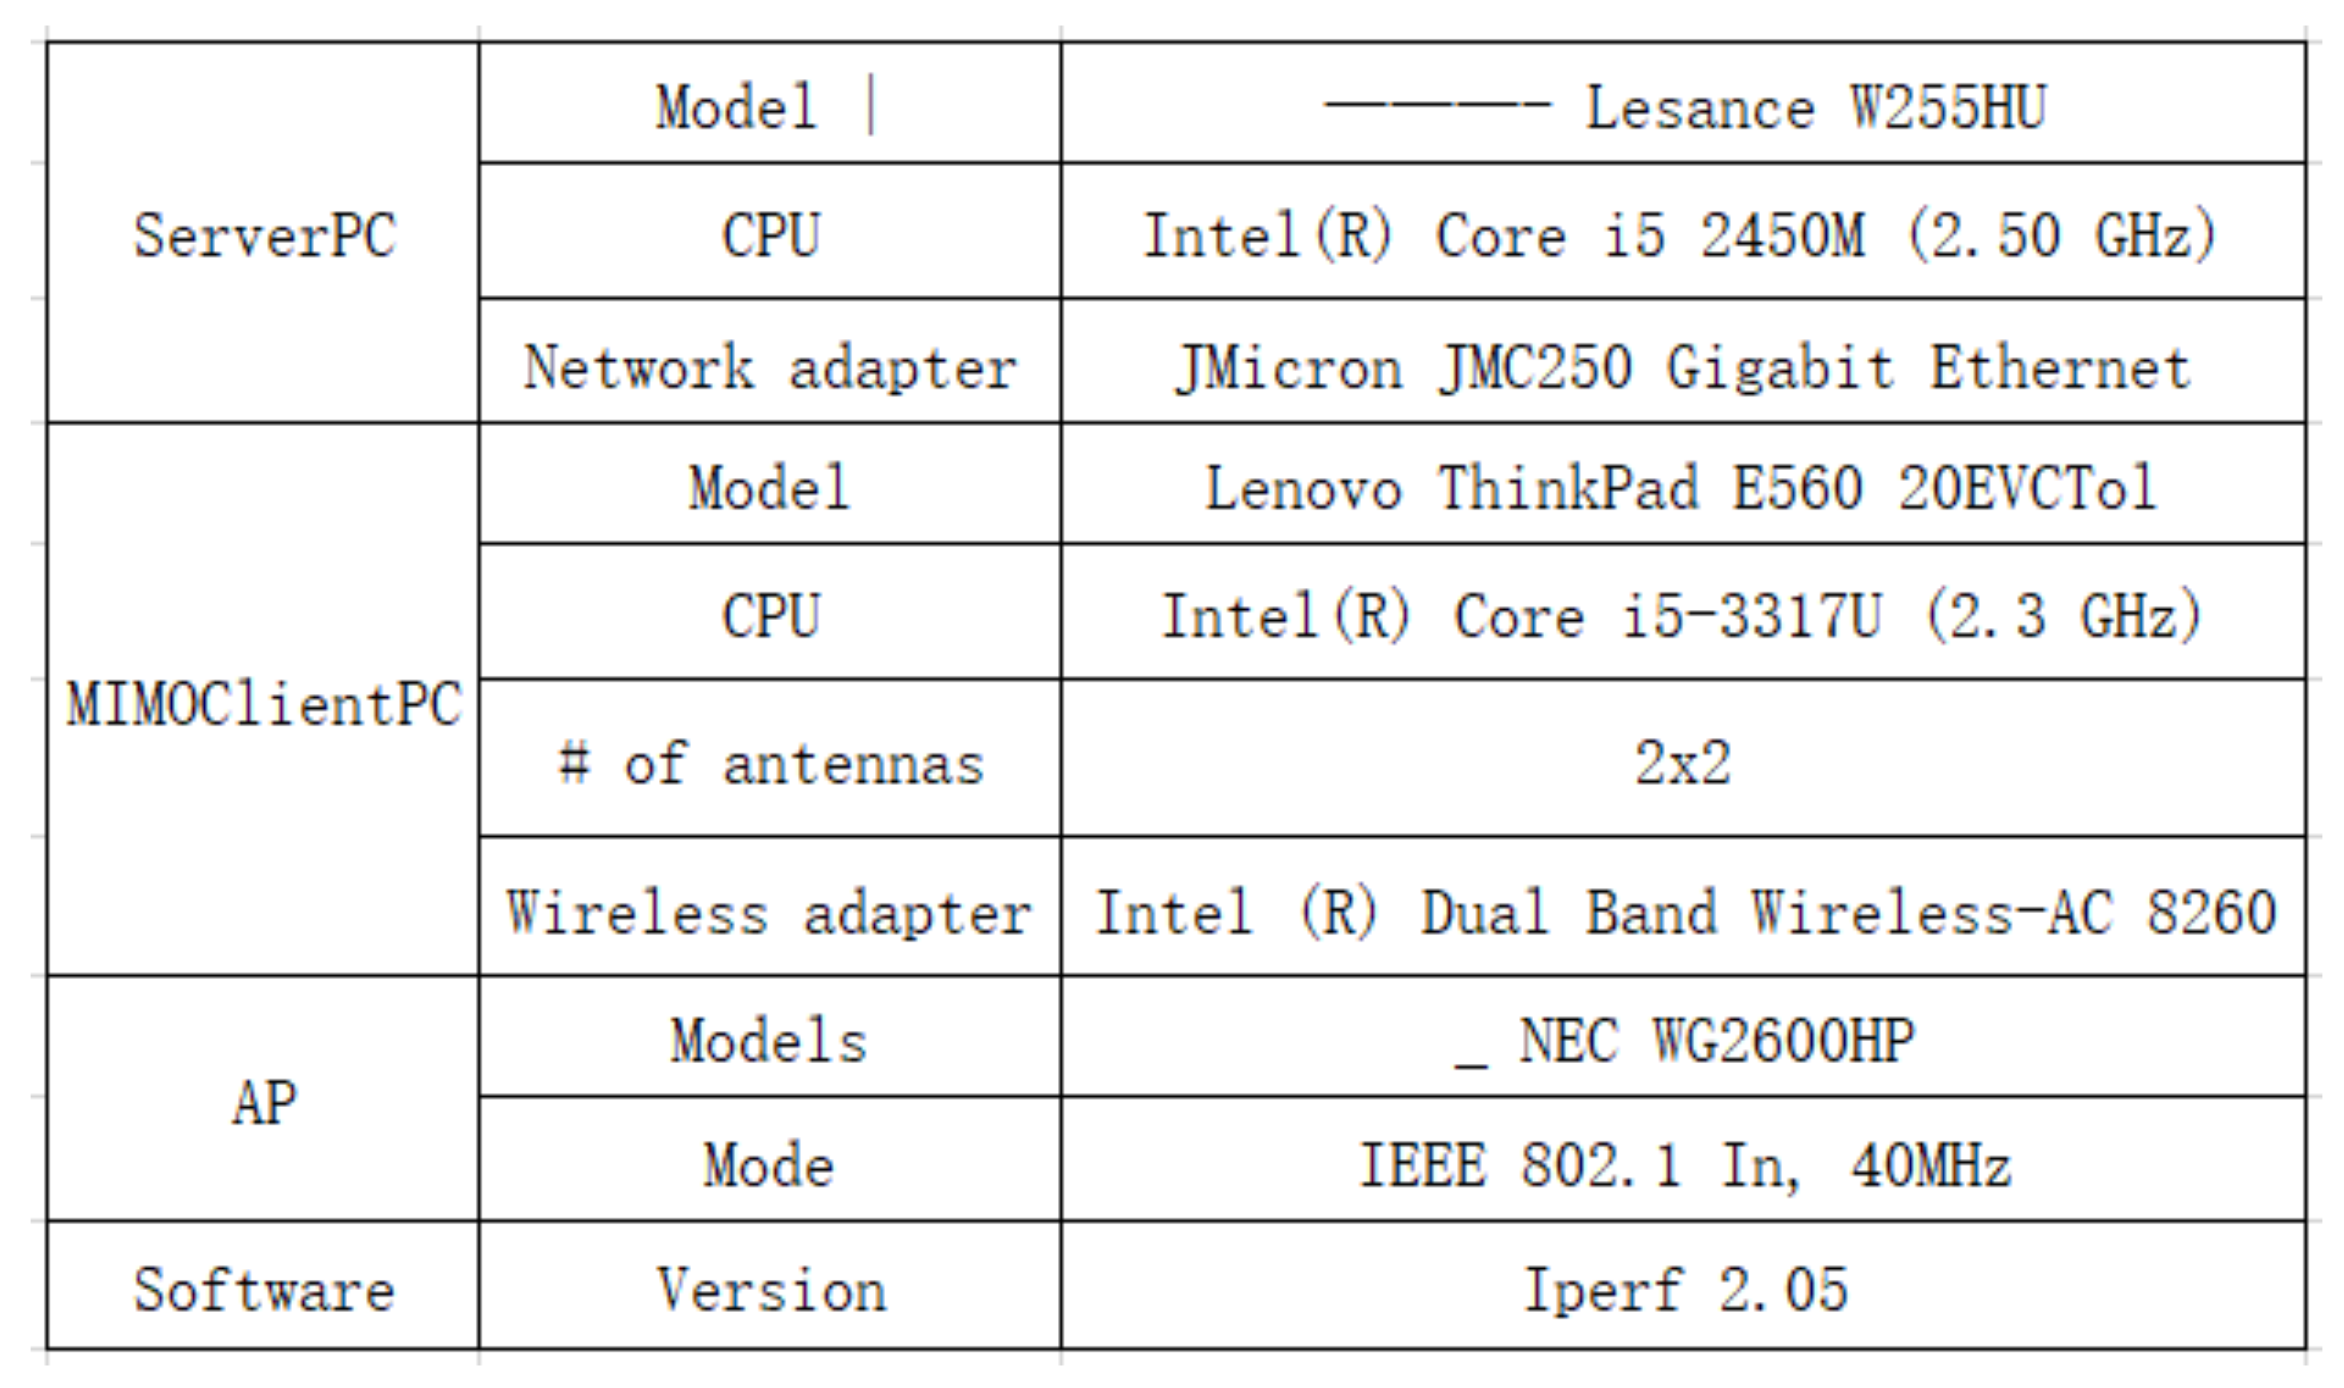
- (21)
- Merge the cells corresponding to the same node in the tree in step (18) into one cell in the Excel table E using the openpyxl package, and output it. Figure 10 shows the final output Excel file.
6. Evaluations
6.1. Accuracy Index
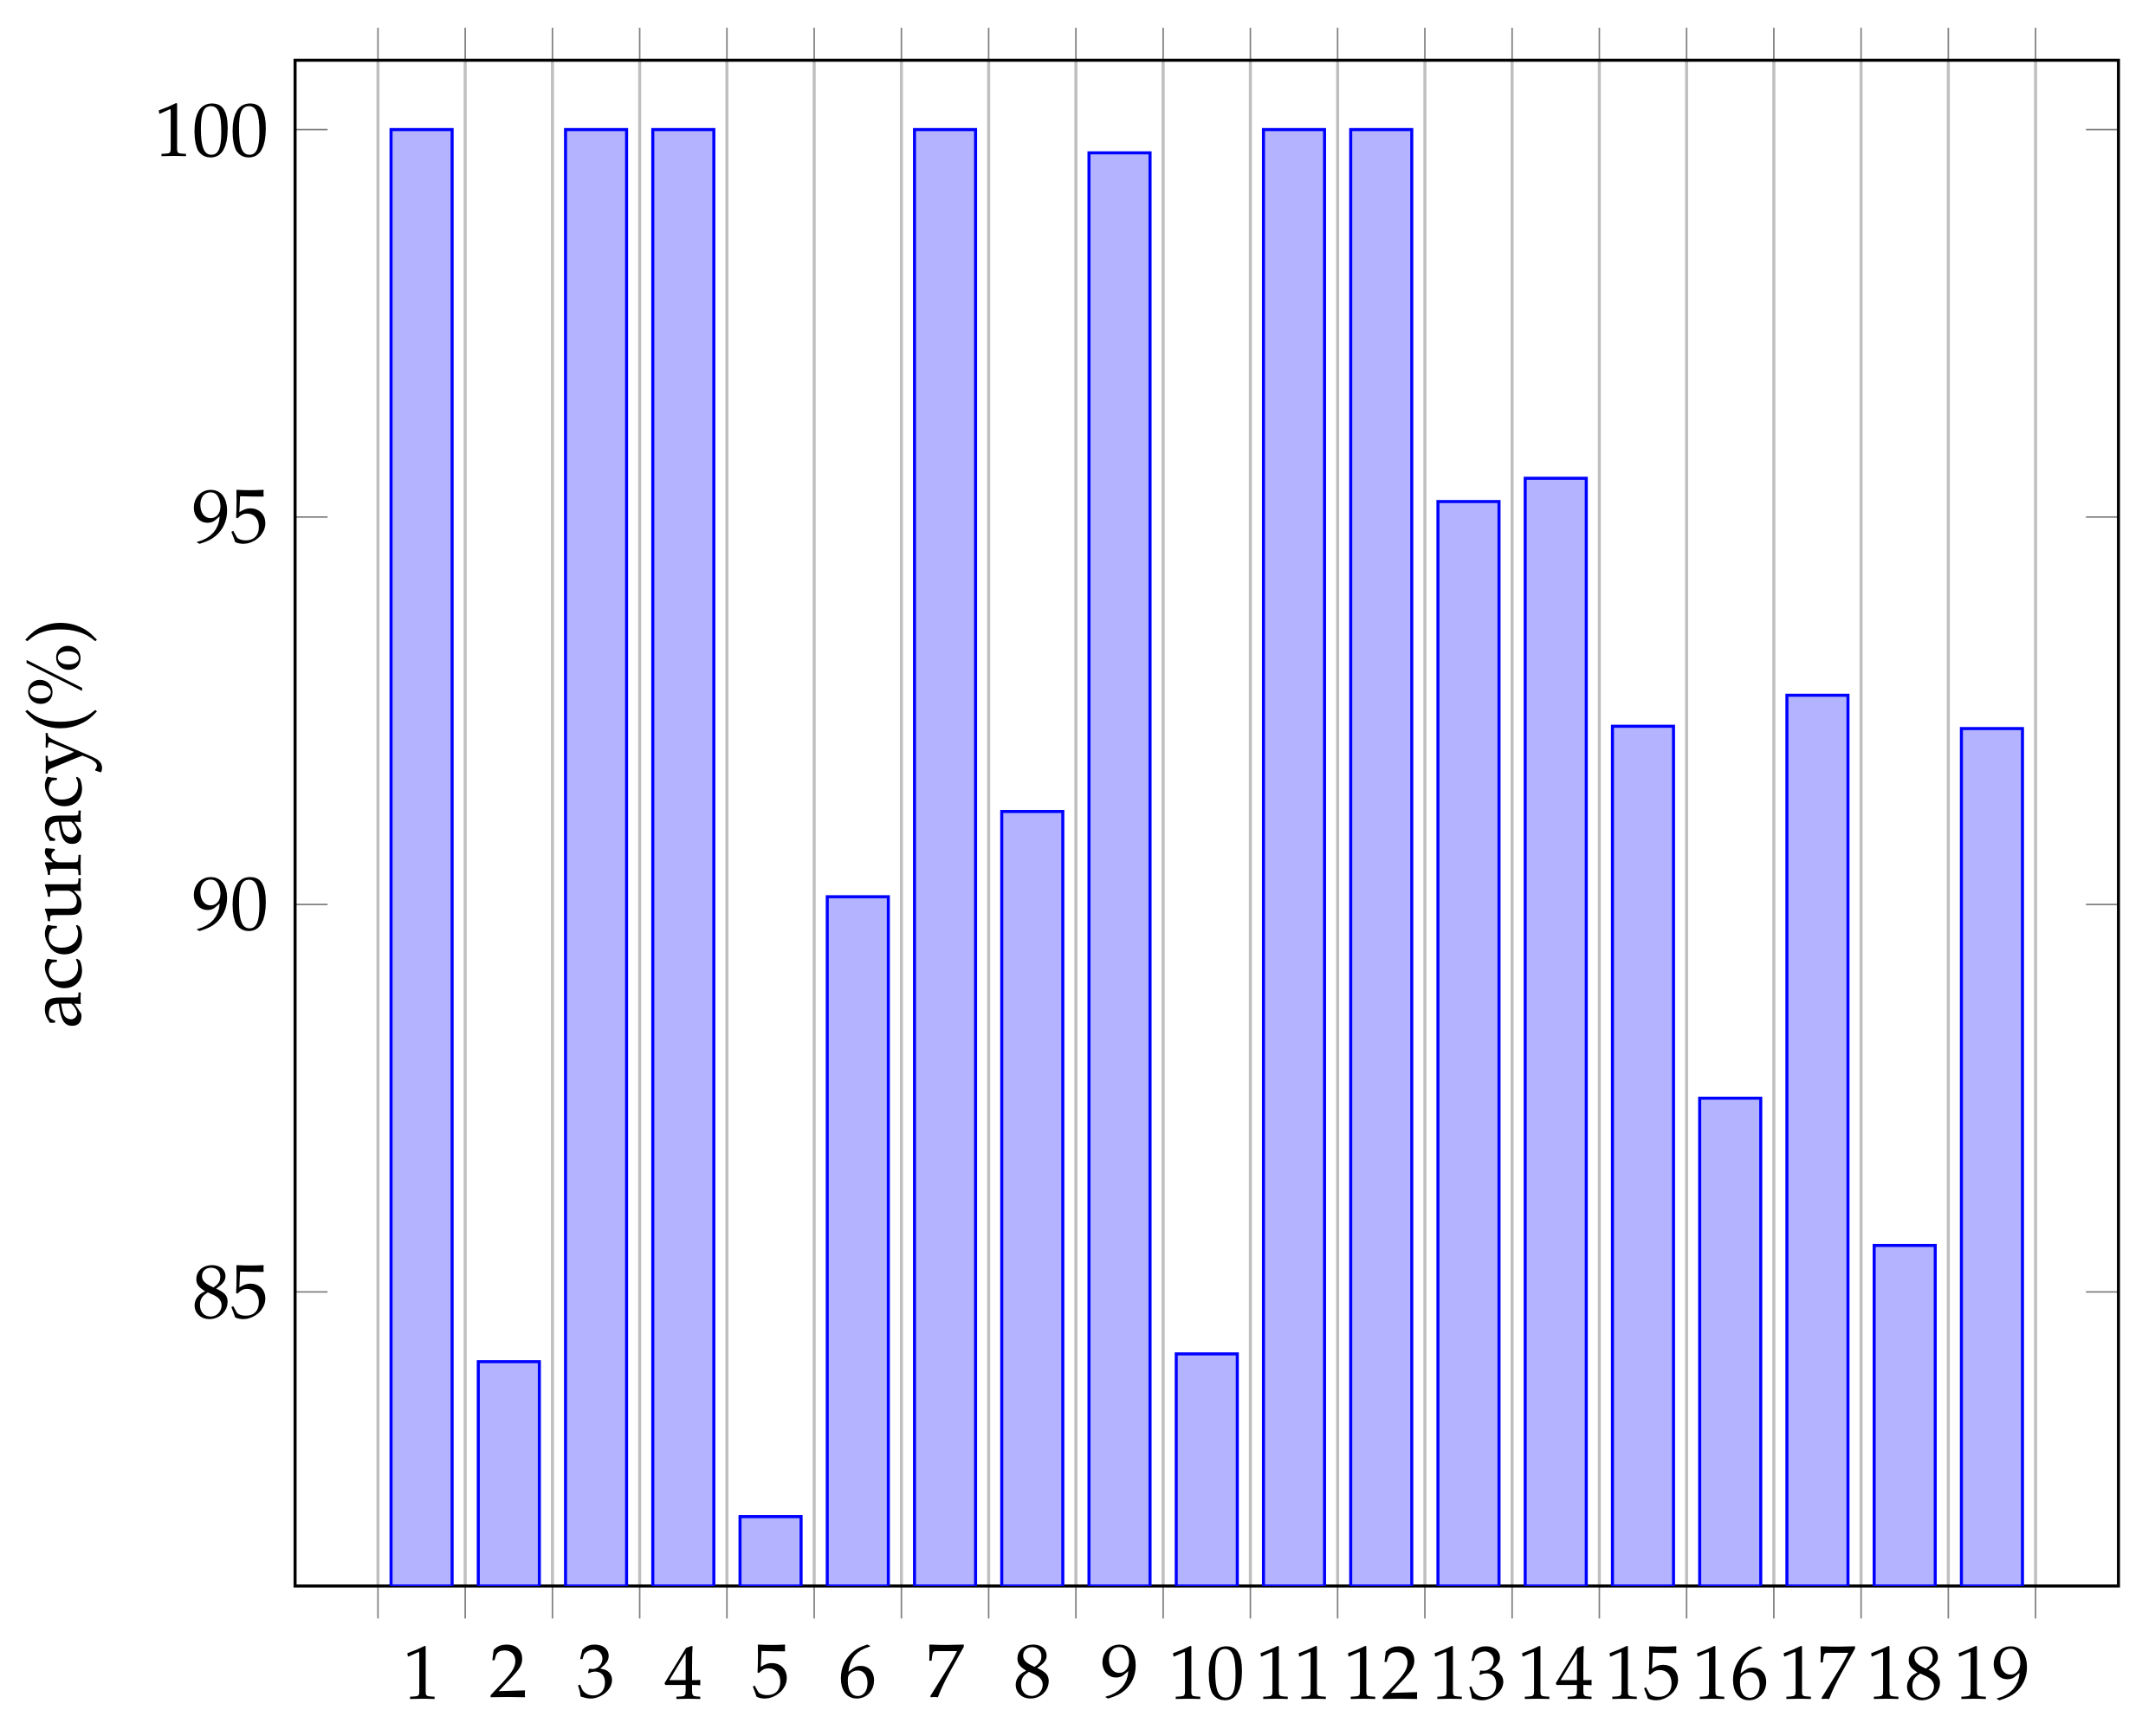
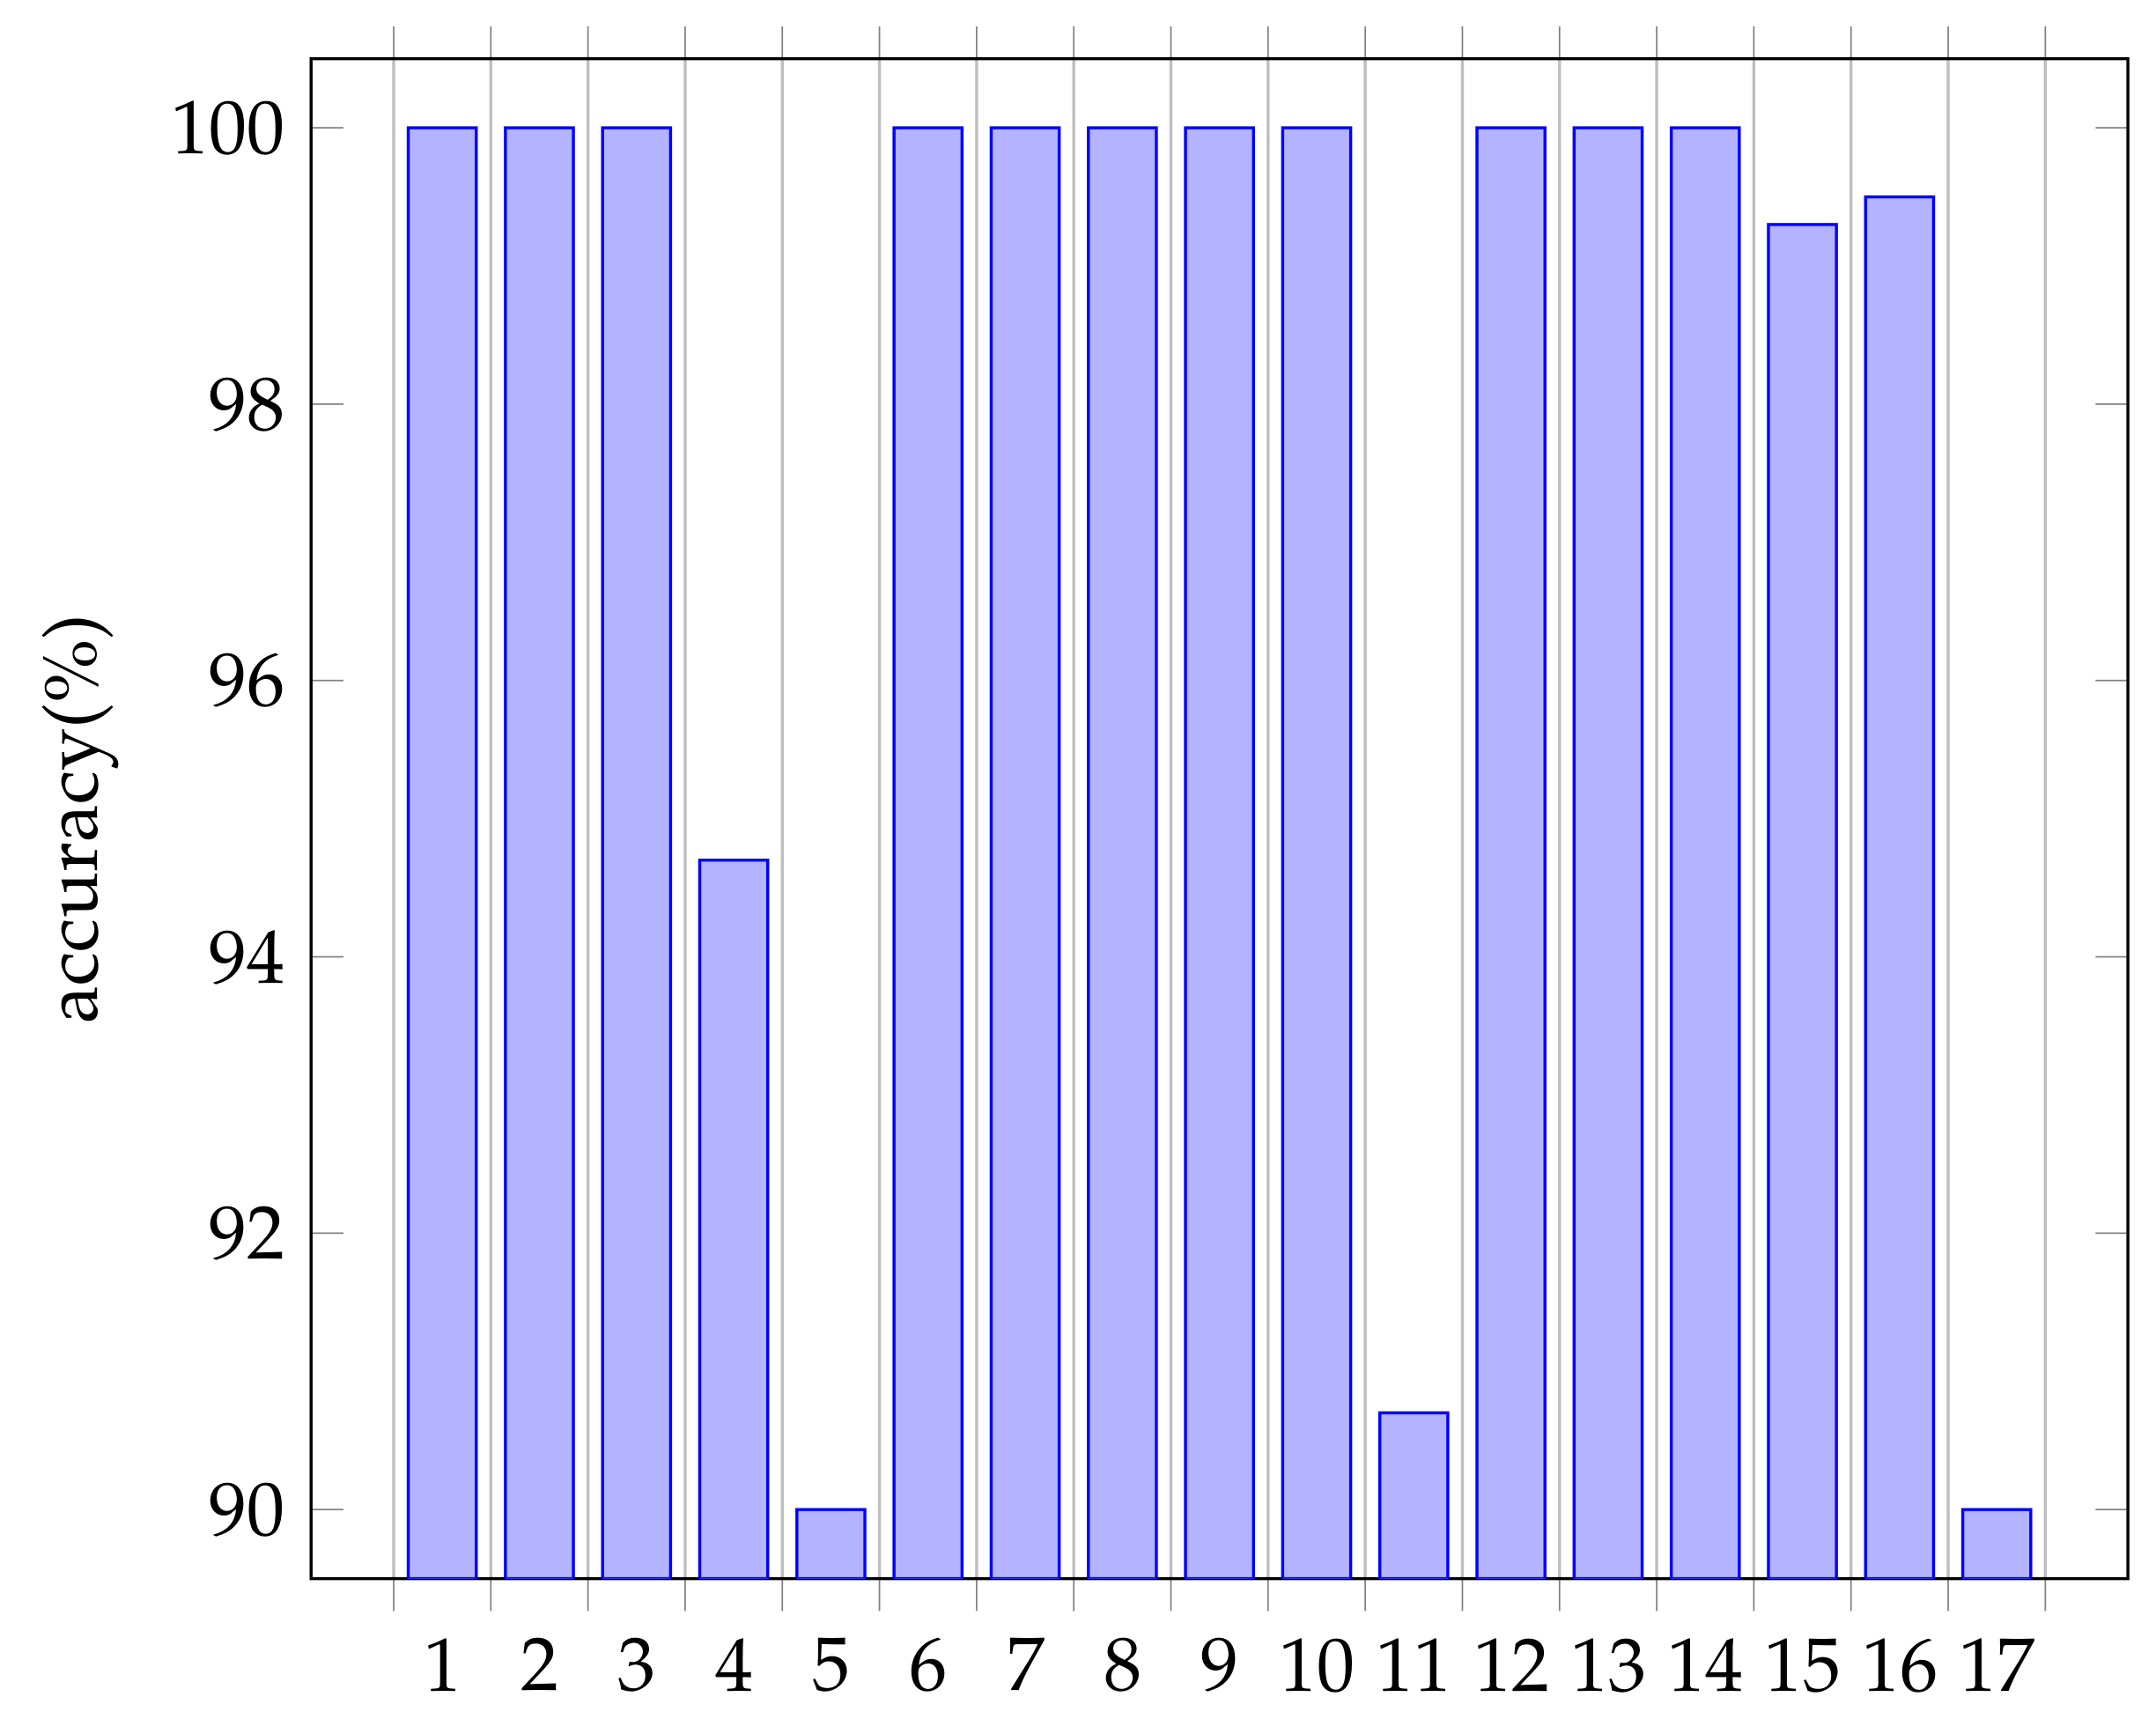
6.2. Character Recognition Accuracy Results
6.2.1. Table Image at 2
6.2.2. Reasons for Table Image at 5
6.2.3. Reasons for Table Image at 10
6.2.4. Reasons for Table Image at 16
6.2.5. Reasons for Table Image at 18
6.3. Conclusion of This Section
- When a cell size is small, it often recognizes the border as a character.
- It is difficult to correctly recognize vertical texts, subscripts, and Greek letters.
- It is more difficult to recognize a scanned image than a screenshot because it is usually blurry and has more noise.
6.4. Comparison with Microsoft Software
6.5. Comparison with Nanonets Software
7. Conclusions
Author Contributions
Funding
Data Availability Statement
Conflicts of Interest
References
- What is Digital Transformation (DX)? Available online: https://www.netapp.com/devops-solutions/what-is-digital-transformation/ (accessed on 2 July 2022).
- Ohta, M.; Yamada, R.; Kanazawa, T.; Takasu, A. A cell-detection-based table-structure recognition method. In Proceedings of the ACM Symposium on Document Engineering 2019, Berlin, Germany, 23–26 September 2019. [Google Scholar]
- Phan, H.H.; Dai Duong, N. An Integrated Approach for Table Detection and Structure Recognition. J. Inf. Technol. Commun. 2021, 1, 41–50. [Google Scholar] [CrossRef]
- Sahoo, R.; Kathale, C.; Kubal, M.; Malik, S. Auto-Table-Extract: A System To Identify And Extract Tables From PDF To Excel. Int. J. Sci. Technol. Res. 2020, 9, 217. [Google Scholar]
- Amitha, S.; Mithun, M.; Chandana, P.C.; Borkakoty, M.; Adithya, U. Conversion of Image To Excel Using Ocr Technique. Int. Res. J. Mod. Eng. Technol. Sci. 2020, 4, 3743–3747. [Google Scholar]
- Nagy, G.; Seth, S. Table headers: An entrance to the data mine. In Proceedings of the 2016 IEEE 23rd International Conference on Pattern Recognition (ICPR), Cancun, Mexico, 4–8 December 2016. [Google Scholar]
- Li, M.; Cui, L.; Huang, S.; Wei, F.; Zhou, M.; Li, Z. Tablebank: A benchmark dataset for table detection and recognition. arXiv 2019, arXiv:1903.01949. [Google Scholar]
- Pulli, K.; Baksheev, A.; Kornyakov, K.; Eruhimov, V. Realtime Computer Vision with OpenCV. Queue 2012, 10, 40–56. [Google Scholar] [CrossRef]
- A Table Detection, Cell Recognition and Text Extraction Algorithm to Convert Tables in Images to Excel Files. Available online: https://towardsdatascience.com/ (accessed on 10 July 2022).
- How to Convert a Table of Paper Data to Excel Data? We Can Scan Tables by Use Office Application in Smartphone. Available online: https://dekiru.net/article/21950/ (accessed on 10 September 2022).
- Scan and Edit a Document. Available online: https://support.microsoft.com/en-us/office/scan-and-edit-a-document-7a07a4bd-aca5-4ec5-ba73-4589ac8b9eed (accessed on 10 September 2022).
- Table Detection, Table Extraction & Information Extraction Using DL. Available online: https://nanonets.com/blog/table-extraction-deep-learning/ (accessed on 10 September 2022).


Publisher’s Note: MDPI stays neutral with regard to jurisdictional claims in published maps and institutional affiliations. |
© 2022 by the authors. Licensee MDPI, Basel, Switzerland. This article is an open access article distributed under the terms and conditions of the Creative Commons Attribution (CC BY) license (https://creativecommons.org/licenses/by/4.0/).
Share and Cite
Shi, C.; Funabiki, N.; Huo, Y.; Mentari, M.; Suga, K.; Toshida, T. A Proposal of Printed Table Digitization Algorithm with Image Processing. Algorithms 2022, 15, 471. https://doi.org/10.3390/a15120471
Shi C, Funabiki N, Huo Y, Mentari M, Suga K, Toshida T. A Proposal of Printed Table Digitization Algorithm with Image Processing. Algorithms. 2022; 15(12):471. https://doi.org/10.3390/a15120471
Chicago/Turabian StyleShi, Chenrui, Nobuo Funabiki, Yuanzhi Huo, Mustika Mentari, Kohei Suga, and Takashi Toshida. 2022. "A Proposal of Printed Table Digitization Algorithm with Image Processing" Algorithms 15, no. 12: 471. https://doi.org/10.3390/a15120471