1. Introduction
Analysis of the structure and dynamic behavior of complex multiparameter systems requires information concentration. When solving the tasks such as evaluating the state of a complex system, monitoring changes, and comparing systems, it is important to not only generate a compact description of the analyzed system but also make it easily interpreted for the decision maker. Many researchers showed that cognitive visualization significantly increases the efficiency of interpreting complex data [
1,
2,
3,
4]. The modern practice of data mining [
5], including graph mining, uses a number of graphical notations that allow for making decisions more quickly.
The technique of visualizing complex systems can be based on structural matching of the relevant entities, forming structures and hierarchies of different objects—or it can be based on their semantic linking, forming concept networks, e.g., ontologies [
6]. During graph mining, one big graph can be divided into subgraphs, which allows for formulating tasks such as finding typical or non-typical subgraphs for further decision making. This allows for using the regular way of describing graph vertices and edges (e.g., adjacency matrix). However, these methods do not work for describing a complex, multiparameter system or for the decision-making task for analyzing an array of such systems. This requires generalizing the raw source data that should be visualized for the decision maker. Regular methods of dimensionality reduction of a parametric space (e.g., converting to Euclidean space and principal component analysis visualization) hide the information of the system’s structure, which makes interpreting visualization difficult. In practical decision-making situations requiring visualizing dynamics of a group of multiparameter systems (e.g., employees, students, projects, tender applications, a company, etc.), they are often visualized one by one, detailing the structure of each system. This further complicates the analysis and decision making. We think that an effective approach for these tasks requires a visualization method that allows for concentrating information about complex systems described by heterogeneous datasets into a compact image but also allows for monitoring dynamics of key variables in the analyzed pool of objects. In this article, we propose such an approach and study a case of its usage.
The method should be used to analyze different kinds of systems: technical, social, biological, etc. The more complex the analyzed system is, the more difficult it is to represent it as a compact image while preserving the structural information about the system. A common example of this kind of system is a person in the context of a particular activity (business, learning, etc.): for a good description, we need a parametric model of the activity and its participants and a method of comparison with other people in the target group to simplify monitoring the dynamics, selection, and management of people during their activities. Another example of a complex system for visualization is university curricula and the actions of the collective of students according to their curriculum in order to master their field of study. The emphasis will be on the cognitive visualization of the set of analyzed systems (from curricula to learning situations of students) and generating recommendation for decision maker both in the context of the case study and regarding the general usage of the proposed method.
The goal of this article is describing the UGVA method for visual comparison of complex multiparameter systems while taking into account dynamics of their parameters (activity or behavior).
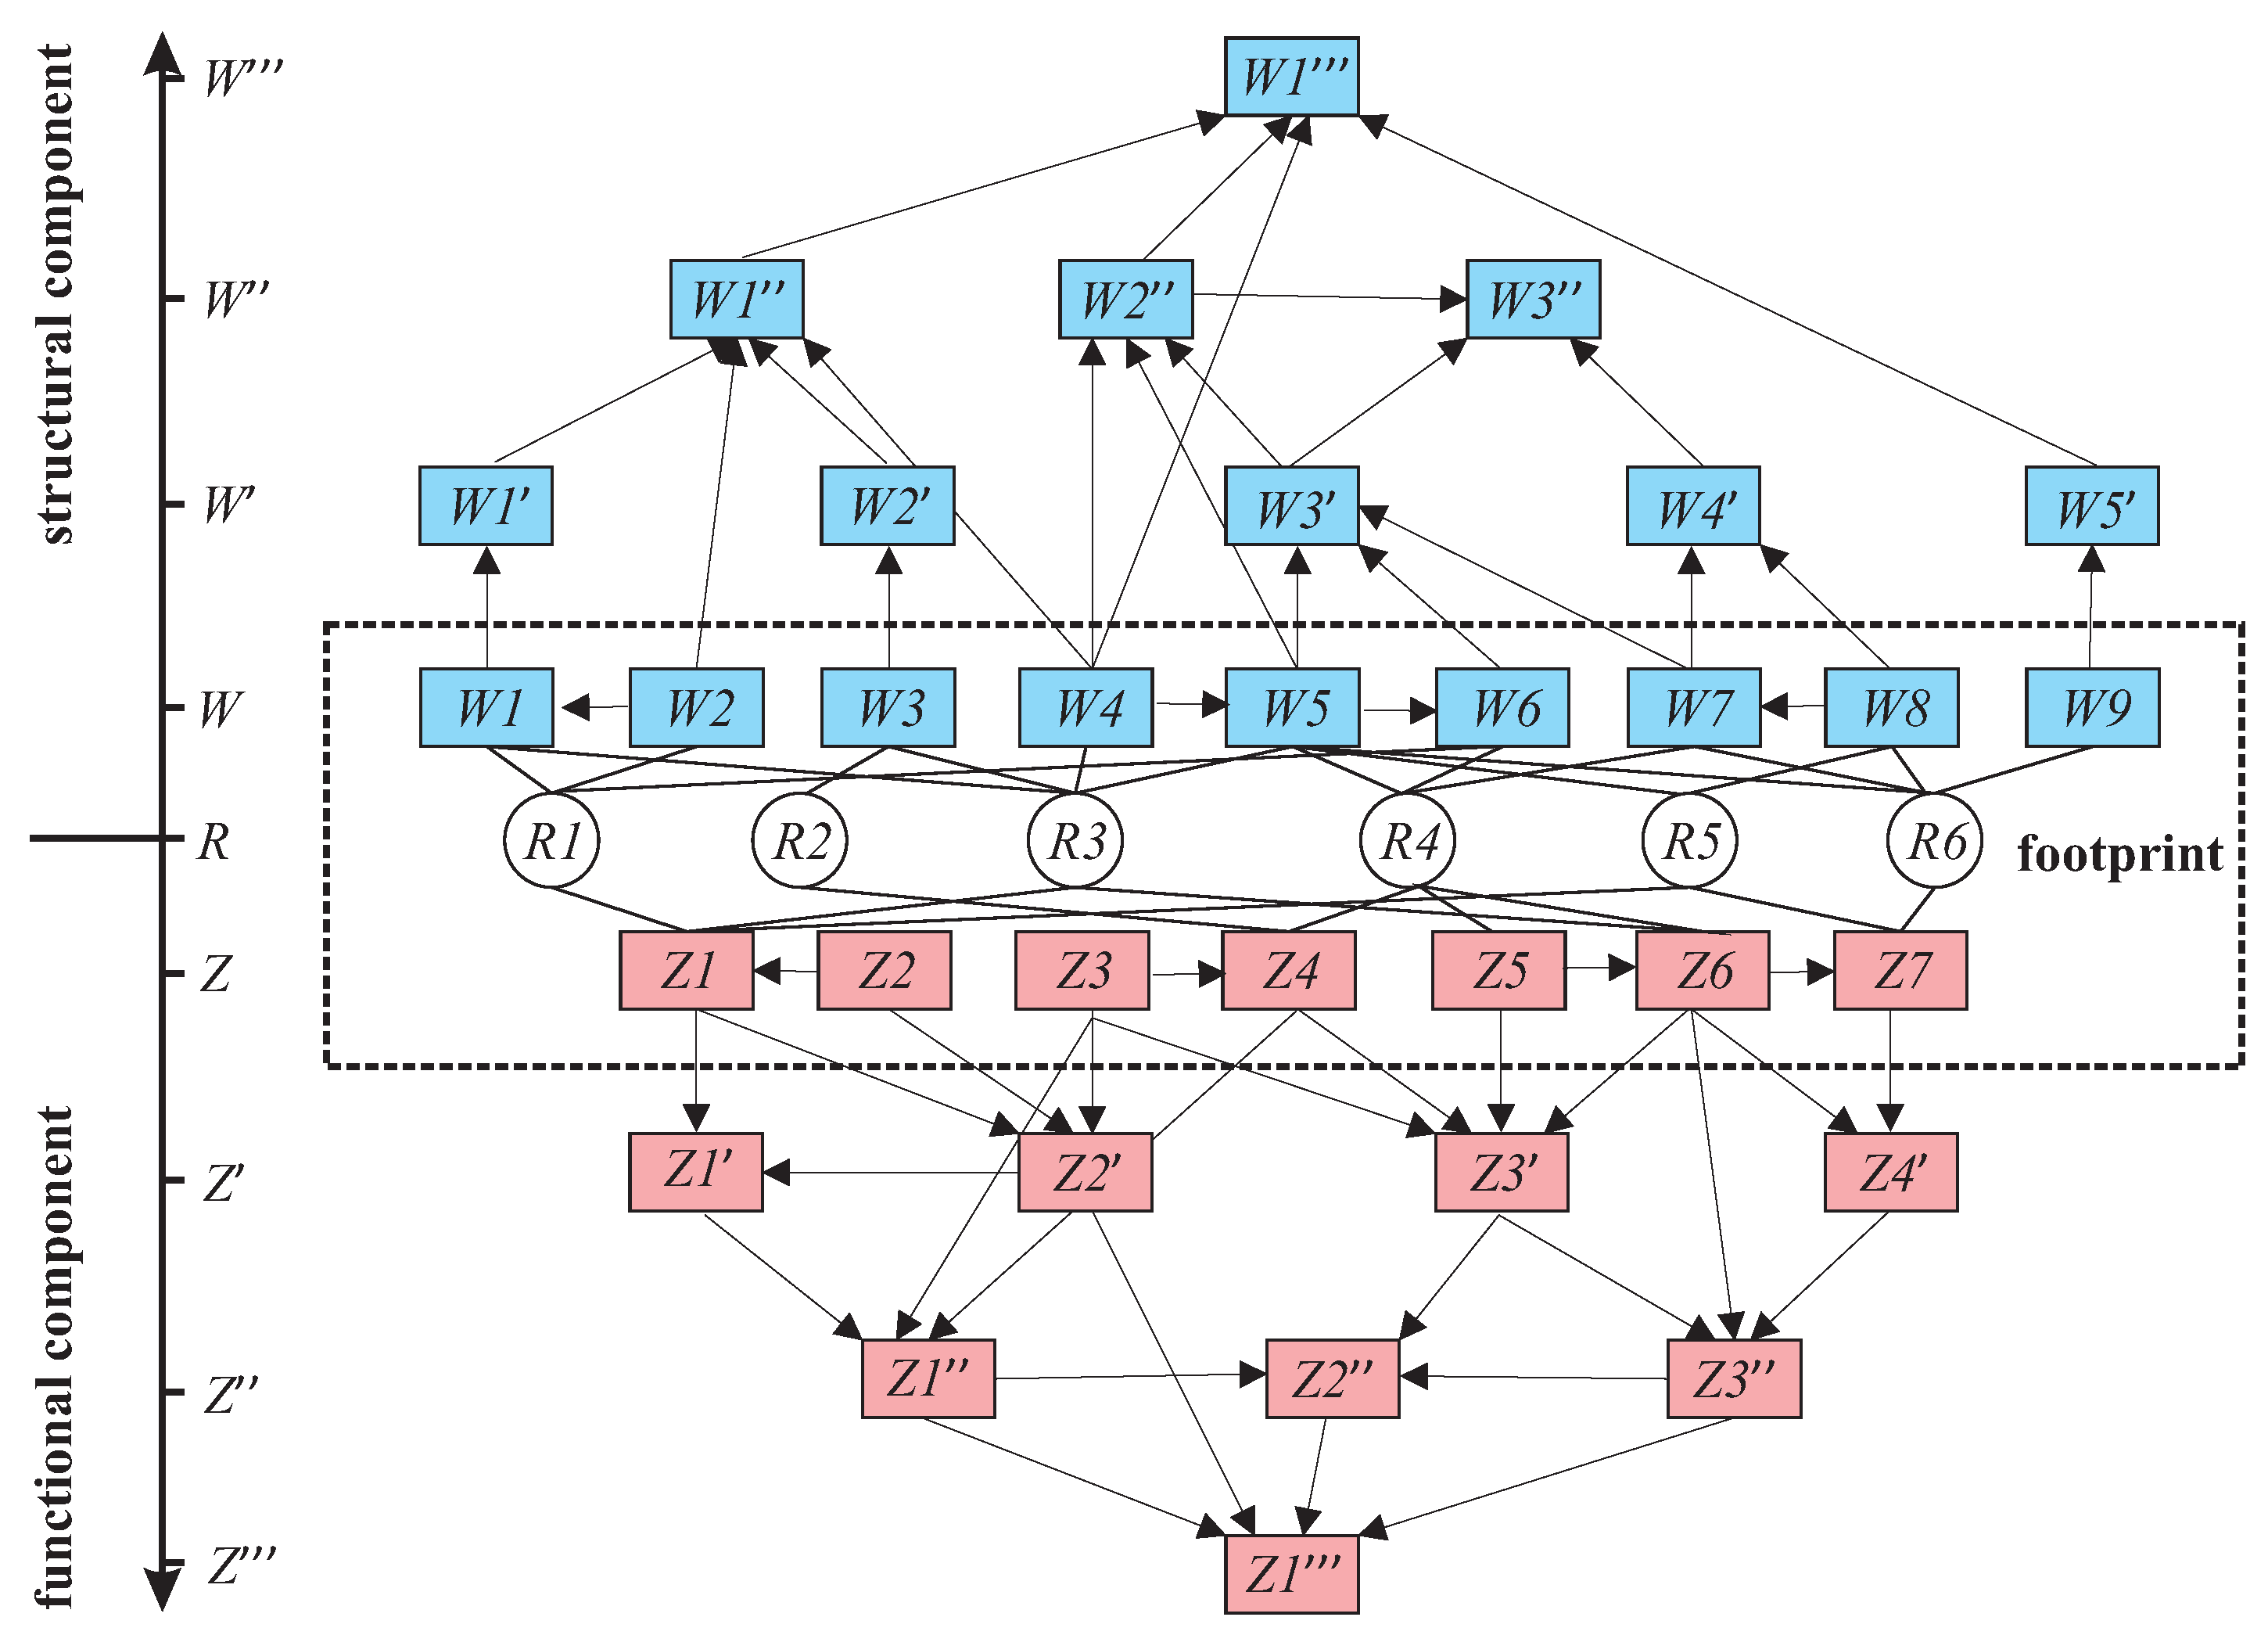
Describing complex objects and systems is based on their presentation as a set of entities (subsystems, elements, functions, metrics) that are linked by certain relationships. Such objects can be represented as a graph , where Q and L are non-empty sets of vertices and edges, respectively. Each vertex and edge can be described by their own set of parameters; the edges can be homogeneous or heterogeneous. Consider graph G, which is a composition of several sets of structures:
—the graph of structural decomposition of the analyzed system (normally, structural models of system form the hierarchy of its parts and use edges like aggregation or composition);
—graph of the functional component of the analyzed system (normally, as a tree of functions or goals);
—graph of the development of a particular process in the system or changing the state (trajectory) of an actor along the “bottom layer” of the elements of graphs
and
(representation of individual actions), including temporal characteristics of this process (normally, it is a trajectory or footprint; see
Figure 1).
We define
G as a tuple (
1):
where
is the adjacency matrix for the different parameters in
G. This representation is interesting because, having the data from the
layer, we can interpret the current situation for the analyzed system (from the semiotic triangle syntax–semantics–pragmatics [
7]) and assess its dynamics. The components of
G and values in
, in practice, can be part of different datasets.
We need a visual representation that allows for both demonstrating all the components of
G and the dynamics of this graph structure. Human decision making, according to Anokhin’s theory of functional systems [
8], is based on afferent synthesis mechanisms, combining experience (memory), the current situation (situational afferentation), and goals (dominating motivations). Considering all temporal aspects (the past, present, and future) allows for a complex description of the source data for decision making following a single line of logic. Therefore, the structure of the visual image should, if necessary, allow for displaying different states of the analyzed systems depending on the selected parameter or their set and letting the user see the dynamics of the components of
G. If the basis for selecting elements is the functional, not the structural component, then this image will be showing the activity.
This kind of data organization can be used, for example, to describe the process of managing a portfolio of projects (the experience that the team acquired while working on previous projects, the current data about key indicators, and a plan of implementing current projects), for which the analyzed systems are projects and teams and implementing them. The analysis tasks in this situation are assessing a project’s potential, comparing similar projects, and monitoring the project’s state. The same principle can be applied to the tasks, such as team forming, competitive selection of proposals, personnel motivation, and so on.
These datasets are linked on the semantic level and can help the decision maker only if they are combined under a single line of logic. Assessing and comparing complex, compositional structures is a hard task because they often use different approaches to data formalization, and each object in the group can have individualized data. It is possible to assess the values of , , and separately and project them into an 3-dimensional Euclidean space, but the resulting image will have little information for making a substantiated decision, especially if the number of analyzed systems is limited. So we aimed to develop an approach to visualizing complex data structures that will more clearly demonstrate their specifics.
The rest of the article is organized as follows. In
Section 2, we discuss the existing approaches to cognitive visualization.
Section 3 describes the UGVA method.
Section 4 illustrates its work on the example of monitoring the learning process in a higher education institution.
Section 5 discusses the experience and formulates recommendations for using the UGVA method.
Section 6 contains the conclusions of our study.
2. Related Work
Modern graph mining for complex datasets (such as the ones described above) is often done by artificial neural networks [
9]. However, this method does not allow for generalizing the resulting data as graphic images that can be used by humans in decision making. Therefore, after transforming the data [
10], they should be structured. At this stage, many graphic notations and approaches are used for showing complex, multiparameter systems; the most important of them are clusterization, mapping, radar-chart diagrams, glyphs, abstract pictograms and Chernoff faces [
11], dashboards, and cognitive maps. Their analysis is summarized in
Table 1. It can be seen that the majority of these notations were designed to represent static objects, generalized in low-dimensional spaces, or give a detailed description of one object. If visualizing dynamics of the complex object or system is necessary as well as visualizing its structure, visualization with current methods is difficult.
Cognitive visualization helps the decision maker quickly interpret and assess the state of a complex system (or a set of systems) using figurative thinking. Chernoff showed [
15] that a human recognizes the difference between known objects that were around during human evolution, such as human faces, much more easily than the difference between abstract images. The original method of Chernoff faces is a way to map data about a complex, multiparameter system such as a human face, which has a symmetry axis and allows for displaying quantitative and qualitative parameters (up to 18 parameters when keeping vertical symmetry and 36 parameters without it [
18]). This method was improved using color coding [
19], animating non-deterministic parameters, radically lowering the number of coded parameters to show emotion as an integral assessment of the analyzed system [
20], and replacing a human face with other biological images (e.g., [
21]).
One of the major disadvantages of the method of Chernoff faces is its aesthetic side: major disproportions or total disappearance of some elements destroys the holistic perception of the resulting image [
22]. Filimonov [
23] supposed an approach to overcome this limitation by replacing the face by a whole human body image (bodycoder), based on the bionic principles of the human body (which started from the ideas of Homo vitruvianus of Leonardo da Vinci and modulor of Le Corbusier [
24]). Another enhancement is including a wholesome, meaningful emotion in the image, introduced by Jones [
20]. Combining these approaches, we can get additional symmetry axes [
23] and separate parametric (body) and evaluation/goal (face) zones of the generated image; we also can add artifacts, showing qualitative parameters specific to the current decision-making task, and increase the “acceptability” of the image even when it contains major disproportions. However, this image still represents a static state of the analyzed system; it does not solve the task of including dynamics.
During further development of this approach to cognitive visualization, we formed a hypothesis: Adapted anthropomorphic images allow for visualizing activity of complex multiparameter systems, and their efficiency is better compared with the alternative methods of visual data mining for the tasks of assessing, comparing, and monitoring the activity of complex systems.
3. Method
3.1. UGVA Method and the Image Structure
The methodology of system analysis implies that while analyzing complex, multiparameter systems, the analysis methods should allow for combining both the whole and its parts in their dynamics into a single entity [
25]. Therefore, the developed method of cognitive visualization must follow the principles of context dependency, complexity, clarity (expressivity), and visual harmony of the image (balance). As with every method of data mining, it should not require the decision maker to learn complex methods to interpret the image.
The Unified Graphic Visualization of Activity (UGVA) method is a method of visual representation of a profile of complex multiparameter system as an anthropomorphic image in order to demonstrate specifics of its functional (activity) and structural parameters and also to compare such profiles [
26]. It is based on the image of a human-like body, which is synthesized and displayed according to raw or generalized values of the key parameters of the analyzed system and can be overlaid with data necessary to make different decisions.
An image in the UGVA notation is structured along the set of axes mapping key parameters (criteria) or their groups (normally, these zones are in the limbs of the figure), zone of integral assessment of the system’s state (as a rule, the emotion on the face), coloring of the image elements, and additional artifacts. Each zone of the image is tied to a certain numeric parameter of the analyzed system that influences length, width, radius, and other parameters. Activity that is coded in the figure zones is represented by the types of data representation axes, symmetry type, and coloring. The image can be divided into three strata horizontally: low, middle, and high strata.
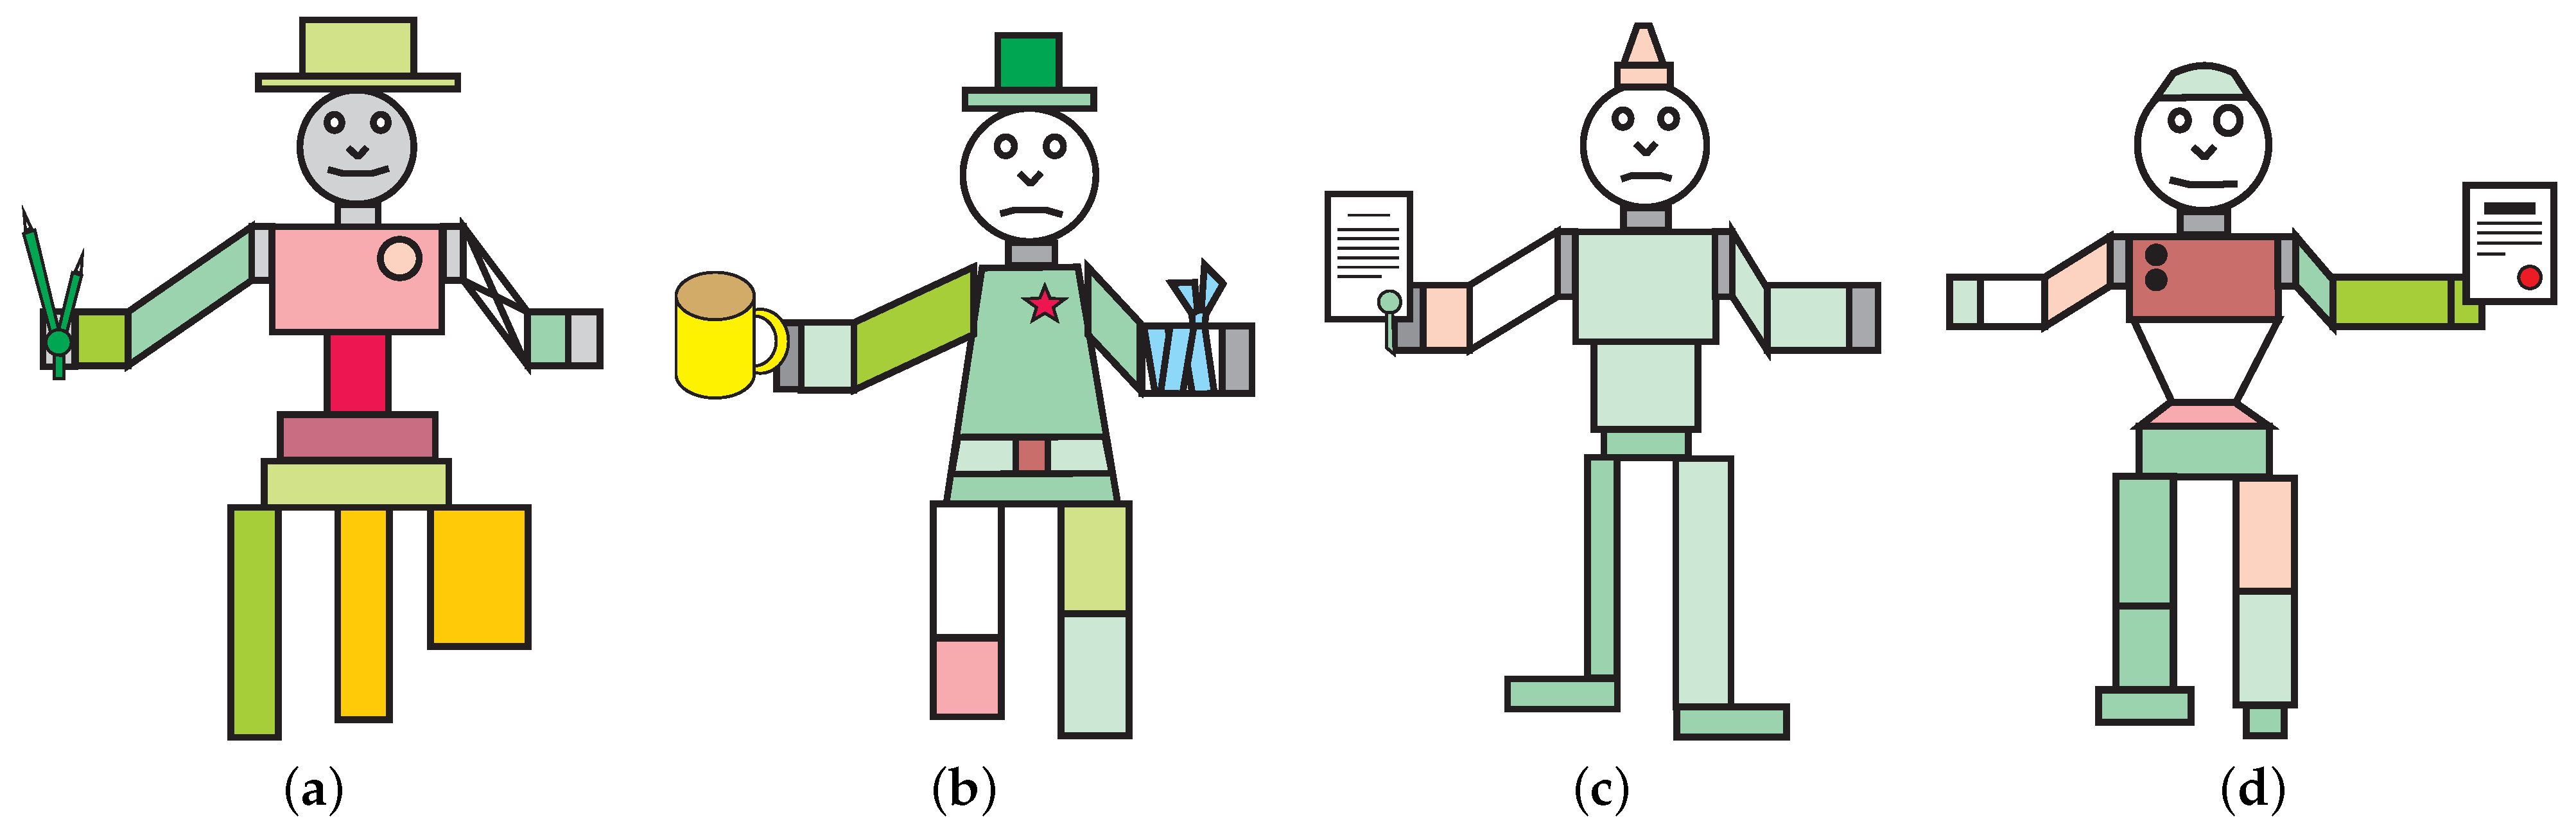
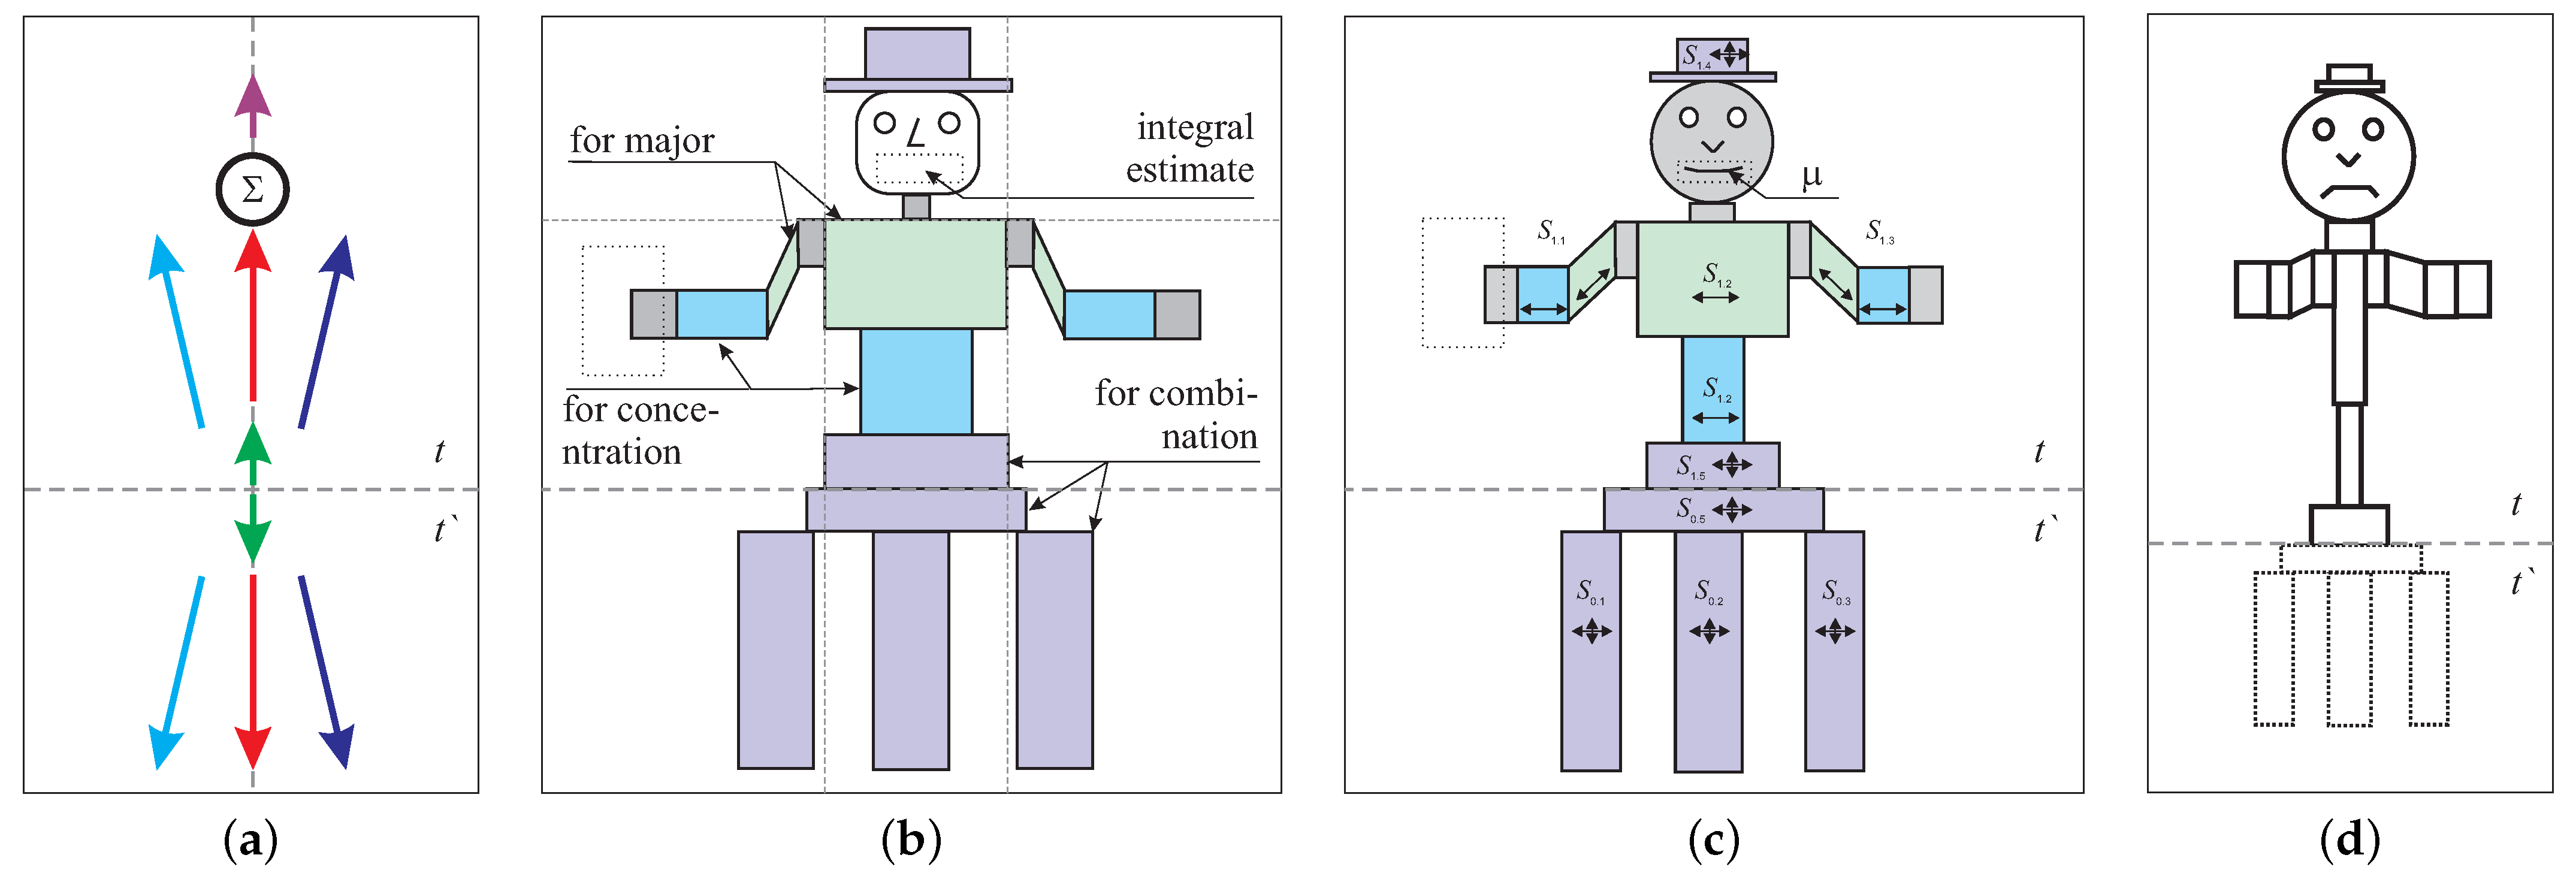
For example,
Figure 2 shows four images from different social domains that can be used for making a decision about the management of a workforce, learning process, and research. The first image (a) is an image of a graduate student who studies courses through an online intelligent tutoring system (ITS), which should not just control the learning process but also explain its decisions using intuitive pictures. The second image (b) shows the data about an employee of a company (installer), whose direct supervisor uses an intelligent decision-supporting system to receive advice on motivating employees according to their performance. The third image (c) represents a funding application for a scientific project. The fourth image (d) is an image of a laboratory researcher according to the university’s key performance indicators (KPI). These examples show individualized representation of particular systems in the UGVA notation.
Let us consider the specifics of visualizing activity in the UGVA images, paying attention to the data axes and symmetry types for the example of the student who is shown in
Figure 2a. The generalization of data, necessary for decision making, is based on the grouped components of the parametric model
, where
, measured at time
t. Then, each parameter
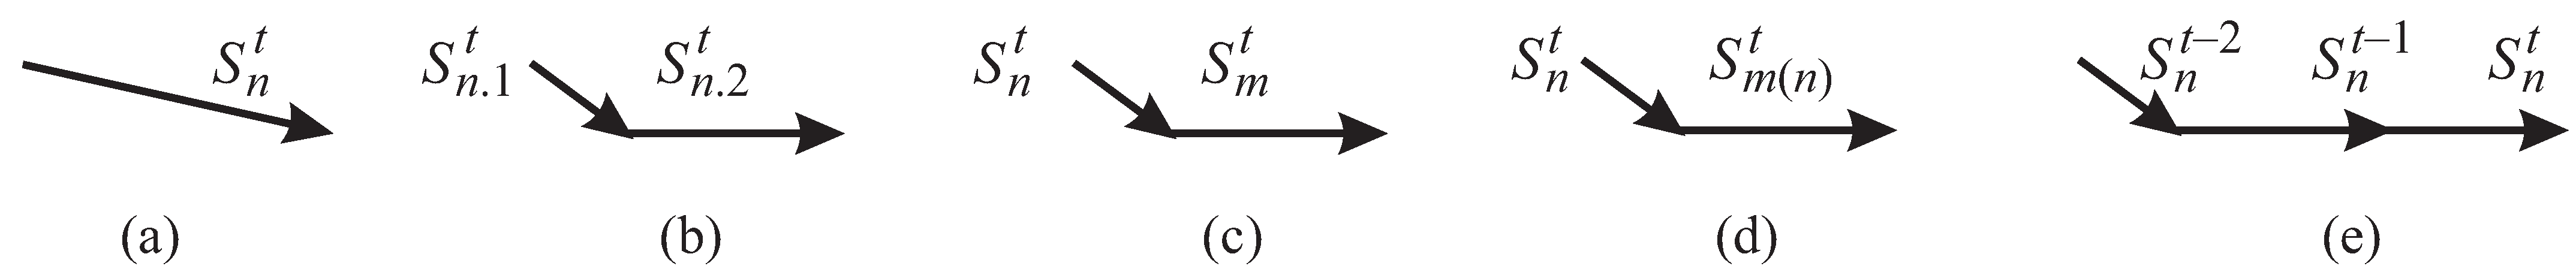
n will be associated with an axis or its part in some zone of the anthropomorphic image (typically, zones of limbs are used). Usually, each group of parameters is mapped on a separate axis. We have identified five types of axes (see
Figure 3):
Simple axis (type A)—quantitative value of the key indicator (parameter) is shown using one graphic primitive, e.g., a parallelogram that is a part of a limb with the student’s age mapped to its length and student’s average grade mapped to its height;
Composite structural axis (type B)—structural components of one quantitative parameter of a generalized indicator are shown using a sequence of graphic primitives, demonstrating specifics of their composition, e.g., the average grade in humanities can determine the length of the first limb segment, the average grade in natural sciences—the length of the second segment, and the average grade of engineering courses—the length of the third segment;
Composite heterogeneous axis (type C)—quantitative parameters of different are showing using a sequence of graphic primitives along one axis; they belong to different aspects of analysis, e.g., the length of the first primitive shows the average level of competency development for the given course, whereas the length of the second primitive—the average grade in the course;
Composite cause-effect axis (type D)—when the parameters of different , shown using a sequence of graphic primitives along one axis, is selected to demonstrate a cause–effect relationship between these parameters, e.g., the length of the first primitive shows the exam grade, whereas the length of the second primitive shows class attendance;
Composite temporal axis (type E)—each segment of an axis shows the value of the indicator in different times t, e.g., the average grade of the same student for different semesters.
If a parameter’s value is critically low, the relevant segment of the images can be omitted (which can lead to the omission of an entire axis or only a part of an axis) or marked by a special sign (e.g., in
Figure 2a, the parameter coded by left forearm is missing).
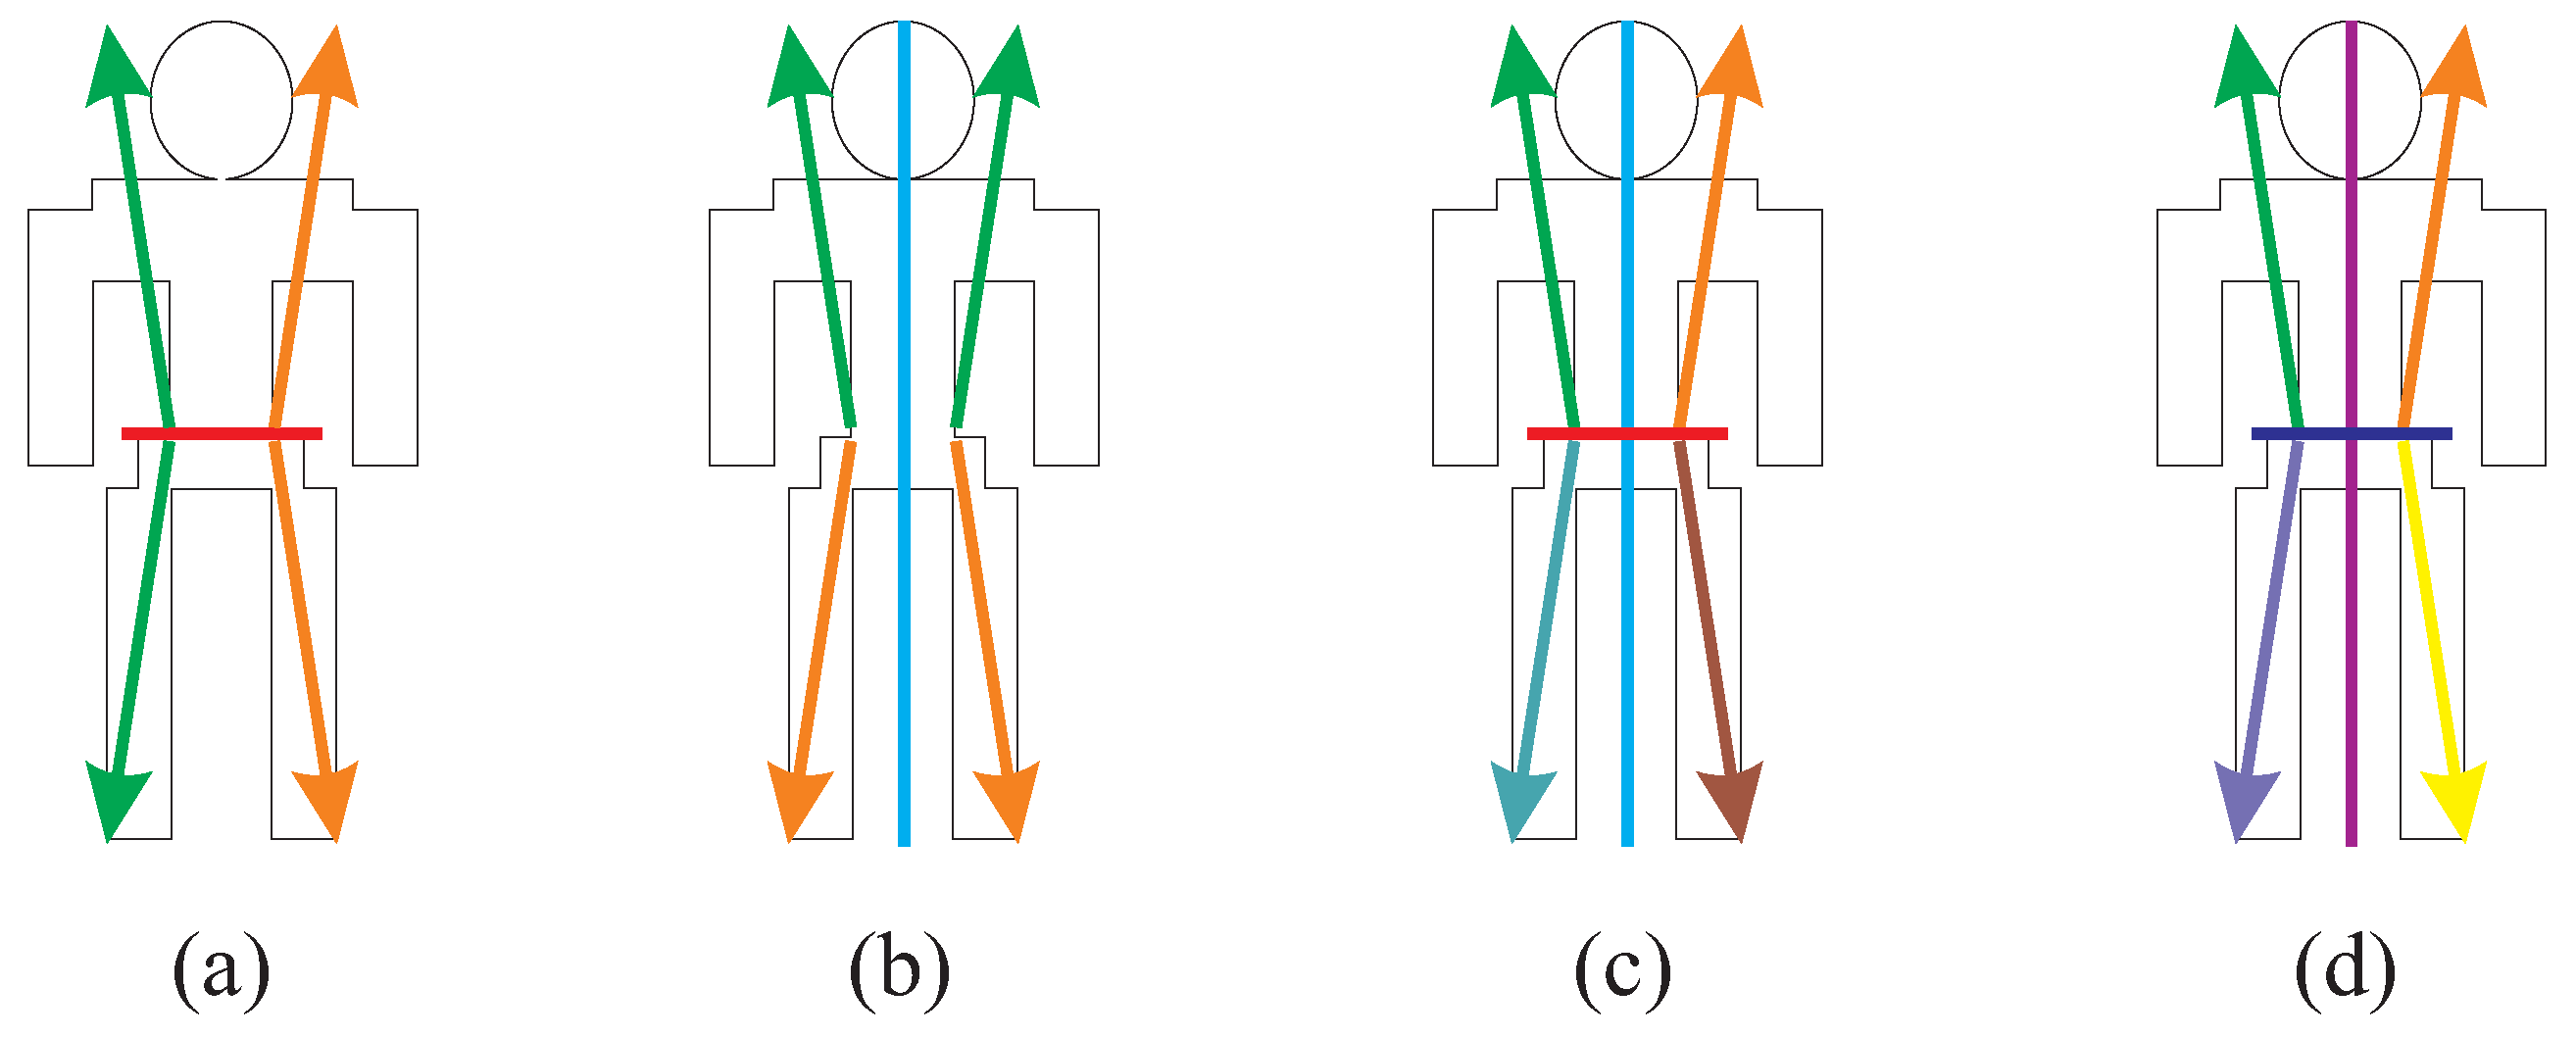
When visualizing data about a complex, multiparameter system, axes of data mapping can be arranged using basic symmetry types [
27]. We consider the following types of planar symmetry as suitable for creating an image in the UGVA notation (see
Figure 4; axes are shown in different colors):
Bilateral vertical axial symmetry (type ) allows for contrasting higher and lower groups of axes, emphasizing dynamics of the parameters; e.g., comparing a student’s data from the previous program (lower stratum shows the data from undergraduate learning) and the current program (middle stratum shows the data from graduate learning);
Bilateral horizontal axial symmetry (type ) allows for contrasting left and right groups of axes, emphasizing the ratio of different groups of parameters with similar roles in the model of the analyzed system, e.g., comparing data from courses in humanities and engineering courses;
Combined axial symmetry (type ) includes independently interpreted vertical and horizontal symmetry of the image; it is used to give an in-depth view of the situation, for example, combining the features from the examples to the symmetry types and ;
Radial symmetry (type ) allows interpreting composition of axes around the image center (all axes influence the image equally), e.g., each axis of type E can visualize parameters of a certain course for a student.
In addition to the symmetry types and types of axes, the dynamics of parameters of the visualized systems can be shown as coloring of the graphic primitives, demonstrating the difference between the current and previous values of the parameter. It is useful to select a unified color scheme for all assessed systems and parameters (e.g., in the form of a heat map).
We can code the image structure as follows: symmetry type (coded by a Greek letter), the number of chief axes, type of the axes (coded by a Latin letter), then the signs of presence of the general evaluation zone (
i) taking into account activity (
t). Additional artifacts and operative data are not coded. Thus, the image shown in
Figure 2a can be denoted as
: on the left (basic) image, there are strata for current parameters (middle stratum, five axes) and the relevant values from the previous state of the modeled system (low stratum); the evaluation zone (upper stratum) is the image’s face. Images shown in
Figure 2b–d are coded as
,
, and
, respectively.
The mapped systems can be multiparameter entities of different origins (e.g., teams, projects, goods, processes, individuals, etc.). The efficiency of the resulting visualization will depend on the quality of prepared data from the base parametric model for decision making and careful choice of the image structure. The layer of individual parameters for the elements of the target group is usually shown as artifacts and color markings (heat map). Later in this article, we will use the following color code: neutral values (or uncertainty) are shown in white; the minimum value—red, the maximum value—green; intermediary states are shown using colors from gradients from green to white, and white to red; gray is used for the image zones that are not tied to any parameter of the analyzed system.
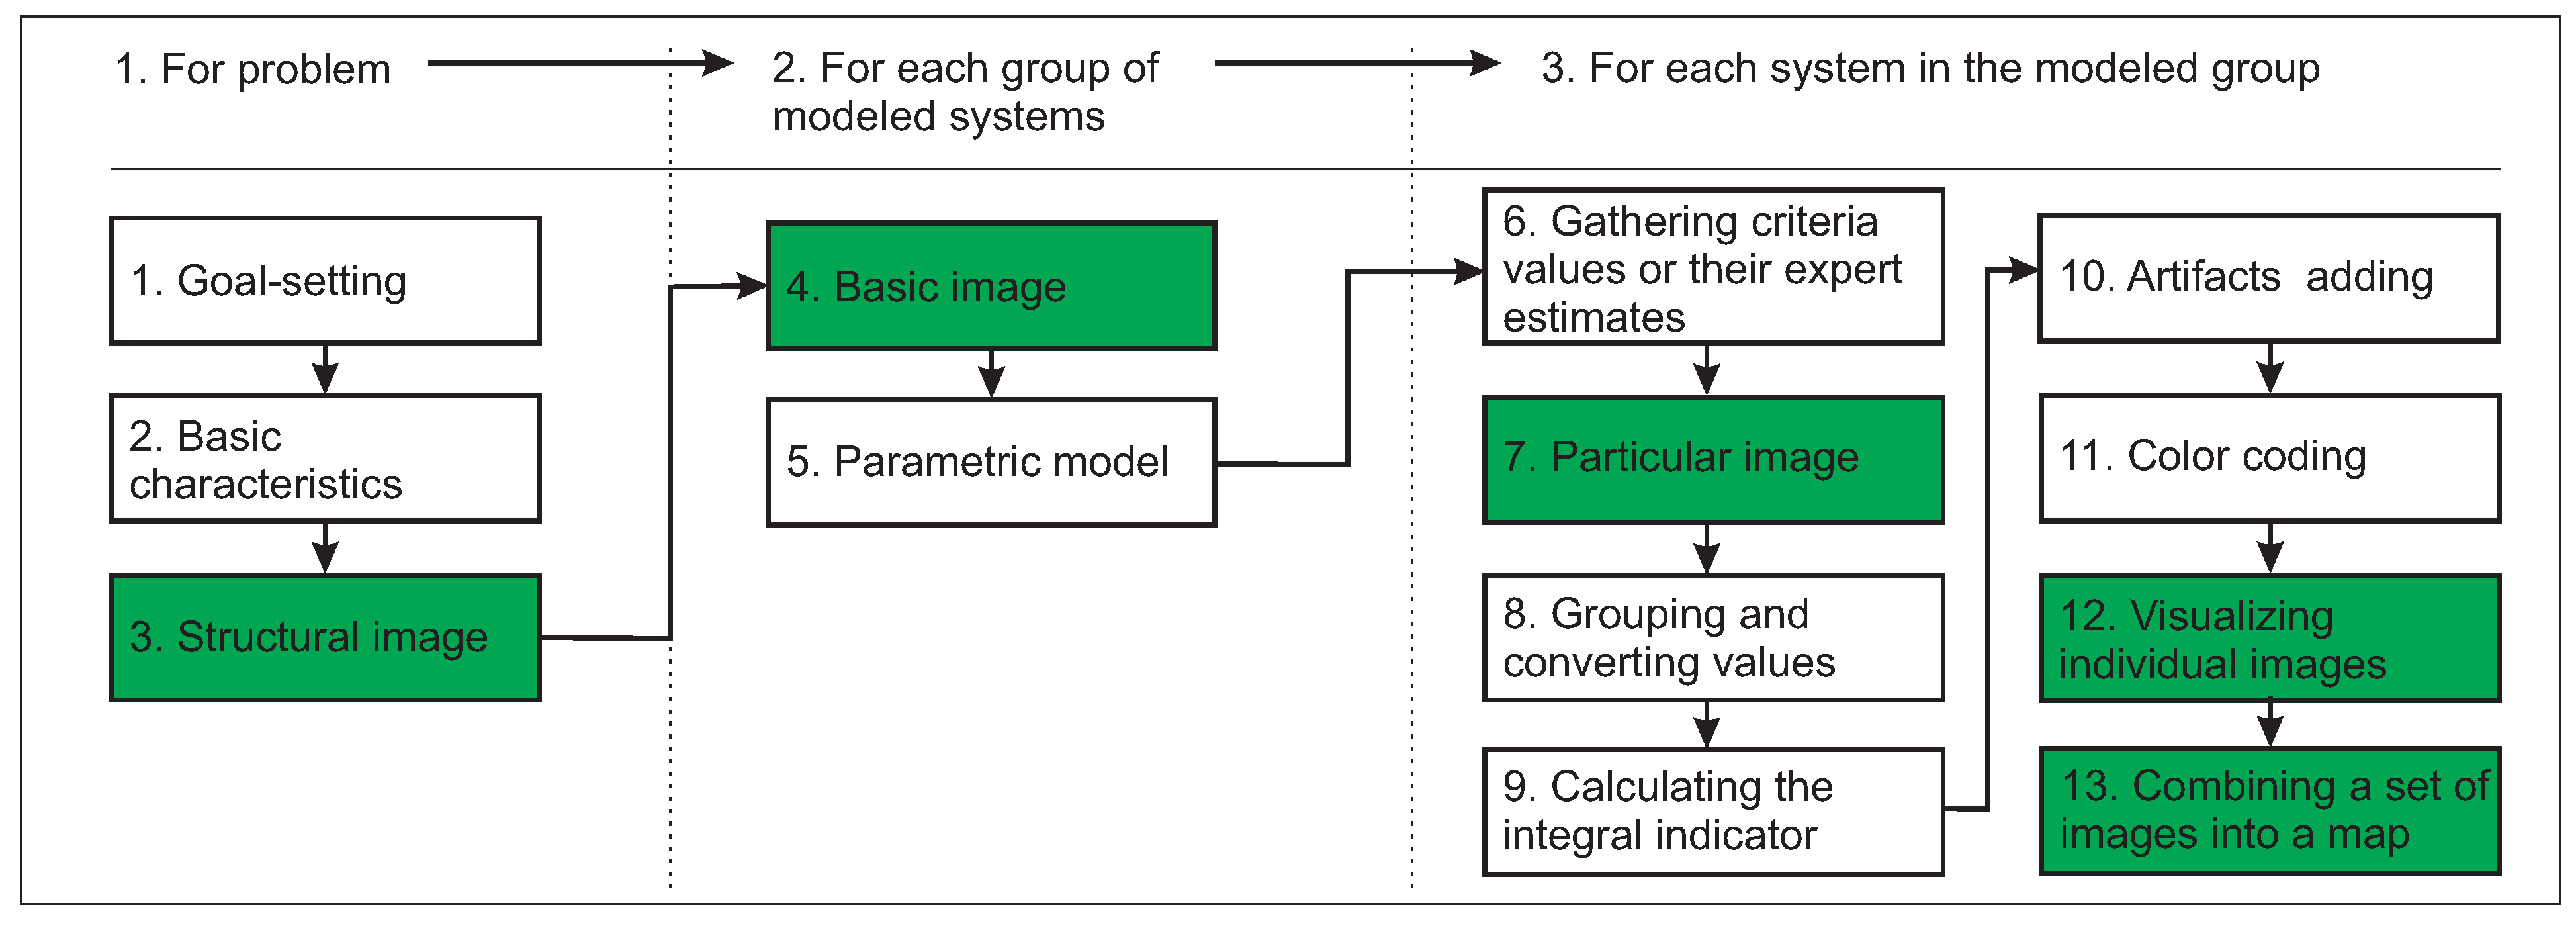
3.2. Method of Synthesizing UGVA Notation Images
To create an image in the UGVA notation, it is necessary to perform the following steps:
Goal-setting. Determining the basic characteristics of the decision-making task, including determining the goal and method (assessing, monitoring, comparing, etc.);
Determining the basic characteristics of the anthropomorphic image according to the specifics of the decision-making task, including:
Preferred aspect of analysis (functional, structural, mixed);
Symmetry type of the basic image (axial, radial, mixed [
27]);
Coding of the dynamics of the analyzed parameters (direct display using a composite axis, indirect display using a symmetry axis, absent);
Types of data axes (simple, composed);
Image specialization (unified, sectoral);
Method of enhancing of the anthropomorphic image (technomorphism, zoomorphism, etc.);
Kind of the integral parameter (typically, one), which shows the assessment of the analyzed system as a whole as the image “emotion” (e.g., balance, sustainability, consistency).
Development of a structural image as the anthropomorphic figure, including determining the parametric model of the feature space of the modeled systems and the key groups of criteria ;
Detailed analysis of the decision-making task, allowing forming the basic image of a typical object in the UGVA notation based on the selected structural image, selecting zones and strata for displaying parameters, and mapping key groups to the image elements;
Building a parametric model of the source data for the modeled system and determining the options of changing graphic primitives (phase change) of particular image parts when the associated parameter from changes qualitatively;
Gathering criteria values or their expert estimates for the analyzed systems and objects, allowing linking structural and functional aspects of the modeled system;
Estimating contribution of each indicator
to the relevant image element according to Formula (
2)
and then according to Formula (
3)
where
i,
j,
p are counters;
a,
b are parameters and scale coefficients, specific for a particular decision-making task; and
v are types of structural components
. This image will be called a particular image. If the target group of objects (systems) is heterogeneous, each subgroup can have a separate particular image. The sizes of complex elements will reflect the proportion of prior structural and functional parameters of subgroups of objects (components of the subgraphs
and
);
Grouping estimates (
) and converting values
from the coordinates of the parametric model of the object into the coordinates of graphic primitives of the image with the scale
, which can be visualized according to Algorithm 1. In it,
H is the set of alternative (compared) values of the parameter
for the linear size of the graphic primitive, associated with the value of
, of the UGVA notation image;
| Algorithm 1 Algorithm of calculating the size of a graphic primitive in the UGVA notation. |
| 1: function KpToFigureElement(, ) |
| 2: for all do: |
| 3: find min value in |
| 4: find max value in |
| 5: ▹ returns value |
Calculating the integral indicator (e.g., balance, coherence, resilience, etc.), allowing a complex evaluation of the analyzed system and showing the appropriate “emotion” in the specified part of the image (usually the face);
Adding to the image enhanced data using artifacts (pictograms), emphasizing specific qualitative parameters of the analyzed objects;
Color coding of the UGVA image elements, demonstrating the values of the current (operative from
) parameters that are necessary for analysis (choosing the point of view at the modeled object or system [
25]);
Visualizing the resulting image in the UGVA notation for each target system (individual images), which can be compared to each other;
Combining a set of images into a map to integrate the set of compared systems for the decision maker as a sequence or grouped in a factor space (e.g., on a topographic map of target objects).
Figure 5 shows which steps should be repeated for each group of modeled systems and each modeled system: the basic form is unified (step 5), but particular images can be different. Steps 1–6 are performed by an analytic; steps 7–13 can be performed automatically.
Subsequently, the decision maker can use the generated images to make the decision. The UGVA method allows for generating a set of comparable anthropomorphic images based on the unified criteria set that are convenient for decision-maker perception. The methods of coding data representing the activity of the analyzed systems should be determined during the definition of the structure of the basic image. This allows for transitioning from the structural model (determines the principles of performing the analysis) to the basic model (a parametric model is added), then to the model of a particular system (the structural and functional characteristics of each object are defined) and finishing with the model of the current state of the system (visualizing the current state of the objects taking into account their activity).
3.3. Interpreting Images in the UGVA Notation
To interpret a specific image in the UGVA notation, the following data should be taken into account:
The integral (assessment or target) parameter displayed using the emotional state of the image;
The balance of left, central, and right blocks of the middle stratum (estimating the balance between the components of the parametric model);
The difference between the components of each composite axis;
Omitted elements of the image;
The balance of compared or inherited values of different axes relative to each symmetry axis.
The UGVA images are not just evaluated one by one; they can also be compared to each other because they are created using the same method for the same parametric model (such as Chernoff faces). For better detailing, more data can be put on the model of a particular system, so the interpreter should take into account the following:
Any UGVA image can be made interactive by showing additional information when the user points at the relevant graphic primitive. Let us call a map a set of UGVA images generated under the same conditions for a specific request from the decision makers. A set of maps for the same objects but with different requests for visualized information can be called a decision-making atlas.
4. Case Study
4.1. Problem Description
Consider the case of using cognitive visualization with the UGVA notation for managing the learning process of graduate students majoring in informatics and computing (Siberian Federal University, Russian Federation). We go through phases of building the structural model (in this case, the learning program model), then the model of a particular system (the curriculum) and the current state model (student model). The target modeled object is a student. We consider the following decision-making tasks that can be solved by using the proposed approach:
Evaluating the state of the target object—a graduate student (describing specifics);
Comparing the target object with similar objects—other students in the learning group (finding directions of possible pedagogical interventions);
Monitoring the state of the target object—-changing the key parameters in time (studying dynamics).
The recommendations generated after the UGVA modeling of the learning process and students’ progress will be most useful to the learning program manager and teachers (tutors), but they can also be used by students. The raw data about students’ results are taken from the online learning management system used to deliver the courses of the learning program.
To better understand the following example, the readers must take into account the features of the learning process organization in the higher education institutions of the Russian Federation, which affect the following analysis. In Russia, undergraduate, graduate, and post-graduate students choose their academic major (called “learning field” or, literally, “learning direction”) when enrolling in a university. If the university provides several academic concentrations for the chosen major, undergraduate students must choose their academic concentration at the specified time (typically, some time between enrollment and finishing their second year); graduate and post-graduate students choose their concentrations during enrollment. The students are enrolled in permanent groups, sharing majors and, often, concentrations; they take classes together for the duration of learning (except, perhaps, elective courses).
The student groups follow predetermined curricula developed by teaching staff in each university for each academic major and concentration they teach; elective courses comprise about 12% of the academic load for undergraduate students and about 17% of the academic load for graduate students. Elective courses are taken during a certain semester of a certain learning year: A student is supposed to select one course from the list of available elective courses. Having a predefined curriculum, specifying courses and the semesters they should be taken, and a stable student group are the most prominent features of Russian higher education.
A curriculum includes the list of courses with their didactic units, related knowledge, and competences. Each course has a number of parameters: its academic load (in hours and/or credit points), the final exam form (pass/fail or graded exam), the learning year and semester, etc. The courses in the curriculum are divided into several components: the basic component (required for the major), the varied component (can be changed by the university; required for the concentration), and elective or optional courses. The regulatory basis for developing curricula is formed by the requirements of the Ministry of Higher Education and Science (federal learning standards for academic majors [
28]), requirements for professional skills from the Ministry of Labor (professional standards [
29]), and requests from major regional employers. This approach makes an important curriculum balance between the breadth component and the depth component, necessary to form a well-prepared professional who mastered key professional skills but can adapt to the employer requirements and self-learn during their career.
The functional aspect of the curricula, represented by the list of professional skills and their generalizations (fields of knowledge that the student should master), involves finding a compromise between fundamental and applied knowledge, expressed through developing competences, learning skills, and satisfying labor market requirements. Then, the following nesting entities—a curriculum () ← course () ← topic () ← learning unit (W) ← test/assignment V—can be associated with the developed knowledge and skills as the hierarchy test/assignment → competence (Z) → key professional skill () → group of key professional skills () → activity model of the learner (). The relationship between the elements of structural and functional models form two hierarchies (graphs and ), but it is of the many-to-many type (e.g., one learning unit can participate in development of several competences, and one competence is developed when studying many learning units). The data on the solution V () are included in together with (data on the transitions between the elements of ) and (data on the trajectory of dialogues with the tutoring systems). This allows for transition between the structural and functional representation of learning content: A priori at the curriculum level; a posteriori for a particular student according to their digital learning footprint.
For example, when, using the results of middle-term exams in several courses, the competence development on the course level and learning-period level was assessed (a competence profile was formed using, e.g., the method described in [
30]), then this profile can be shown using the methods of data visualization [
31] to make recommendations to a particular student or a group of students as a whole. These data can, from a digital learning footprint, be visualized using dashboards [
32], Chernoff faces [
33], clusters [
34], cognitive maps [
16,
35], graphs [
36], etc. However, all these methods are limited in their capabilities to simultaneously demonstrate dynamics and show a group of complex systems (see
Table 1). Therefore, we consider this task using the UGVA method.
4.2. Structural Model
The structural model of the UGVA image for this task should reflect both the learning process and the students’ activity. Therefore, the image should satisfy the following requirements:
Two counterpoised sets of axes to show the current (t) and the previous () stages (periods) of learning, according to the selected set of key parameters;
Showing at each axis two values of the parameter (e.g., for showing the results for the courses in the basic and varied components of the curriculum);
The existence of the zone for displaying the integral parameter, showing the general assessment of the object’s state;
The ability to show qualitative parameters of individual objects as a number of artifacts.
To satisfy these requirements, we used an anthropomorphic figure with combined radial symmetry (
); all axes will be considered composite structural axes (type B). You can see the overall sketch of symmetry axes and data axes in
Figure 6a; its formal configuration is
, where 5 is the number of independent data axes. The basic figure is shown in
Figure 6b. The widths of the green blocks are used to visualize parameters of courses from the basic component of the curriculum (the height is not used for visualizing data); blue is used for the courses from the varied component; violet is for the blocks where the width is used for the basic component while the height is used for the varied component. The number of used axes and the number of associated parameters are defined by the parametric model of the displayed system (see below) and are selected on the level of the basic model of the academic major.
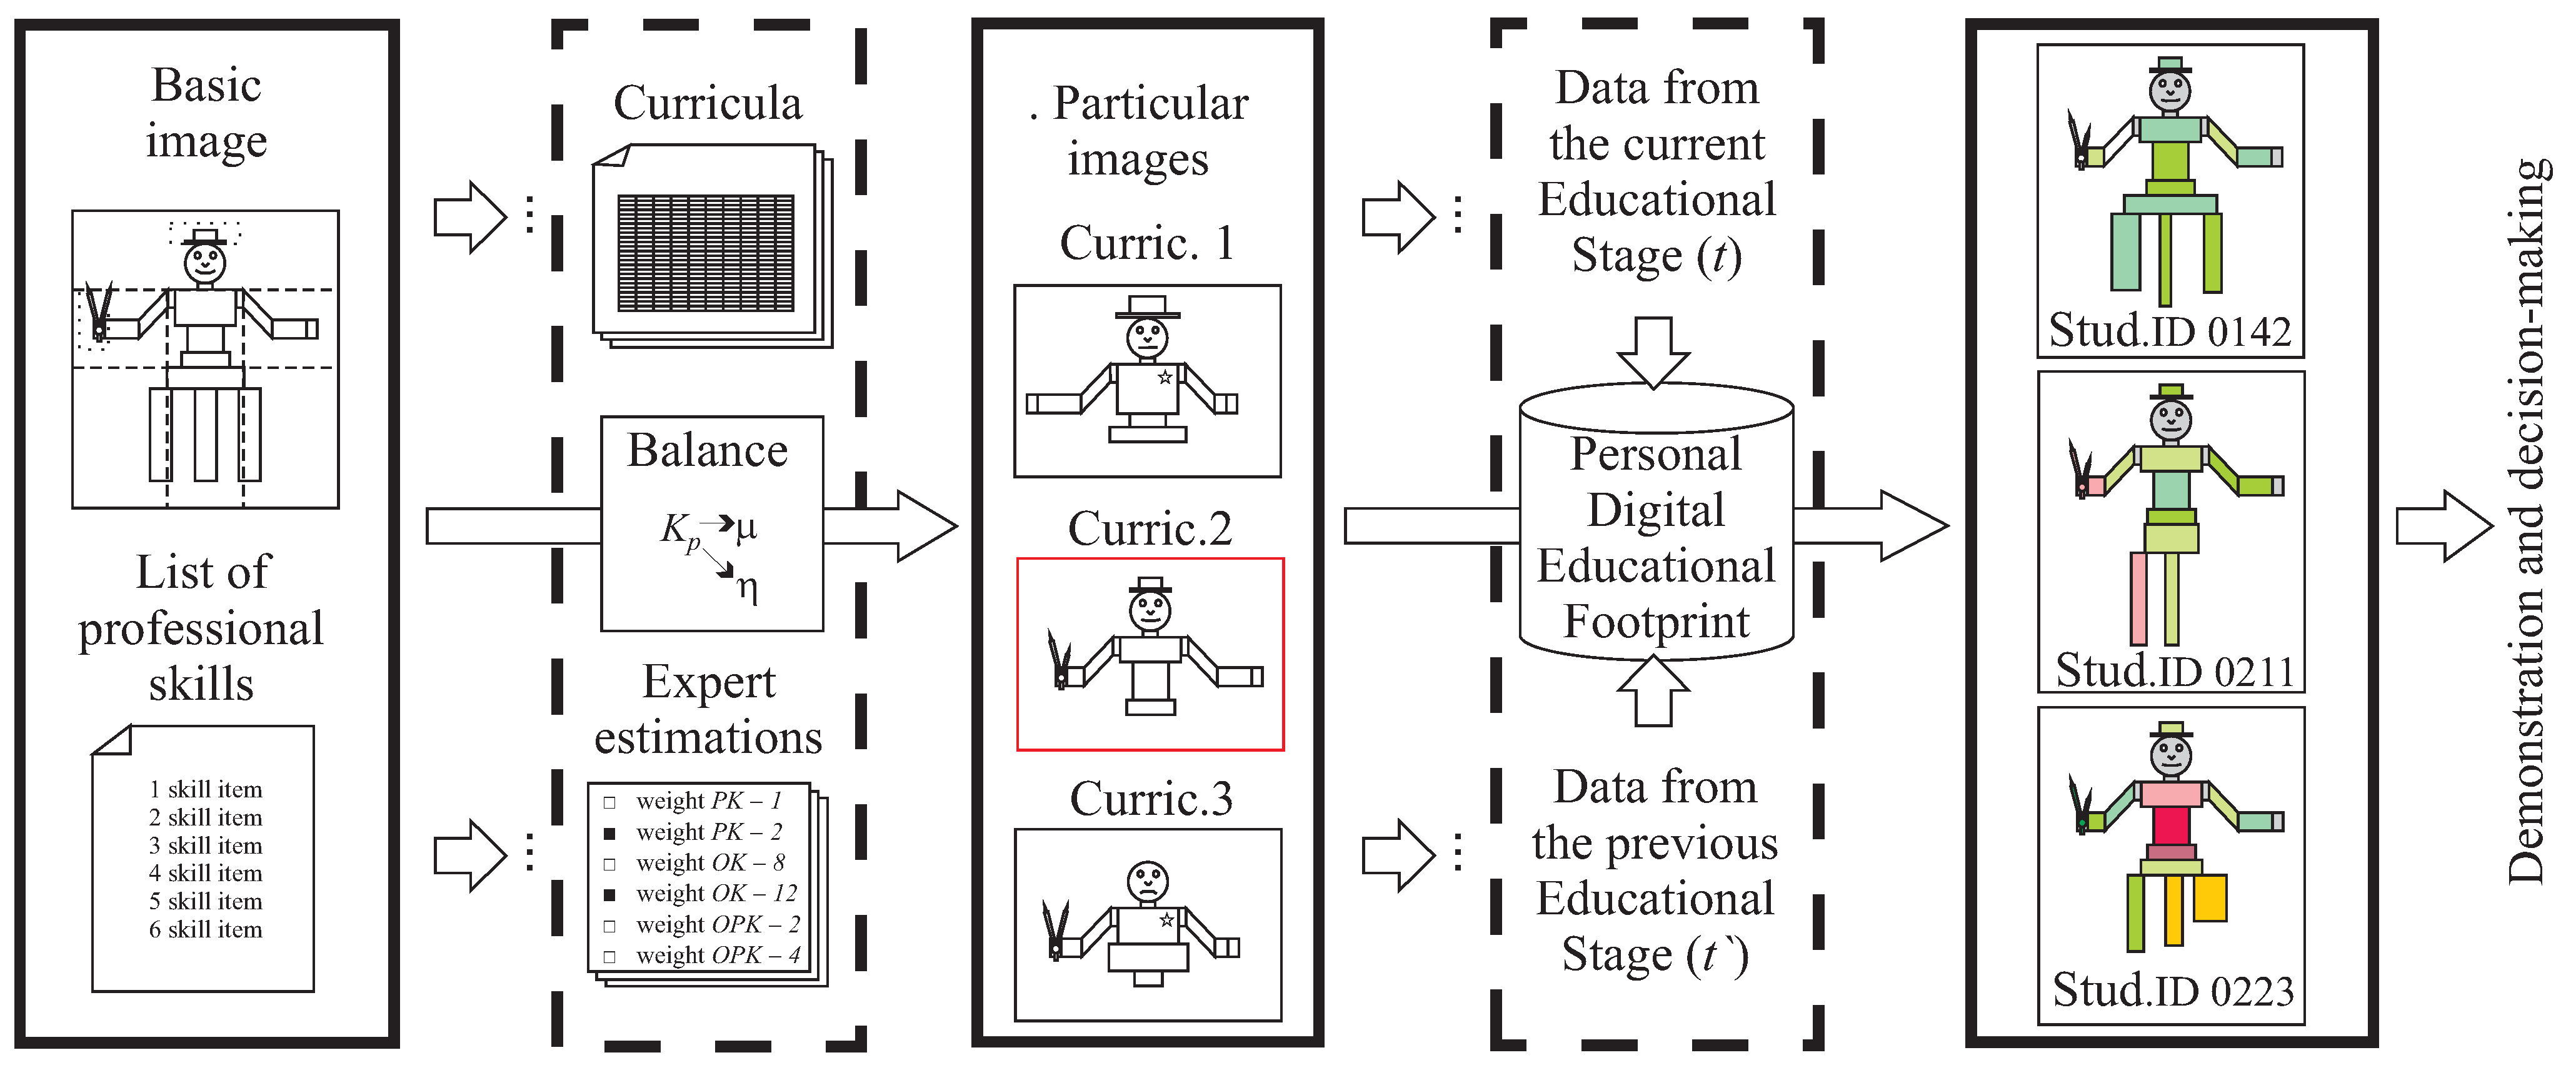
For creating the basic image, shown in
Figure 6c, from the structural image and continuing the visualization procedure, the raw data must be transformed [
37].
Figure 7 shows the stages of the data transformation for the case of learning-process analysis.
4.3. Parametric Model and Basic Image
The list of parameters () of the parametric model of the curriculum was selected based on the academic major “informatics and computing” (code 09.04.01) by experts using the data from the curriculum and the competences set by the federal educational standard. In this study, the model was developed by an inter-university expert group consisting of four experts from academia (PhD in computer science, faculty members), a representative of a major regional employer (head of human resources), and five graduate students. This allowed for combining opinions of the faculty members of different universities and industry practitioners while taking into account the students’ perspective.
To classify the courses, the group needed to formulate a set of key professional skills whose development are affected by different courses (the many-to-many relationship). Using the DELPHI method to find and harmonize expert opinions, the group developed the following list of major professional skills:
Software development ();
Information technologies application (the breadth component, );
Application of hardware and software systems and networks ();
Application of mathematical and algorithmic methods of information processing ();
Sectoral engineering (according to the academic concentration) ();
Other (non-major) knowledge and skills ().
Each group of key professional skills from is matched with a graphic primitive (or its part) of the image for separate visualization of the evaluation of contribution of the relevant course groups for the basic and varied components of the curriculum. The developer of the parametric model (often it is the decision maker) decides which zones should display which components according to the expert recommendations and estimations of which parameters should be compared (and so their zones must be counterpoised). Normally, the parameters of the basic and varied components are visualized separately. Each zone in the middle stratum corresponds to a zone in the lower stratum that shows the previous values of the same parameter. The parameters of zone (graphic primitive) such as width, height, radius, etc., are used to display the values of the parameters. The symmetry across a vertical axis allows for comparing values in the same time frame.
Figure 6c shows the distribution of estimates of key professional skills
by blocks of the basic image in the UGVA notation. It spans seven zones and unites retrospective data (learning at the previous levels of education, the lower stratum), current data (learning at the current level of education, the middle stratum) and the evaluation zone (the upper stratum: the face expression shows the curriculum balance, whereas the headgear reflects the sectoral specialization block), which makes the image aimed at a complex display of the modeled system in the past, present, and expected future.
To complete the basic image before working on the particular image of a curriculum (e.g.,
Figure 6d), the decision maker also must select the integral indicator for the evaluation zone (“face” expression of the anthropomorphic figure). For a curriculum in Russian universities, one of the important tasks during curricula development and enhancement is the curriculum balance (
): the size of the deviation from the equal (
) contribution of each group
of professional skills (
). In this case, we have five groups of estimates (
), considering that the estimates for
and
will be included in
. Algorithm 1 shows the method of calculating the curriculum balance
.
| Algorithm 2 Calculation of the coefficient of deviation from the balanced state . |
- 1:
functionMyCalc() - 2:
u = Length() - 3:
- 4:
for i = 0 to length() do: - 5:
= - 6:
- 7:
▹ returns value
|
This indicator does not only allow for the evaluation of the distribution of academic load between the basic and varied components of the curriculum, but also takes into account the balance of course groups developing different key professional skills during training of specialists. The smaller is the better because it shows that all key professional skills are fairly presented in the curriculum.
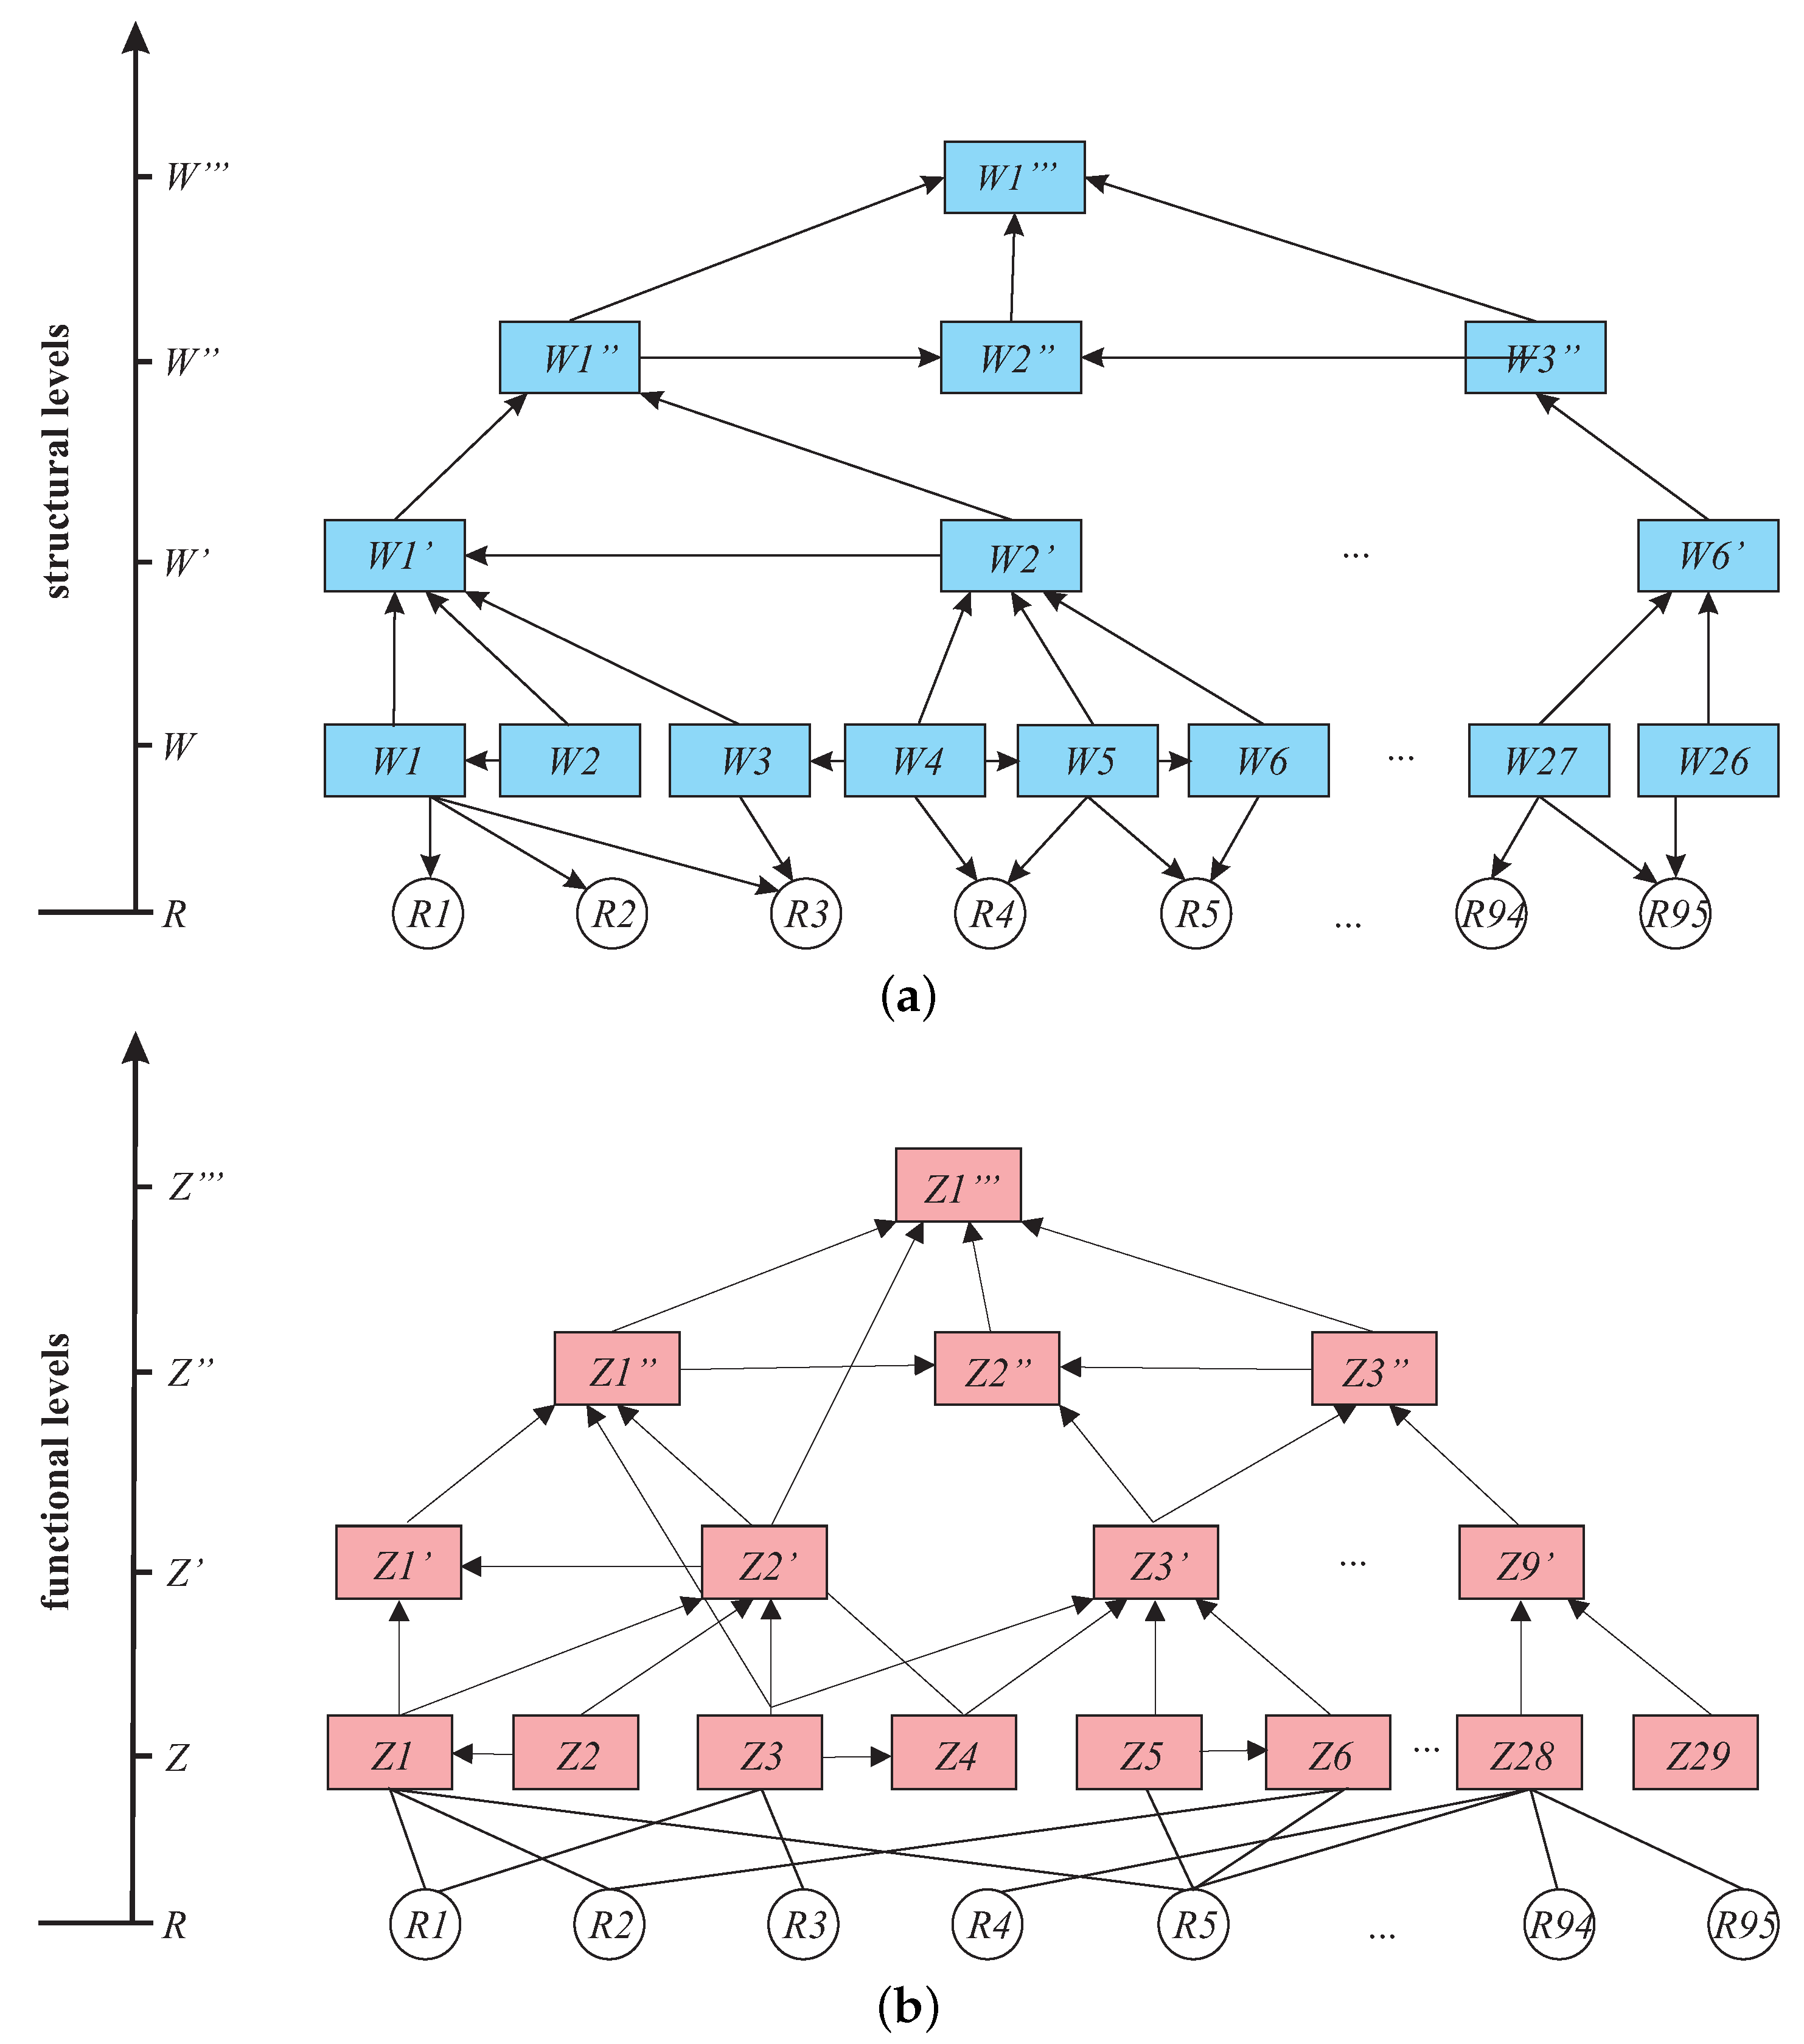
4.4. Particular Image
The next step is building a particular image from the basic image. For this, the data from the graph
showing the learning process from the structural point of view is shown in
Figure 8a. Level
R shows tests and assignments that measure students’ performance; the root
represents the curriculum (horizontal semantic links are omitted, the hierarchy is formed by semesters, courses, topics, and learning units inside them).
Figure 8b shows a graph of the learning process from the functional point of view
, where the lowest level
R represents tests and assignments for measuring key professional skills, and the top level
represents the professional profile of the (possibly generalized) student.
The distribution of estimates
for the learning program “Informatics and Computing” by the zones of the UGVA figure is shown in
Figure 6c. The following principles were used to adapt the basic image to the task:
Graphic primitives closer to the image center show the indicators for the basic component of the curriculum; the farther primitives show the indicators for the varied component of the curriculum;
The left arm (the axis showing the skill group) will show an artifact-icon (a paper piece with a block diagram) if the curriculum contains a special course with a course project requiring developing a software application;
The headgear (which works as the axis for the skill group), showing regional sectoral specifics, belongs to the upper stratum because many graduate learning programs lack a regional employer who specifies the requirements for ;
The color of the graphic primitives, which is used to show the results of particular students, will use the scale red–white–green;
The zone of integral indicator (the figure’s head, drawn as a circle), in this research, will show the only integral indicator , associated with the form of the figure’s “mouth” and will not be affected by any other parameters.
The particular image shows only curriculum (without the data about activity of students), so the image will omit the lower stratum because the curriculum in this model is considered static, and the decision maker does not need to compare this curriculum to the previous one. If any of the indicators are zero (full uncertainty), it will be highlighted in red.
To display a specific system (in this case, a curriculum), using a particular image, we need to gather and concentrate the data about it. We used the curriculum for the academic concentration 09.04.01.03 “Information systems and flight control centers” at the Siberian Federal University (graduate program in 2021) as an example. We analyzed the curriculum and evaluated the contribution of each course to the key professional skills (components of the parametric model). In this learning program, students take 23 courses (90 credit points total excluding internships and a master’s thesis, which equates to 3240 academic hours).
We formed a table of expert evaluations of contribution
of each course
j to development of key professional skills
(see
Table 2). The courses also have additional parameters: the curriculum component that the course belongs to basic (
), varied (
), or elective (
); the form of the final exam (
); workload in academic hours in percents of the total academic load (
), etc.
We calculated the contribution of each course
into the integral indicator
for each course
j, belonging to the basic (
), varied (
), or elective (
) component of the curriculum according to Formula (
2). If
, the course does not affect the skill
; if
, the course is aimed at the development of the relevant skill.
Using the data from
Table 2 and Formula (
3), we calculated the estimates for each key professional skill (see the first row in
Table 3, the skills
and
are merged). Then, we normalized the results to the scale from 0% to 100% (
) and used them to calculate the curriculum balance
according to Algorithm 1 (resulting
= 12.25).
The next step was scaling the values of to the diapasons reflecting the sizes of the relevant graphic primitives so that they can be used for image generation according to Algorithm 1.
According to the distribution of indicators by the image zones shown in
Figure 6c, we produced the visualization of the curriculum 09.04.01.03 shown in
Figure 6d. In that image, the lengths of right and left shoulders show
and
for the basic component; the lengths of their forearms show their values for the varied component; the heights of the chest and the belly show
for the basic and varied component, respectively; the height and width of the pelvis reflect
; the height and width of the headgear show
. The form of the mouth depends on
: the more balanced the curriculum is regarding the key professional skills (i.e., the value of
is closer to zero), the “merrier” the image looks.
The same procedure was performed for the curricula of the undergraduate programs that the students from the target group graduated from, giving us
and
for the second and following rows of
Table 3.
4.5. Individualized Image
The image of a particular student (individualized image) requires completing the lower stratum in the UGVA notation. To do this, we must consider the parameters of the previous learning program (i.e., for graduate students, the undergraduate programs they completed) for each student of the target group. As the decisions were made for the academic concentration 09.04.01.03, the undergraduate curricula were parameterized according to the set of key professional skills
described in the
Section 4.4, except for the sectoral specialization, specific for the graduate program (
). We show this process on the example of the student with profile ID 01022 (enrolled in 2021).
Student ID 01022 graduated from the program 11.03.03 “Developing and technology of electronic devices”. The data about the educational program and student’s achievements were from the relevant curriculum and the student’s diploma, which was required for enrolling in a graduate program. We constructed a table, similar to
Table 2, for the program 11.03.03, used Formulas (
2) and (
3), and calculated the values of
(see the second row of
Table 3). The resulting data were associated with the graphic primitives of the lower stratum so that the similar parameters were located opposite each other relative to the horizontal symmetry axis, as shown in
Figure 6b.
The resulting individualized image in the UGVA notation is shown in
Figure 9a. It reflects the configuration of the student’s current educational program (the middle stratum) and the data about the program they graduated from (the lower stratum). The pelvic part and each of the three legs show the development of basic professional skills in courses from the basic (height) and varied (width) parts of the curriculum, as was shown in
Figure 6b.
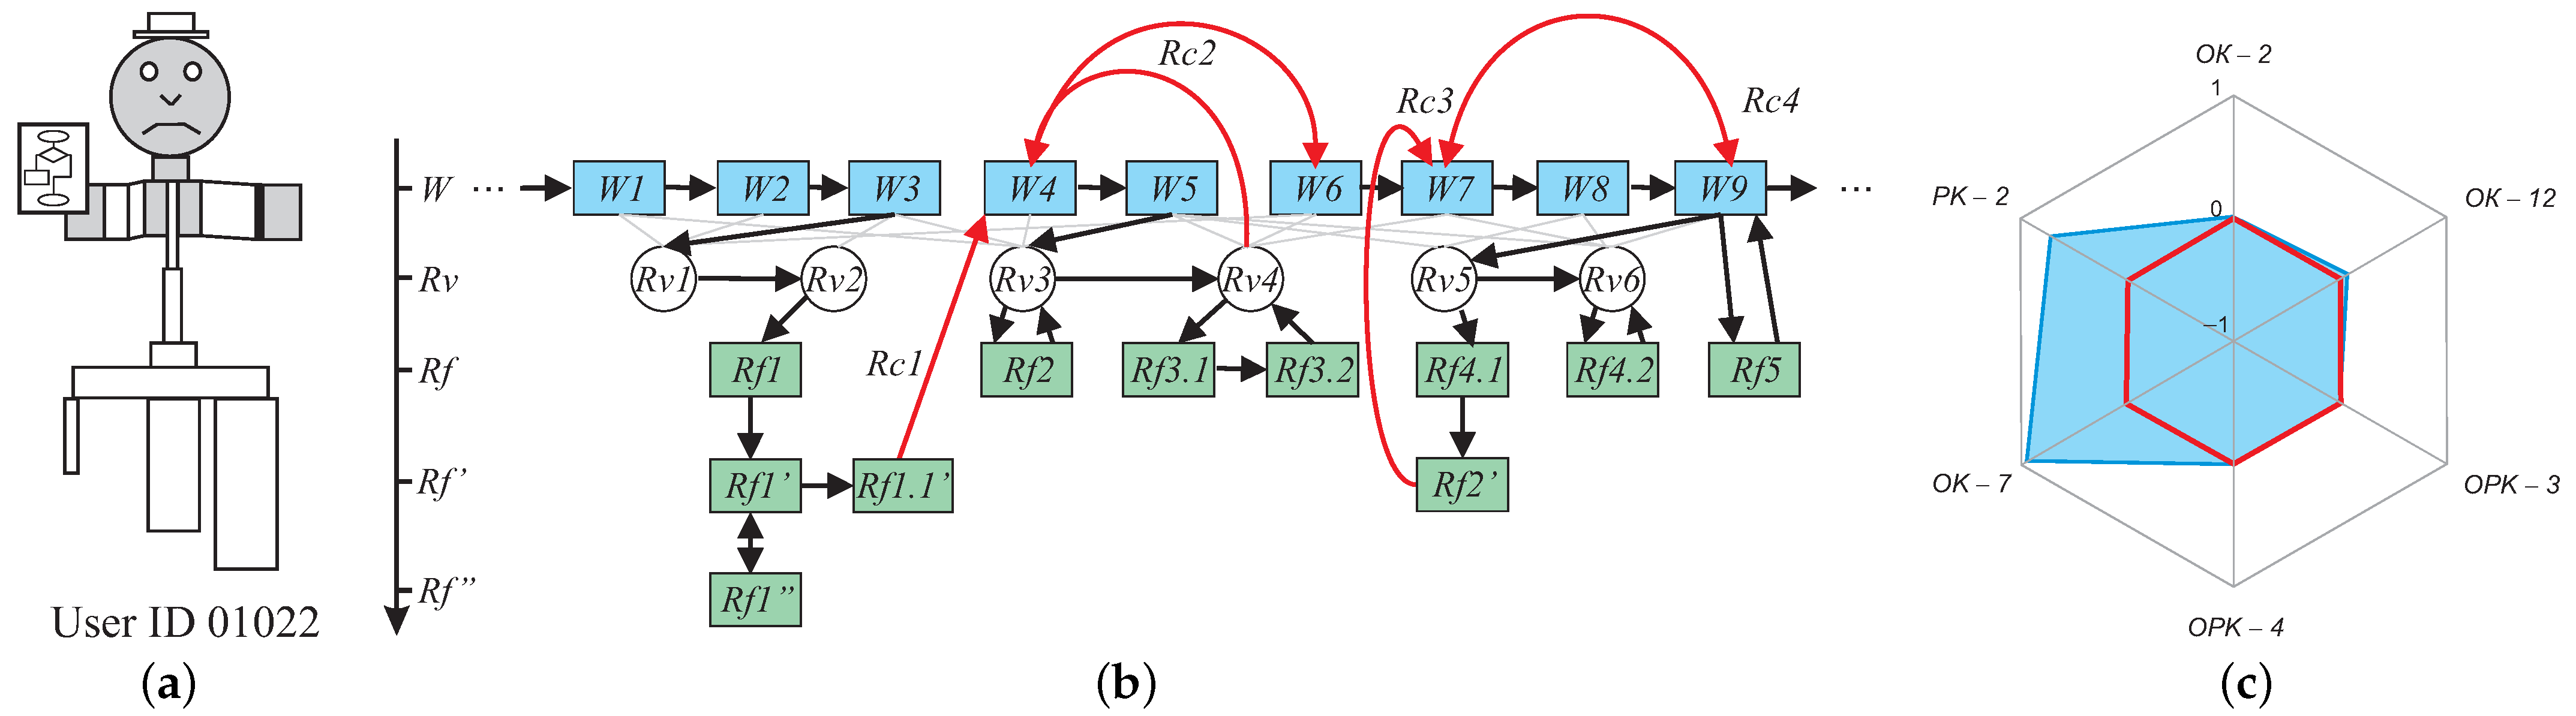
The operative data about learning activity of students is mined in the logs of the university’s Learning Management System (LMS) in the graph form (see the nodes of levels
W and
R from the graph in
Figure 1).
Figure 9b shows the fragment of graph
with the data about the mid-semester exams (
) of student ID 01022 (including trajectories of moving between the learning materials
and dialogues with the learning system
). The results are shown for the student’s exams during the third semester (the first semester of the second learning year) and before. The results of performing assignments and taking tests were saved and processed in the university’s LMS. Every element of every assignment (aspect of learning problem) and every test (answer variant) was linked to at least one competence from the curriculum that allowed not just calculating the course grade but forming the course-level and curriculum-level competence profiles (see
Figure 9c) using the method described by Uglev and Ustinov [
30]. The values of the estimates of competence development levels (Shortliffe’s certainty factor
[
38]) are displayed using the heat map as described in
Section 3.1. For example, after analyzing 168 events from the digital footprint, for the basic component of the curricula, the level of competence development of the skill
was calculated as
(shown by the intense green). The stages of calculating estimates of competence development levels and building competence profiles are described by Uglev et al. [
39]. The results of overlaying the data about all the courses for the competence
“Can critically analyze situations using system approach and develop action plan” for the UGVA image of student ID 01022 are shown in
Figure 10 (the leftmost image).
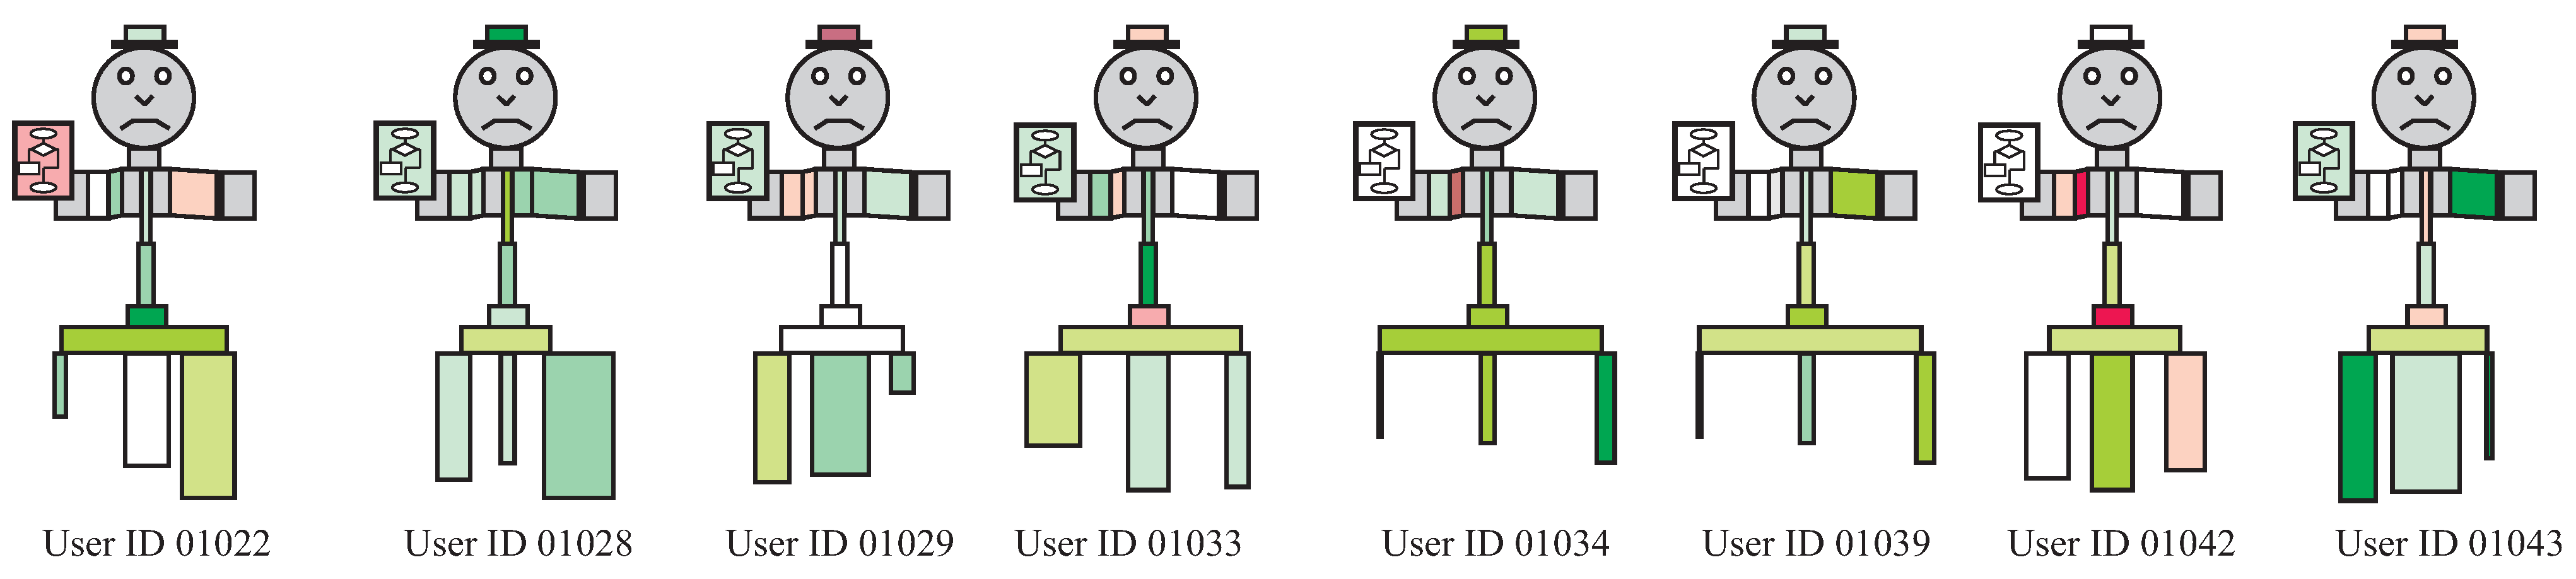
The procedure was repeated for all the students enrolled in learning program 09.04.01.03 (
Figure 10 shows a map of the learning group of eight students) according to the results of assignments, tests, and exams. In addition to color marking, the images contain artifacts (the course project) showing the major points of the students’ learning trajectories.
UGVA images made it possible to evaluate the current situation, learning gains, and compare the results for each student and every competence from the standard for academic concentration 09.04.01.03.
Figure 11 shows the development levels of five different competences of the same student using the data mined from the curriculum-level competence profile. Each image is based on the unified structural and functional basis provided by the curriculum, but the student’s activity and gains relative to different competences results in different coloring.
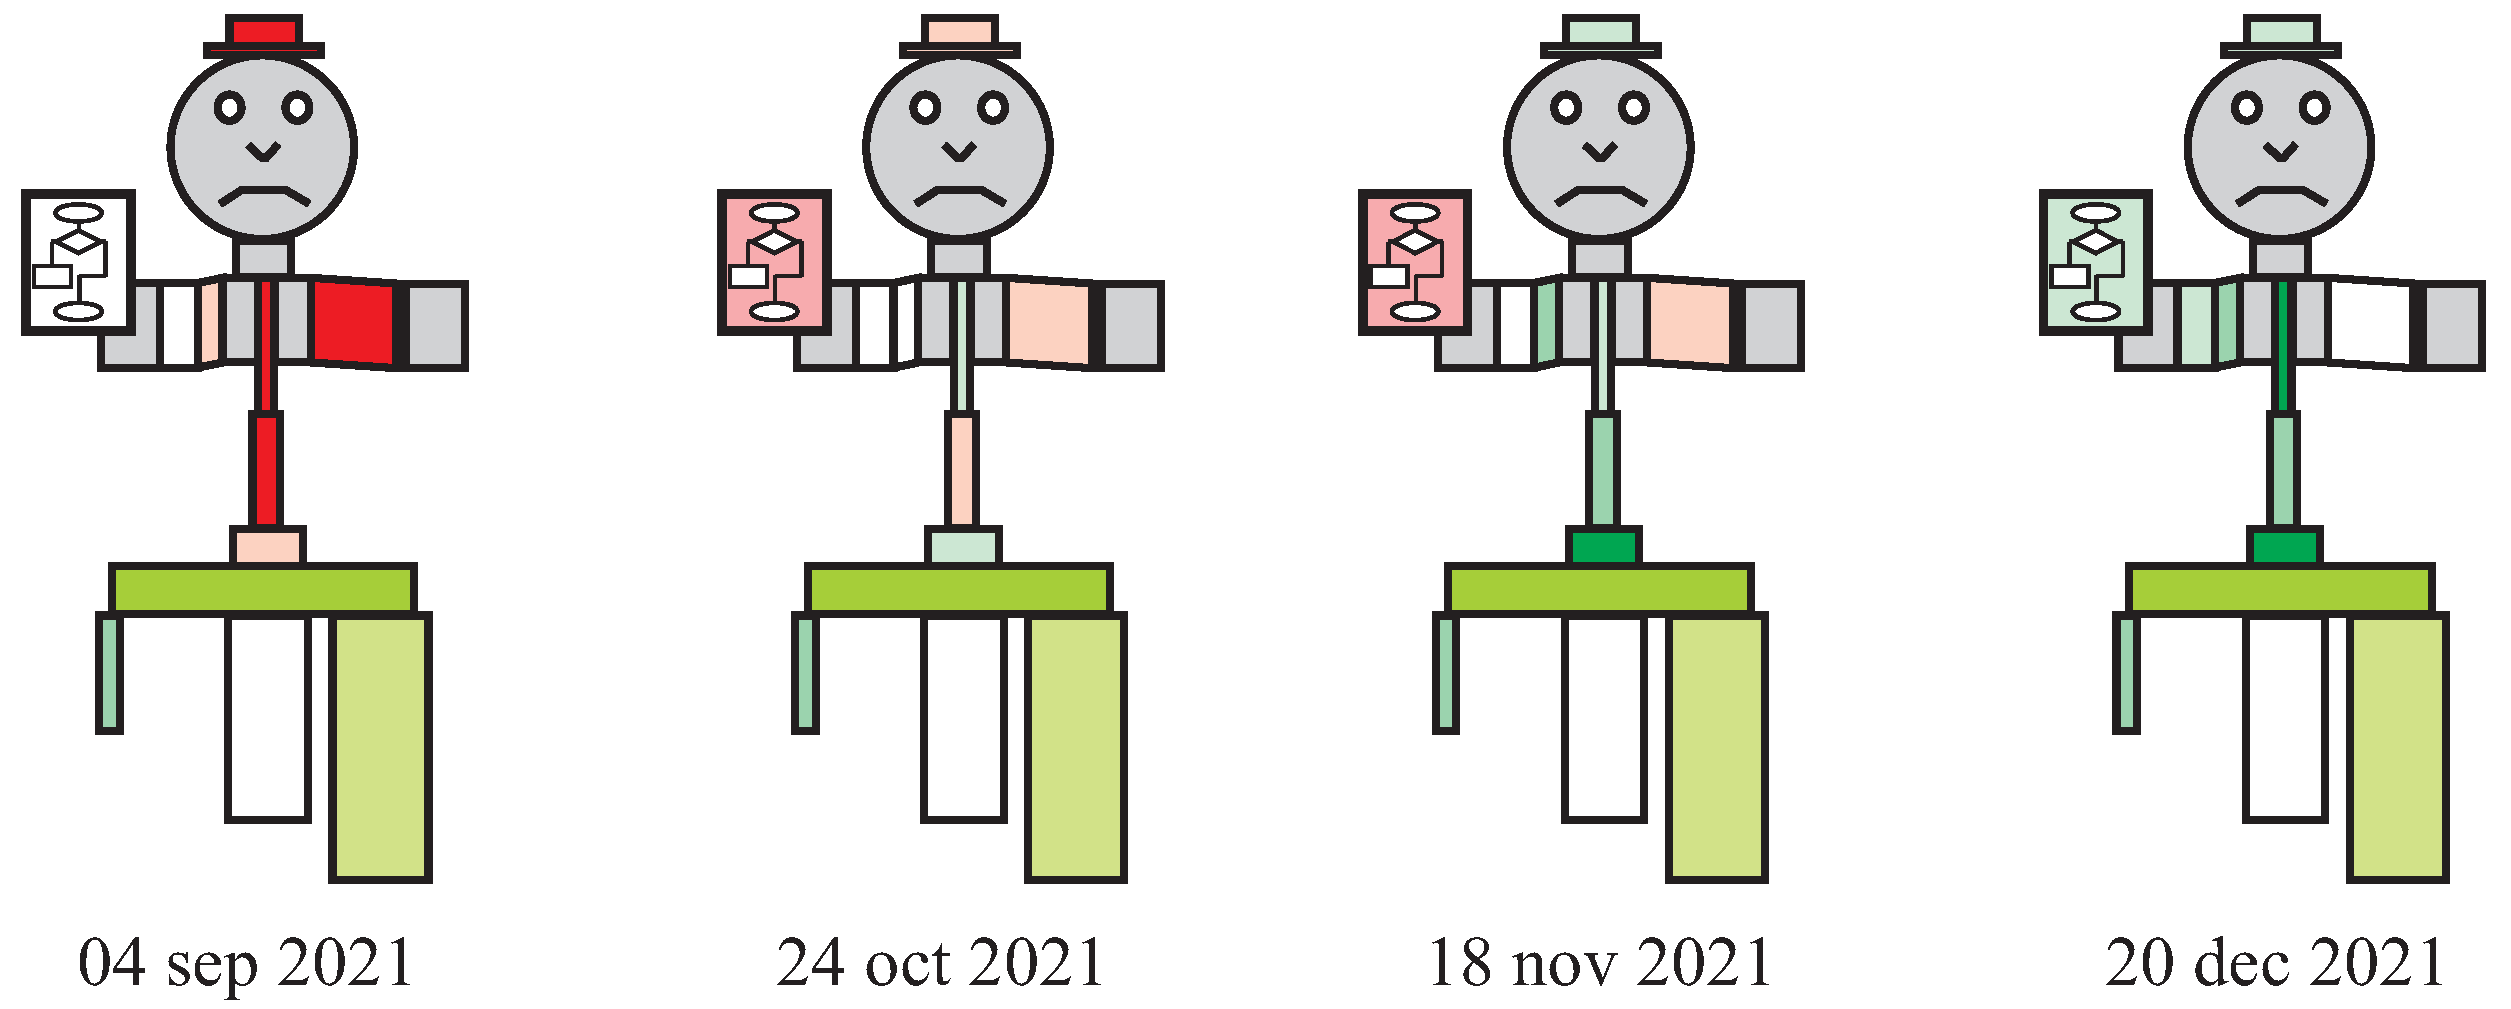
Figure 12 shows the dynamics of the competence development for competence
of student ID 01022 during a semester: At the start of the semester, during two mid-semester exams, and at the end of the semester.
4.6. Graph Mining to Automatize Providing Operative Data
One of the limitations of the proposed approach in the learning domain is the high amount of work necessary to collect the operative data about students’ progress. To collect these data, every learning aspect of each assignment and every answer variant for each test question had to be connected to competence data to form the information for the graph . This makes creating and supporting the exercise bank a very strenuous job.
One of the methods of automatizing this process is using ITS [
40], which is an important subfield in Intelligent Education [
41]. Of particular interest in this regard is model-based ITS that can automatically determine and store semantic errors made by students (e.g., Problets [
42] and CompPrehension [
43]). This information can be easily aggregated to create competence profiles in
R because, in this case, there is no need to label every answer to a question or aspect of the learning problem; only high-level data about the possible semantic errors must be labeled (i.e., manual labeling happens once per kind of exercise instead of once per exercise). Then, the conclusions about competence development can be made from the tutoring-system logs, i.e., the data concerning which errors (mistakes) the student made and which they did not make while having an opportunity to make.
This requires ITS to solve the task of analyzing a question (or learning problem) and determining the set of errors possible when solving it (which corresponds to the knowledge necessary to answer the question or solve the problem). Solving this task is beneficial to ITS because it allows for automatically classifying questions and determining the pedagogical conditions of their usage (i.e., prerequisite knowledge and target knowledge) and creating meaningful logs that can be mined to retrieve data for analyzing the learning situation and creating individualized images in the UGVA notation. In some fields, where learning problems’ formulations can be mined from real-world objects (e.g., mining open-source software for generating learning problems to teach computer science and software engineering).
The pilot experiments in generating learning problems for teaching determining order of evaluation of expressions for teaching programming showed the viability of this technique [
44]. This kind of learning problems produces the following possible mistakes:
An attempt to evaluate an operator whose operand is in parentheses before the expression in the parentheses;
An attempt to evaluate a two-token operator (e.g., array access or ternary conditional operator) before the operators inside its tokens;
An attempt to evaluate the operator with lower precedence first (from two subsequent operators);
An attempt to evaluate two operators with the same precedence contrary to the order defined by their associativity;
An attempt to evaluate the right operand of a strict-order operator (i.e., logical AND and OR operator, ternary conditional operator, or comma operator) before the evaluation of its left operand completes;
An attempt to evaluate the operator that should not be evaluated (e.g., the right operand of the logical AND operator is evaluated only if its left operand is true);
Finishing evaluating expression without evaluating an operator that should be evaluated.
Expressions in the C programming language were extracted from open-source code and converted first to abstract syntax trees, then to knowledge graphs in the RDF format (dynamic part of R). After mining these graphs, which we considered learning-problem templates, we enriched them with dynamic data, which, for expression evaluation, consist of values of operands for the logical operators AND and OR and the ternary operator, i.e., the data that determine which parts of expressions are evaluated, generating learning problems from the problem templates. These problems were classified by the knowledge required to solve them (i.e., sets of possible errors during their solutions), and redundant problems (generated from the same expression and requiring the same knowledge to solve) were weeded out. The expressions were also marked with the kinds of operators they used so that teachers can filter the questions, forbidding usage of the operators that their students do not know yet.
The resulting learning problems proved to be indistinguishable from human-authored problems, and the learning footprint that students () left while solving them contained precise information on which bits of knowledge required to calculate expressions correctly students learned and which they did not, which can be used for determining their competence profiles. The number of generated problems was more than ten thousand, and it can be scaled easily to avoid duplicating questions and let students train until they learned. It is easy to fine-tune the problem generator to seek rare kinds of learning problems (e.g., right associativity) and so maintain a balanced problem bank. Although this method is in its infancy, it opens the way to seriously reducing the workload of creating and maintaining question (problem) banks by using problems obtained by graph mining techniques and supplying the analysis and visualization component of the learning management system with the information about competence development.
4.7. Results
In the previous section, we have shown how to create a set of images in the UGVA notation (configuration ) for the task of managing a learning process. Here, we look at the practical decision-making tasks that can be solved used these images.
The first task is evaluating the learning situation for the graduate student in its complexity. Consider the left image in
Figure 10. It shows that student ID 01022 has problems in some of the courses (there are pink and white primitives). However, he has good knowledge of the skill group
“application of mathematical and algorithmic methods of information processing” based on the previous level of learning (the lower stratum of the left part of the image for
). This lets the supervisor think that the problems with these courses can be solved. However, the results of the course project (the artifact in the right hand) for the competence
require special attention to the whole block of courses for skill group
(c.f. the other competences in the right part of the images in
Figure 11). Modeling other competences also shows that skill group
is very problematic for
for this student (the bright red rectangle in the right image in
Figure 11).
When students are compared, the full map of the student group is used. A unified parametric model and the same configuration of the middle stratum allow quick recognition of key tendencies and problematic aspects. For example, by analyzing the images shown in
Figure 10, we can see that the
(the left part of the middle stratum) is problematic for the majority of the group during developing competence
. Even when the profiles for the previous level of education are the same (c.f. images for students ID 01034 and ID 01034), the mined data from the LMS will show the difference in the current learning situation by coloring the image zones differently.
To assess the dynamics of the selected parameter (monitoring task), the colors of the corresponding zones should be compared. To do this, a series of images in the UGVA notation for the same student in different moments of time is generated. For example, the analysis of dynamics of competence development for the competence
for student ID 01022 (
Figure 12) finds that the skills from groups
(right limbs) and
(left limbs) were progressing slowly, whereas skill group
(center) was learned much more effectively.
The results of quick visual analysis can lead to practical conclusions for the decision maker and the students. For example, the leftmost student shown in
Figure 10 was recommended to work on the course “design of automated information systems” (topics #3 and #4, assignments #2, #4, and #5) and the relevant textbook material and the course “object-oriented programming” (topics #4 and #5, assignment #4). These data will be automatically retrieved from the mined graph
G using the edges of subgraph
and their weights for
R, analyzed relative to the identified problem with the key professional skill group
for the competence
(which is obvious from the color of the block diagram artifact and the right forearm). Adding the data about the student (e.g., student’s learning goals, obtained from questionnaires and the dialogue options the student selected) will substantiate the decision of the ITS much better.
SFU faculty used cognitive visualization in the UGVA notation for managing the learning process of students using the university learning management system in 12 courses of the curriculum “information systems and flight control centers” during three semesters for the students enrolled in 2019, 2020, and 2021. It allowed both teachers and students to better understand inter-course links in the curriculum and improve their learning-management decisions. The preliminary results of this implementation are discussed in
Section 5.
5. Discussion
Uniting the source data in the form of mined graphs
,
, and
in an integral system that is visualized helps with both assessing the current situation and comparing it with similar situations in time (monitoring) and space (comparison). Generalizing our experience in using images in the UGVA notation for decision making (see
Figure 2) allowed us to formulate the following recommendations:
Axes of visualizing parameters or groups of parameters should be chosen for the categories that are comparable by their contribution to the task;
It is reasonable to limit the image to 5–7 independent data axes to let the decision maker quickly interpret the image (this limitation is based on the human perception limitations, see [
45]);
The number of components for an axis should not exceed 3–4 because when the images are combined into maps, they are relatively small;
If there is no need to compare two different sets of data in the image, radial symmetry is preferred;
Animating the image (either by moving its parts or changing colors) should be avoided as it interferes with the perception of a set of images combined into a map;
The zone of integral parameters (e.g., face of the anthropomorphic figure) should not be used to display too many parameters because, unlike Chernoff faces, it spans a small portion of the image;
The UGVA method works well for the models described by several graphs (i.e., structural aspect, functional aspect, and so on); when working with models described by purely structural models and/or state dynamics, it is reasonable to use other models (e.g., graphs or dashboards).
In this work, we mainly concentrated on using UGVA images for decision making in the learning process, including automatic management of the learning process using ITS, selection of applicants, recommending graduates to sectoral employers, optimizing curricula, justifying uniqueness of new learning programs, monitoring scientific achievements, etc. For ITS, the task of generating UGVA images (functional aspects) and relevant cognitive maps of knowledge diagnosis (structural aspect) [
16] is important and also requires using graph mining approaches. These maps can be adapted for different scales of decision making (the cross-cutting method of decision support according to [
46]) and demonstrated to students.
The UGVA images were used not only for educational tasks but also for human resources management in companies (selection of job applicants, motivation of employees, project team-building, selection of project applications, monitoring projects, etc.). We are working on developing methods of using UGVA images for optimizing business processes.
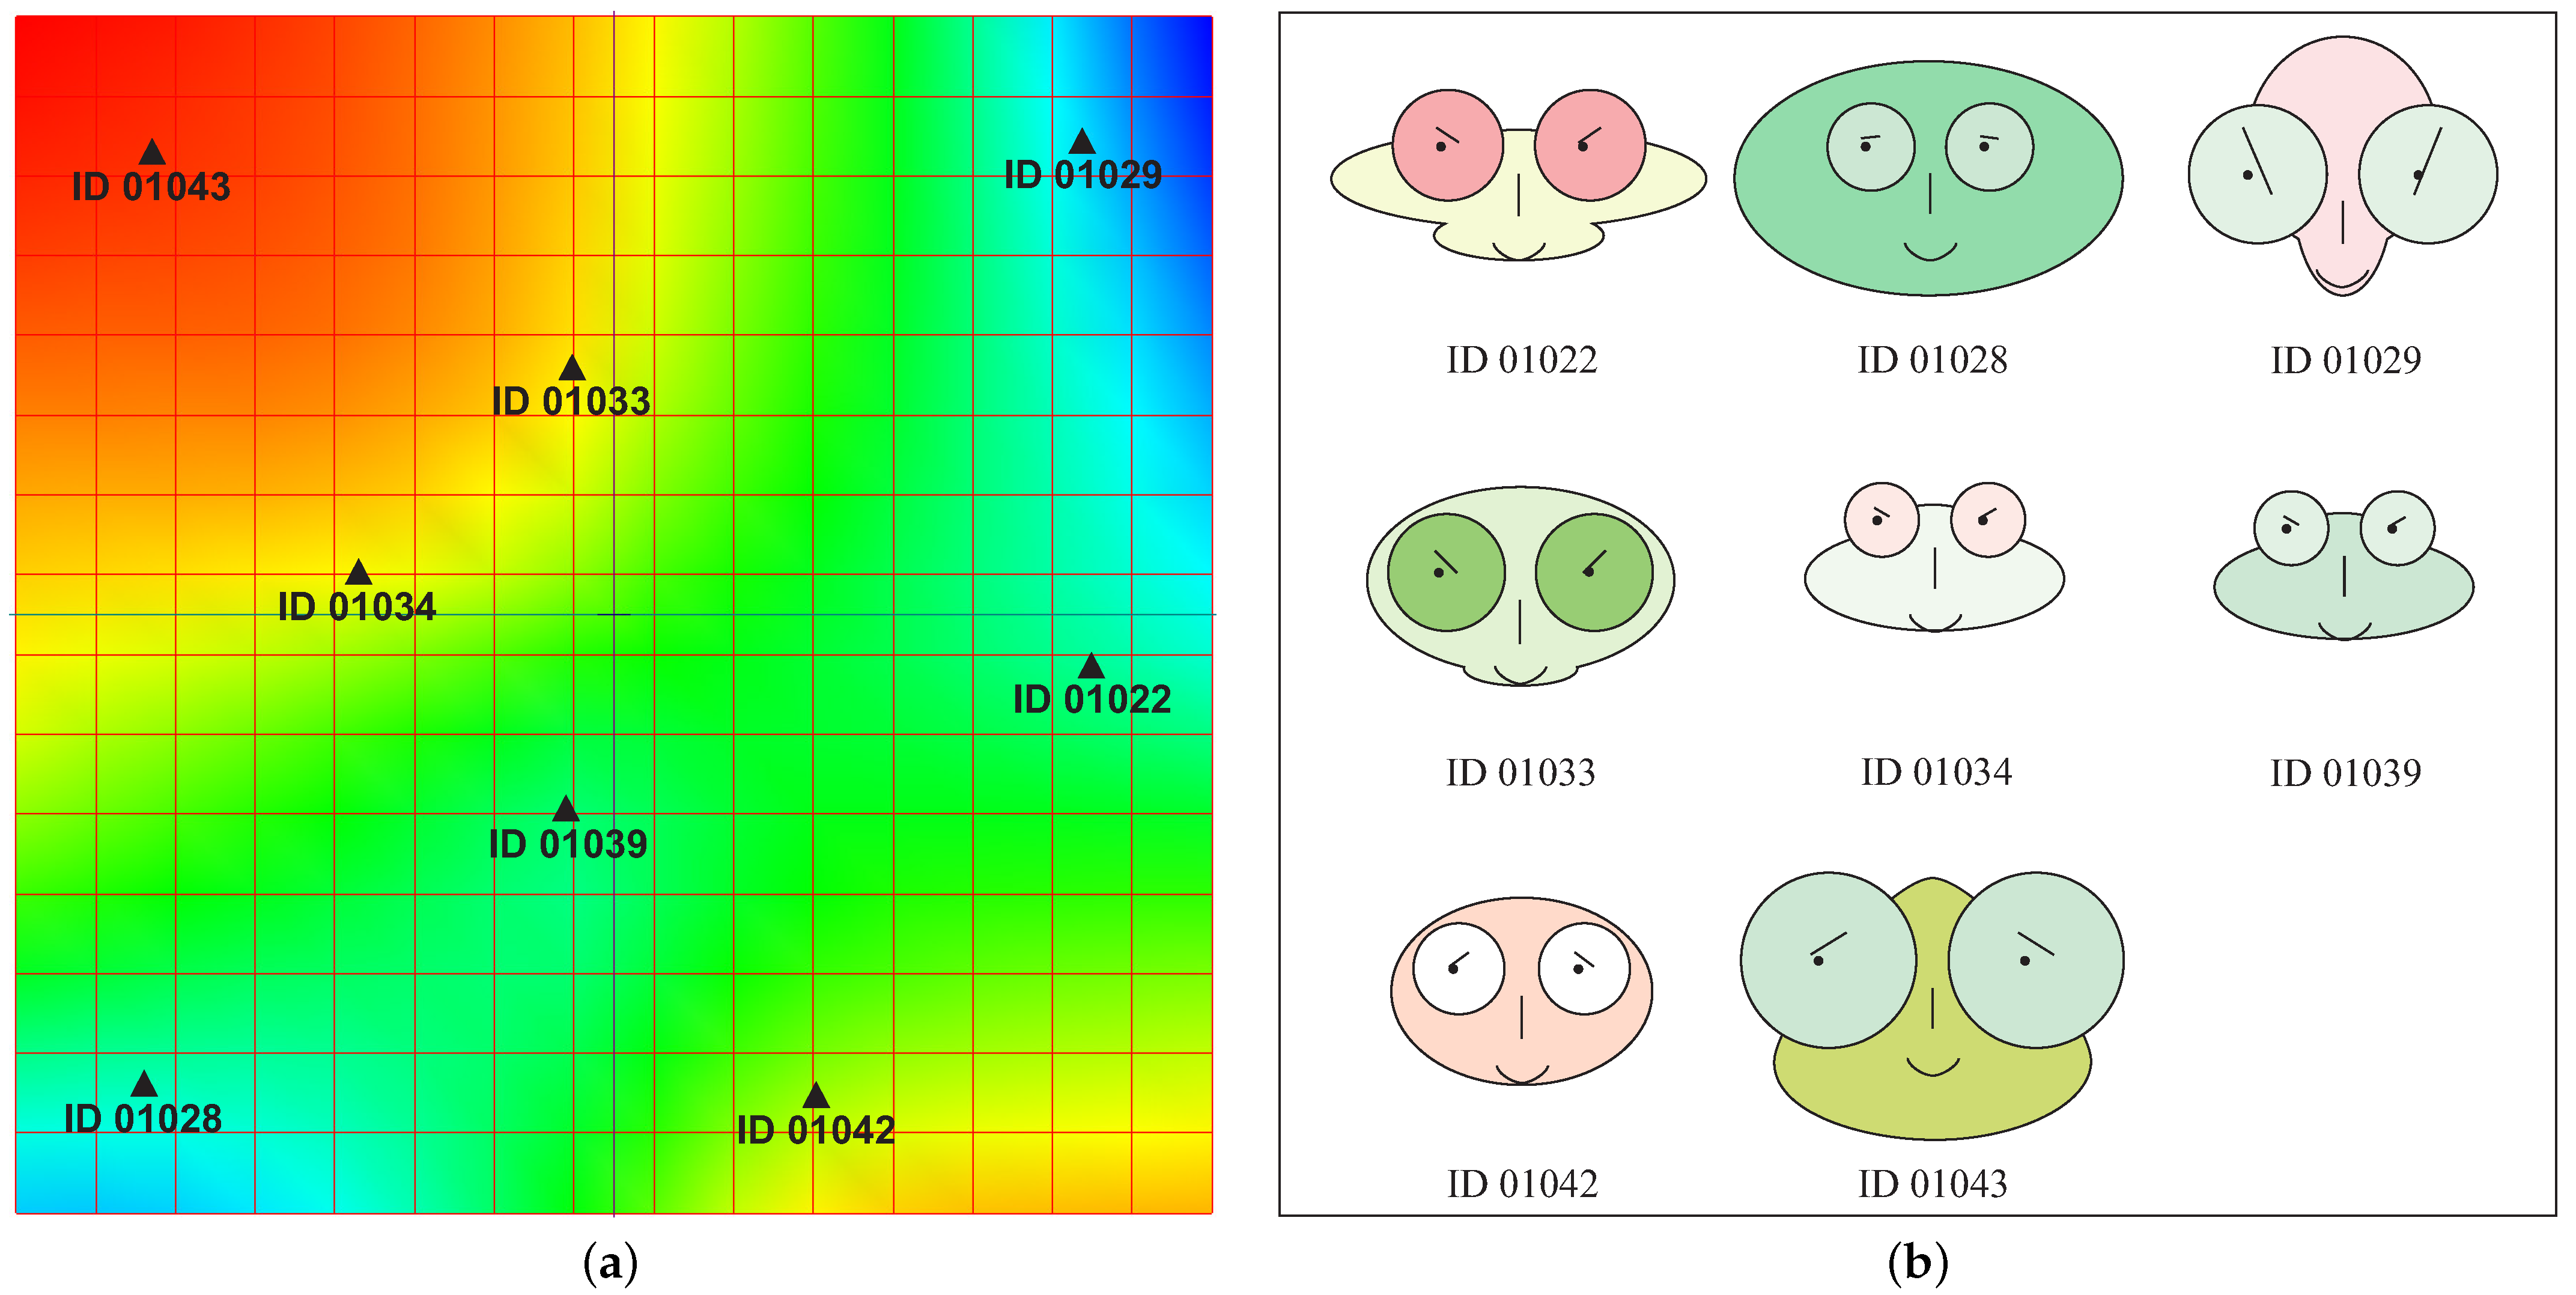
The pilot analysis of the results of concentrating and interpreting the mined data about learning situations in the form of graph described by (
1) was performed by students and teachers who used and compared the methods of elastic maps (using software ViDaExpert (
https://www.ihes.fr/~zinovyev/vida/ViDaExpert/ViDaExpert.sfx.exe, accessed on 29 October 2022)), Chernoff faces (using the modified software (
https://gist.github.com/dribnet/e26f52f423f0656c1bb8fc6f4e741cc2, accessed on 29 October 2022)), and anthropomorphic images in the UGVA notation (using the freely available service developed by the authors (
https://aesfu.ru/_method/ugva, accessed on 29 October 2022)).
Figure 13a shows non-linear generalization of the main components (the elastic maps method [
12]) for the group of graduate students shown in
Figure 10 (the head map is built in inner coordinates according to the competence contribution
). The result of drawing Chernoff faces for the same students can be seen in
Figure 13b. The comparison of the results has shown that the teachers and students prefer UGVA images to elastic maps 94% of the time and preferred UGVA images to Chernoff faces 86% of the time when comparing and monitoring the learning progress. For evaluating personal learning situations, we did not use the elastic maps because they concentrate the data too much; Chernoff faces were preferred over UGVA images in 12.3% and 4.6% of the time for teachers and students, respectively. Both groups were given the opportunity to use the dataset data directly in the form of graphs
,
, and
, but they avoided working with it because it was too complex and detailed. Our initial results support the conclusions of Ilves et al. about the effect of visualizations in online learning environments [
1]. We are working on gathering more data about the efficiency of the UGVA method and enhancing its analysis.
6. Conclusions
Effective visualization of complex multiparameter systems is an important component of data mining and graph mining. When the source data can be represented as a set of graphs and are linked from different datasets, direct visualization of a graph, cloud of points, or data cube might be impractical. This is especially important when it is necessary to visualize elements of the system’s activity. We used the concept of cognitive map, which allowed us to advance the ideas of pictographic visualization introduced by G. Chernoff.
The method of Unified Graphic Visualization of Activity (UGVA) presented in this article allows for assessing states of complex systems, comparing them, and monitoring their parameters. Visualization of elements of the system’s activity is possible because of the ability to choose different symmetry axes and data axes and overlaying the operative values of parameters using heat maps. We described the stages of the UGVA method and visualization parameters and classified the layout options for anthropomorphic images. The recommendations of usage of the method are provided.
We performed a case study of the UGVA method for the task of learning-process monitoring (parametric model of a student based on the curriculum model). The mined data, represented initially as three linked datasets in the form of graphs, were concentrated and generalized by pictographic methods. Using UGVA notation for the tasks of assessing the current situation, comparing students, and monitoring their progress was shown: the maps of UGVA images for a group of graduate students majoring in “informatics and computing”; practical recommendations were formed based on this experience. It was demonstrated that anthropomorphic images in the UGVA notation can be effectively used for decision-making support. One of the effective applications of the method is using UGVA images to substantiate decisions of intelligent tutoring systems. The software for visualization of UGVA images is freely available (
https://aesfu.ru/_method/ugva, accessed on 29 October 2022).
The UGVA method, as well as other pictographic methods (e.g., Chernoff faces) requires well-defined parametric models and sound composition of the image and its parametric zones, which makes the usage of UGVA method somewhat complicated. However, its usage in the tasks of evaluation, comparison, and monitoring of multiparameter systems (e.g., students during learning) allows for processing and generalizing a large amount of information, which is visualized efficiently. These results are worth the time and effort spent on designing UGVA images because the process gives a flexible tool for explainable decision making in the learning process and other tasks requiring quick analysis of complex systems.
Further work includes widening the use of UGVA images in managerial decision making at Siberian Federal University, applying the method to the business process of the major regional companies, and improving the methodology of using cognitive visualization in intelligent tutoring systems.


