
Plastic Behavior of Metallic Damping Materials under Cyclical Shear Loading

Abstract
:1. Introduction
2. Test Procedure
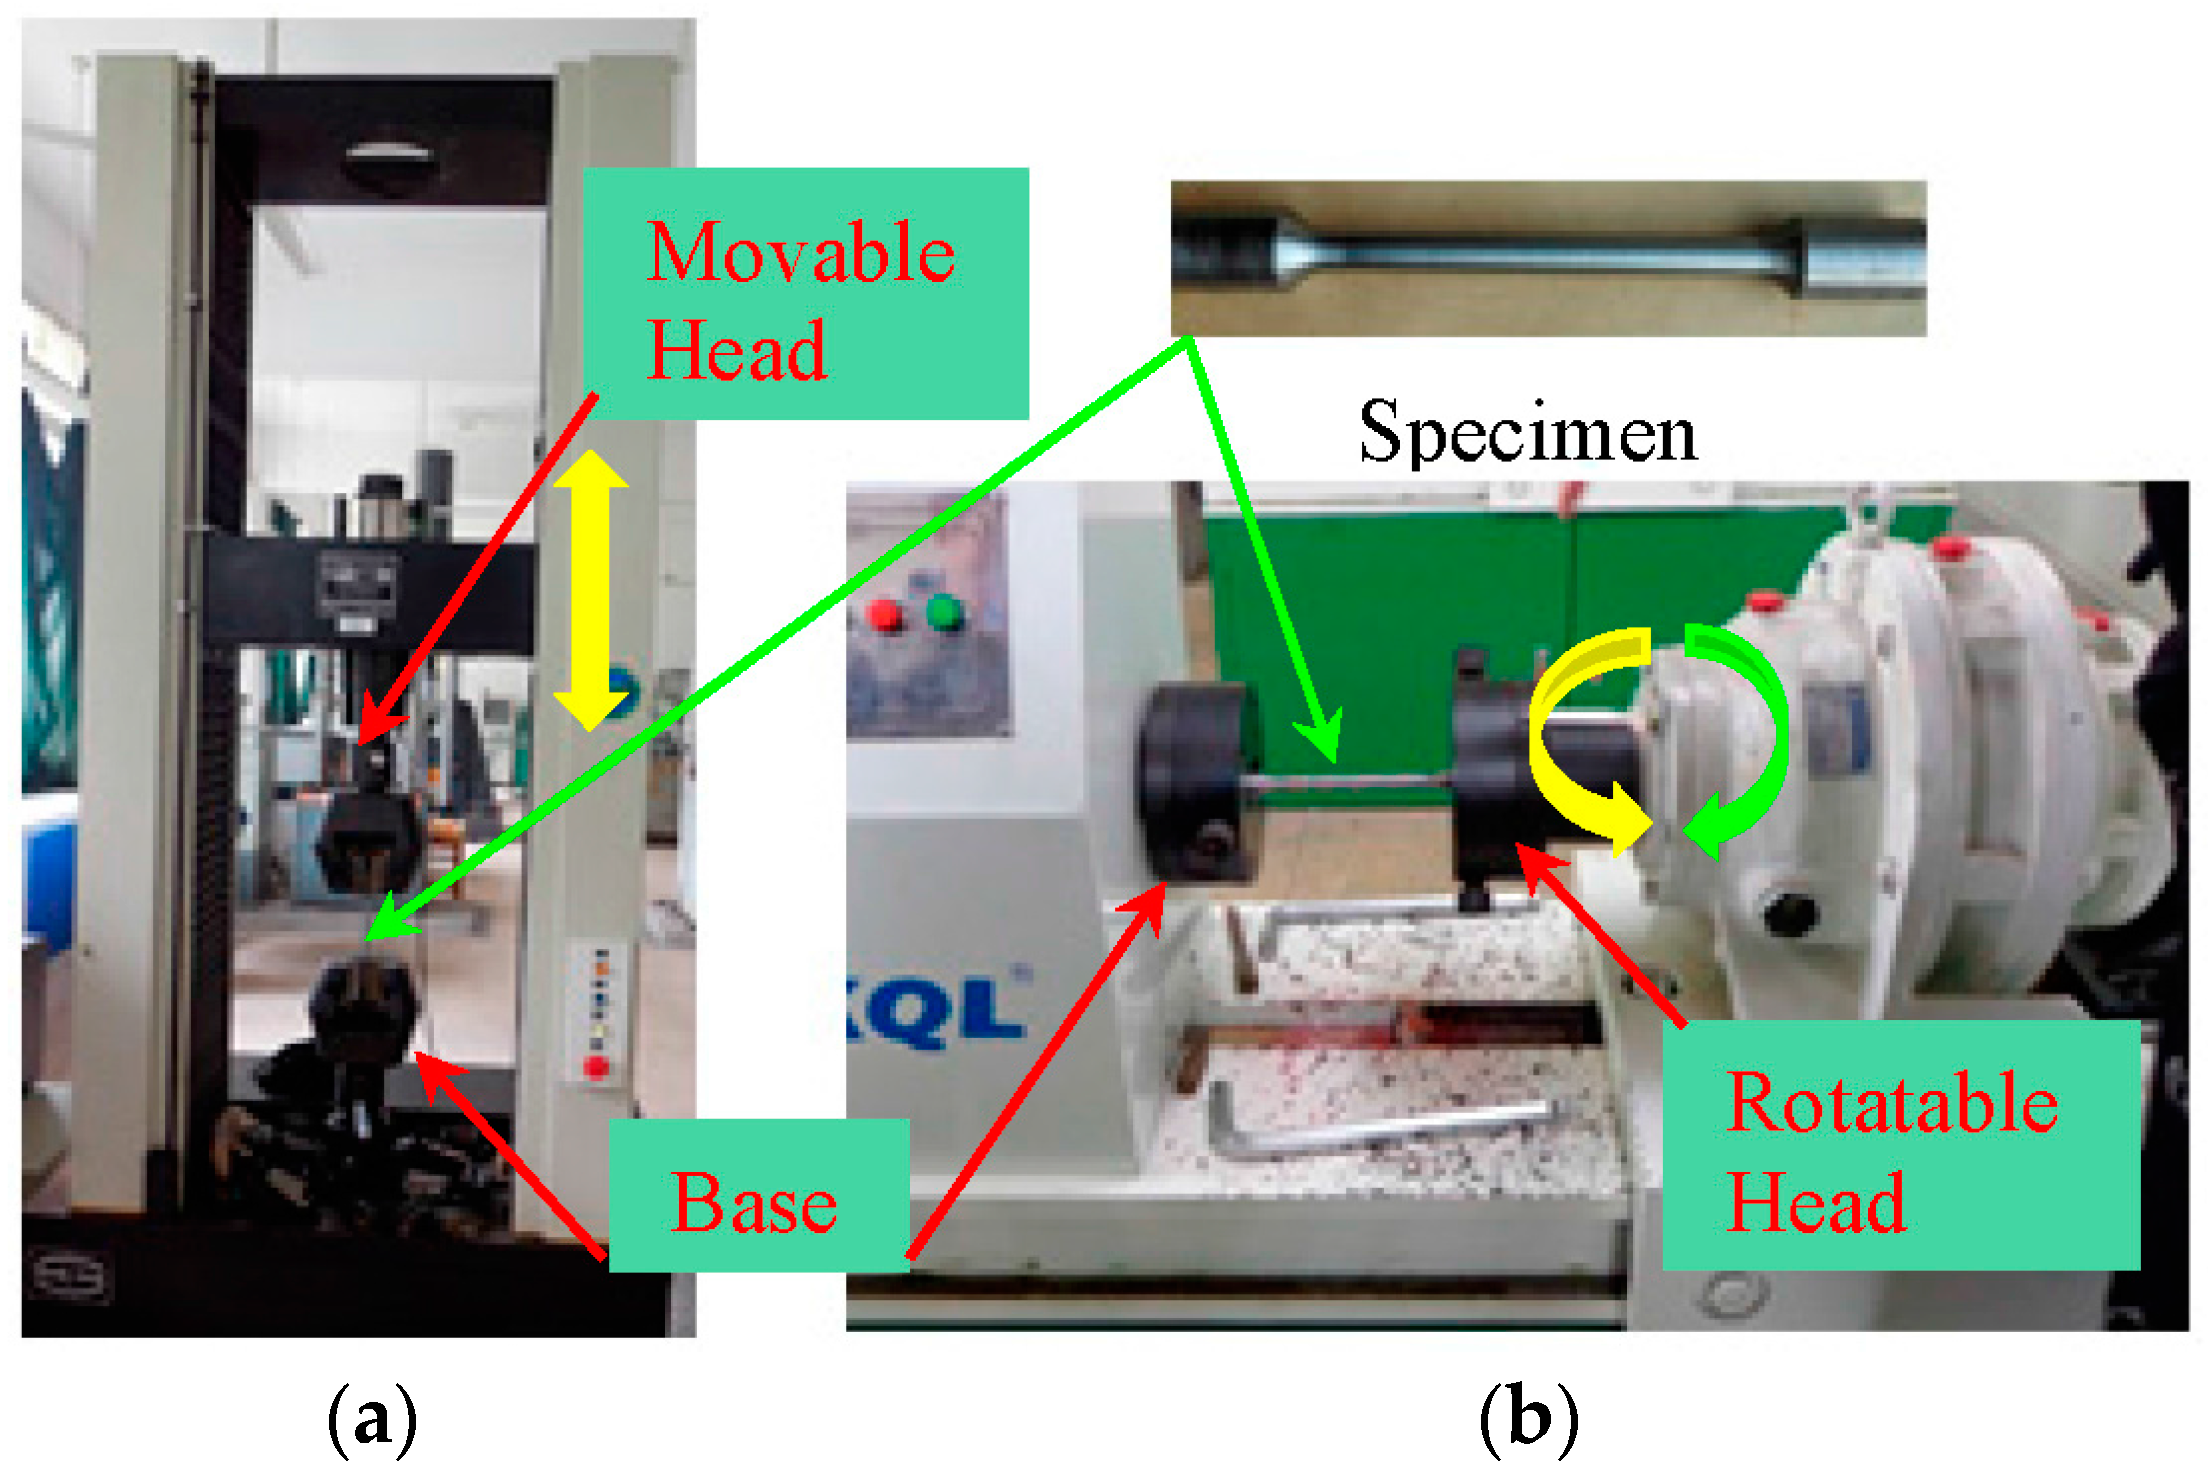
2.1. Test Setup and Specimen
2.2. Test Plan
2.2.1. Monotonic Test
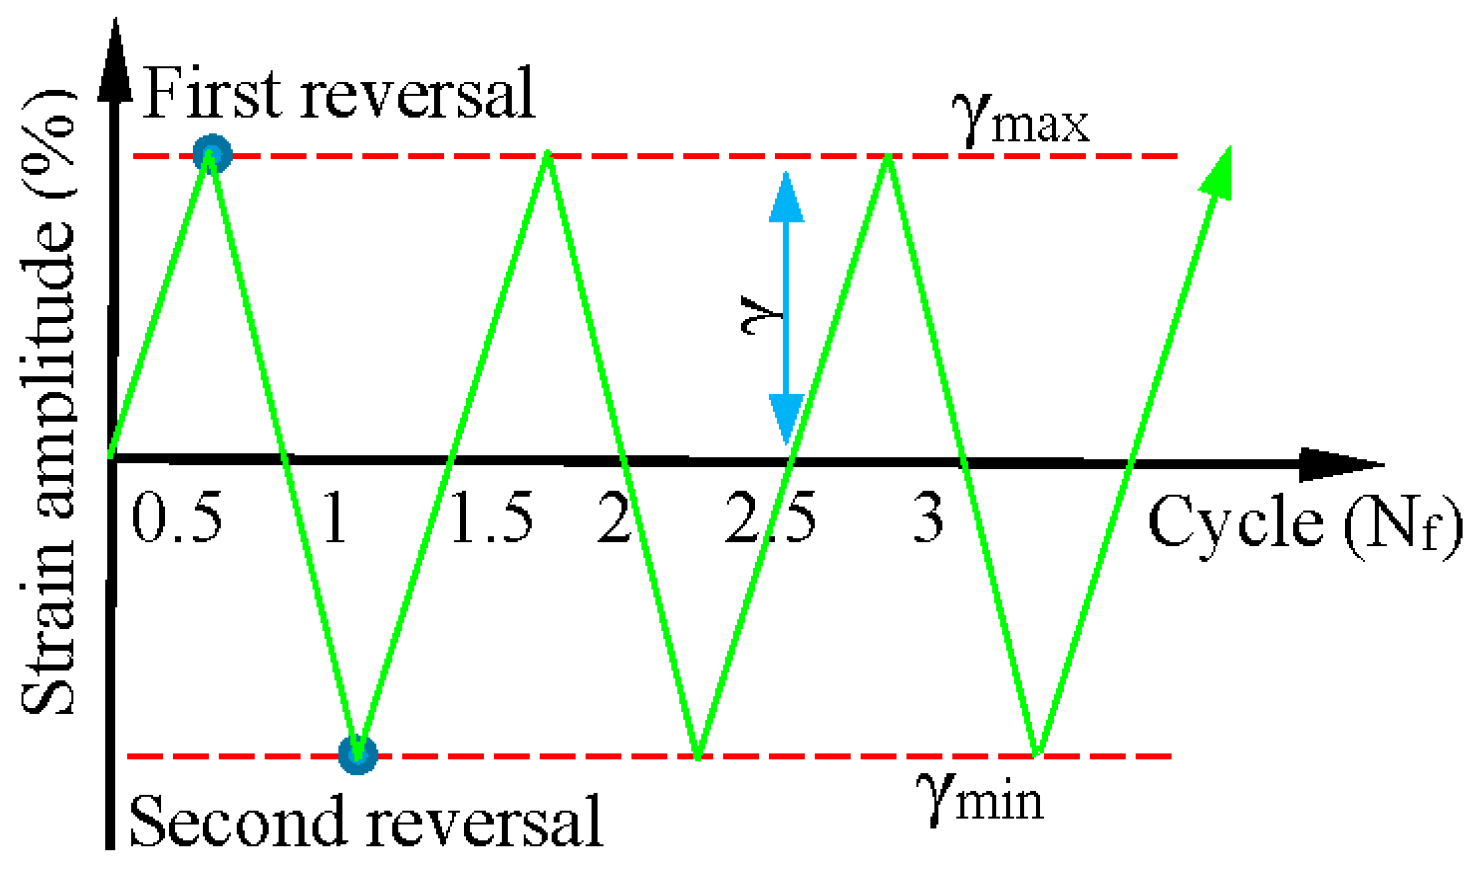
2.2.2. Cyclical Shear Test
3. Results and Discussion
3.1. Monotonic Test
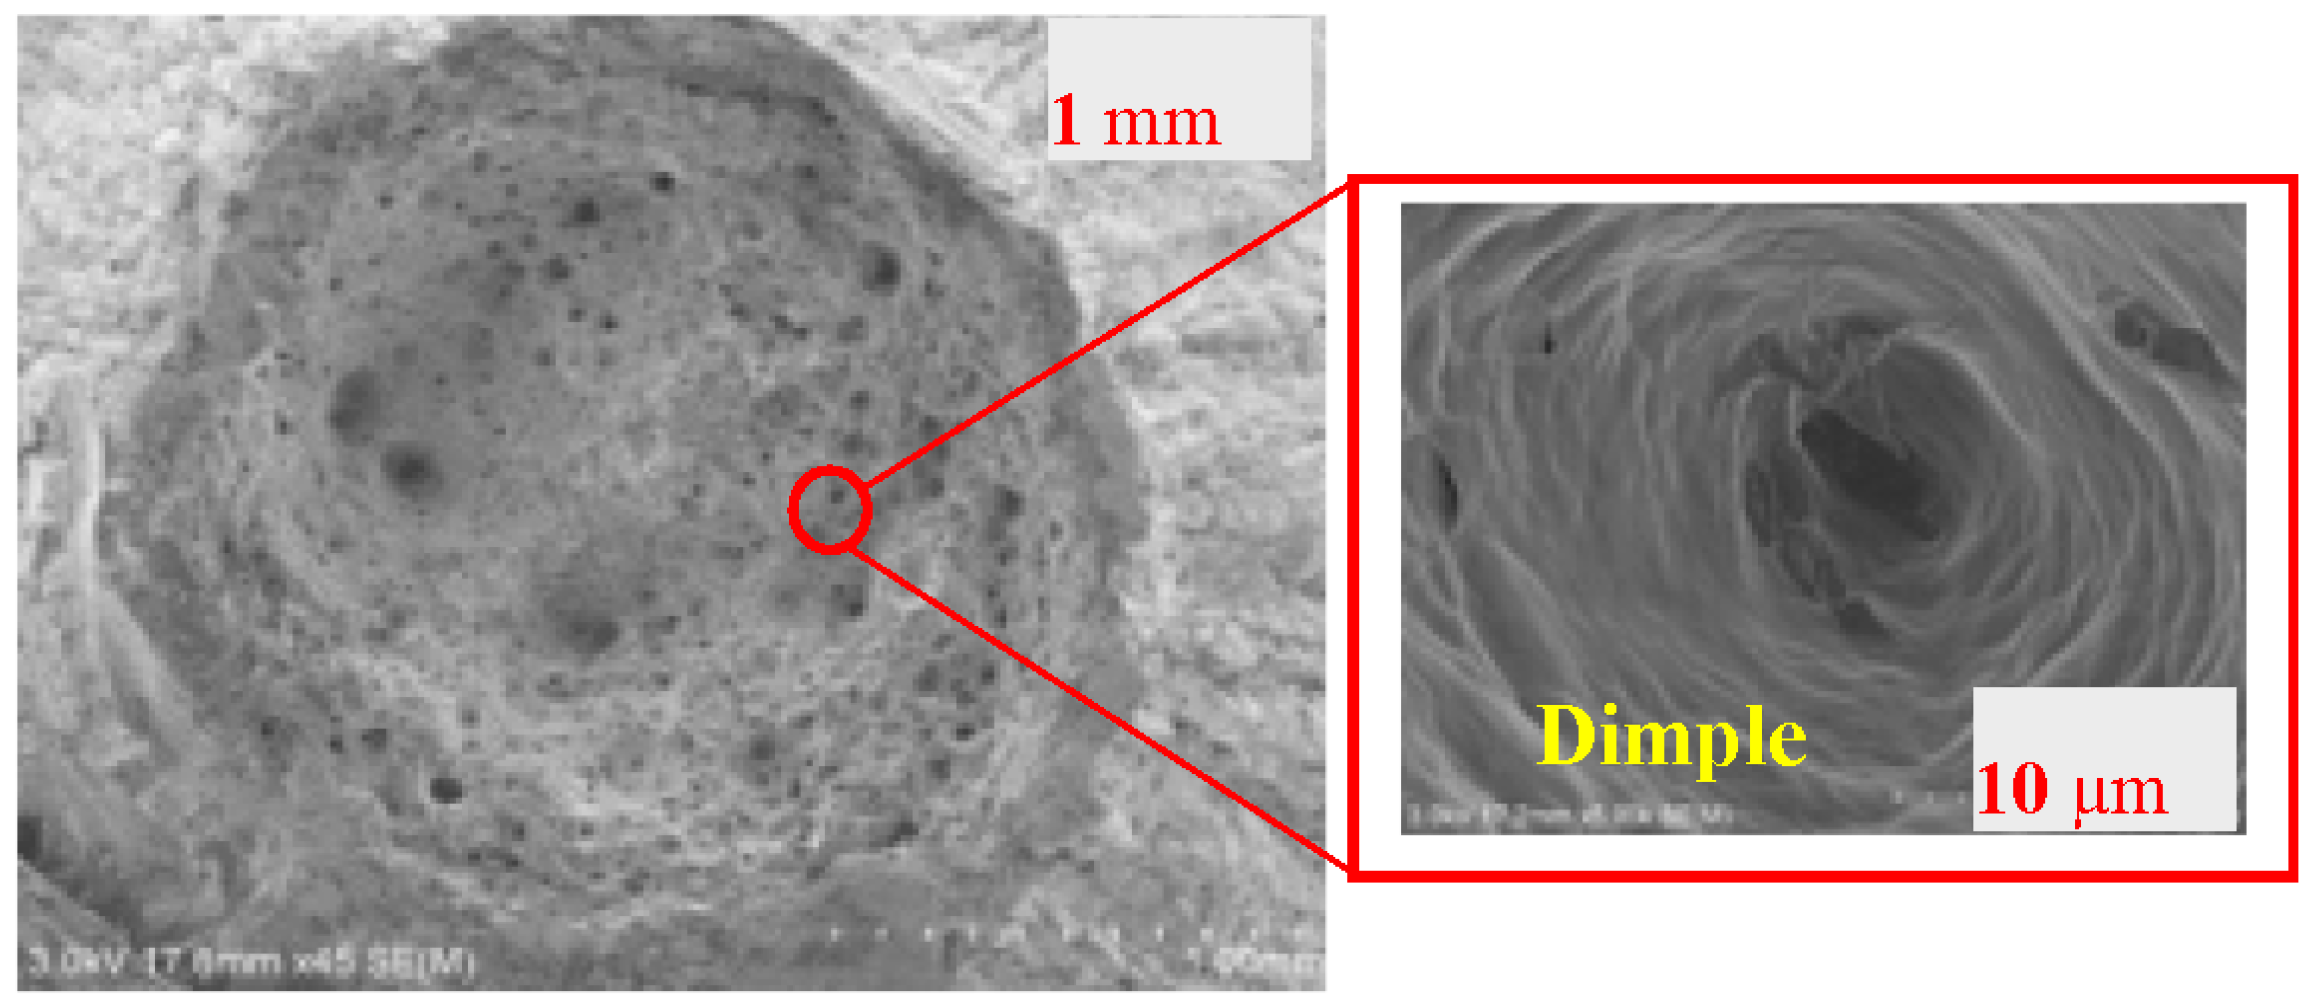
3.1.1. Failure Mode
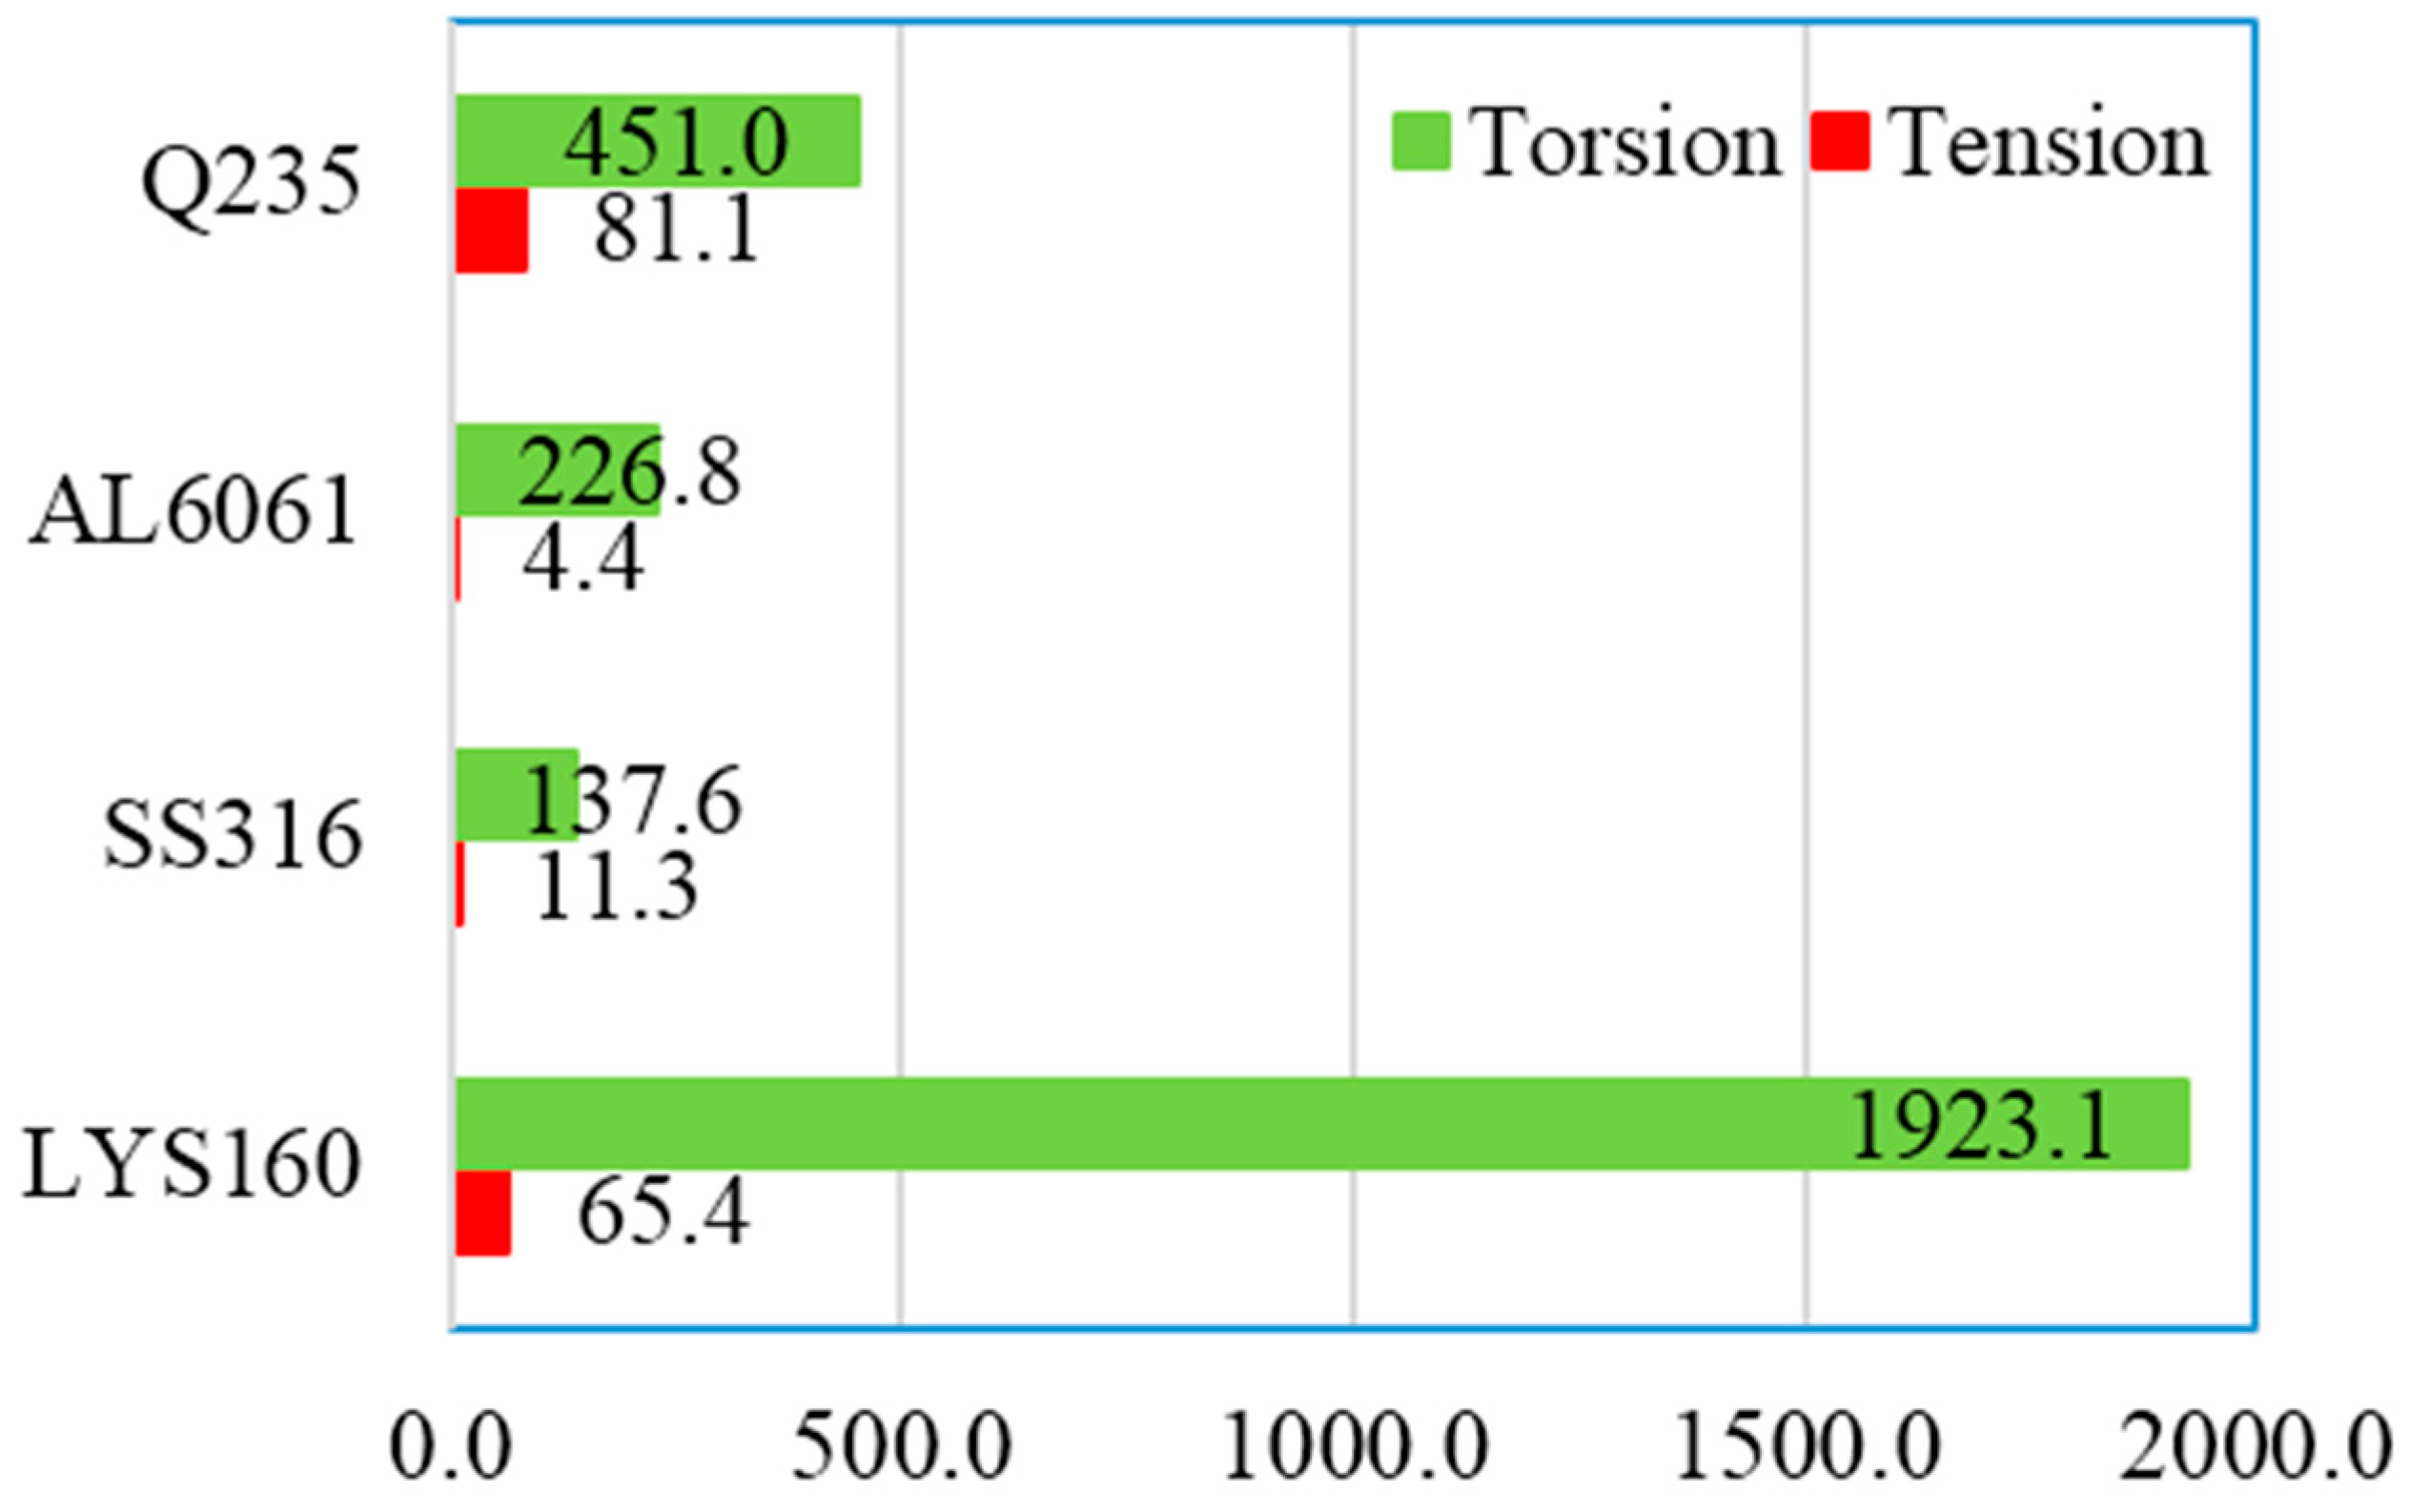
3.1.2. Mechanical Properties
3.2. Cyclical Torsion Test
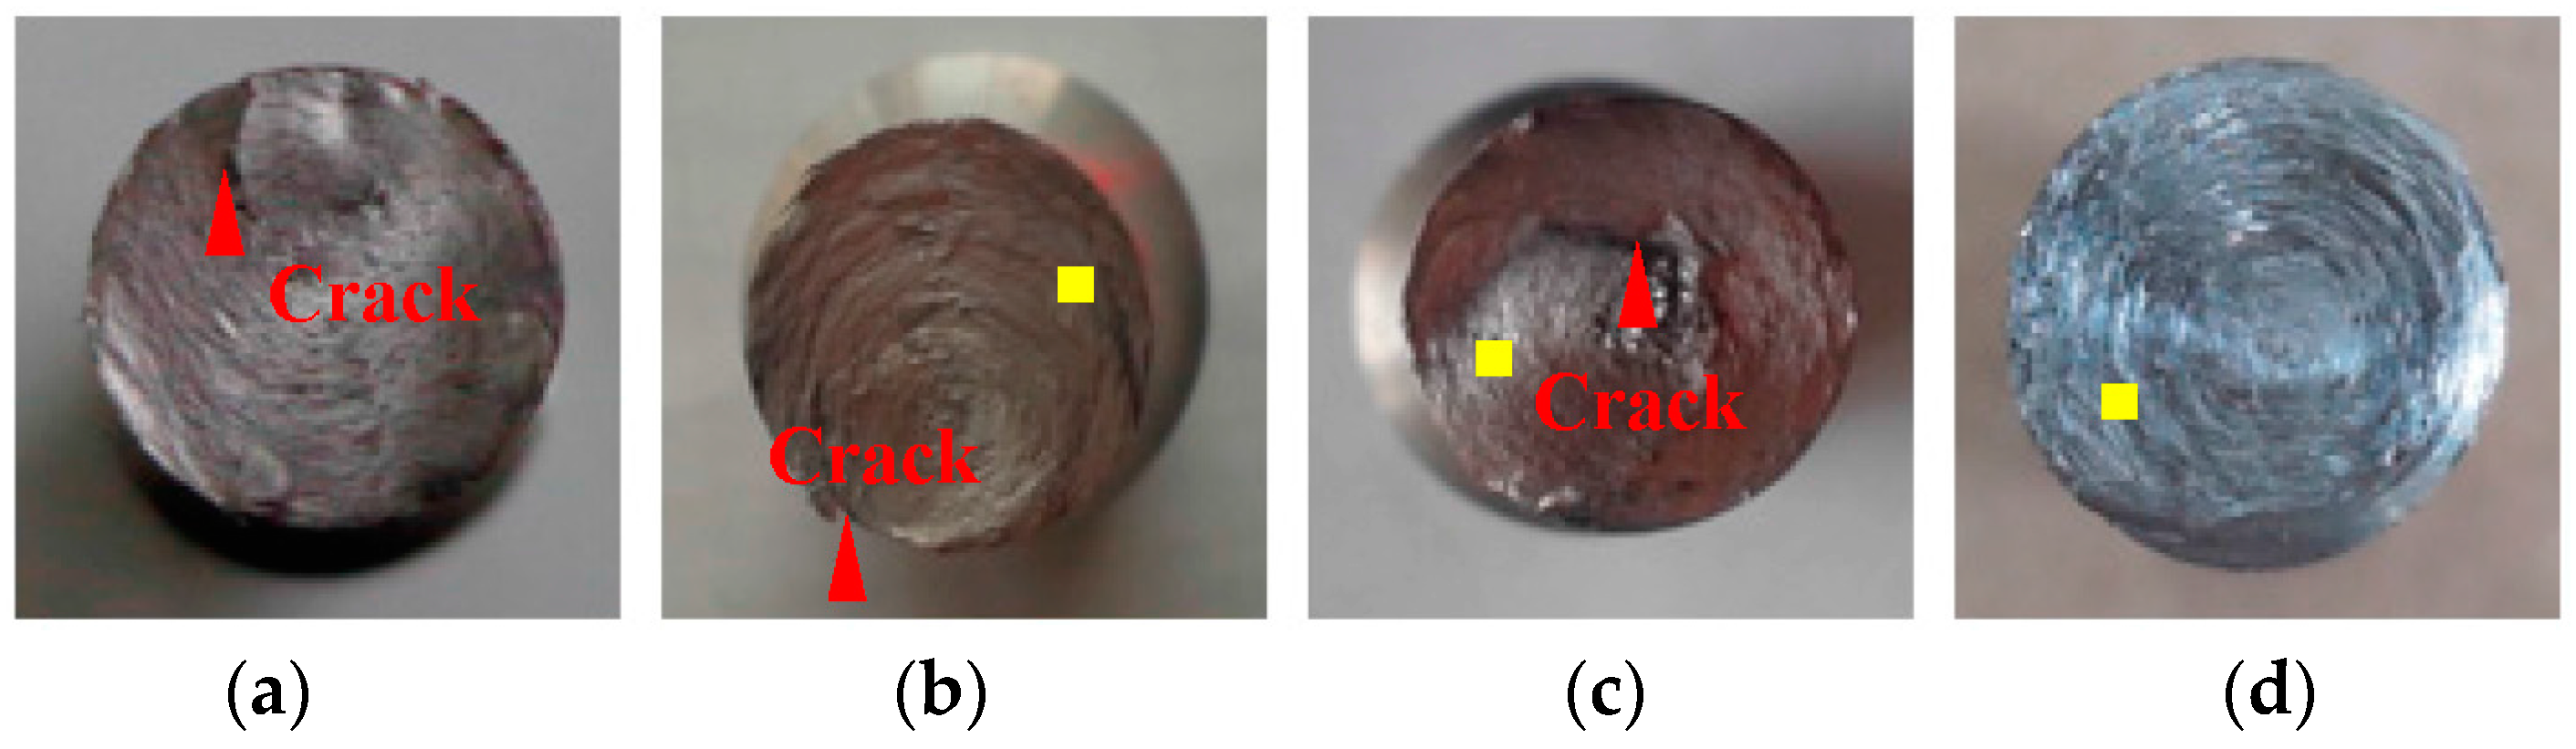
3.2.1. Failure Mode
3.2.2. Hysteretic Curve
3.2.3 Low Cycle Fatigue
Strain-Life Fatigue Curve
Applicable Strain Amplitude
Fatigue Cycles
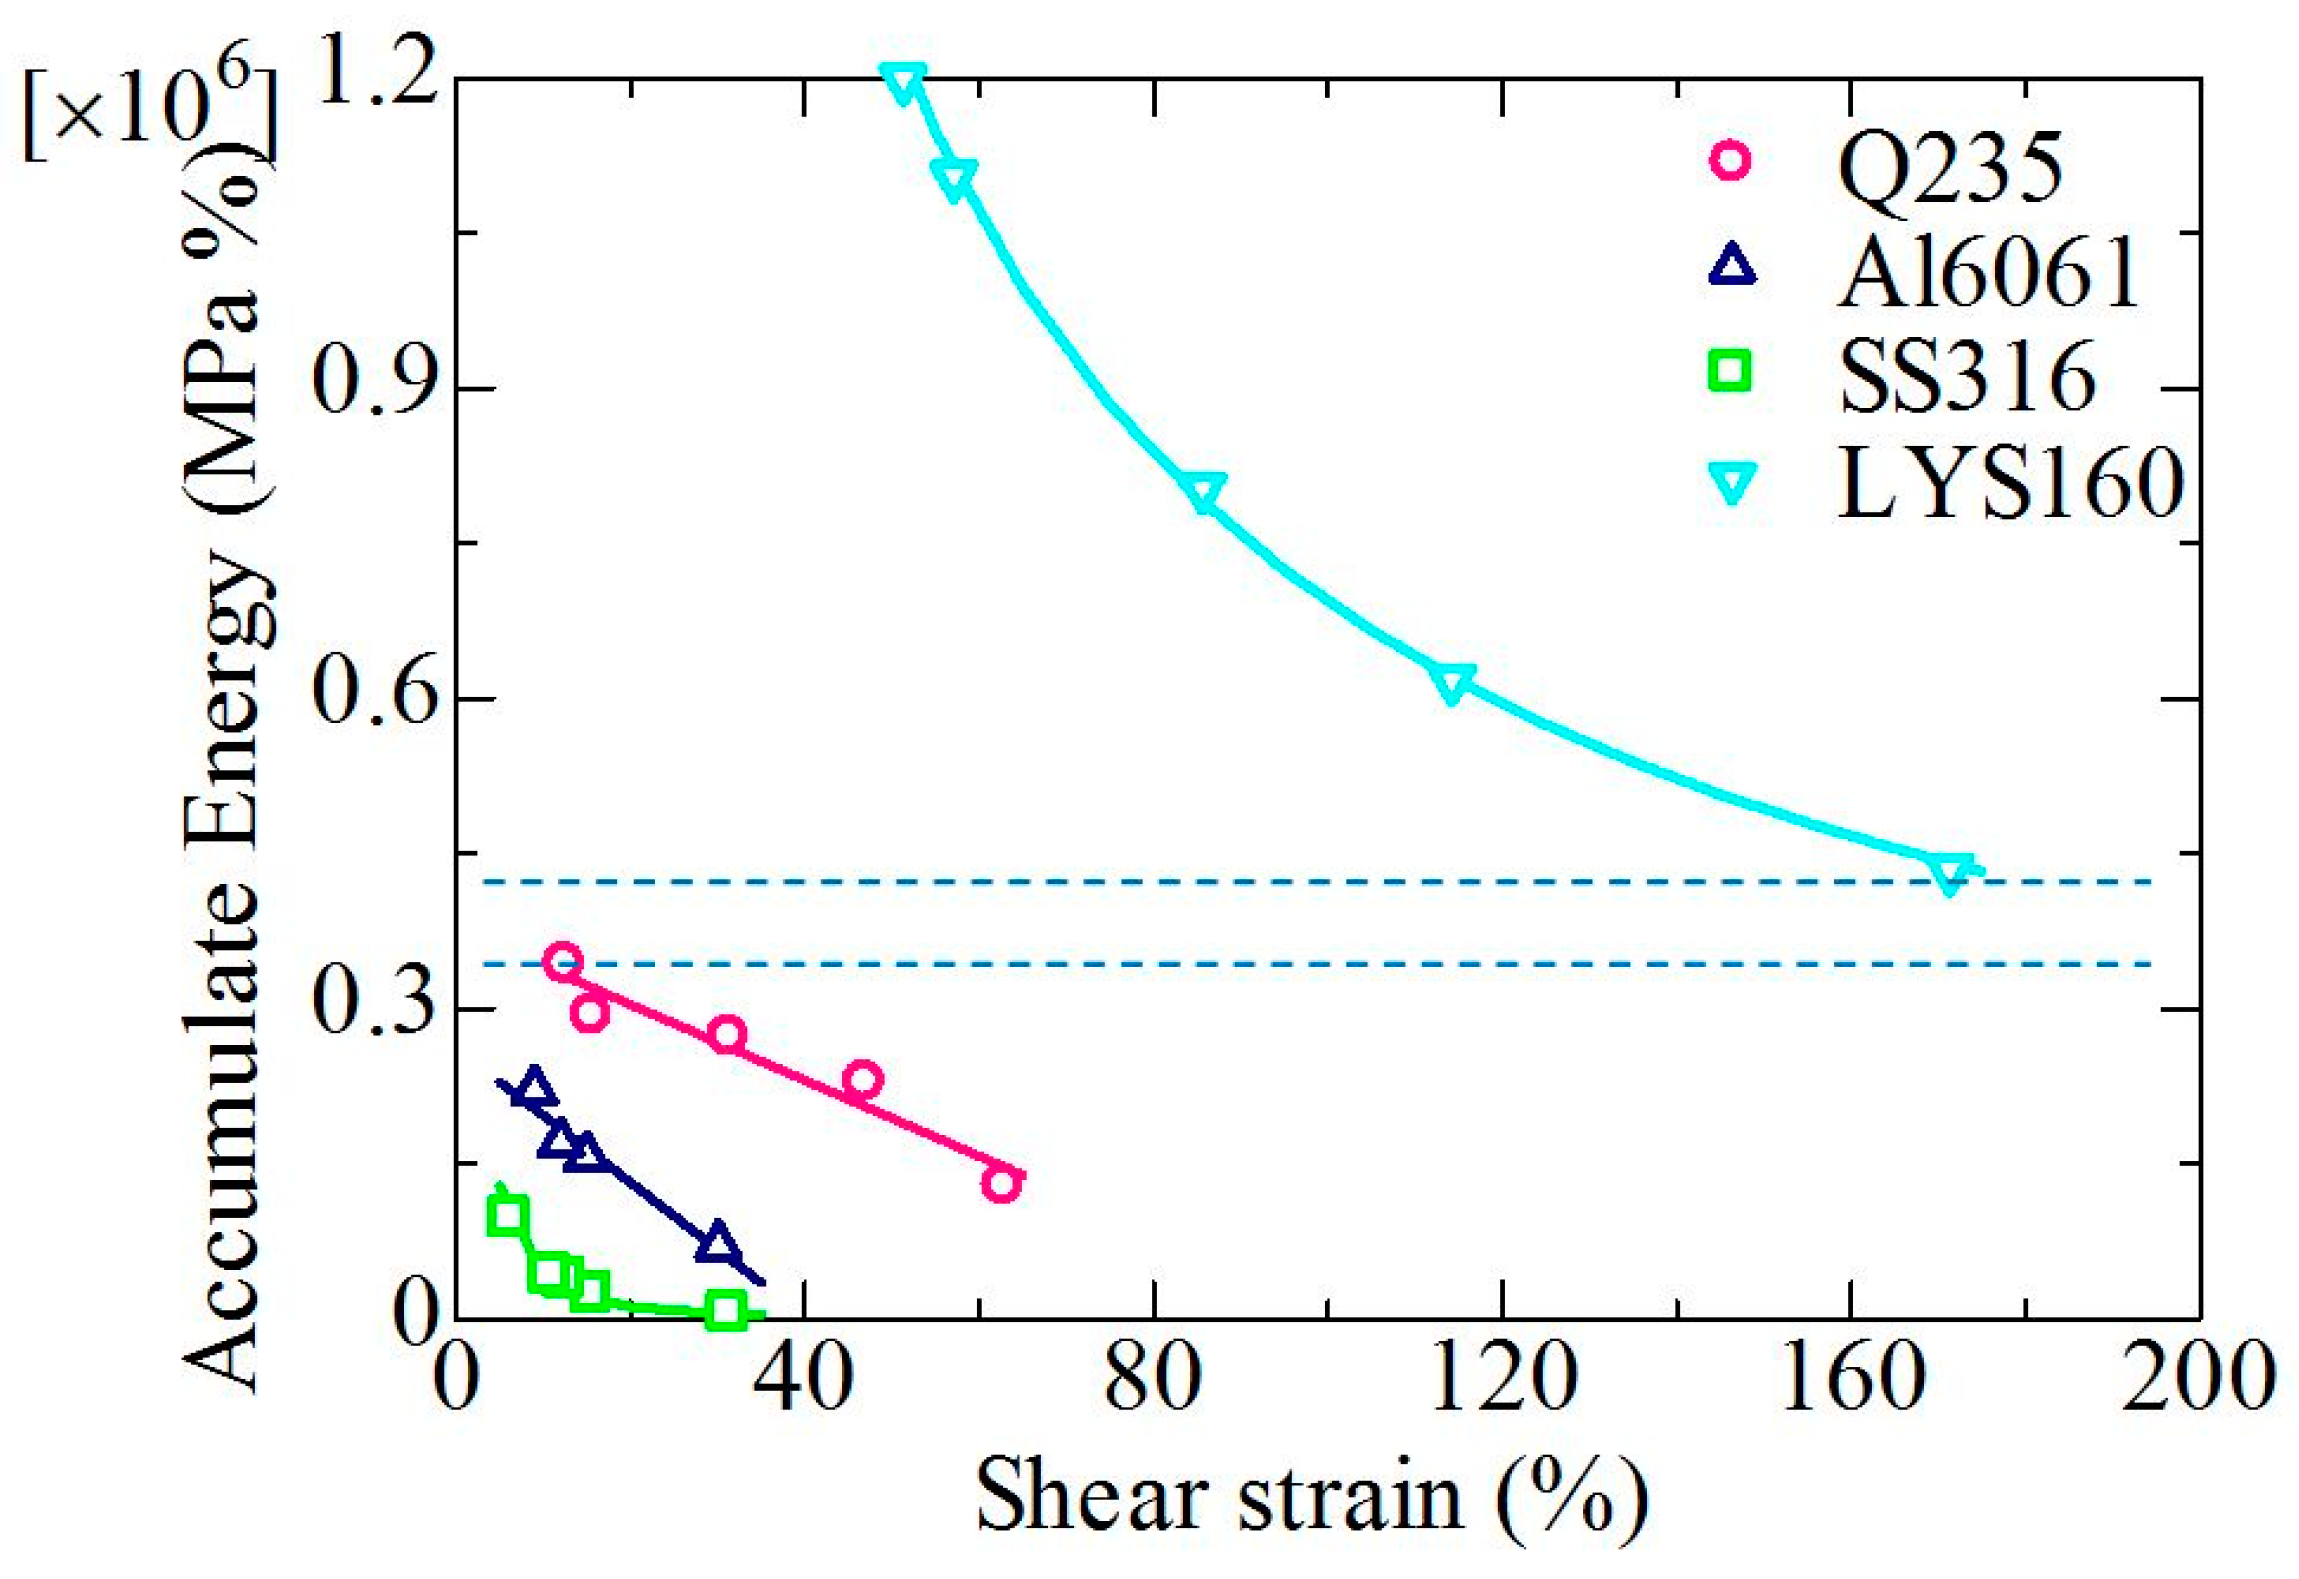
Accumulated Energy
3.3. Stability and Failure Mechanism
4. Conclusions
- (1)
- The deformation capacity of LYS160 was underestimated by the conversion from the traditional tensile test. The maximum shear strain of LYS160 is 760%, which is more than 25 times that of the elongation.
- (2)
- When the fatigue cycles are 10 and 30, the applicable shear strain amplitudes of LYS160 are 81.8% and 47.5%, respectively. The fatigue life of LYS160 is at least five times that of Q235 when the same strain amplitude is adopted in the cyclical shear loading.
- (3)
- Owing to the small transition between the elastic and plastic region, the perfect elastic-plastic model can describe the mechanical property of LYS160 well, under large repeated plastic shear loading. The nonlinear hardening should be considered in the case of Q235 as its applicable shear strain amplitude is not more than 25%.
- (4)
- Dimple and slip plane are the failure behaviors of LYS160 under the tension and the shear loading, respectively, which are characterized as the plastic fracture. It is totally different from the failure mechanism of the conventional metallic materials.
Acknowledgments
Author Contributions
Conflicts of Interest
References
- Takeuchi, T.; Hajjar, J.F.; Matsui, R.; Nishimoto, K.; Aiken, I.D. Effect of local buckling core plate restraint in buckling restrained braces. Eng. Struct. 2012, 44, 304–311. [Google Scholar] [CrossRef]
- Vasdravellis, G.; Karavasilis, T.L.; Uy, B. Large-scale experimental validation of steel posttensioned connections with web hourglass pins. J. Struct. Eng. 2013, 139, 1033–1042. [Google Scholar] [CrossRef]
- De Matteis, G.; Landolfo, R.; Mazzolani, F.M. Seismic response of MR steel frames with low-yield steel shear panels. Eng. Struct. 2003, 25, 155–168. [Google Scholar] [CrossRef]
- Mistakidis, E.S.; de Matteis, G.; Formisano, A. Low yield metal shear panels as an alternative for the seismic upgrading of concrete structures. Adv. Eng. Softw. 2007, 38, 626–636. [Google Scholar] [CrossRef]
- Estrada, I.; Real, E.; Mirambell, E. A new developed expression to determine more realistically the shear buckling stress in steel plate structures. J. Constr. Steel Res. 2008, 64, 737–747. [Google Scholar] [CrossRef]
- Brando, G.; de Matteis, G. Experimental and numerical analysis of a multi-stiffened pure aluminium shear panel. Thin Walled Struct. 2011, 49, 1277–1287. [Google Scholar] [CrossRef]
- Deng, K.; Pan, P.; Li, W.; Xue, Y. Development of a buckling restrained shear panel damper. J. Constr. Steel Res. 2015, 106, 311–321. [Google Scholar] [CrossRef]
- Brando, G.; D’Agostino, F.; de Matteis, G. Experimental tests of a new hysteretic damper made of buckling inhibited shear panels. Mater. Struct. 2013, 46, 2121–2133. [Google Scholar] [CrossRef]
- Deng, K.; Pan, P.; Su, Y.; Ran, T.; Xue, Y. Development of an energy dissipation restrainer for bridges using a steel shear panel. J. Constr. Steel Res. 2014, 101, 83–95. [Google Scholar] [CrossRef]
- Rai, D.C.; Annam, P.K.; Pradhan, T. Seismic testing of steel braced frames with aluminum shear yielding dampers. Eng. Struct. 2013, 46, 737–747. [Google Scholar] [CrossRef]
- Brando, G.; de Matteis, G. Design of low strength-high hardening metal multi-stiffened shear plates. Eng. Struct. 2014, 60, 2–10. [Google Scholar] [CrossRef]
- Chen, Z.; Dai, Z.; Huang, Y.; Bian, G. Numerical simulation of large deformation in shear panel dampers using smoothed particle hydrodynamics. Eng. Struct. 2013, 48, 245–254. [Google Scholar] [CrossRef]
- Piedrafita, D.; Cahis, X.; Simon, E.; Comas, J. A new modular buckling restrained brace for seismic resistant buildings. Eng. Struct. 2013, 56, 1967–1975. [Google Scholar] [CrossRef]
- Abebe, D.Y.; Jeong, S.J.; Getahune, B.M.; Segu, D.Z.; Choi, J.H. Hysteretic characteristics of shear panel damper made of low yield point steel. Mater. Res. Innov. 2015, 19, 902–910. [Google Scholar] [CrossRef]
- Bouvier, S.; Haddadi, H.; Levée, P.; Teodosiu, C. Simple shear tests: Experimental techniques and characterization of the plastic anisotropy of rolled sheets at large strains. J. Mater. Process. Technol. 2006, 172, 96–103. [Google Scholar] [CrossRef]
- Zhang, C.; Zhang, Z.; Shi, J. Development of high deformation capacity low yield strength steel shear panel damper. J. Constr. Steel Res. 2012, 75, 116–130. [Google Scholar] [CrossRef]
- Liu, Y.; Shimoda, M. Shape optimization of shear panel damper for improving the deformation ability under cyclic loading. Struct. Multidisc. Optim. 2013, 48, 427–435. [Google Scholar] [CrossRef]
- Zhang, C.; Zhang, Z.; Zhang, Q. Static and dynamic cyclic performance of a low-yield-strength steel shear panel damper. J. Constr. Steel Res. 2012, 79, 195–203. [Google Scholar] [CrossRef]
- Zhang, C.; Aoki, T.; Zhang, Q.; Wu, M. Experimental investigation on the low-yield-strength steel shear panel damper under different loading. J. Constr. Steel Res. 2013, 84, 105–113. [Google Scholar] [CrossRef]
- Dusicka, P.; Itani, A.M.; Buckle, I.G. Cyclic response of plate steels under large inelastic strains. J. Constr. Steel Res. 2007, 63, 156–164. [Google Scholar] [CrossRef]
- Tateishi, K.; Hanji, T.; Minami, K. A prediction model for extremely low cycle fatigue strength of structural steel. Int. J. Fatigue 2007, 29, 887–896. [Google Scholar] [CrossRef]
- De Matteis, G.; Mazzolani, F.M.; Panico, S. Experimental tests on pure aluminium shear panels with welded stiffeners. Eng. Struct. 2008, 30, 1734–1744. [Google Scholar] [CrossRef]
- Nakashima, M.; Iwai, S.; Iwata, M.; Takeuchi, T.; Konomi, S.; Akazawa, T.; Saburi, K. Energy dissipation behavior of shear panels made of low yield steel. Earthq. Eng. Struct. Dyn. 1994, 23, 1299–1313. [Google Scholar] [CrossRef]
- Nip, K.H.; Gardner, L.; Davies, C.M.; Elghazouli, A.Y. Extremely low cycle fatigue tests on structural carbon steel and stain-less steel. J. Constr. Steel Res. 2010, 66, 69–110. [Google Scholar] [CrossRef]
- Zhang, C.; Zhu, J.; Wu, M.; Yu, J.; Zhao, J. The lightweight design of a seismic low-yield-strength steel shear panel damper. Materials 2016, 9, 424. [Google Scholar] [CrossRef]


| No. | Name | Diameter (mm) | Length (mm) | Test Type | |
|---|---|---|---|---|---|
| Tension | Torsion | ||||
| 1 | Q235 | 10 | 100 | Ten1 | Tor1 |
| 2 | Q235 | Ten2 | Tor2 | ||
| 3 | Q235 | Ten3 | Tor3 | ||
| 4 | AL6061 | Ten4 | Tor4 | ||
| 5 | AL6061 | Ten5 | Tor5 | ||
| 6 | AL6061 | Ten6 | Tor6 | ||
| 7 | SS316 | Ten7 | Tor7 | ||
| 8 | SS316 | Ten8 | Tor8 | ||
| 9 | SS316 | Ten9 | Tor9 | ||
| 10 | LYS160 | Ten10 | Tor10 | ||
| 11 | LYS160 | Ten11 | Tor11 | ||
| 12 | LYS160 | Ten12 | Tor12 | ||
| No. | Material | Name | Shear Strain | Fatigue Cycle |
|---|---|---|---|---|
| (%) | (Nf) | |||
| 1 | Q235 | Q235-1 | 62.8 | 1.75 |
| 2 | Q235-2 | 47.0 | 4.50 | |
| 3 | Q235-3 | 31.3 | 8.00 | |
| 4 | Q235-4 | 15.6 | 19.25 | |
| 5 | Q235-5 | 12.5 | 30.75 | |
| 6 | AL6061 | AL-1 | 15.6 | 1.75 |
| 7 | AL-2 | 12.5 | 4.00 | |
| 8 | AL-3 | 9.8 | 4.25 | |
| 9 | AL-4 | 6.2 | 17.75 | |
| 10 | SS316 | SS-1 | 30.0 | 1.75 |
| 11 | SS-2 | 15.0 | 8.25 | |
| 12 | SS-3 | 12.0 | 11.25 | |
| 13 | SS-4 | 9.0 | 21.25 | |
| 14 | LYS160 | LYS-1 | 171.4 | 2.25 |
| 15 | LYS-2 | 114.2 | 5.00 | |
| 16 | LYS-3 | 85.6 | 9.50 | |
| 17 | LYS-4 | 57.1 | 20.00 | |
| 18 | LYS-5 | 51.3 | 26.00 |
© 2016 by the authors; licensee MDPI, Basel, Switzerland. This article is an open access article distributed under the terms and conditions of the Creative Commons Attribution (CC-BY) license (http://creativecommons.org/licenses/by/4.0/).
Share and Cite
Zhang, C.; Wang, L.; Wu, M.; Zhao, J. Plastic Behavior of Metallic Damping Materials under Cyclical Shear Loading. Materials 2016, 9, 496. https://doi.org/10.3390/ma9060496
Zhang C, Wang L, Wu M, Zhao J. Plastic Behavior of Metallic Damping Materials under Cyclical Shear Loading. Materials. 2016; 9(6):496. https://doi.org/10.3390/ma9060496
Chicago/Turabian StyleZhang, Chaofeng, Longfei Wang, Meiping Wu, and Junhua Zhao. 2016. "Plastic Behavior of Metallic Damping Materials under Cyclical Shear Loading" Materials 9, no. 6: 496. https://doi.org/10.3390/ma9060496