
Comparison of Cyclic Hysteresis Behavior between Cross-Ply C/SiC and SiC/SiC Ceramic-Matrix Composites


Abstract
:1. Introduction
2. Materials and Experimental Procedures
2.1. Cross-Ply C/SiC Composite
2.2. Cross-Ply SiC/SiC Composite
3. Hysteresis Loops Models Considering Multiple Matrix Cracking Modes


4. Experimental Comparisons
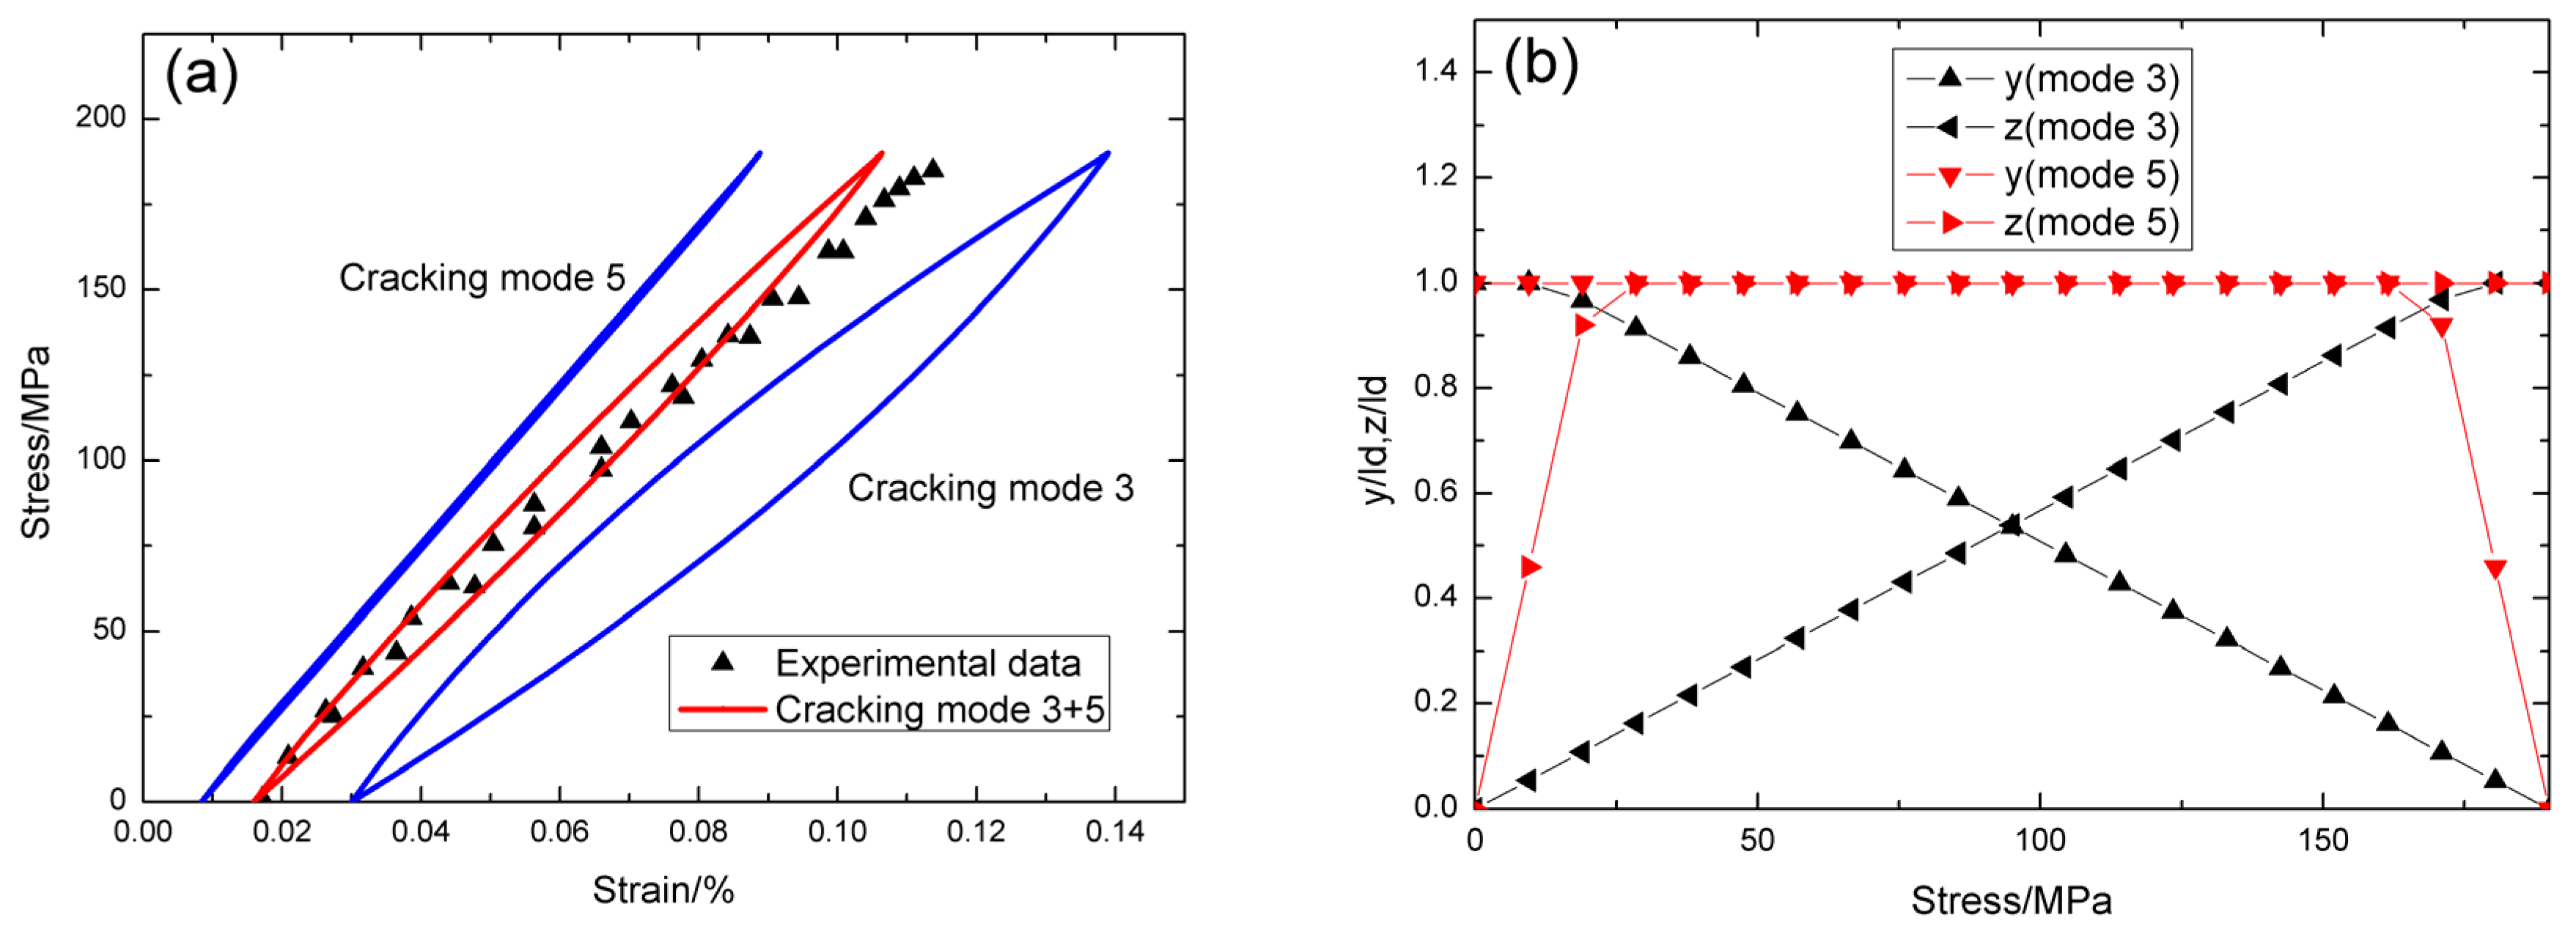
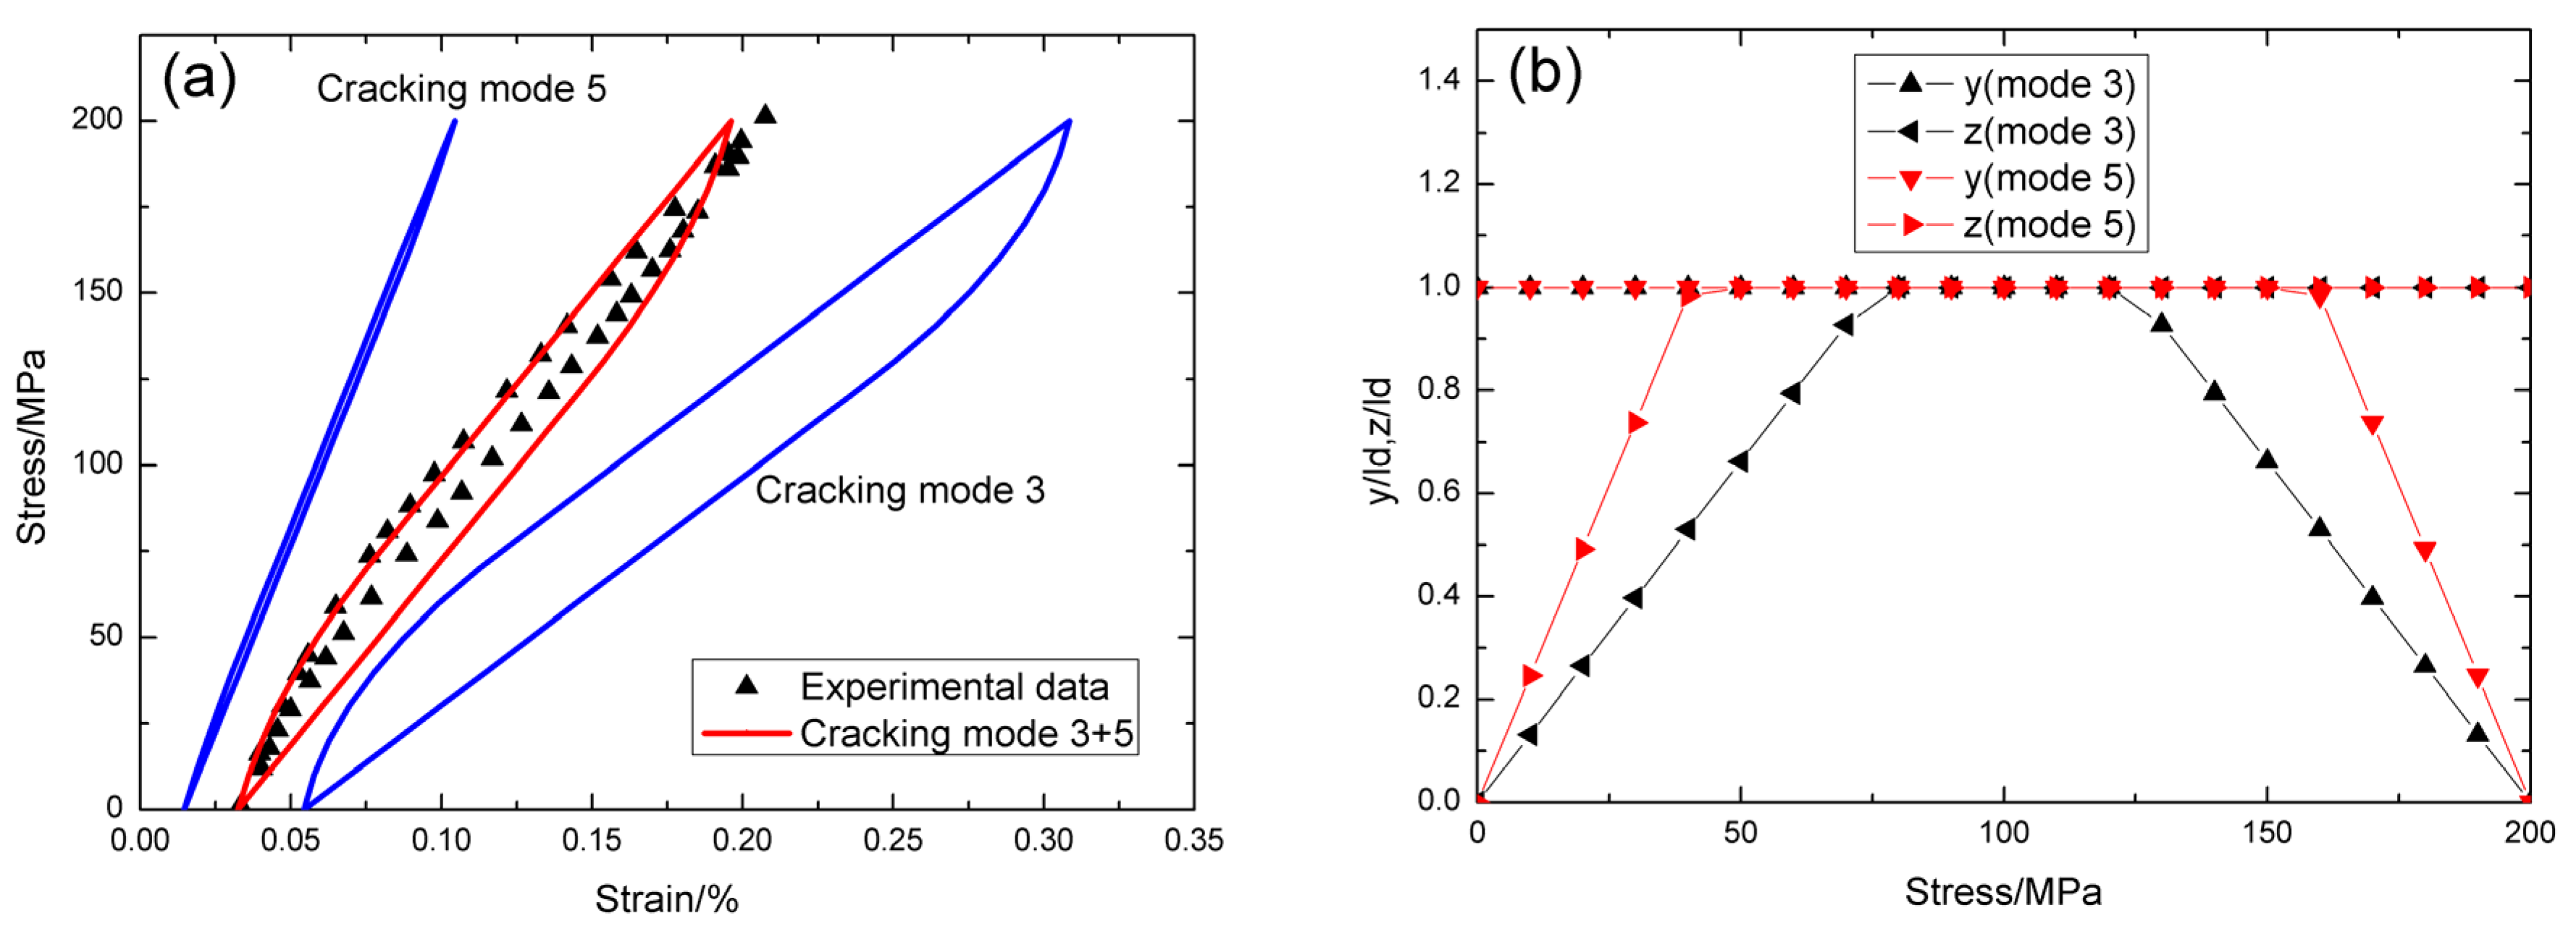
4.1. Cross-Ply C/SiC Composite


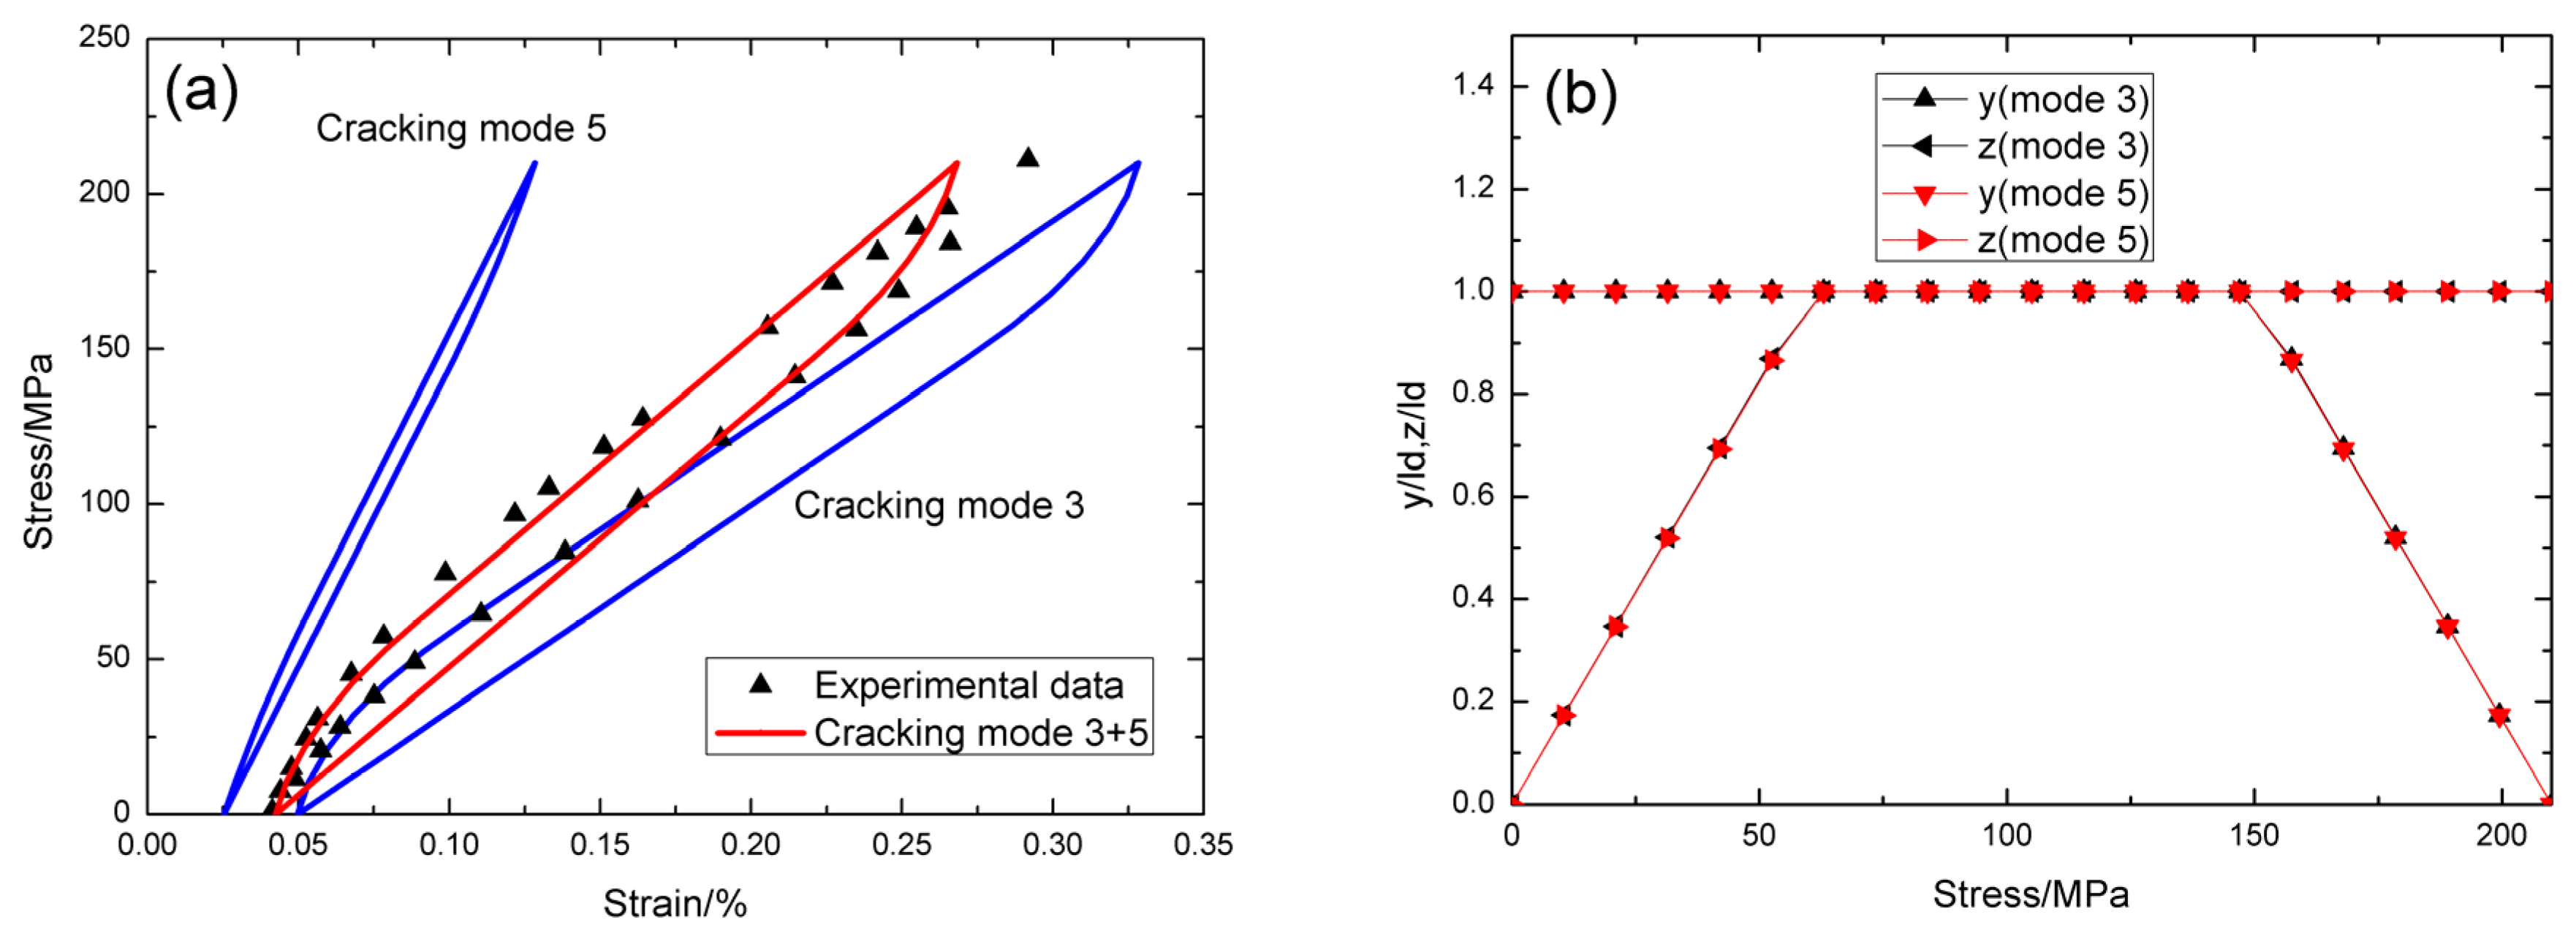
4.2. Cross-Ply SiC/SiC Composite


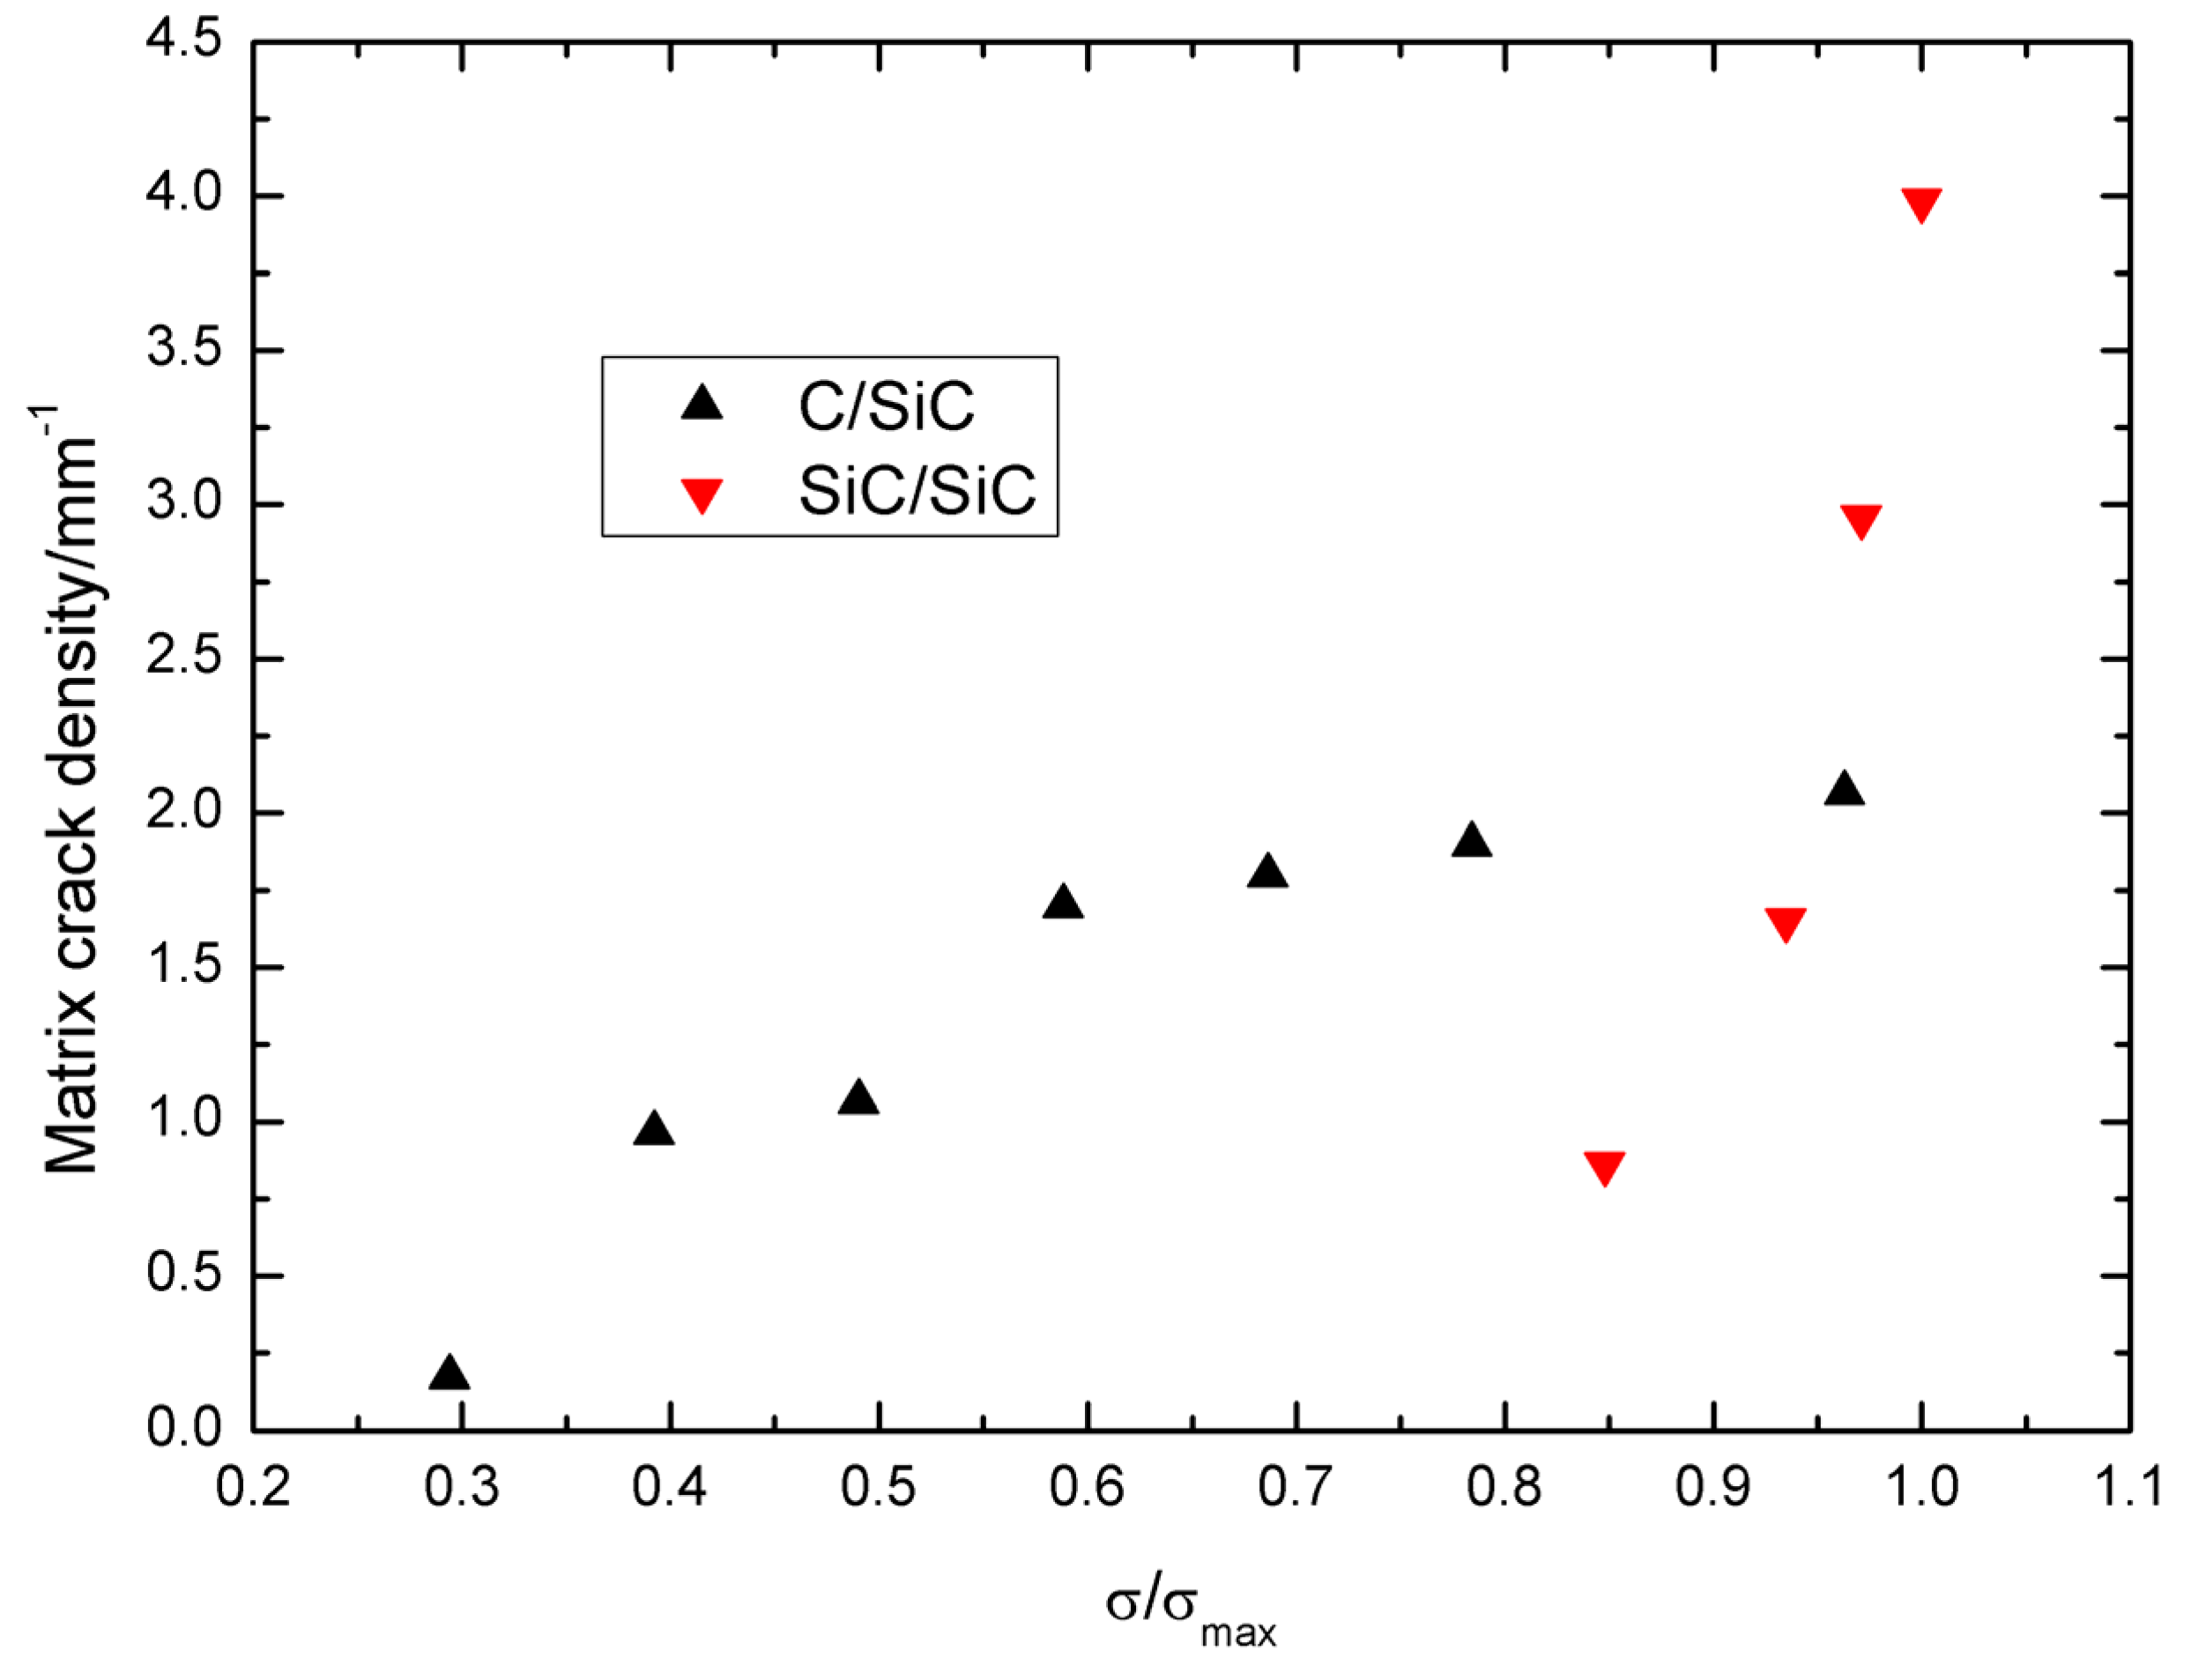
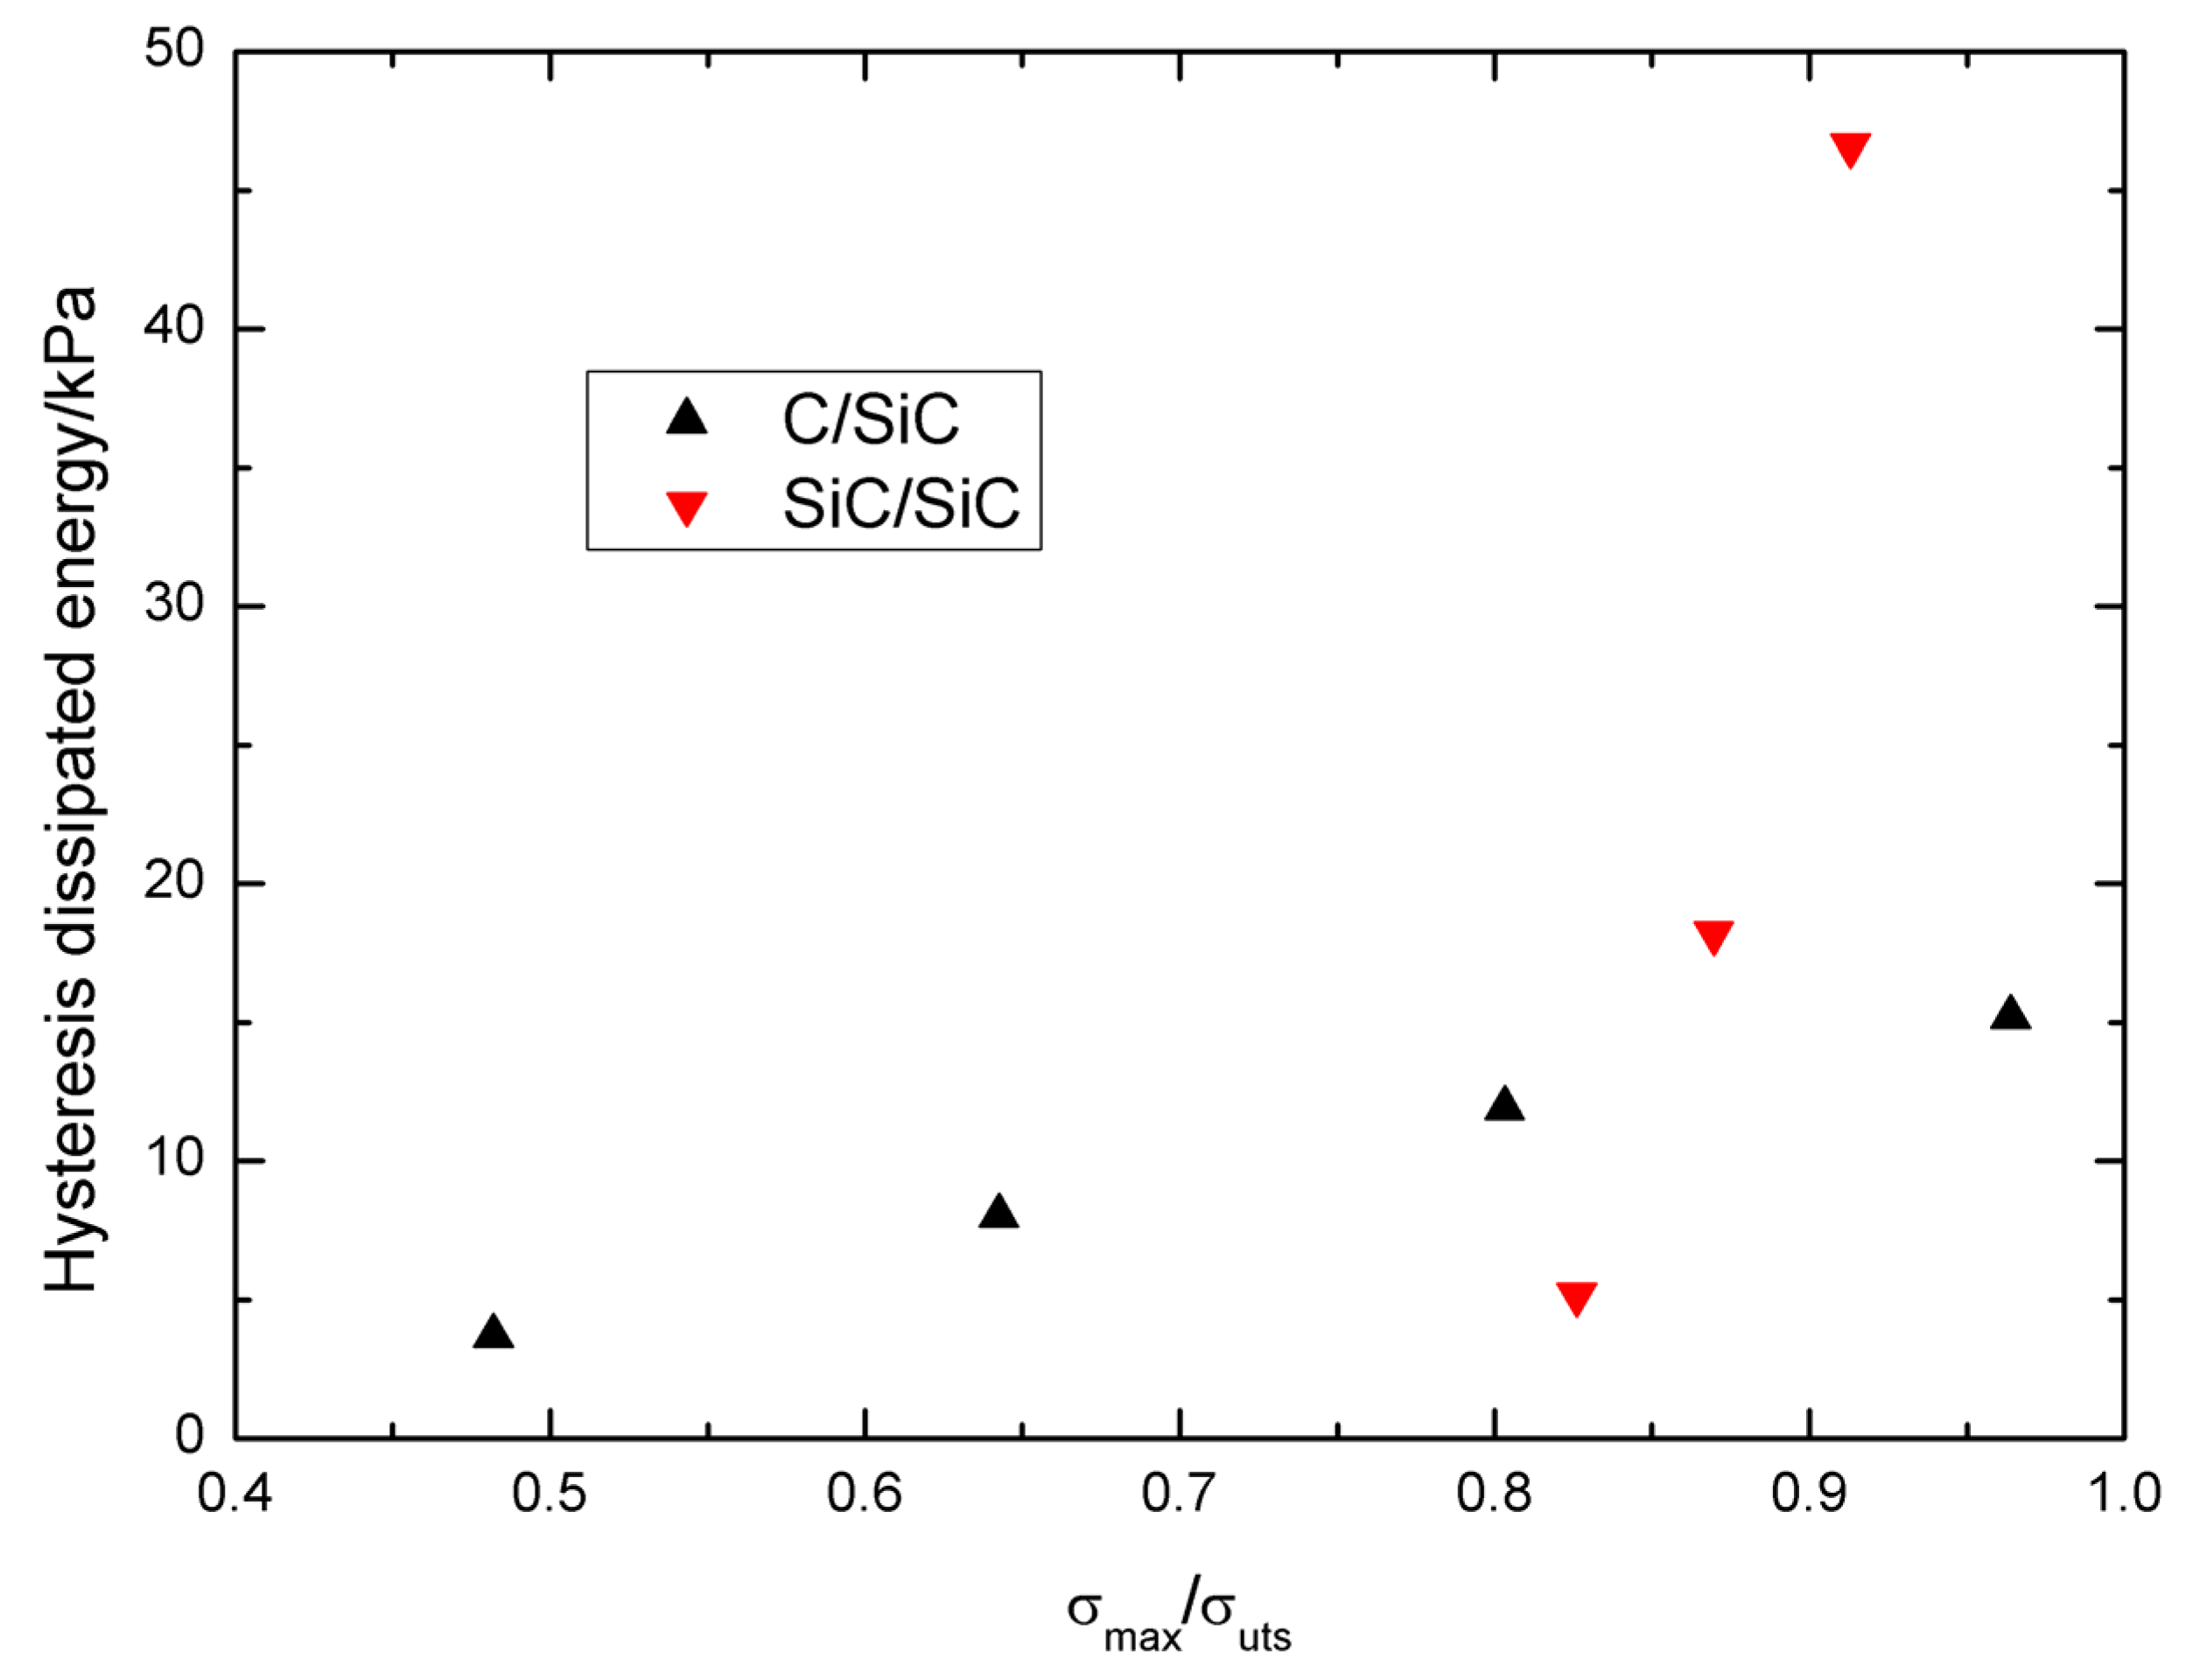
5. Comparison between C/SiC and SiC/SiC Composite


| Cracking Modes | 60 MPa | 80 MPa | 100 MPa | 120 MPa |
|---|---|---|---|---|
| Matrix cracking mode 3 | case 2 | case 2 | case 4 | case 4 |
| Matrix cracking mode 5 | case 1 | case 1 | case 1 | case 2 |
| Cracking Modes | 190 MPa | 200 MPa | 210 MPa |
|---|---|---|---|
| Matrix cracking mode 3 | case 1 | case 4 | case 4 |
| Matrix cracking mode 5 | case 1 | case 1 | case 1 |
6. Conclusions
- (1)
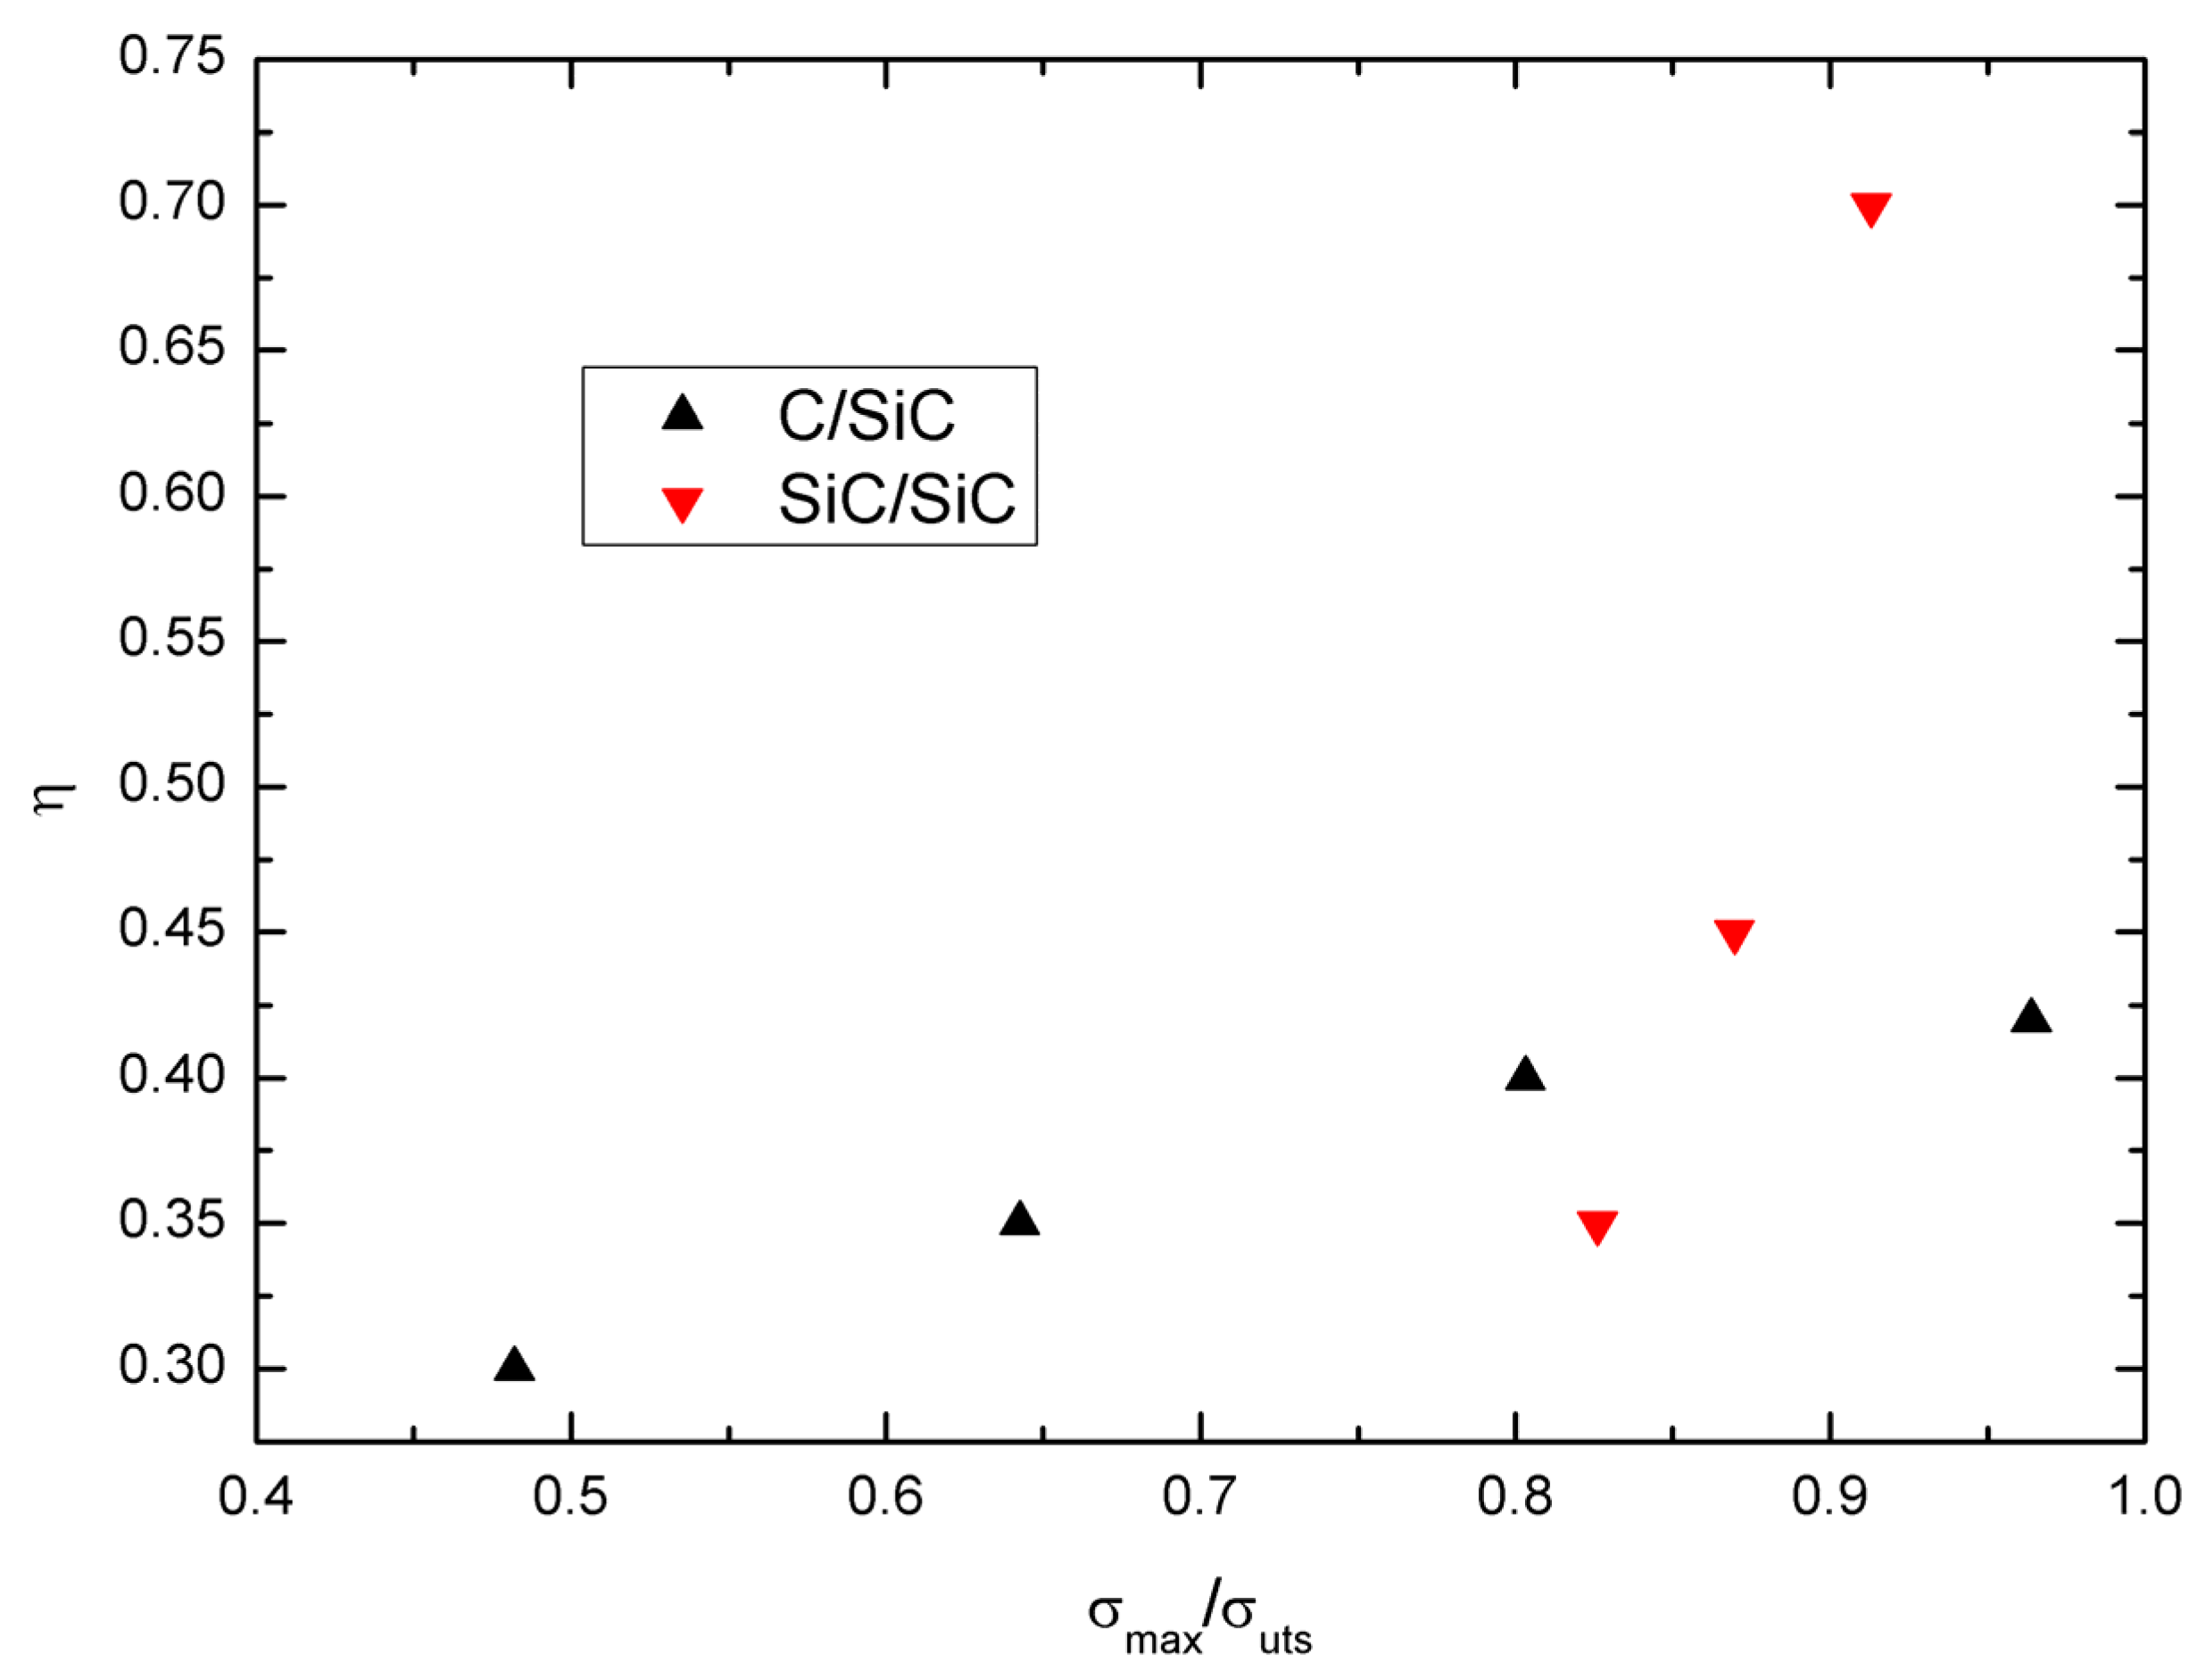
- The damage parameter, i.e., the proportion of matrix cracking mode 3 in the entire matrix cracking modes of the composite, and the hysteresis dissipated energy both increase with increasing peak stress;
- (2)
- The damage parameter and hysteresis dissipated energy of C/SiC composite under low peak stress are higher than those of SiC/SiC composite; However, with increasing peak stress, the damage extent inside of cross-ply SiC/SiC composite, i.e., the damage paramter η and hysteresis dissipated energy, is much higher than that of C/SiC composite as more transverse cracks and matrix cracks connecting together.
Acknowledgments
Conflicts of Interest
References
- Naslain, R. Design, preparation and properties of non-oxide CMCs for application in engines and nuclear reactors: An overview. Compos. Sci. Technol. 2004, 64, 155–170. [Google Scholar] [CrossRef]
- Bednarcyk, B.A.; Mital, S.K.; Pineda, E.J.; Arnold, S.M. Multiscale modeling of ceramic matrix composites. In Proceedings of the 56th AIAA/ASCE/AHS/ASC Structures Dynamics Materials Conference, Kissimmee, FL, USA, 5–9 January 2015.
- Gowayed, Y.; Ojard, G.; Santhosh, U.; Jefferso, G. Modeling of crack density in ceramic matrix composites. J. Compos. Mater. 2015, 49, 2285–2294. [Google Scholar] [CrossRef]
- Reynaud, P. Cyclic fatigue of ceramic-matrix composites at ambient and elevated temperatures. Compos. Sci. Technol. 1996, 56, 809–814. [Google Scholar] [CrossRef]
- Fantozzi, G.; Reynaud, P. Mechanical hysteresis in ceramic matrix composites. Mater. Sci. Eng. Part A Struct. 2009, 521–522, 18–23. [Google Scholar] [CrossRef]
- Kotil, T.; Holmes, J.W.; Comninou, M. Origin of hysteresis observed during fatigue of ceramic matrix composites. J. Am. Ceram. Soc. 1990, 73, 1879–1883. [Google Scholar] [CrossRef]
- Pryce, A.W.; Smith, P.A. Matrix cracking in unidirectional ceramic matrix composites under quasi-static and cyclic loading. Acta Metall. Mater. 1993, 41, 1269–1281. [Google Scholar] [CrossRef]
- Ahn, B.K.; Curtin, W.A. Strain and hysteresis by stochastic matrix cracking in ceramic matrix composites. J. Mech. Phys. Solids 1997, 45, 177–209. [Google Scholar] [CrossRef]
- Solti, J.P.; Mall, S.; Robertson, D.D. Modeling damage in unidirectional ceramic-matrix composites. Compos. Sci. Technol. 1995, 54, 55–66. [Google Scholar] [CrossRef]
- Vagaggini, E.; Domergue, J.M.; Evans, A.G. Relationships between hysteresis measurements and the constituent properties of ceramic matrix composites: I, theory. J. Am. Ceram. Soc. 1995, 78, 2709–2720. [Google Scholar] [CrossRef]
- Hutchison, J.W.; Jensen, H.M. Models of fiber debonding and pullout in brittle composites with friction. Mech. Mater. 1990, 9, 139–163. [Google Scholar] [CrossRef]
- Cho, C.D.; Holmes, J.W.; Barber, J.R. Estimation of interfacial shear in ceramic composites from frictional heating measurements. J. Am. Ceram. Soc. 1991, 74, 2802–2808. [Google Scholar] [CrossRef]
- Li, L.B.; Song, Y.D.; Sun, Z.G. Influence of interface de-bonding on the fatigue hysteresis loops of ceramic matrix composites. Chin. J. Solid. Mech. 2009, 30, 8–14. [Google Scholar]
- Li, L.B.; Song, Y.D.; Sun, Z.G. Effect of fiber Poisson contraction on fatigue hysteresis loops of ceramic matrix composites. J. Nanjing Univ. Aero. Astron. 2009, 41, 181–186. [Google Scholar]
- Li, L.B.; Song, Y.D. Influnece of fiber failure on fatigue hysteresis loops of ceramic matrix composites. J. Reinf. Plast. Compos. 2011, 30, 12–25. [Google Scholar]
- Li, L.B. Modeling the effect of interface wear on fatigue hysteresis behavior of carbon fiber-reinforced ceramic-matrix composites. Appl. Compos. Mater. 2015. [Google Scholar] [CrossRef]
- Li, L.B.; Song, Y.D.; Sun, Y.C. Estimate interface shear stress of unidirectional C/SiC ceramic matrix composites from hysteresis loops. Appl. Compos. Mater. 2013, 20, 693–707. [Google Scholar] [CrossRef]
- Kuo, W.S.; Chou, T.W. Multiple cracking of unidirectional and cross-ply ceramic matrix composites. J. Am. Ceram. Soc. 1995, 78, 745–755. [Google Scholar] [CrossRef]
- Standard Practice for Constant-Amplitude, Axial, Tension-Tension Cyclic Fatigue of Continuous Fiber-Reinforced Advanced Ceramics at Ambient Temperatures; ASTM C 1360-10; ASTM: West Conshohocken, PA, USA, 2015.
- Gordon, N. Material Health Monitoring of SiC/SiC Laminated Ceramic Matrix Composites With Acoustic Emission And Electrical Resistance. Master Thesis, University of Akron, Akron, OH, USA, December 2014. [Google Scholar]
- Li, L.B.; Song, Y.D.; Sun, Y.C. Effect of matrix cracking on hysteresis behavior of cross-ply ceramic matrix composites. J. Compos. Mater. 2014, 48, 1505–1530. [Google Scholar] [CrossRef]
© 2016 by the author; licensee MDPI, Basel, Switzerland. This article is an open access article distributed under the terms and conditions of the Creative Commons by Attribution (CC-BY) license (http://creativecommons.org/licenses/by/4.0/).
Share and Cite
Li, L. Comparison of Cyclic Hysteresis Behavior between Cross-Ply C/SiC and SiC/SiC Ceramic-Matrix Composites. Materials 2016, 9, 62. https://doi.org/10.3390/ma9010062
Li L. Comparison of Cyclic Hysteresis Behavior between Cross-Ply C/SiC and SiC/SiC Ceramic-Matrix Composites. Materials. 2016; 9(1):62. https://doi.org/10.3390/ma9010062
Chicago/Turabian StyleLi, Longbiao. 2016. "Comparison of Cyclic Hysteresis Behavior between Cross-Ply C/SiC and SiC/SiC Ceramic-Matrix Composites" Materials 9, no. 1: 62. https://doi.org/10.3390/ma9010062