Article

Cyclic Behavior and Stress–Strain Model of Nano-SiO2-Modified Recycled Aggregate Concrete

1
Guangdong Provincial Key Laboratory of Durability for Marine Civil Engineering, Shenzhen University, Shenzhen 518060, China
2
School of Mechanics and Construction Engineering, Jinan University, Guangzhou 510632, China
*
Author to whom correspondence should be addressed.
Materials 2024, 17(5), 1180; https://doi.org/10.3390/ma17051180
Submission received: 9 February 2024 / Revised: 27 February 2024 / Accepted: 1 March 2024 / Published: 3 March 2024

Abstract

:
Recycled aggregate concrete (RAC) possesses different mechanical properties than ordinary concrete because of inherent faults in recycled aggregates (RAs), such as the old interfacial transition zone (ITZ). However, the application of nano-SiO2 presents an effective methodology to enhance the quality of RA. In this study, nano-SiO2-modified recycled aggregate (SRA) was used to replace natural aggregate (NA), and the stress–strain relationships and cyclic behavior of nano-SiO2-modified recycled aggregate concrete (SRAC) with different SRA replacement rates were investigated. After evaluating the skeleton curve of SRAC specimens, the existing constitutive models were compared. Additionally, the study also proposed a stress–strain model designed to predict the mechanical behavior of concrete in relation to the SRA replacement rate. The results show that compared with RAC, the axial compressive strength of SRAC specimens showed increases of 40.27%, 29.21%, 26.55%, 16.37%, and 8.41% at specific SRA replacement rates of 0%, 30%, 50%, 70%, and 100%, respectively. Moreover, the study found that the Guo model’s calculated results can accurately predict the skeleton curves of SRAC specimens.

1. Introduction

As global industrialization and urbanization have accelerated, the amount of waste generated during building and demolition has increased correspondingly, causing serious environmental problems. The construction industry suffers the burden of more than 25% of global carbon dioxide emissions, which emphasizes the industry’s significant impact on the environment [1,2,3]. In the world, concrete contributes approximately thirty to forty percent of all construction-related waste [4]. As a result, over the last few decades, intense research has been directed towards improving the sustainability index of the construction industry. NA is used extensively during the concrete-making process, placing a great deal of strain on the environment’s resources. Therefore, replacing NA with RA has become a research subject in the field of building materials [5,6].
Recycle aggregate is a green building material obtained from the crushing of waste concrete in construction and demolition. Previous research reveals that RAs have inferior mechanical performance compared to NA [7]. The difference is mostly caused by elements like higher porosity, increased water absorption, surface crack propagation, and the presence of residual mortar. These characteristics negatively impact the structural integrity and durability of both fresh and hardened concrete mixes containing RA. Additionally, the old interfacial transition zone (ITZ), which consists of the original natural aggregates and old mortar, has a significant negative impact on RA performance [8]. In order to enhance the quality of RA, researchers are currently trying innovative methods of treatment [9,10,11]. Wu et al. [10] demonstrated that old mortar can be effectively separated from RA surfaces by thermal treatment at 700 °C. Wang et al. [12] tested modifying RA using different concentrations of acetic acid and soaking times with acetic acid. This soaking procedure effectively removed the cement mortar from RA surfaces, eliminating flaws and enhancing the mechanics of RAC. The optimal conditions for acetic acid soaking were found to be a concentration of no more than 3% and a soaking period of one day. However, the acid immersion method can cause new cracks to appear on the aggregate and weaken the durability of the concrete [13]. So, it is necessary to develop methods that enhance the surface mortar and improve the performance of the interfacial transition zone (ITZ) without removing the old mortar. Jalilifar et al. [14] discuss a method of strengthening the old mortar in recycled aggregates by soaking them in a volcanic ash slurry. The study found that using 10% silica fume in recycled concrete significantly reduced porosity and compacted the ITZ through the bridging of hydration products. The ITZ of this treated concrete was found to be very similar to that of conventional concrete. Krzywinski et al. [15] prepared green epoxy resin coatings using recycled fine aggregate. The study found that epoxy resin coatings modified with 20% natural fine aggregate and 80% recycled fine aggregate showed the greatest improvement in mechanical properties.
In recent years, researchers have attempted to use nano-SiO2 to treat RA. The basic principle of using nano-SiO2 for the modification and enhancement of recycled aggregate is shown in Figure 1.
According to studies [16,17], the surface area and pozzolanic activity of nano-SiO2 can expedite the reaction with the cement hydration product CH, forming C-S-H gel. In the surface of the RA, this leads to the formation of a denser ITZ. Therefore, the previous research indicated that the incorporation of nano-SiO2 in RAC can effectively enhance its mechanical properties, durability, and so on [18]. Alhawat et al. [19] studied the effect of nano-SiO2 incorporation on the bonding performance of RAC and found that incorporating nano-SiO2 with a cement replacement mass fraction of 1.5% raised the bond strength of RCA from 8% to 21%. Furthermore, because of its extremely small particle size, nano-SiO2 can efficiently fill pores and microcracks throughout the immersion process by entering the interior of RA [20]. Zhao et al. [21] pointed out through experiments that 2% nano-SiO2 solution and a 48 h soaking period can achieve the most efficient modification in RA. Under these optimal conditions, compared to RAC, the 28-day compressive strength, flexural strength, and elastic modulus of nano-SiO2 increased by 31.8%, 33.2%, and 89.6%, respectively. Therefore, in a nano-SiO2 solution is a more preferable modification method. In addition to being easy to use and reasonably priced, this modification method may be applied to large-scale processing. This modification method helps to transform waste aggregates into usable construction materials, thereby reducing the demand for virgin materials and effectively addressing the issue of waste utilization.
Extending the work of earlier studies, this paper employs a method of soaking RA in a 2 wt% nano-SiO2 solution to modify it. The purpose of this research is to analyze the cyclic behavior of SRAC at various SRA replacement rates, while also assessing the applicability of existing constitutive models to SRAC. Additionally, a stress–strain model for SRAC with various SRA replacement rates has also been established.

2. Materials and Methods

P.O 42.5 cement was selected for this experiment, and its basic properties are shown in Table 1. The sand was natural river sand, and the aggregate included both NA and RA. RA was obtained by crushing support beams from a construction pit project in Shenzhen, China. SRA was obtained by modifying RA with nano-SiO2 solution. The nano-SiO2 solution was sourced from Zhejiang Yuda Chemical Co., Ltd. in Shaoxing, China, and Table 2 provides detailed information about the nano-SiO2 solution. The modification of the recycled aggregates with nano-SiO2 is illustrated in Figure 2: First, the impurities are cleaned from RA using water, and then dried at 60 °C for 24 h. RA is soaked for 24 h in a 2% nano-SiO2 solution. After being soaked and removed from the solution, RA is air-dried in a lab for 24 h, then placed in a standard curing room at 95% humidity and 20 °C for another 24 h. Finally, the cured RA is placed in an oven set to 60 °C for 24 h to obtain SRA.
Table 3 displays the measured performance of aggregates. The water absorption rate is measured according to the method outlined in ASTM C642-13 [22], while the crushing value is measured according to the method specified in ASTM C136 [23]. It is evident that RA has a much higher water absorption and crushing index than NA, which is explained by the old mortar that is still adhering to RA. After nano-SiO2 treatment, the performance of RA has been improved, but there is still a significant gap compared to NA.
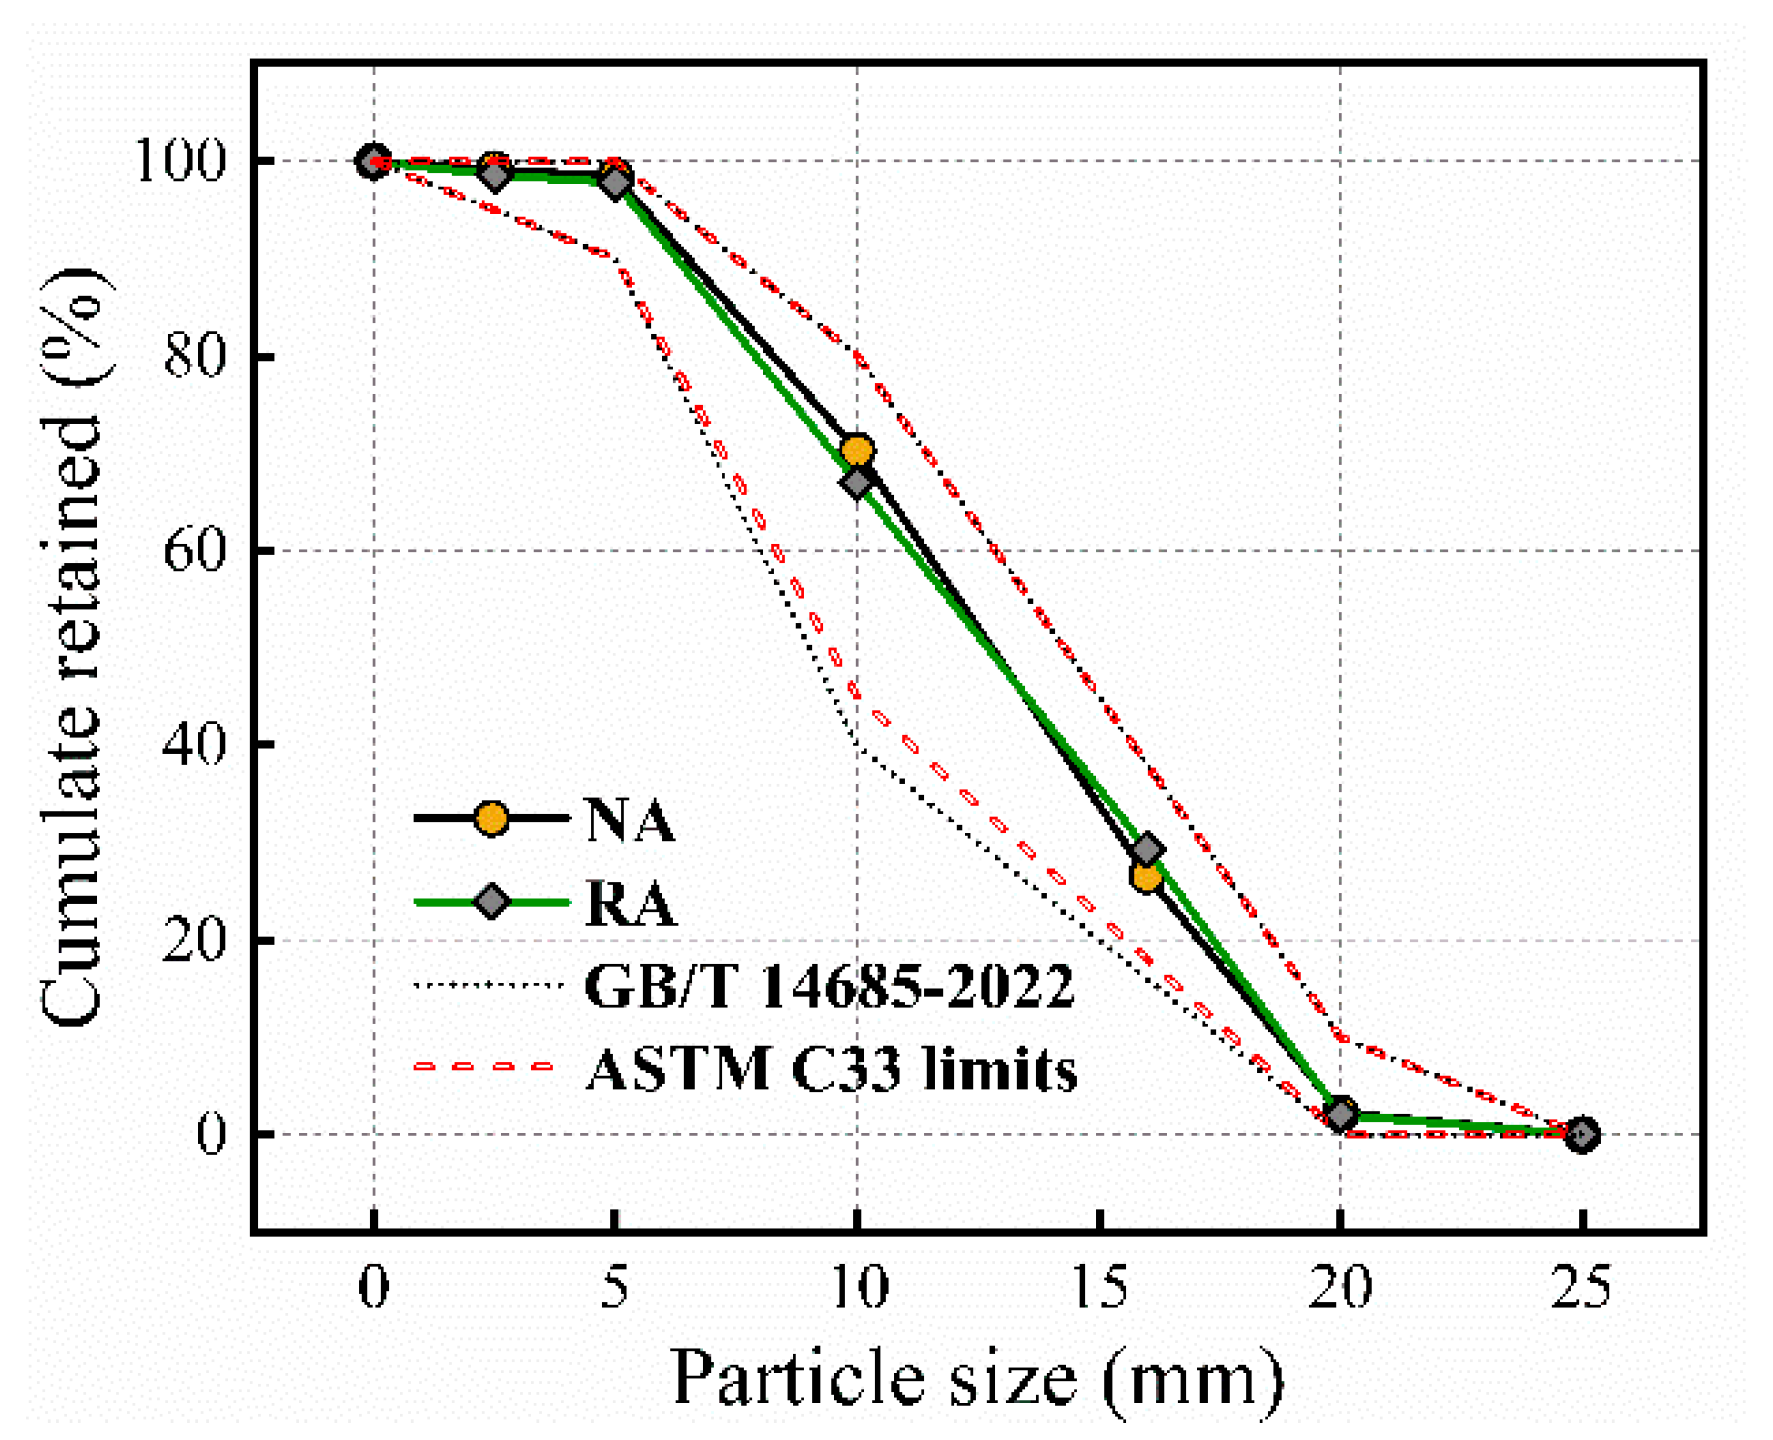
The aggregate gradation data in Figure 3 were tested according to the measuring method from ASTM C131-14 [24]. The graph demonstrates a clear alignment of all these aggregates with established code standards [25,26]. The consistency in gradation across these materials is evident from the graphical representation, reaffirming their compliance with industry specifications. This comprehensive illustration aids in confirming that the SRA, RA, and NA utilized in the experiment adhere to the prescribed grading standards, ensuring a reliable and standardized foundation for the research.
Table 4 displays the mix proportions for test specimens. The compensation water is calculated according to the water absorption and dosage of SRA. Four different SRA replacement rates (30%, 50%, 70%, and 100%) of the SRAC specimens were considered for six groups of test specimens, while the other two specimens (N-100 represents natural aggregate concrete, and R-100 represents recycled aggregate concrete) serves as the reference concrete. Each group consists of three cylinder specimens measuring 150 mm in radius and 300 mm in height. Every specimen mixing procedure occurred in the laboratory environment. Test specimens were treated for 28 days.
All specimens were tested using the MTS 300 T microcomputer-controlled servo press, depicted in Figure 4. Linear variable displacement transducers (LVDTs) measured the longitudinal displacements, while the digital image correlation (DIC) system was used to measure the strain on the surface of the concrete to ensure the accuracy of the longitudinal displacement of the concrete. The force sensor determined the axial compressive force applied to the specimen. The elastic modulus of each specimen was calculated according to GB/T 50081-2019 [27]. According to Hooke’s law, the elastic modulus can be determined by calculating the ratio of stress to strain before the stress reaches one-third of the peak stress. The peak strain of a specimen is obtained by recording the strain experienced by the specimen when it reaches peak stress during the testing process.
The displacement loading rate for the monotonic test was maintained at 0.02 mm/s, which translates to a strain rate of 67 × 10−6/s. In the cyclic test, the maximum displacement rises by around 0.2 mm with each cycle, and the load is applied repeatedly until the specimens fail. The specimen was first loaded at a strain rate of 67 × 10−6/s for each cycle, and it was subsequently unloaded at a rate of 5 kN/s till 0. Figure 5 exhibits the loading regime for the cyclic compression test.

3. Results

3.1. Failure Modes

In the early stages of stress, there were no obvious cracks on the specimen’s surface. The specimen surface initially produced longitudinal microcracks, which gradually turned into inclined cracks as the load increased. The specimen eventually collapsed due to the inclined cracks becoming wider and longer after they reached their maximal stress. During loading and unloading cycles, it is noteworthy to observe that the cracks first developed and subsequently slowly closed. The cracks did not entirely close because of the aggregates’ interlocking effect.
Figure 6 illustrates the failure mechanisms shown by each specimen under cyclic stress. All specimens were finally crushed, resulting in longitudinal cracks on the surface. The specimen N-100 exhibited a major inclined crack on its surface. Conversely, microscopic angled cracks occurred significantly along the surface of the SRAC specimens and the RAC, with the cracks in the SRAC specimens showing improvement compared to RAC. Moreover, the principal cracks on the surface of R-100 typically exhibit a steeper angle in relation to the vertical axis compared to those in N-100.
In concrete, the ITZ between the hardened cement paste with aggregates contributes to the above behavior. Cracks invariably appear along the ITZ, which is typically the weakest part of concrete [28]. The original ITZ between the natural aggregate and the adhering old mortar and the new ITZ between the recycled aggregate and the new mortar—the latter of which is more prone to fracturing—are the two forms of ITZ found in RA, as opposed to NA [29]. SRA enhances the original ITZ with the old mortar, thus improving performance compared to RA but still lagging behind NA. Consequently, the surface of RAC and SRAC exhibits an increase in secondary cracks. Furthermore, the ITZ reduces the RAC surface’s aggregate interlocking strength, which causes the primary cracks’ inclination angle to increase.

3.2. Cyclic Responses

The cyclic responses of SRAC specimens are displayed in Figure 7. By connecting the peak points of each cycle, the skeleton curve may be created using the stress–strain curves that correspond to cyclic loading. Before the stress reaches its peak, the cyclic curves almost coincide with the skeleton curve. This is because the accumulation of damage caused by cyclic loading increases with the number of cycles. Since there are fewer cycles before the peak, and the first two cycles are still in the elastic stage, the accumulation of damage is less. After the stress reaches its peak, the maximum stress of each cyclic loading decreases and eventually stabilizes. Notably, the average slope of the unloading and reloading routes falls as the maximum strain increases for each hysteresis loop under cyclic loading. This is explained by the damage that occurred as a result of the specimen’s inner microcrack growing.
As can be observed in Figure 8, while comparing the test specimen skeleton curves, the ascending segment of the skeleton curve is significantly influenced by the SRA replacement ratio. The R-100 curve has the lowest slope within the elastic range, the SRAC specimen curve’s slope decreases as the SRA replacement rate increases, and the N-100 curve’s slope is noticeably higher than that of the other specimens. This trend is closely connected to the concrete’s elasticity modulus. Following the elastic range, there is more deformation after the peak under the same stress level because the slope of the SRAC specimens at peak stress and the decreasing branch diminish as the SRA replacement rate increases. Because of the high hardness and strong toughness of NA, this can reduce the speed of crack propagation and penetration in concrete, ultimately leading to a more gradual decline in the slope of the descending segment.
The correlation between plastic index and envelope unloading strain is shown in Figure 9. The ratio of plastic strain to envelope unloading strain, εr/εu, is defined as the plastic index, which ranges from 0 to 1. When the plastic index is 0, it indicates that the specimen is in an elastic state. When the plastic index is 1, the sample is in a completely plastic state. The increase in this ratio indicates an increase in the degree of damage and a greater difficulty in the concrete’s deformation recovery. Observing Figure 9, when the envelope unloading strain <0.004, the specimen’s plastic index rapidly increases with the unloading strain, and there is no significant difference between different specimens, indicating that the influence of the replacement rate of SRA is not significant during the rapid development stage of plastic damage. However, when the envelope unloading strain ≥0.004, the growth of the specimen’s plastic index begins to ease. Comparing the plastic index of the different specimens, it can be seen that the plastic indexes of R-100 and S-100 are at a higher level, while the growth of plastic index for N-100 and S-30 is relatively small. This indicates that RAC or SRAC will suffer more plastic damage than NAC, and this trend becomes increasingly apparent as the envelope unloading strain increases.

3.3. Axial Compressive Strength

The axial compressive strength of test specimens is displayed in Figure 10. It is obvious that the axial compressive strength of the specimens S-100 and R-100 dropped by 22.7% and 28.7%, respectively, in comparison to the specimen N-100. This suggests that using nano-SiO2 in recycled concrete can increase its axial compressive strength. The axial compressive strength of the specimens varied by 29.21%, 26.55%, 16.37%, and 8.41% compared to the specimen R-100 as the replacement rate of SRA increased. The replacement rate of SRA significantly affects the axial compressive strength of concrete. When more NA replaces SRA, it improves the inner structure of the concrete, and the inherent defects of SRA have a reduced impact on the concrete.

3.4. Elastic Modulus and Peak Strain

Figure 11a compares the elastic modulus of test specimens. It is evident that the specimens N-100 and R-100 have the highest and lowest elastic moduli, respectively. It was also found that the elastic modulus of S-100 was higher than that of R-100, but there was a significant difference compared to N-100. Moreover, the SRAC specimens’ elastic modulus decreases as the replacement rate rises. There is a slight difference in the elastic modulus between the S-30 and S-50 specimens, but overall, the elastic modulus of SRAC specimens falls as replacement rate increases. This trend coincides with the test specimens’ axial compressive strength characteristic. The ITZ of the aggregates, which will impact the concrete’s overall performance, is related to the elastic modulus of concrete. The use of NA and the application of modification procedures for RA have improved the ITZ, thereby influencing the concrete’s elastic modulus.
The peak strains of the test specimens are compared in Figure 11b. It shows that there is no apparent connection between the peak strain and the SRA replacement rate. In theory, the strain behavior of concrete is greatly influenced by the ITZ between the cement paste and the aggregate. A weak ITZ can lead to a lower elastic modulus of the concrete, which might provoke early initiation and expansion of cracks in the concrete, thereby displaying higher ultimate strain and peak strain. This may be due to the fact that under cyclic loading, the value of peak strain is also influenced by the loading system.

4. Discussion

4.1. Monotonic Stress–Strain Model

The constitutive relationships of concrete have been the subject of comprehensively experimental and theoretical investigations by numerous scholars, who have also put forth related constitutive models based on their findings. The details of current concrete constitutive models are shown in Table 5. The best constitutive model that was closest to the mechanical properties for the kind of concrete under investigation was chosen after an analysis of the available constitutive models and experimental data. The softening parameters D of the stress–strain curve in the Sargin [30] model are adjustable. Similarly, the parameter C plays a crucial role in shaping the prediction curve in the Zhou et al. [31] model. In the Guo [32] model, the ascending and descending segments of the stress–strain curve are controlled by the parameters a and b.
The ideal values of the model’s parameters and their correlation coefficient R2 were established by comparing the model with the results of the experiment, as indicated in Table 6. Figure 12 compares the experimental results of specimens with the current constitutive models. The results suggest that other models can accurately forecast the stress–strain curve’s ascending segment, with the exception of the Popovcis [34] model. However, the models’ predictions for the stress–strain curve’s descending segment differed significantly. The Popovcis [34] model overestimates the descending segment of the curve, whereas the Saenz [33] model shows the opposite trend. Modifying the model’s ideal parameter values, the predictions of the stress–strain curves by the Sargin [30], Zhou et al. [31], and Guo [32] models are relatively good. In contrast, the descending phase of calculation results predicted by the Guo [32] model is closest to the results from experiments, due to the presence of the controlling coefficient b for the descending phase in the model.

4.2. Cyclic Stress–Strain Model

4.2.1. Residual Strain

The residual strain εp is the plastic strain after unloading from the unload point (εu, σu) on the envelope to the residual point (εr, 0), as shown in Figure 13. The change in residual strain is related to the unload strain in the envelope curve. The relationship between test specimens’ residual strain (εr) and unloading strain (εu) is depicted in Figure 14, where xr = εr/εcf, and xu = εu/εcf, with εcf being peak strain.
The regression analysis reveals a clear linear connection between the residual strain and the unload strain. In order to explain the connection of the plastic strain and the unload strain, this study employs Li’s linear function model [35]. The relationship is separately fitted for xu ≤ 1 and xu > 1, taking into account the impact of SRA replacement rate. The relation between xr and xu of test specimens can be seen in Figure 14a,b. By fitting the data in Table 7, the formula for the SRA replacement rate (λ) in terms of G1, G2, H1, and H2 has been derived. The equation expressions are as follows:
x r = G 1 x u + H 1      x u 1   G 2 x u + H 2      x u > 1  
in which G1, G2, H1, and H2 are fitted from the data of this experiment.
  • G1 = 0.359, H1 = 0 (R2 = 0.914)
  • G2 = −0.202λ2 + 0.505λ + 0.844, H2 = −0.305λ−0.477 (R2 = 0.944)

4.2.2. Stress Degradation

As shown in Figure 13, the stress cannot exceed the unloading stress when the reloading curve reaches the strain of the preceding unloading level. The specimen clearly exhibits stress deterioration due to the loading and unloading of cyclic stress, depicted in Figure 15. As the ratio of the stress value at the strain of the unloading point during each cycle process to the stress at the unloading point, the degradation rate may be used to express the degree of stress degradation. The equation [36] is:
φ = σ u σ r , u
in which φ represents the stress degradation percentage; σu represents the stress at the unloading point; σr,u represents the stress at the stress degradation point.
The trend of stress degradation rate is similar for different specimens. In the first three cycles before the stress reaches its peak, test specimens still retain some elasticity, making it easier for the stress to recover to the unloading point stress during the reloading phase, resulting in less stress degradation. As the quantity of cycles increases, the stress continues to degrade. Comparing the curves in Figure 14, it is found that as the SRA replacement rate increases, the stress degradation rate gradually decreases. Stress degradation increases in severity with decreasing stress degradation rate. This indicates that as the SRA replacement rate increases, it becomes more difficult for concrete to maintain its strength after being stressed.
Simplifying the analysis of the stress degradation curve of SRAC specimens, the function is approximately represented by the equation shown in Equation (3). The equation fitted is as follows:
φ = Axu + B
in which A and B are fitted from the data of this experiment. Table 8 displays the fitted parameters A and B of the test specimens.
A = −0.012λ − 0.054, B = −0.02λ + 0.97 (R2 = 0.911)

4.2.3. Envelope Returning Point

Figure 16 illustrates the relation between envelope returning point (xe) and unloading point (xu) of test specimens, where xe = εe/εcf. With the increase in unloading strain, the envelope returning point exhibits a trend similar to the residual point. The relationship between xe and xu follows a power function.
x e = m x u n
in which m and n are parameters determined by experimental data. Table 9 presents the fitting parameters.
m = 1.55, n = 0.76 (R2 = 0.931)

4.2.4. Unloading Path

In the cyclic stress–strain model, the unloading path refers to the behavior of concrete as it is relieved from stress during a loading cycle, demonstrating how concrete returns to its original state. This path is crucial for understanding the elastic and plastic deformation characteristics of concrete under cyclic stress. The parameters Au and Bu of the unloading curve obtained from the experiment are used to assume that the unloading path obeys the mathematical formula given in Equation (5).
y = y u A u ( x x r x u x r ) B u
in which Au and Bu are calculated from the experimental data. Fitted parameters au, bu, and cu are shown in Table 10.
A u = 1.0 ,   B u = a u x r + b u x r + c u a u = 0.165 λ 2 0.115 λ 0.022 ,   b u = 1.60 ,   c u = 0.86   ( R 2 = 0.932 )

4.2.5. Reloading Path

There are two types of curves in the reloading path: a straight line from the residual point to the stress degradation point, and a parabola from the stress degradation point to the envelope reloading point. The first branch is considered to be linear, and the second is taken to follow a power function:
y = y r , u y r x r , u x r ( x x r ) + y r   ,       x r <   x < x r , u
y = y r , u A r ( x x r , u x e x r , u ) B r   ,     x r , u < x x e
in which Ar and Br are determined using the experimental data. Fitted parameters ar, br, and cr are shown in Table 11.
A r = 1.0 ,   B r = a r x e + b r x e + c r a r = 0.050 λ 2 0.291 λ 0.012 ,   b r = 0.07 λ 2 0.02 λ + 0.14 ,   c r = 0.90   ( R 2 = 0.945 )

4.2.6. Verification

Figure 17 shows the process of creating stress–strain curves under cyclic loading. Equations (1)–(7) form a complete constitutive model for different replacement rates of SRA under cyclic compressive load, where setting the SRA replacement rate to zero allows the model to also be applicable to normal concrete. The envelope model adopts the Guo [27] model and inputs material parameters. The envelope unloading point (εu, σu) must be determined before stress–strain curves under cyclic loading may be obtained. According to the envelope unloading point, Equation (1) can be used to determine the residual point (εr, 0). The unloading path between the two points can be obtained by Equation (5) to generate the unloading curve. Subsequently, the proposed model uses Equation (3) to determine stress degradation rate φ and the stress degradation point (εr,u, σu). Afterward, Equation (4) is applied to determine the envelope returning point. The reloading curve can be generated from the unloading point to the returning point by using Equations (6) and (7). Consequently, it obtains the loading cycle hysteresis curve.
As illustrated in Figure 18, the cyclic curves of SRAC specimens were calculated using the model proposed in this study and compared with the results of the experiments. Generally, the predicted curves are correlated to the experimental data, indicating that the proposed model can accurately reflect the cyclic behavior of SRAC specimens.
The comparison between the proposed model and existing models can be seen in Figure 19. The existing models for comparison are as follows: the Aslani model [37], which focuses on the stress–strain relationship of concrete under cyclic loading. This model accounts for the cumulative effect of damage and the influence of initial cracks on the material response. The Breccolotti model [38] integrates the nonlinear compressive behavior of concrete, crack development, and closure effects, and attempts to describe the energy dissipation mechanism of concrete during loading-unloading cycles. Compared to the above models, the Sima model [39] adopts more comprehensive approach, specifically focusing on describing the failure mechanisms of concrete and the impact of crack development on its mechanical properties. Observing Figure 19 reveals significant differences in the computational results between the Aslani model [37] and Breccolotti model [38], especially in R-100 and S-100. Since the Sima model [39] takes into account crack development, residual strength, and stiffness changes, its computational results are closer to experimental outcomes. The proposed model in this paper, being fitted through experimental results, is the most precise. However, it must be acknowledged that the calculations of the other models consider more material properties and experimental data. The model presented in this paper is only applicable to the compressive cyclic behavior of SRAC and requires further experiments and model analysis in the future for enhancement and supplementation.

5. Conclusions

This study aims to systematically investigate the mechanical properties of SRAC specimens at various replacement rates under cyclic stress. The stress–strain curves of SRAC specimens for different SRA replacement rates were acquired by cyclic loading experiments. A constitutive model for SRAC exhibiting different replacement rates under cyclic stress is proposed based on the results of experiments.
(a)
Nano-SiO2 modification treatment can enhance the axial compressive strength of RAC. Compared to RAC, increasing the SRA replacement rate (30%, 50%, 70%, and 100%) improved the axial compressive strength of SRAC specimens by 29.21%, 26.55%, 16.37%, and 8.41%, respectively. However, since nano-SiO2 cannot completely eliminate the impact of the inherent weaknesses of RA, the axial compressive strength of S-100 and R-100 is 22.7% and 28.7% lower than that of N-100.
(b)
Comparing the experimental results with the existing constitutive models, the Guo model’s calculated results are the closest to the experimental results due to the presence of control coefficients a and b.
(c)
The proposed stress–strain model of SRAC specimens regarding the SRA replacement rates under cyclic stress has relatively high computational accuracy and can be utilized to accurately forecast SRAC’s cyclic behavior at the structural and component levels.

Author Contributions

Y.Z.: Conceptualization, Supervision, Funding acquisition; W.X.: Investigation, Formal analysis, Writing—original draft preparation; J.Z.: Investigation; W.L.: Investigation, Formal analysis; F.X.: Conceptualization; R.H.: Supervision, Funding acquisition, Writing—review and editing. All authors have read and agreed to the published version of the manuscript.

Funding

This work was supported by the National Natural Science Foundation of China (Grant No. 52325804; 52308184), NSFC and Guangdong Province (Grant No. U2001226), Guangdong Provincial Basic and Applied Basic Research Fund Committee (2022B151520007), and Shenzhen Science and Technology Innovation Commission (Grant No. JCYJ20210324095003010).

Institutional Review Board Statement

Not applicable.

Informed Consent Statement

Not applicable.

Data Availability Statement

The data presented in this study are available from the corresponding author upon request.

Conflicts of Interest

The authors declare no conflicts of interest.

References

  1. Benjamin, I.O.; Daniel, W.M.; Abdullahi, B.S.; Timothy, O.O. Circular economy research on building construction and demolition waste: A review of current trends and future research directions. J. Clean. Prod. 2022, 357, 131927. [Google Scholar] [CrossRef]
  2. Labaran, Y.H.; Mathur, V.S.; Farouq, M.M. The carbon footprint of construction industry: A review of direct and indirect emission. J. Sustain. Constr. Mater. Technol. 2021, 6, 101–115. [Google Scholar] [CrossRef]
  3. Fernanda, A.S.; Flávio, A.S. Recycled aggregates from construction and demolition waste towards an application on structural concrete: A review. J. Build. Eng. 2022, 52, 104452. [Google Scholar] [CrossRef]
  4. Tang, Y.; Xiao, J.; Zhang, H.; Duan, Z.; Xia, B. Mechanical properties and uniaxial compressive stress-strain behavior of fully recycled aggregate concrete. Constr. Build. Mater. 2022, 323, 126546. [Google Scholar] [CrossRef]
  5. Cerchione, R.; Colangelo, F.; Farina, I.; Ghisellini, P.; Passaro, R.; Ulgiati, S. Life Cycle Assessment of Concrete Production within a Circular Economy Perspective. Sustainability 2023, 15, 11469. [Google Scholar] [CrossRef]
  6. Da Silva, S.R.; Andrade, J.J.d.O. A Review on the Effect of Mechanical Properties and Durability of Concrete with Construction and Demolition Waste (CDW) and Fly Ash in the Production of New Cement Concrete. Sustainability 2022, 14, 6740. [Google Scholar] [CrossRef]
  7. Kim, J. Influence of quality of recycled aggregates on the mechanical properties of recycled aggregate concretes: An overview. Constr. Build. Mater. 2022, 328, 127071. [Google Scholar] [CrossRef]
  8. Camila, L.G.; Pedro, V.S.; Augusto, C.S.B.; Conrado, S.R. Flávia Spitale Jacques Poggiali, Mechanical and durability properties of concrete produced with construction and demolition waste and rice husk ash. Constr. Build. Mater. 2023, 406, 133471. [Google Scholar] [CrossRef]
  9. Dilbas, H.; Çakır, Ö.; Yıldırım, H. An experimental investigation on fracture parameters of recycled aggregate concrete with optimized ball milling method. Constr. Build. Mater. 2020, 252, 119118. [Google Scholar] [CrossRef]
  10. Wu, H.; Liang, C.; Zhang, Z.; Yao, P.; Wang, C.; Ma, Z. Utilizing heat treatment for making low-quality recycled aggregate into enhanced recycled aggregate, recycled cement and their fully recycled concrete. Constr. Build. Mater. 2023, 394, 132126. [Google Scholar] [CrossRef]
  11. Kazemian, F.; Rooholamini, H.; Hassani, A. Mechanical and fracture properties of concrete containing treated and untreated recycled concrete aggregates. Constr. Build. Mater. 2019, 209, 690–700. [Google Scholar] [CrossRef]
  12. Wang, L.; Wang, J.; Qian, X.; Chen, P.; Xu, Y.; Guo, J. An environmentally friendly method to improve the quality of recycled concrete aggregates. Constr. Build. Mater. 2017, 144, 432–441. [Google Scholar] [CrossRef]
  13. Prasad, D.; Pandey, A.; Kumar, B. Sustainable production of recycled concrete aggregates by lime treatment and mechanical abrasion for M40 grade concrete. Constr. Build. Mater. 2021, 268, 121119. [Google Scholar] [CrossRef]
  14. Jalilifar, H.; Sajedi, F. Micro-structural analysis of recycled concretes made with recycled coarse concrete aggregates. Constr. Build. Mater. 2021, 267, 121041. [Google Scholar] [CrossRef]
  15. Krzywiński, K.; Sadowski, Ł.; Stefaniuk, D.; Obrosov, A.; Weiß, S. Engineering and manufacturing technology of green epoxy resin coatings modified with recycled fine aggregates. Int. J. Precis. Eng. Manuf. Green Technol. 2022, 9, 253–271. [Google Scholar] [CrossRef]
  16. Liu, J.; Xie, X.; Li, L. Experimental study on mechanical properties and durability of grafted nano-SiO2 modified rice straw fiber reinforced concrete. Constr. Build. Mater. 2022, 347, 128575. [Google Scholar] [CrossRef]
  17. Bai, S.; Guan, X.; Li, G. Effect of the early-age frost damage and nano-SiO2 modification on the properties of Portland cement paste. Constr. Build. Mater. 2020, 262, 120098. [Google Scholar] [CrossRef]
  18. Keshavarzian, F.; Saberian, M.; Li, J. Investigation on mechanical properties of steel fiber reinforced reactive powder concrete containing nano-SiO2: An experimental and analytical study. J. Build. Eng. 2021, 44, 102601. [Google Scholar] [CrossRef]
  19. Alhawat, M.; Ashour, A. Bond strength between corroded steel and recycled aggregate concrete incorporating nano silica. Constr. Build. Mater. 2020, 237, 117441. [Google Scholar] [CrossRef]
  20. Chen, X.F.; Jiao, C.J. Microstructure and physical properties of concrete containing recycled aggregates pre-treated by a nano-silica soaking method. J. Build. Eng. 2022, 51, 104363. [Google Scholar] [CrossRef]
  21. Zhao, W.; Liu, J.; Guo, H.; Li, L. Effect of nano-SiO2 modified recycled coarse aggregate on the mechanical properties of recycled concrete. Constr. Build. Mater. 2023, 395, 132319. [Google Scholar] [CrossRef]
  22. ASTM C642-13; Standard Test Method for Density, Absorption, and Voids in Hardened Concrete. American Society for Testing of Materials: West Conshohocken, PA, USA, 2013.
  23. ASTM C136-19; Standard Test Method for Sieve Analysis of Fine and Coarse Aggregates. American Society for Testing of Materials: West Conshohocken, PA, USA, 2019.
  24. ASTM C131-14; Standard Test Method for Resistance to Degradation of Small-Size Coarse Aggregate by Abrasion and Impact in the Los Angeles Machine. American Society for Testing of Materials: West Conshohocken, PA, USA, 2014.
  25. GB/T 14685-2022; Pebble and Crushed Stone for Construction. China Standards Press: Beijing, China, 2022.
  26. ASTM C33; Standard Specification for Concrete Aggregates. American Society for Testing and Materials: West Conshohocken, PA, USA, 2016.
  27. GB/T 50081-2019; Standard for Test Methods of Concrete Physical and Mechanical Properties. China Standards Press: Beijing, China, 2019.
  28. Shi, C.; Li, Y.; Zhang, J.; Li, W.; Chong, L.; Xie, Z. Performance enhancement of recycled concrete aggregate—A review. J. Clean. Prod. 2016, 112, 466–472. [Google Scholar] [CrossRef]
  29. Etxeberria, M.; Vázquez, E.; Mari, A. Microstructure analysis of hardened recycled aggregate concrete. Mag. Concr. Res. 2006, 58, 683–690. [Google Scholar] [CrossRef]
  30. Sargin, M. Stress–Strain Relationship for Concrete and the Analysis of Structural Concrete Section, Study, 4; Solid Mechanics Division, Solid Mechanics Division University of Waterloo: Waterloo, ON, Canada, 1971. [Google Scholar]
  31. Zhou, Y.W.; Wu, Y.F. General model for constitutive relationships of concrete and its composite structures. Compos. Struct. 2012, 94, 580–592. [Google Scholar] [CrossRef]
  32. Guo, Z. Strength and Deformation of Concrete: The Relationship between Experimental Foundation and Constitutive; Tsinghua University Press: Beijing, China, 1997. [Google Scholar]
  33. Saenz, L.P. Equation for the stress-strain curve of concrete. J. Am. Concr. Inst. 1964, 61, 1229–1235. [Google Scholar] [CrossRef]
  34. Popovics, S. A numerical approach to the complete stress-strain curve of concrete. Cem. Concr. Res. 1973, 3, 583–599. [Google Scholar] [CrossRef]
  35. Li, B.; Xu, L.; Chi, Y.; Huang, B.; Li, C. Experimental investigation on the stress-strain behavior of steel fiber reinforced concrete subjected to uniaxial cyclic compression. Constr. Build. Mater. 2017, 140, 109–118. [Google Scholar] [CrossRef]
  36. Abbasnia, R.; Hosseinpour, F.; Rostamian, M.; Ziaadiny, H. Cyclic and monotonic behavior of FRP confined concrete rectangular prisms with different aspect ratios. Constr. Build. Mater. 2013, 40, 118–125. [Google Scholar] [CrossRef]
  37. Aslani, F.; Jowkarmeimandi, R. Stress–strain model for concrete under cyclic loading. Mag. Concr. Res. 2012, 64, 673–685. [Google Scholar] [CrossRef]
  38. Breccolotti, M.; Bonfigli, M.F.; D’Alessandro, A.; Materazzi, A.L. Constitutive modeling of plain concrete subjected to cyclic uniaxial compressive loading. Constr. Build. Mater. 2015, 94, 172–180. [Google Scholar] [CrossRef]
  39. Sima, J.F.; Roca, P.; Molins, C. Cyclic constitutive model for concrete. Eng. Struct. 2008, 30, 695–706. [Google Scholar] [CrossRef]
Figure 1. The mechanism of nano-SiO2-modified recycled aggregate.
Materials 17 01180 g001
Figure 2. The process of nano-SiO2 modification.
Materials 17 01180 g002
Figure 3. The gradation of aggregates.
Materials 17 01180 g003
Figure 4. Test setup.
Materials 17 01180 g004
Figure 5. Loading regime diagram.
Materials 17 01180 g005
Figure 6. Failure modes of test specimens. (a) N-100; (b) S-30; (c) S-50; (d) S-70; (e) S-100; (f) R-100.
Materials 17 01180 g006
Figure 7. Average stress–strain curve of each group of test specimens. (a) N-100; (b) S-30; (c) S-50; (d) S-70; (e) S-100; (f) R-100.
Materials 17 01180 g007
Figure 8. The skeleton curves of test specimens.
Materials 17 01180 g008
Figure 9. The correlation between plastic index and envelope unloading strain.
Materials 17 01180 g009
Figure 10. Axial compressive strength of test specimens.
Materials 17 01180 g010
Figure 11. Experimental results of test specimens. (a) Elastic modulus of test specimens. (b) Peak strain of test specimens.
Materials 17 01180 g011
Figure 12. Calculation results for existing constitutive models. (a) N-100; (b) S-30; (c) S-50; (d) S-70; (e) S-100; (f) R-100 [30,31,32,33,34].
Materials 17 01180 g012
Figure 13. Typical hysteresis loop for SRAC specimens under cyclic loading.
Materials 17 01180 g013
Figure 14. Relation between xr and xu of test specimens. (a) xu ≤ 1; (b) xu > 1.
Materials 17 01180 g014
Figure 15. Relation curves between stress degradation rate (φ) and xu.
Materials 17 01180 g015
Figure 16. Relation between xe and xu of test specimens.
Materials 17 01180 g016
Figure 17. Diagram for creating stress–strain curves under cyclic loading [27].
Materials 17 01180 g017
Figure 18. Comparison between the calculated and experimental results. (a) N-100; (b) S-30; (c) S-50; (d) S-70; (e) S-100; (f) R-100.
Materials 17 01180 g018
Figure 19. The comparison between the proposed model and existing models. (a) N-100; (b) S-30; (c) S-50; (d) S-70; (e) S-100; (f) R-100 [37,38,39].
Materials 17 01180 g019
Table 1. Basic properties of P.O 42.5 Ordinary Portland Cement.
Compressive Strength (MPa)Flexural Strength (MPa)Specific Surface AreaBulk DensityDensity
3 Day28 Day3 Day28 Day(cm2/g)(g/cm3)(g/cm3)
16.042.53.56.53601.33.11
Table 2. Physical properties of nano-SiO2 solution.
Particle SizeColorNano-SiO2 ContentpHDensityNaO2 Content
(nm) (%) (g/cm3)(%)
12White>99.910.31.20.38
Table 3. The performance of aggregates.
TypesGrade (mm)Water Absorption (%)Crushing Index (%)
NA5–202.159.35
RA5–206.0615.39
SRA5–204.7713.04
Table 4. The mix proportion of test specimens (kg/m3).
SpecimenReplacement Rate (%)SandWaterCompensation WaterCementNASRARA
N-10006881808.26500103200
S-303068818020.835007223100
S-505068818029.215005165160
S-707068818037.595003107220
S-10010068818050.16500010320
R-10010068818074.86500001032
Table 5. Current constitutive models.
ModelCalculation Formula
Saenz [33] σ = E 0 ε 1 + E 0 E S 2 ε ε 0 + ε ε 0 2
Sargin [30] σ = σ 0 E 0 E S ε ε 0 + ( D 1 ) ε ε 0 2 1 + E 0 E S 2 ε ε 0 + D ε ε 0 2
Popovics [34] σ = σ 0 ε ε 0 n n 1 + ( ε ε 0 ) n
n = 0.4 × 10⁻³σ0 + 1.0, and σ0 is in psi (1 MPa = 145 psi)
Zhou et al. [31] σ = 4 σ 0 ( 1 + C ) 2 e ε ε 0 ln 2 1 C + C 1 e ε ε 0 ln 2 1 C
Guo [32] For   0 ε ε 0 < 1 ,   σ σ 0 = a ε ε 0 + ( 3 2 a ) ( ε ε 0 ) 3 For   ε ε 0 1 ,   σ σ 0 = ε ε 0 b ( ε ε 0 1 ) 2 + ε ε 0
Note: σ and σ0 are the concrete’s stress and peak stress, respectively; ε and ε0 are the concrete’s strain and peak strain, respectively; E0 is concrete’s initial elastic modulus; Es = σ0/ε0 is the secant modulus between the origin point and peak point (σ0, ε0).
Table 6. Fitting parameters of the constitutive model.
Model N-100S-30S-50S-70S-100R-100
Sargin [30]D0.820.930.750.650.740.24
R20.9880.9700.9840.9430.9780.916
Zhou et al. [31]C0.050.090.030.010.010.01
R20.9880.9160.9690.8710.9160.836
Guo [32]a2.081.982.081.971.962.18
R20.9880.9890.9660.9750.9890.968
b0.600.490.850.80.751.38
R20.9980.9580.9740.9920.9930.983
Table 7. Fitted parameters G1, G2, H1, and H2 of test specimens.
SpecimenλG1H1R2G2H2R2
N-10000.597−0.0890.9800.867−0.4680.996
S-300.30.404−0.0860.9990.901−0.5620.968
S-500.50.486−0.0980.9501.097−0.6910.980
S-700.70.408−0.0960.9981.113−0.6310.987
S-10010.429−0.1150.9991.133−0.7940.997
R-100-0.534−0.0960.9810.911−0.3150.993
Table 8. Fitted parameters A and B of test specimens.
SpecimenλABR2
N-1000−0.0540.9690.952
S-300.3−0.0580.9650.965
S-500.5−0.0610.9680.965
S-700.7−0.0610.9560.976
S-1001−0.0670.9420.913
R-100-−0.0740.9770.929
Table 9. Fitted parameters m and n of test specimens.
SpecimenλmnR2
N-10001.650.760.994
S-300.31.610.780.971
S-500.51.520.820.997
S-700.71.430.810.960
S-10011.530.800.978
R-100-1.450.820.990
Table 10. Fitted parameters au, bu, and cu of test specimens.
SpecimenλaubucuR2
N-1000−0.031.590.910.945
S-300.3−0.061.590.880.959
S-500.5−0.141.610.890.978
S-700.7−0.221.630.850.982
S-1001−0.291.650.820.989
R-100-−0.401.680.790.965
Table 11. Fitted parameters ar, br, and cr of test specimens.
SpecimenλarbrcrR2
N-1000−0.130.140.820.924
S-300.3−0.190.130.850.947
S-500.5−0.270.160.910.969
S-700.7−0.380.150.980.985
S-1001−0.450.191.030.979
R-100-−0.510.201.060.983
Disclaimer/Publisher’s Note: The statements, opinions and data contained in all publications are solely those of the individual author(s) and contributor(s) and not of MDPI and/or the editor(s). MDPI and/or the editor(s) disclaim responsibility for any injury to people or property resulting from any ideas, methods, instructions or products referred to in the content.

