
Macro–Meso Damage Analysis of Tunnel Lining Concrete under Thermal–Mechanical Coupling Based on CT Images
Abstract
:1. Introduction
2. Materials and Methods
2.1. Concrete
2.2. Sample Preparation
2.3. Test Conditions
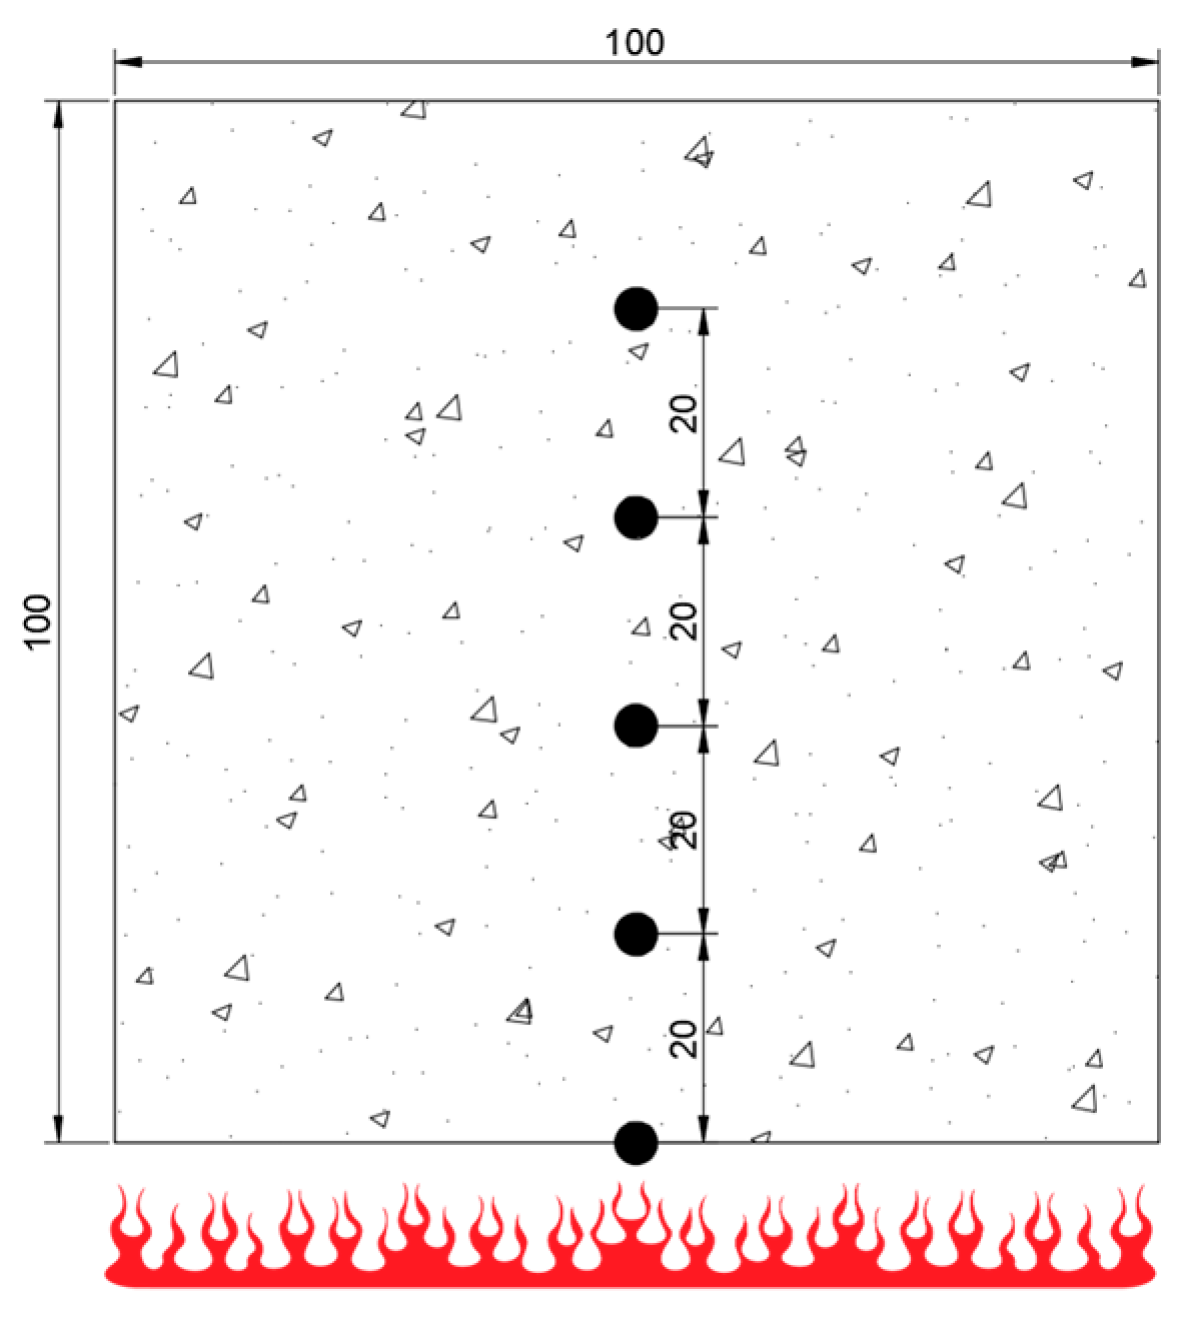
2.4. Experimental Method
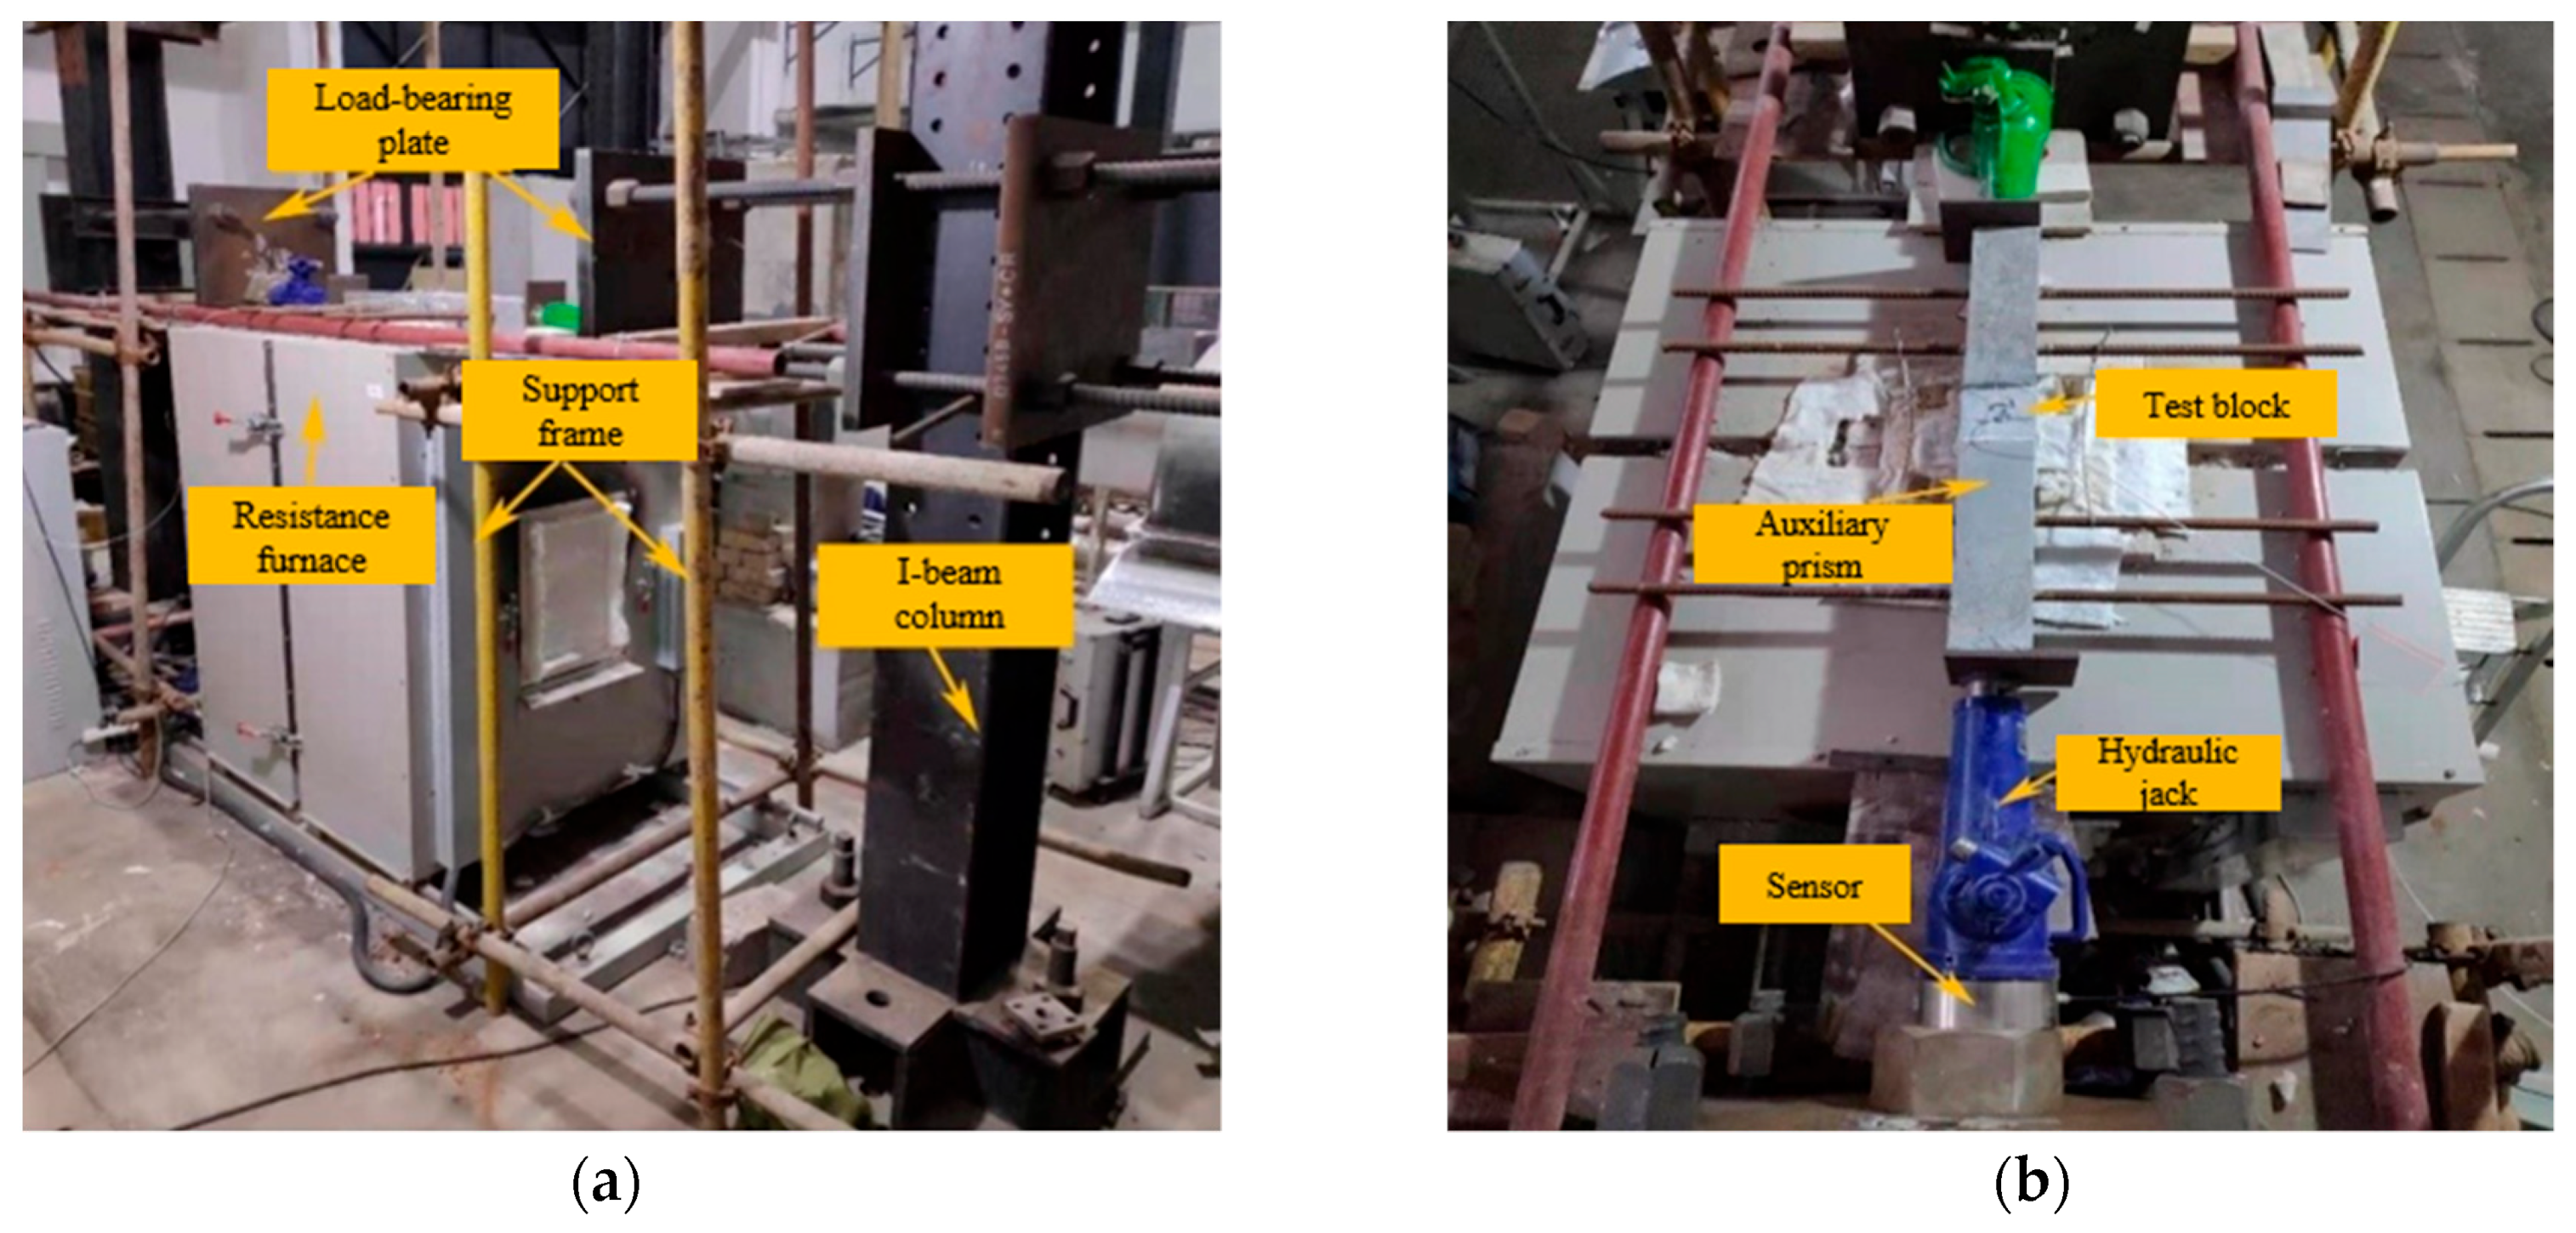
2.4.1. Thermal–Mechanical Coupling Test for Lining Concrete
2.4.2. Concrete Static Load Test
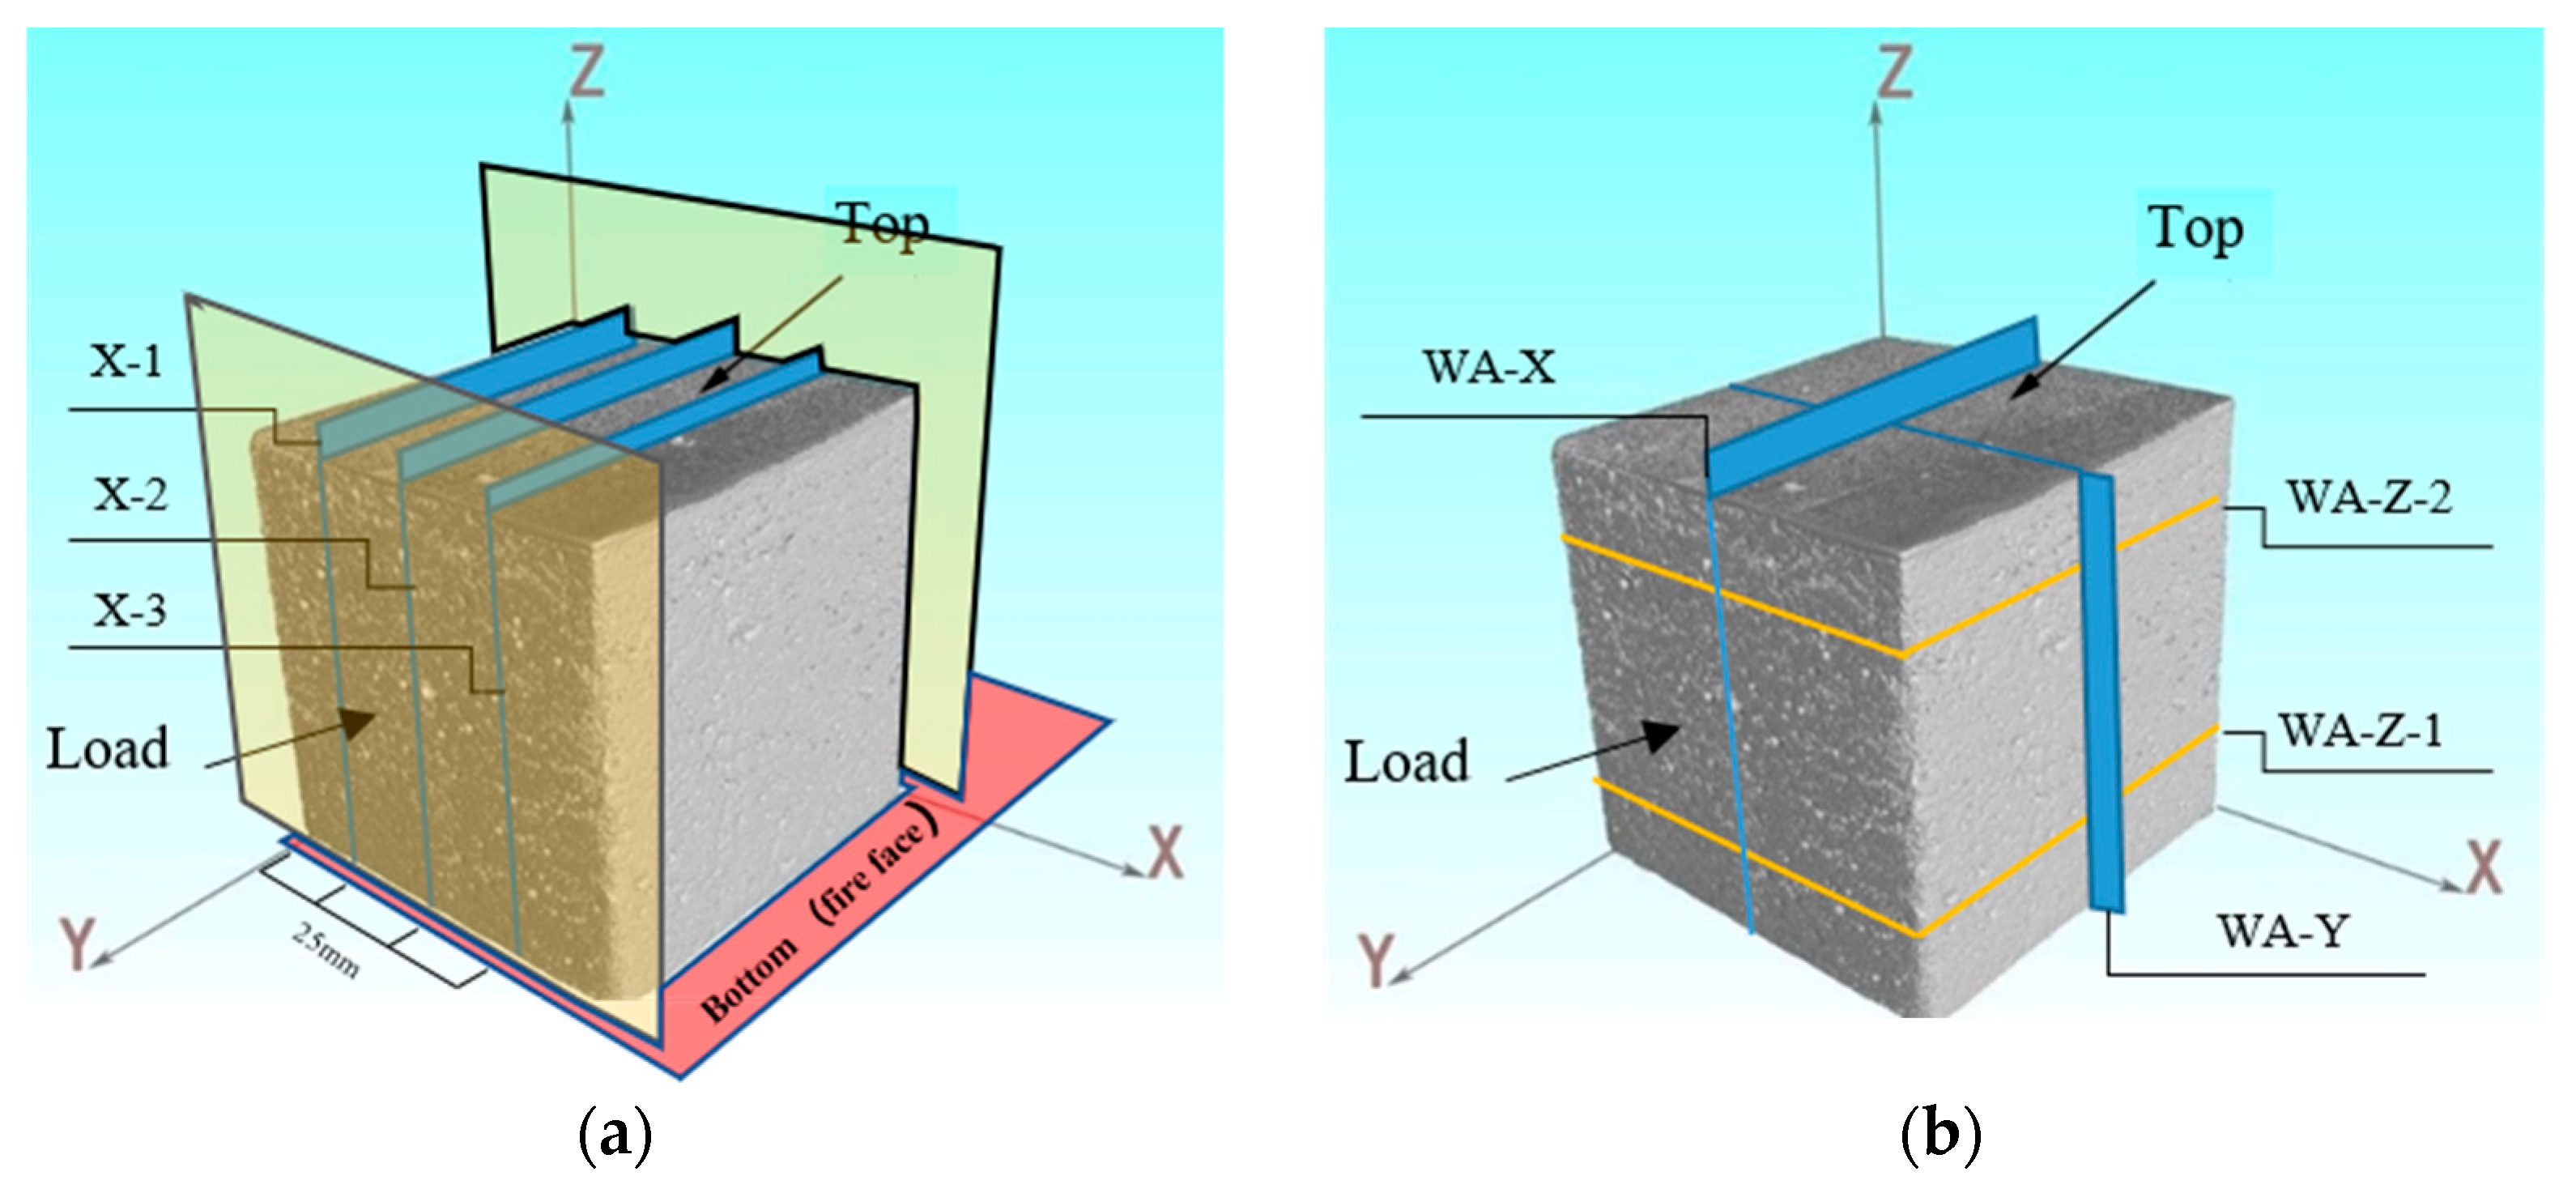
2.4.3. CT Scan
3. Results and Discussion
3.1. Analysis of Macro Results
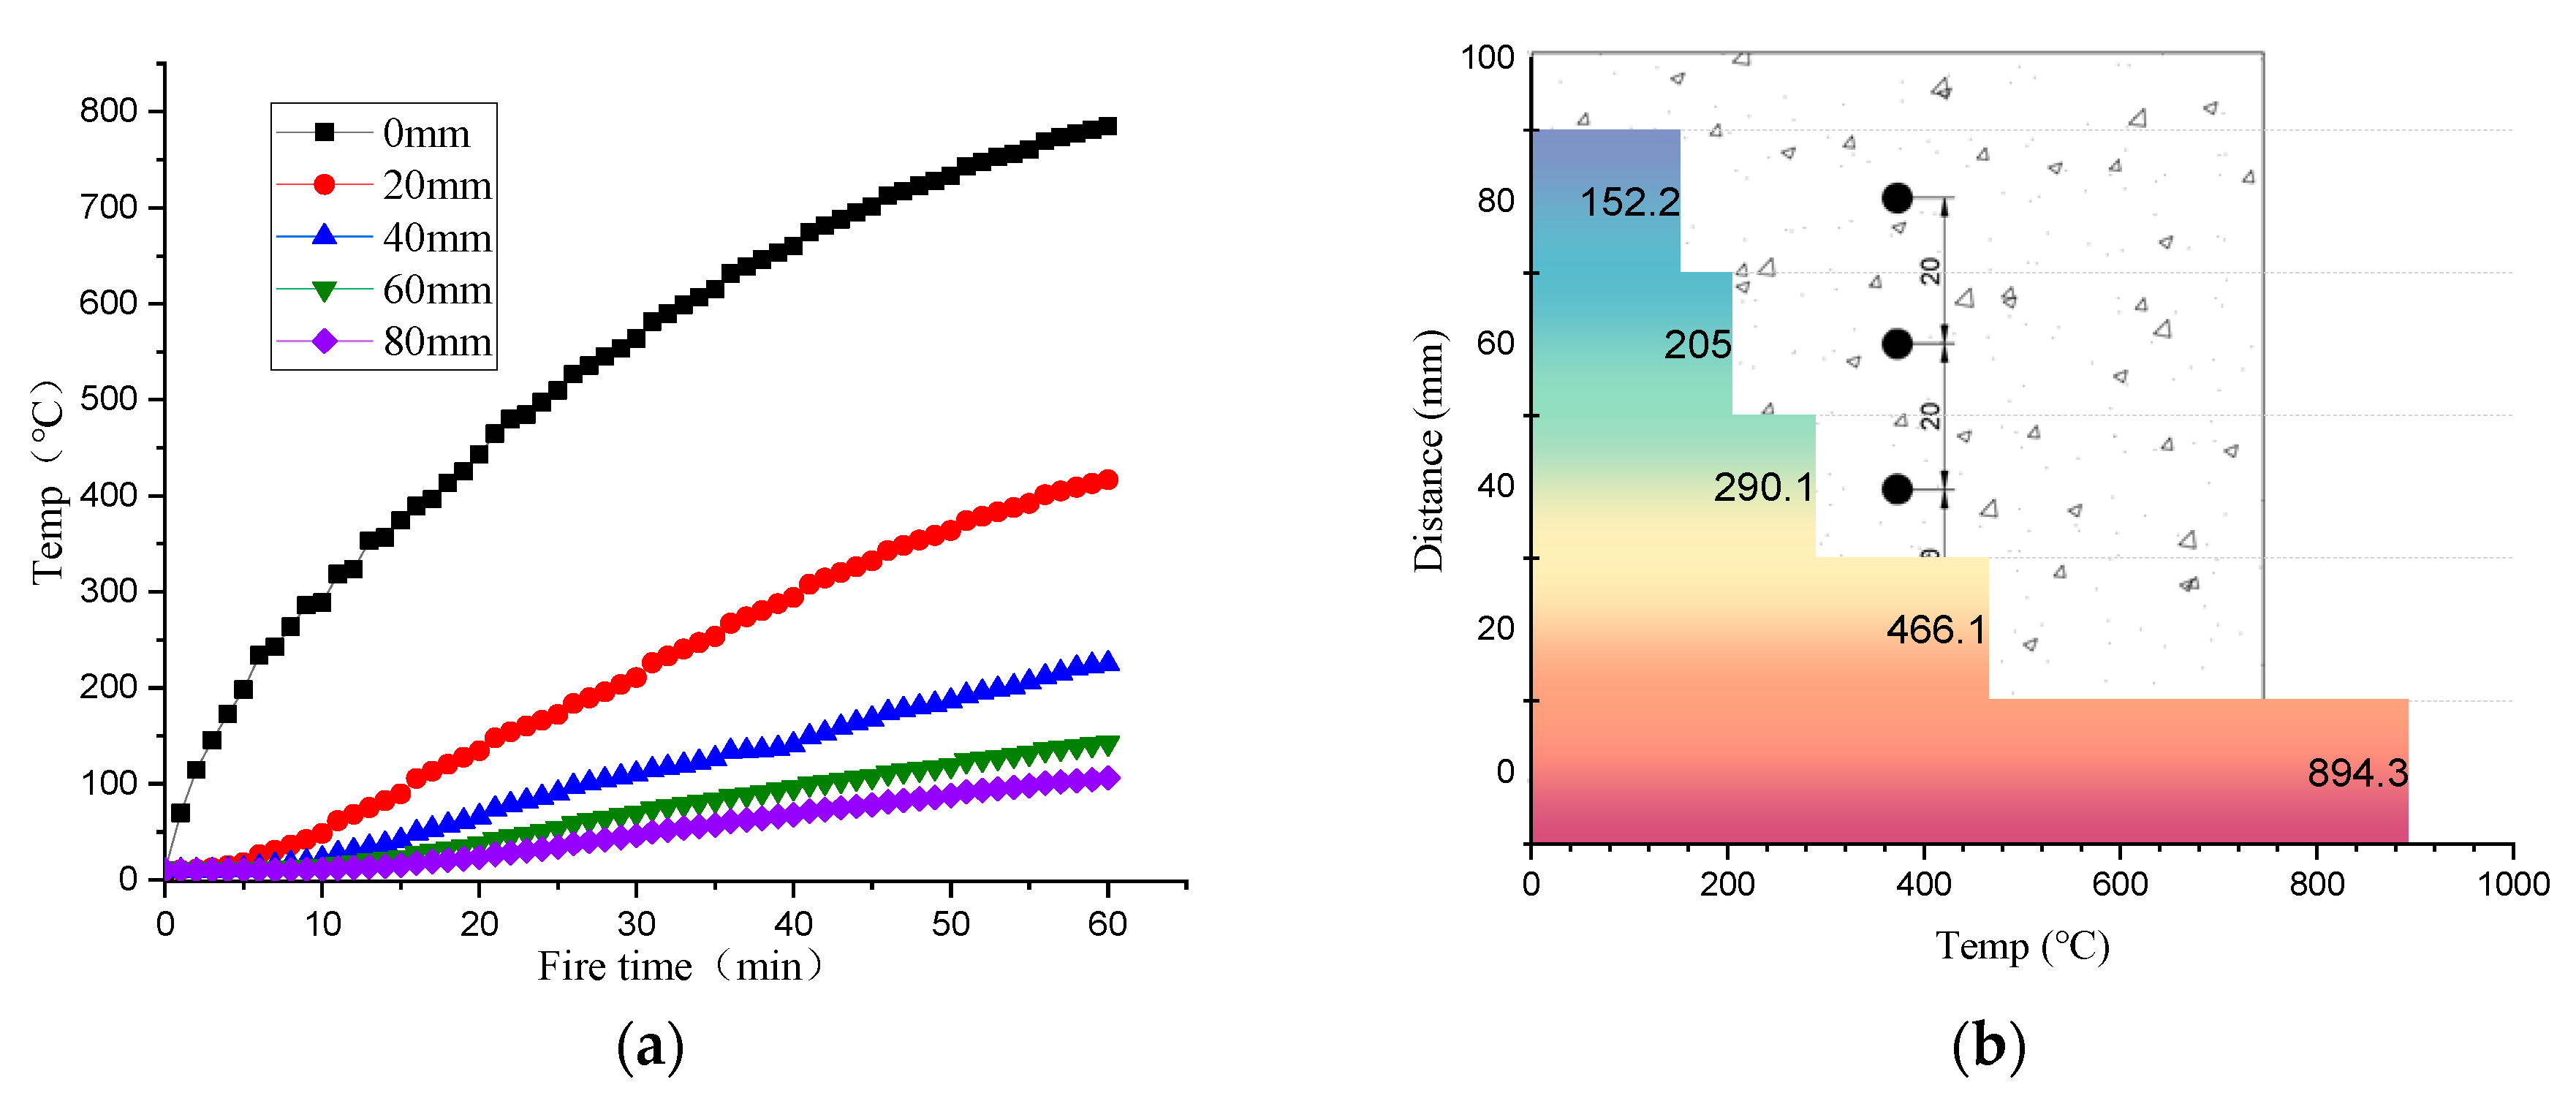
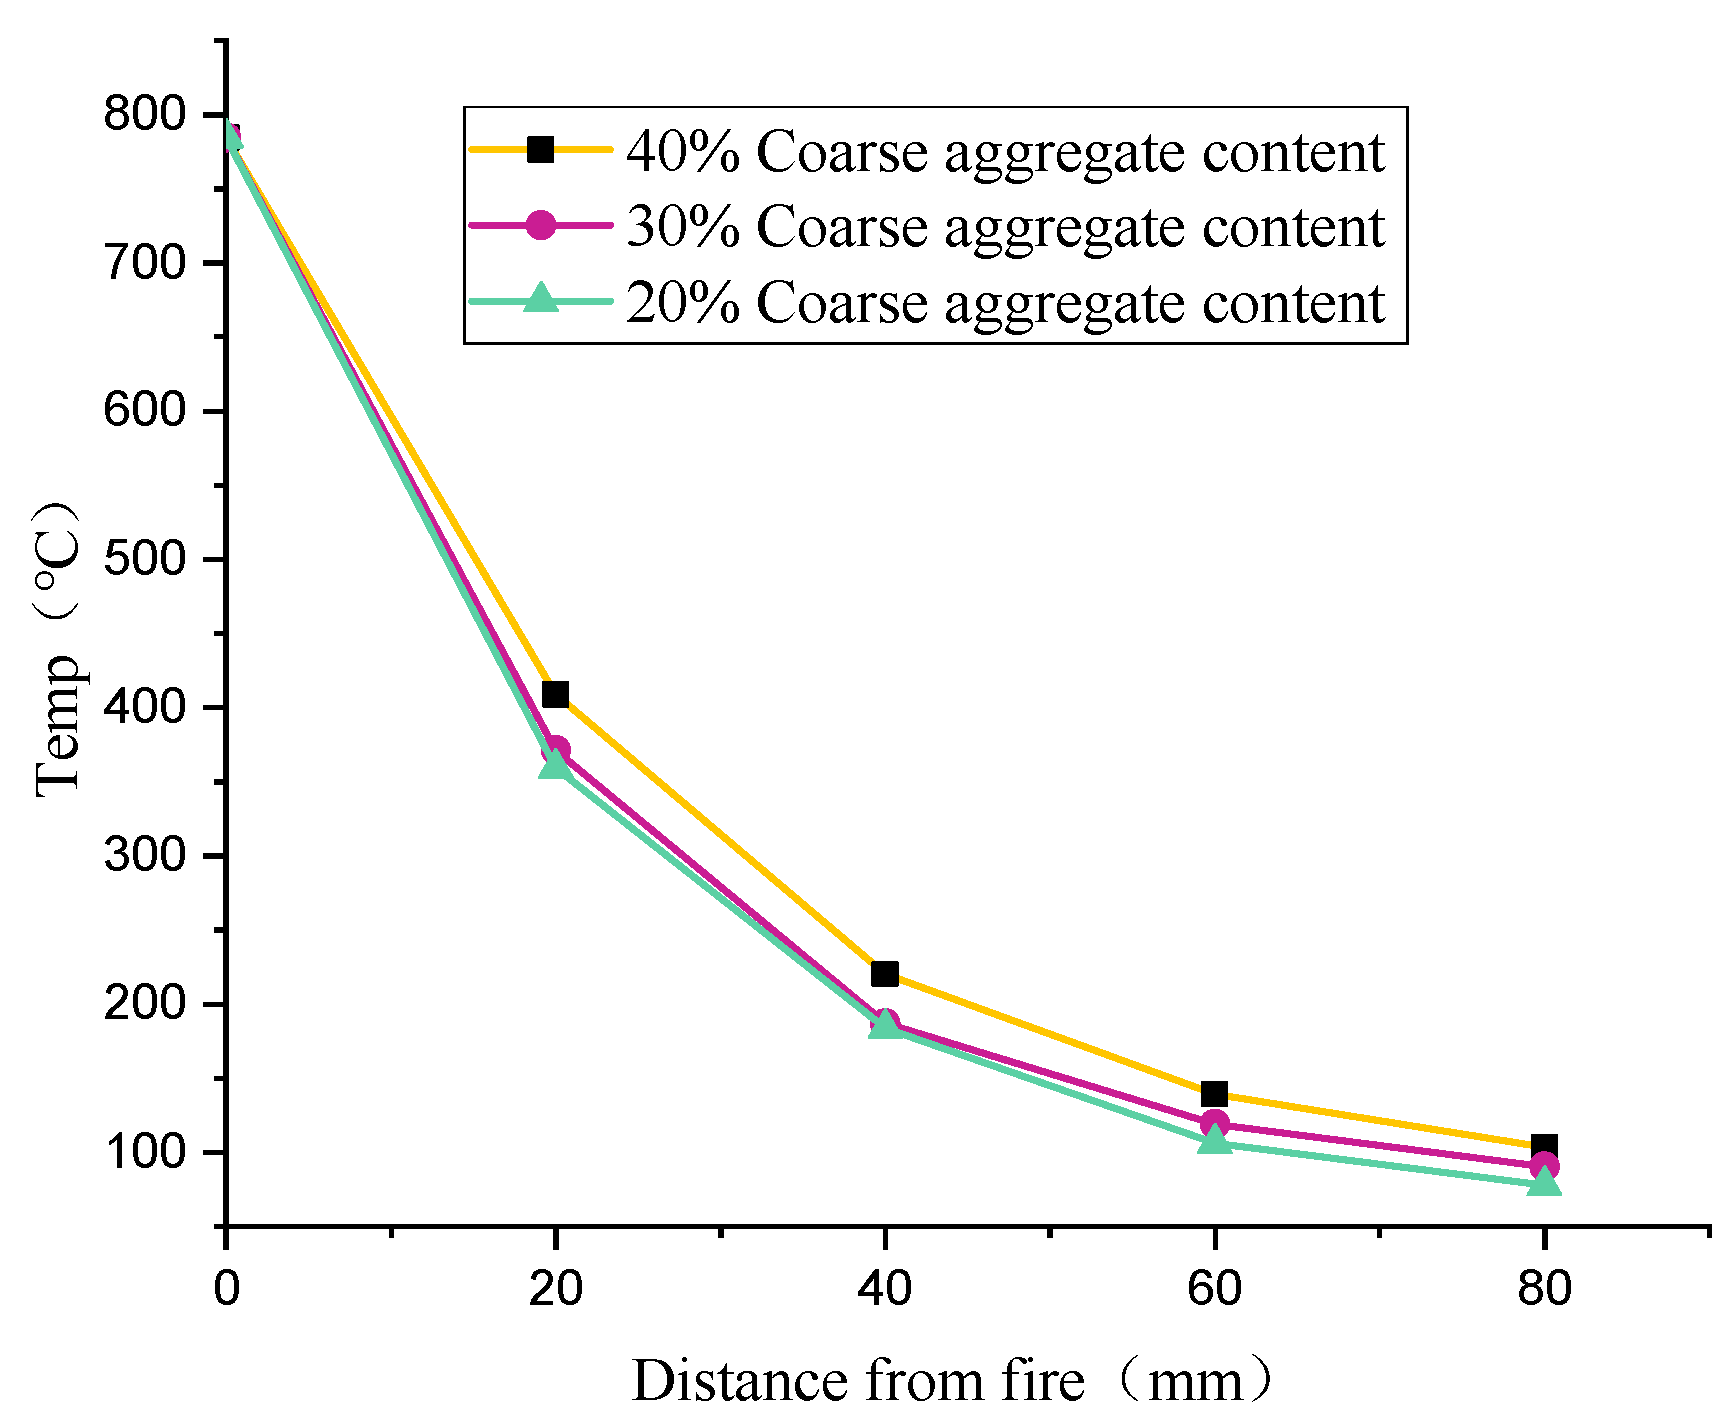
3.1.1. Temperature Field
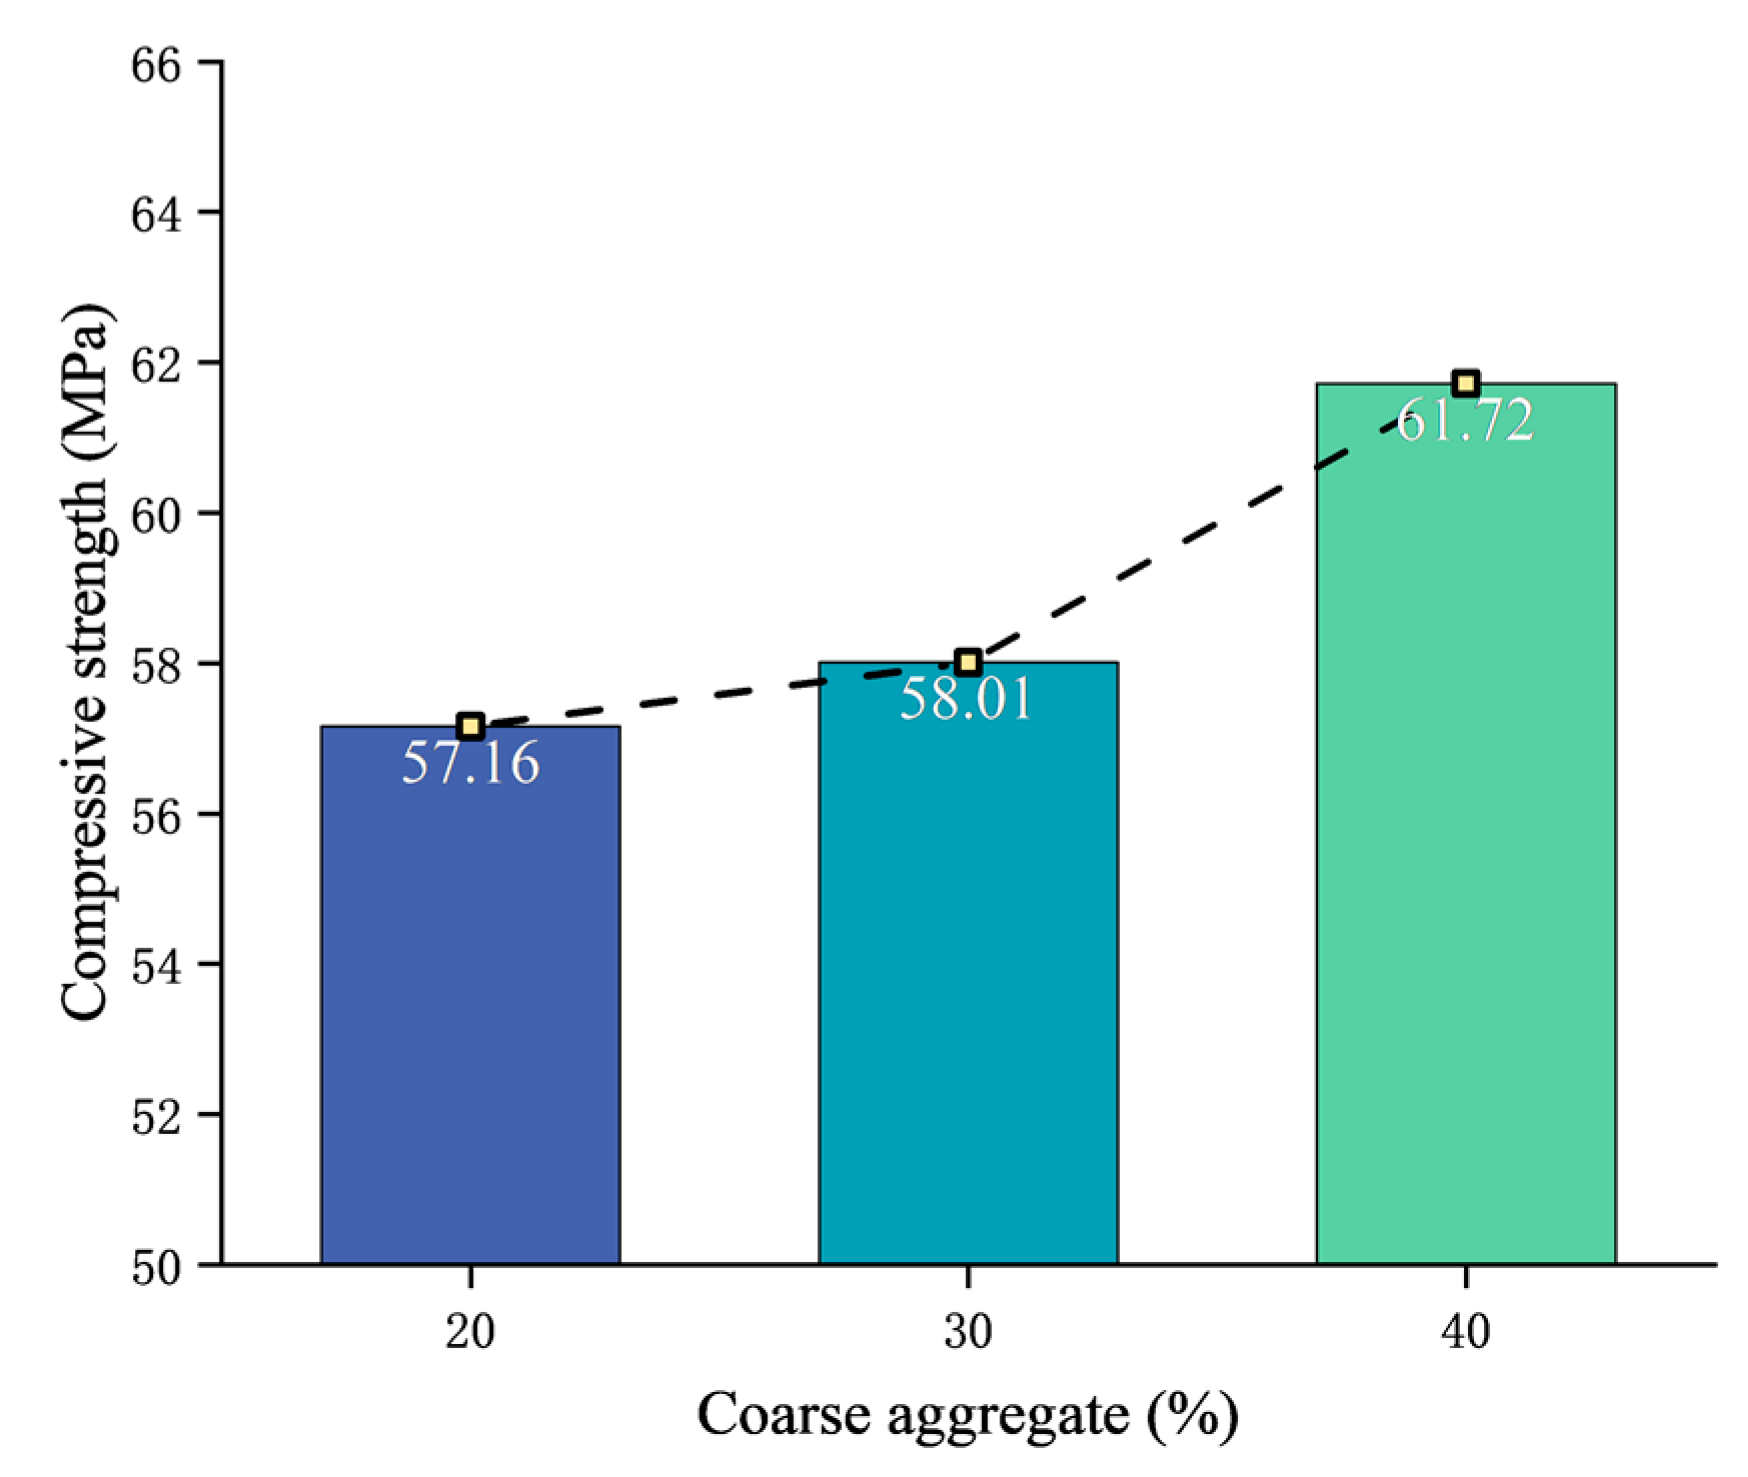
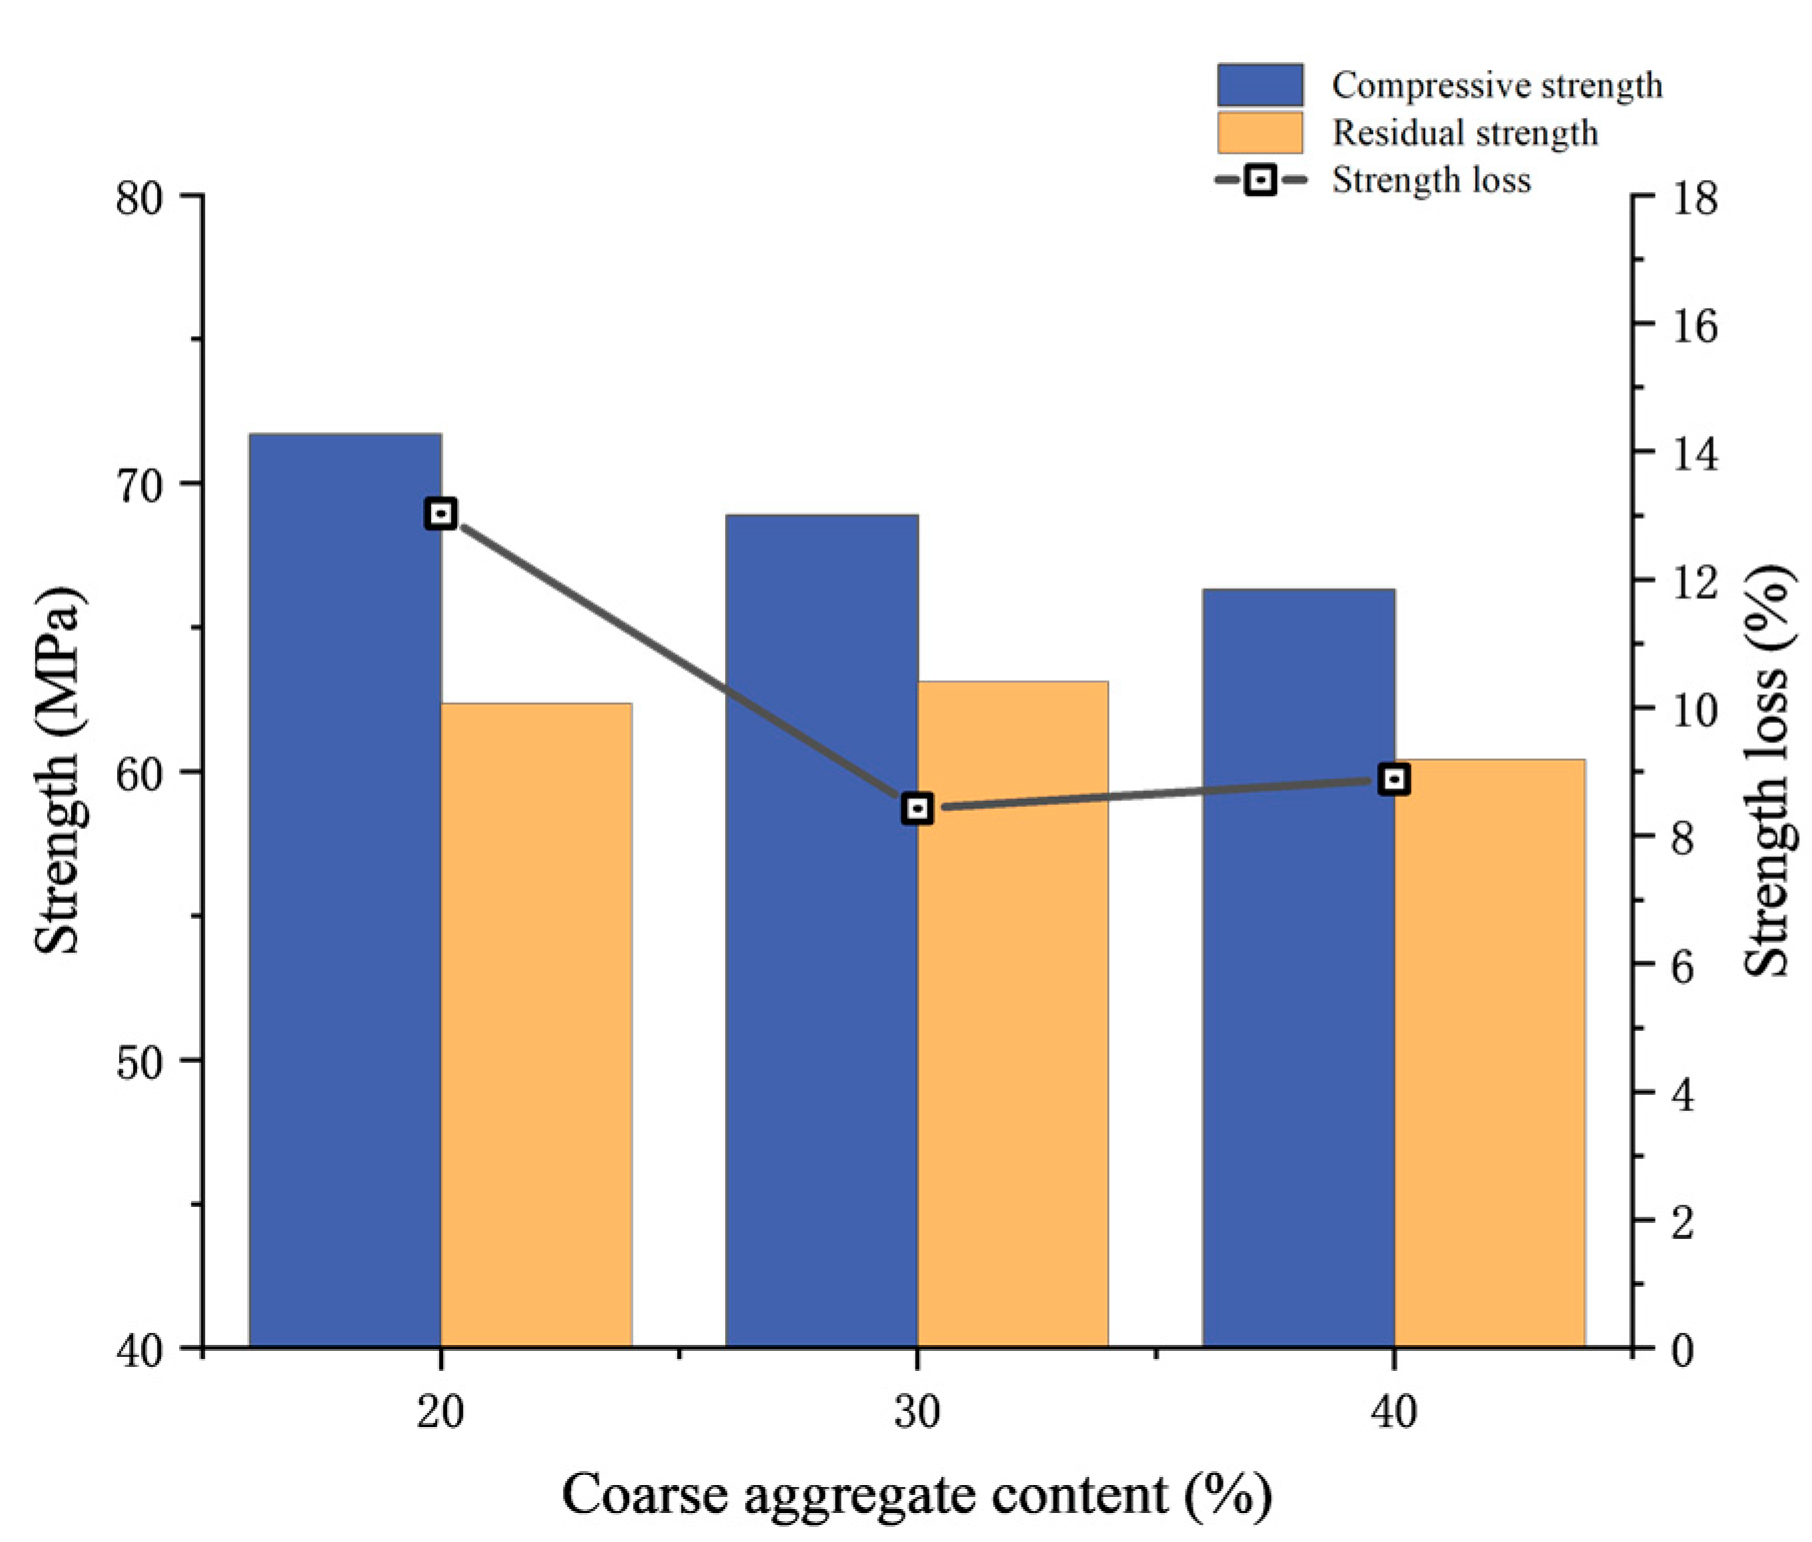
3.1.2. Compressive Strength
3.2. Analysis of Mesoscopic Deterioration Characteristics
3.2.1. CT Image Analysis of Lining Concrete at Room Temperature
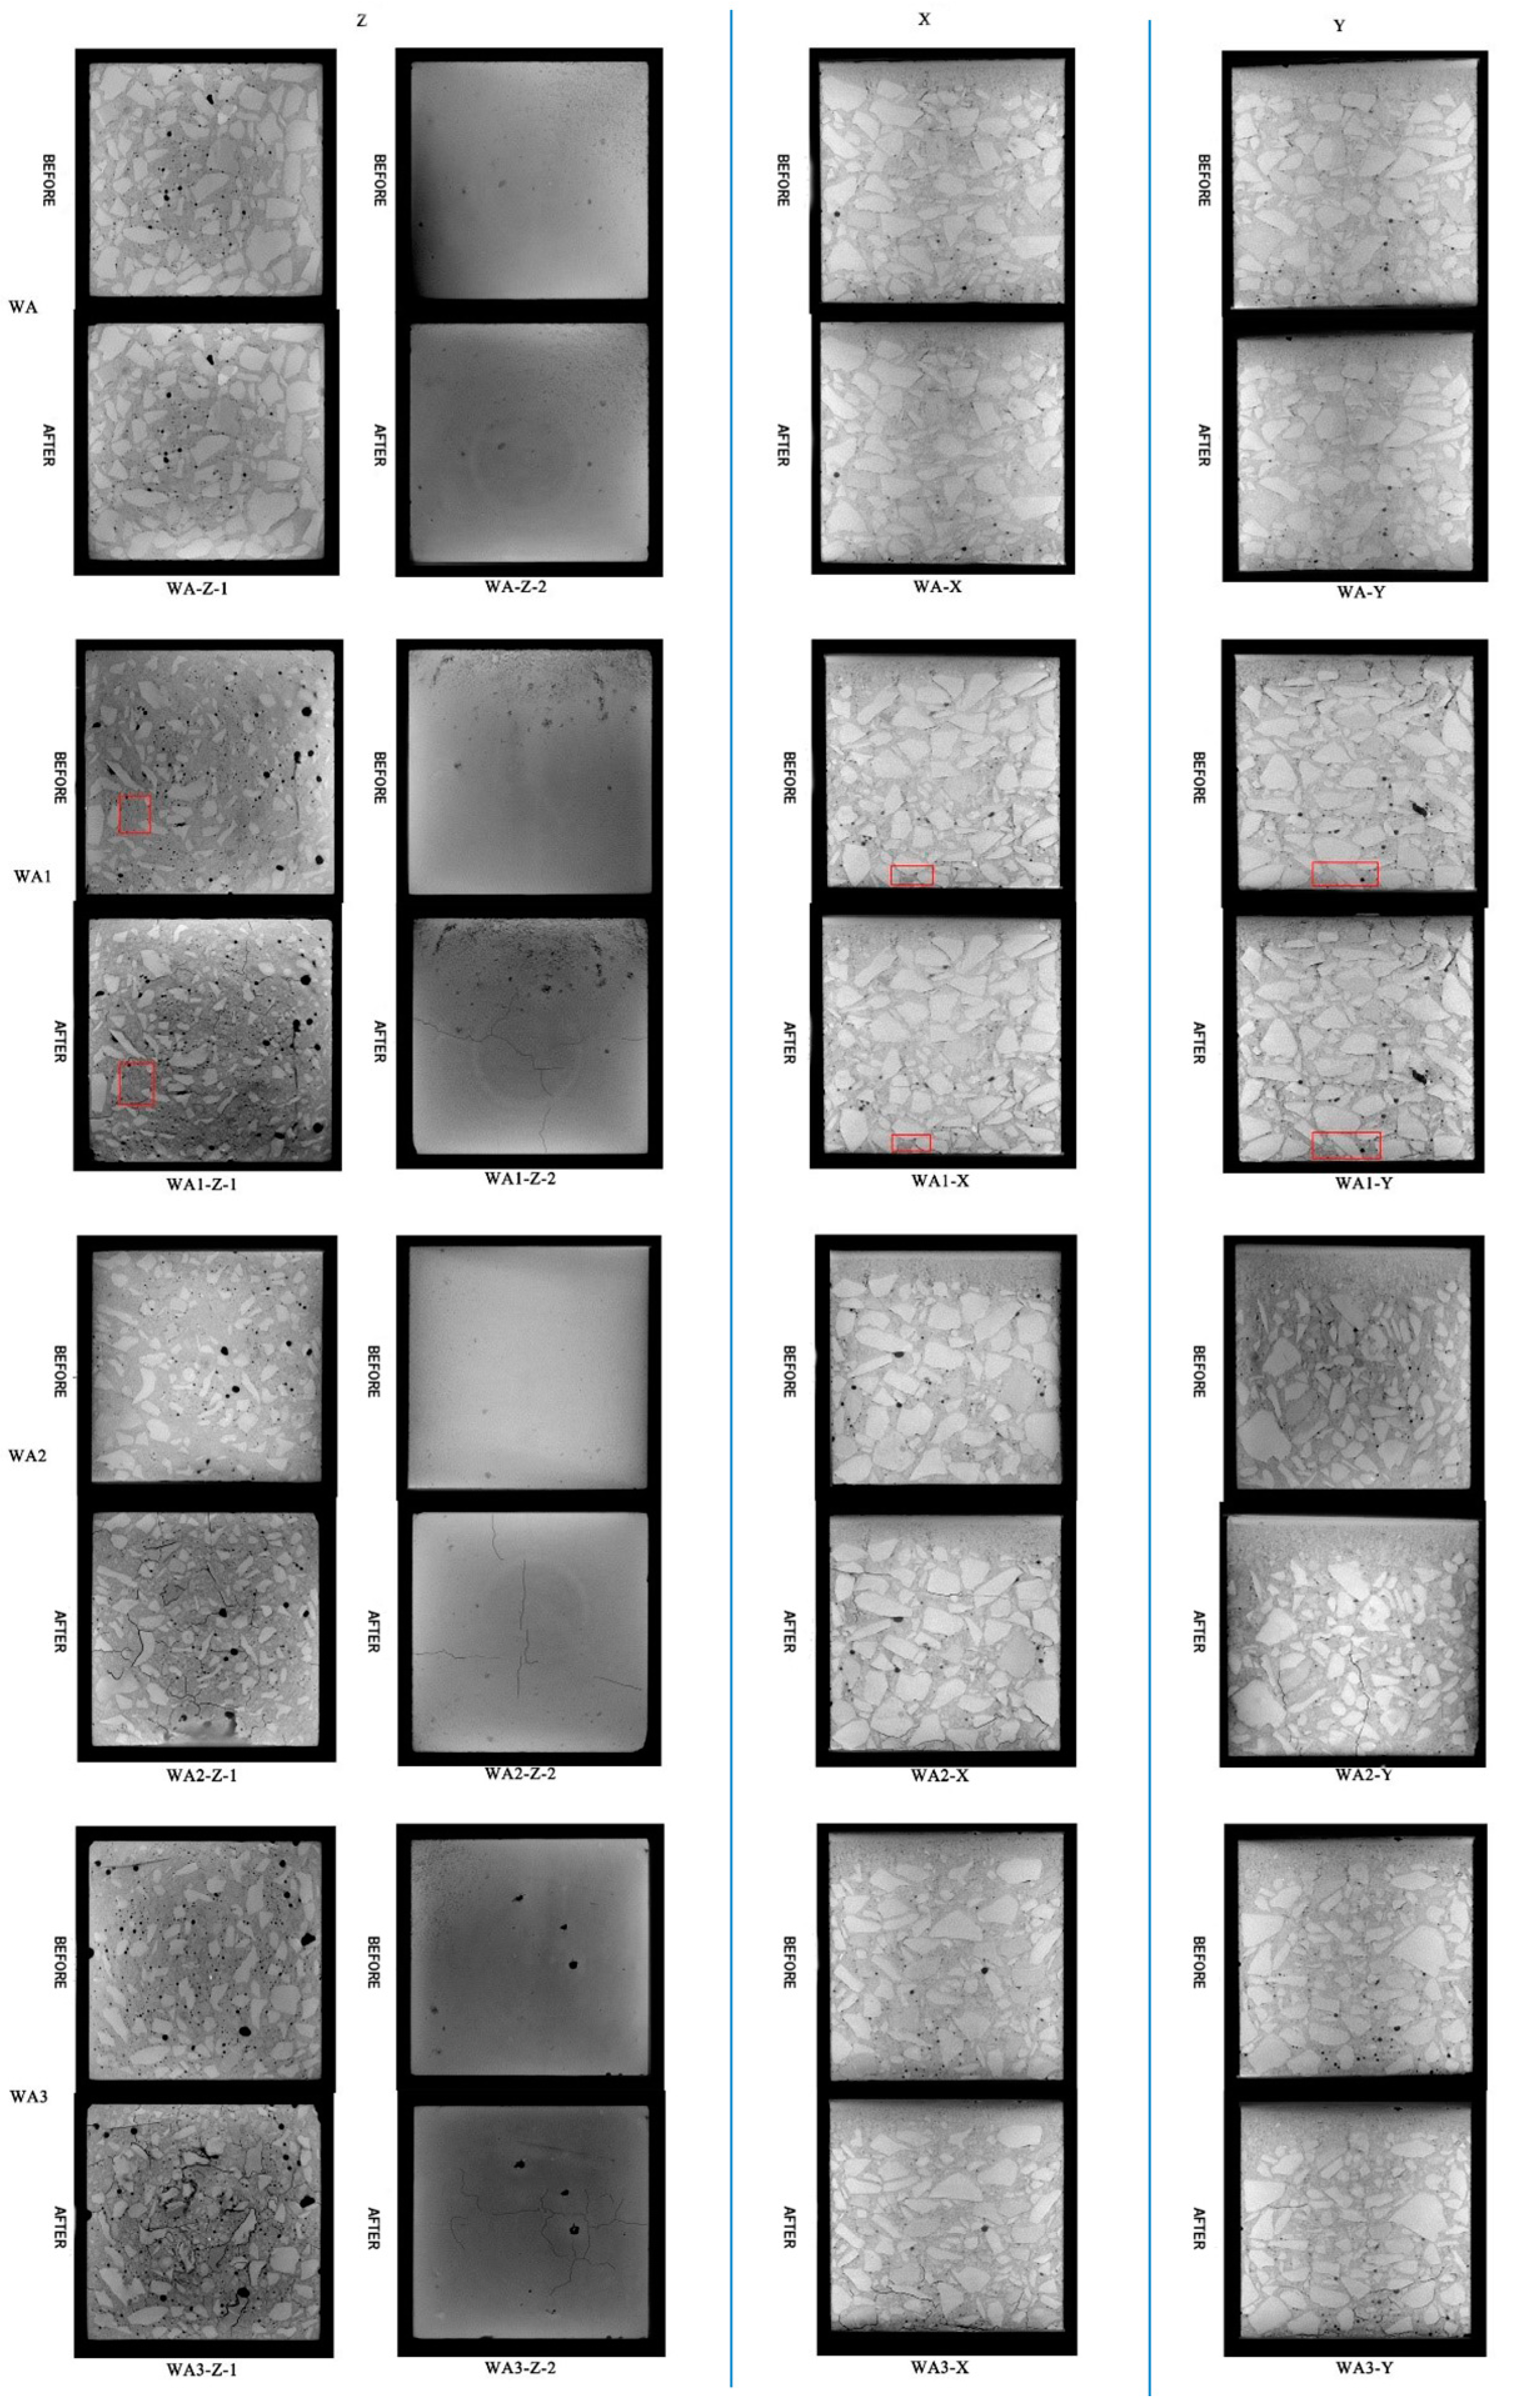
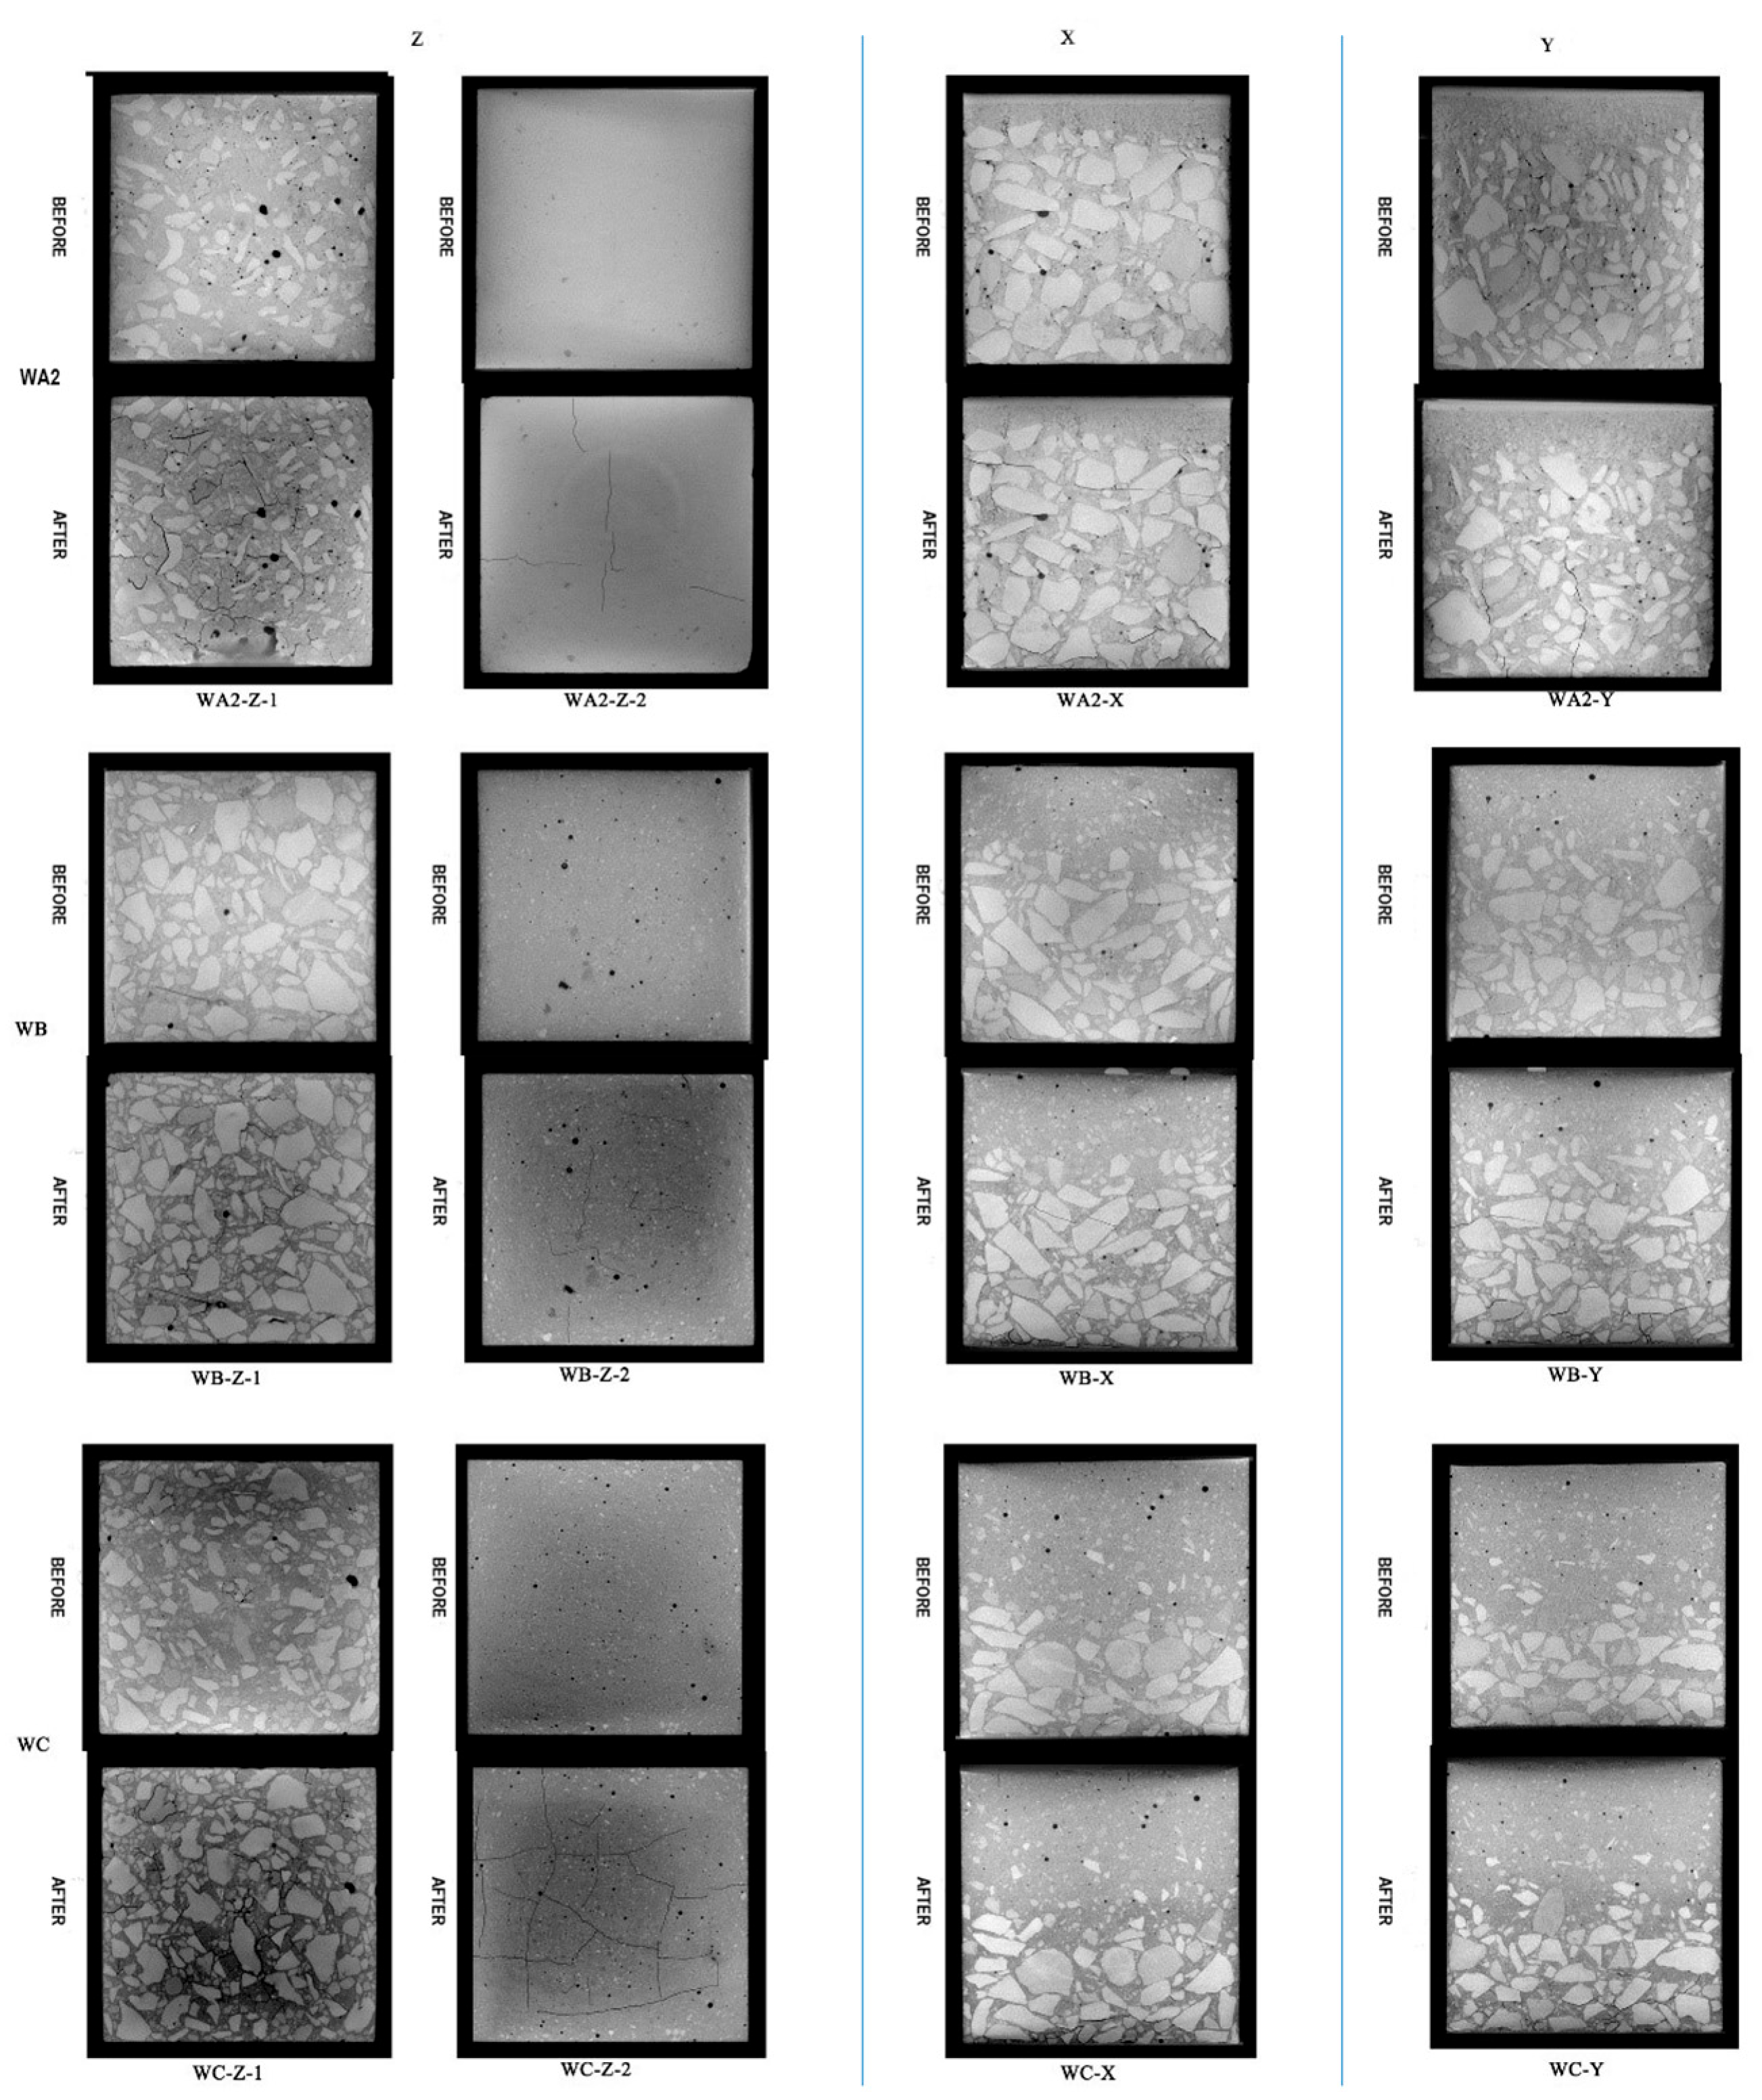
3.2.2. CT Image Analysis of Lining Concrete under Different Fire Exposure Times
- (1)
- Upon exposure to fire for 0 h and under 28% uniaxial strength, it can be observed that there are no cracks in the concrete, which is consistent with previous research results [24].
- (2)
- There are similarities and differences in damage to the three concrete specimens under different fire exposure times.
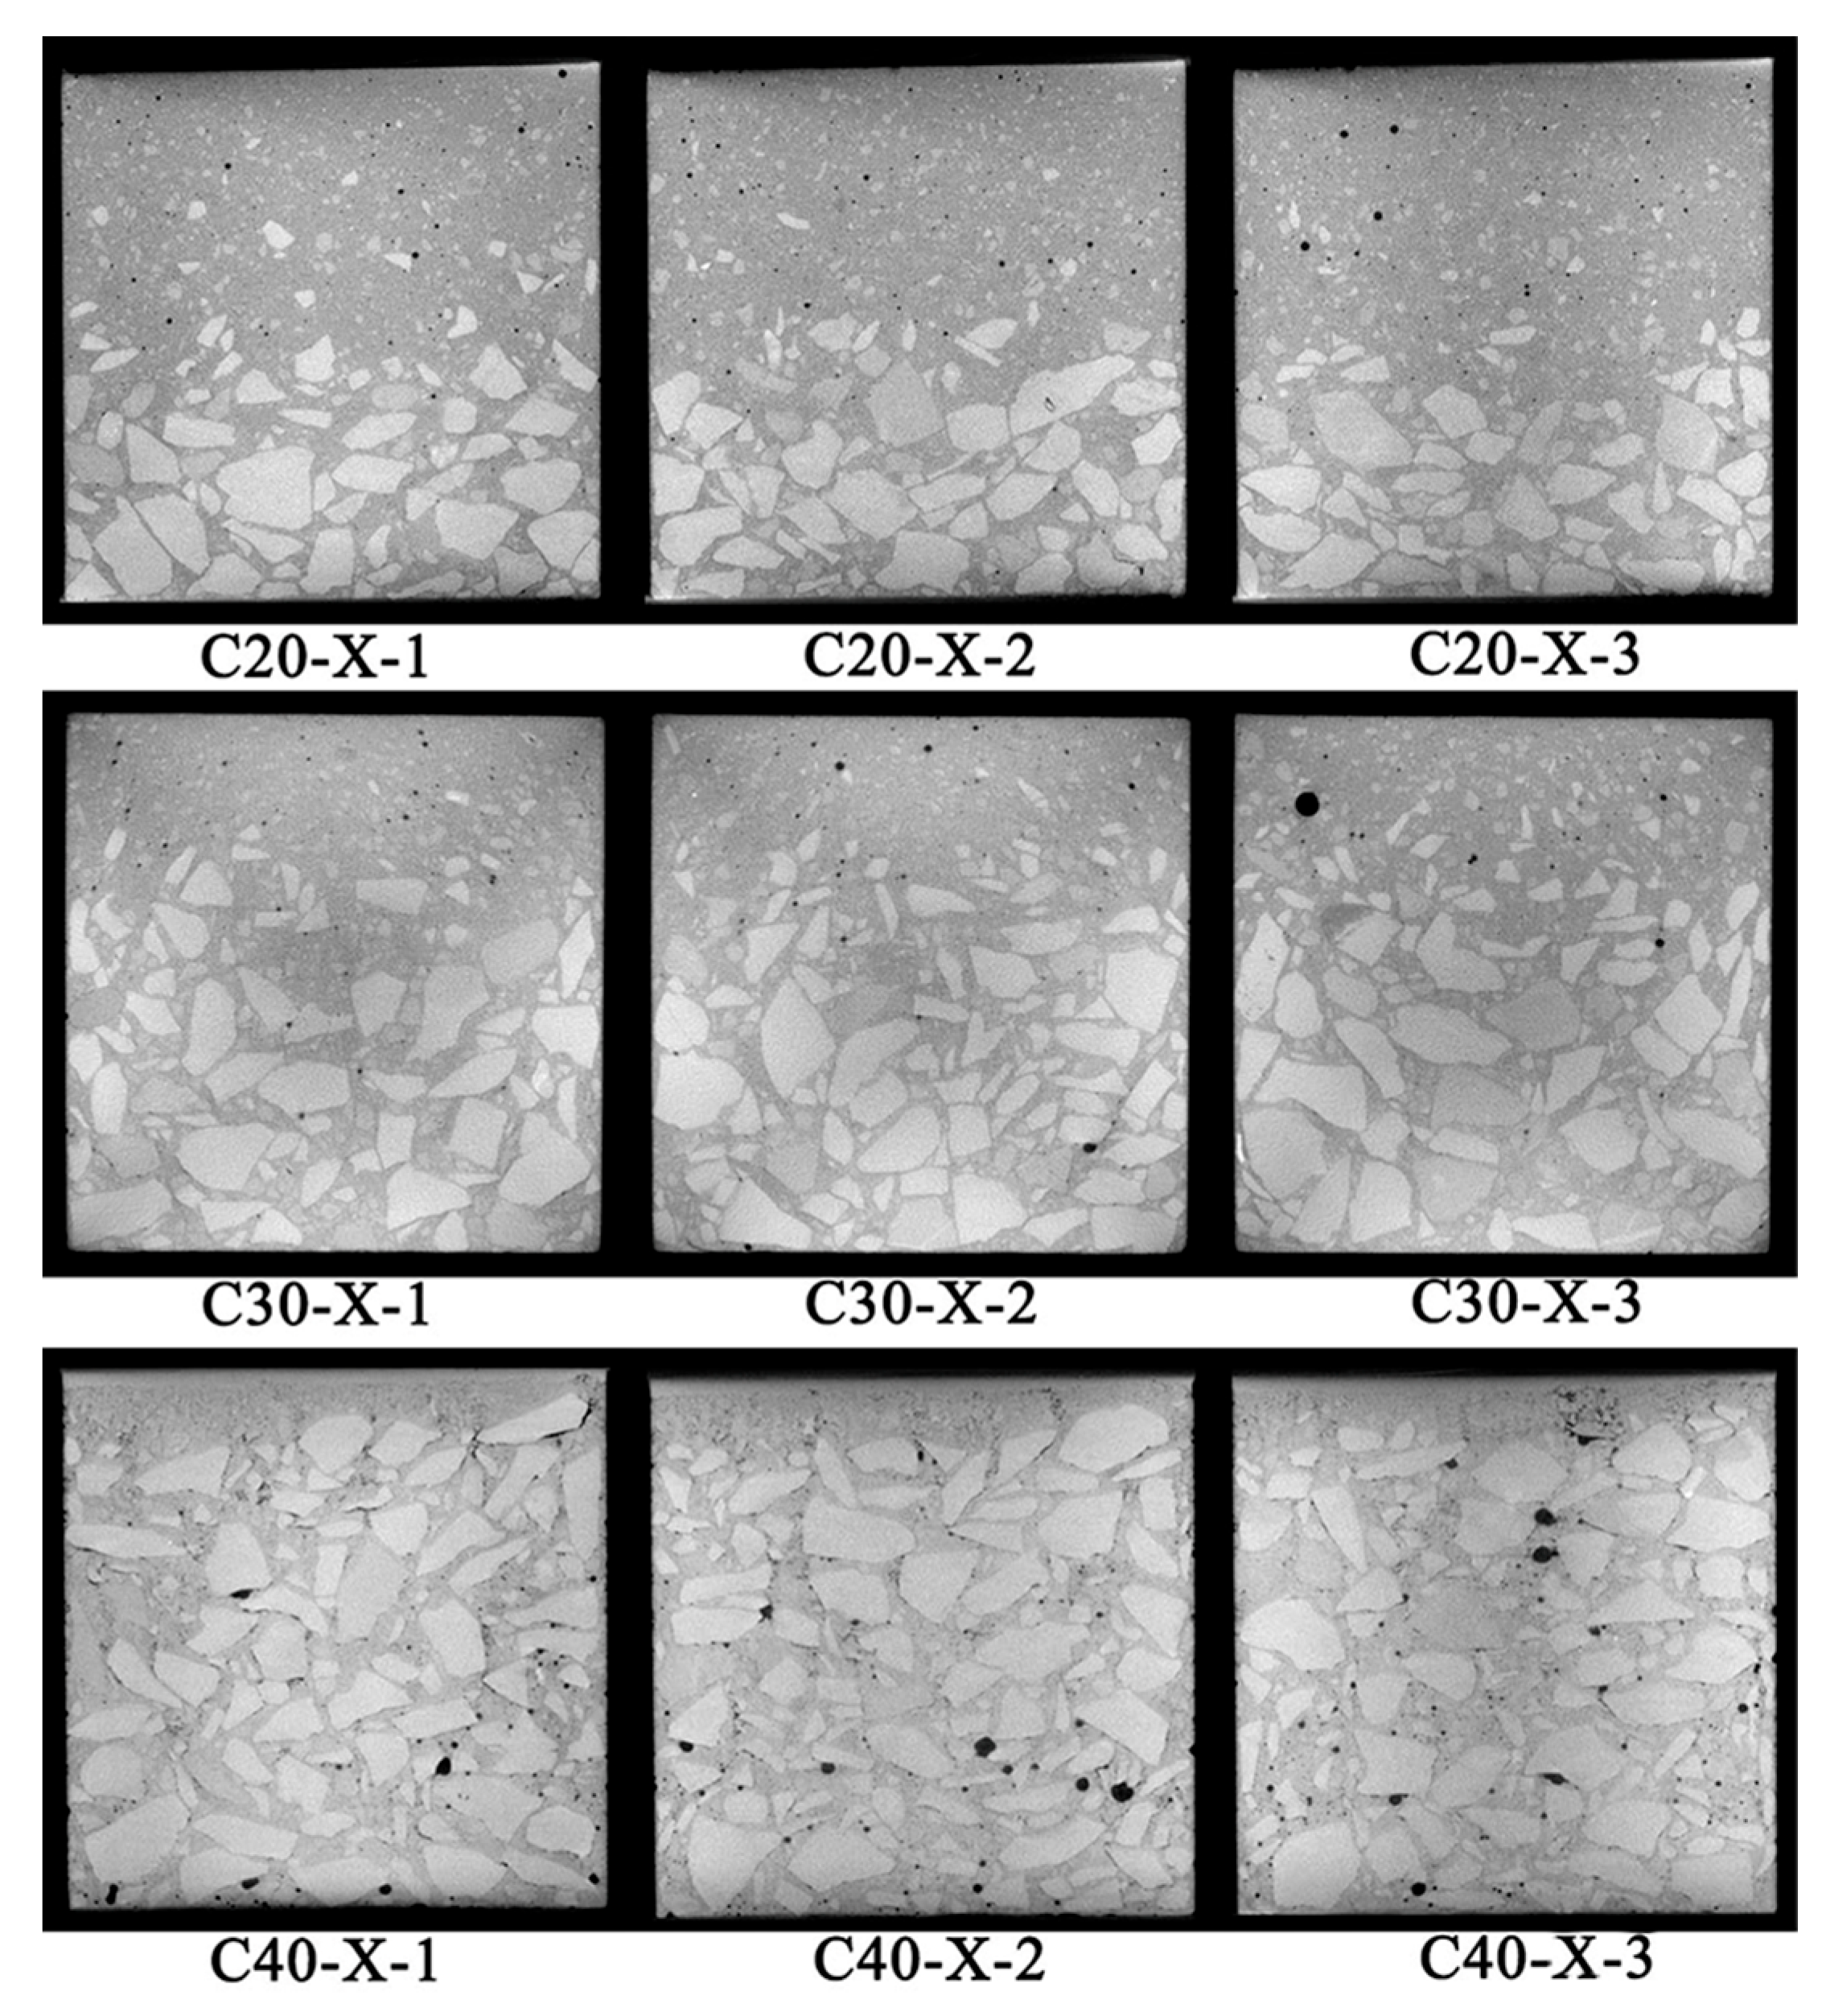
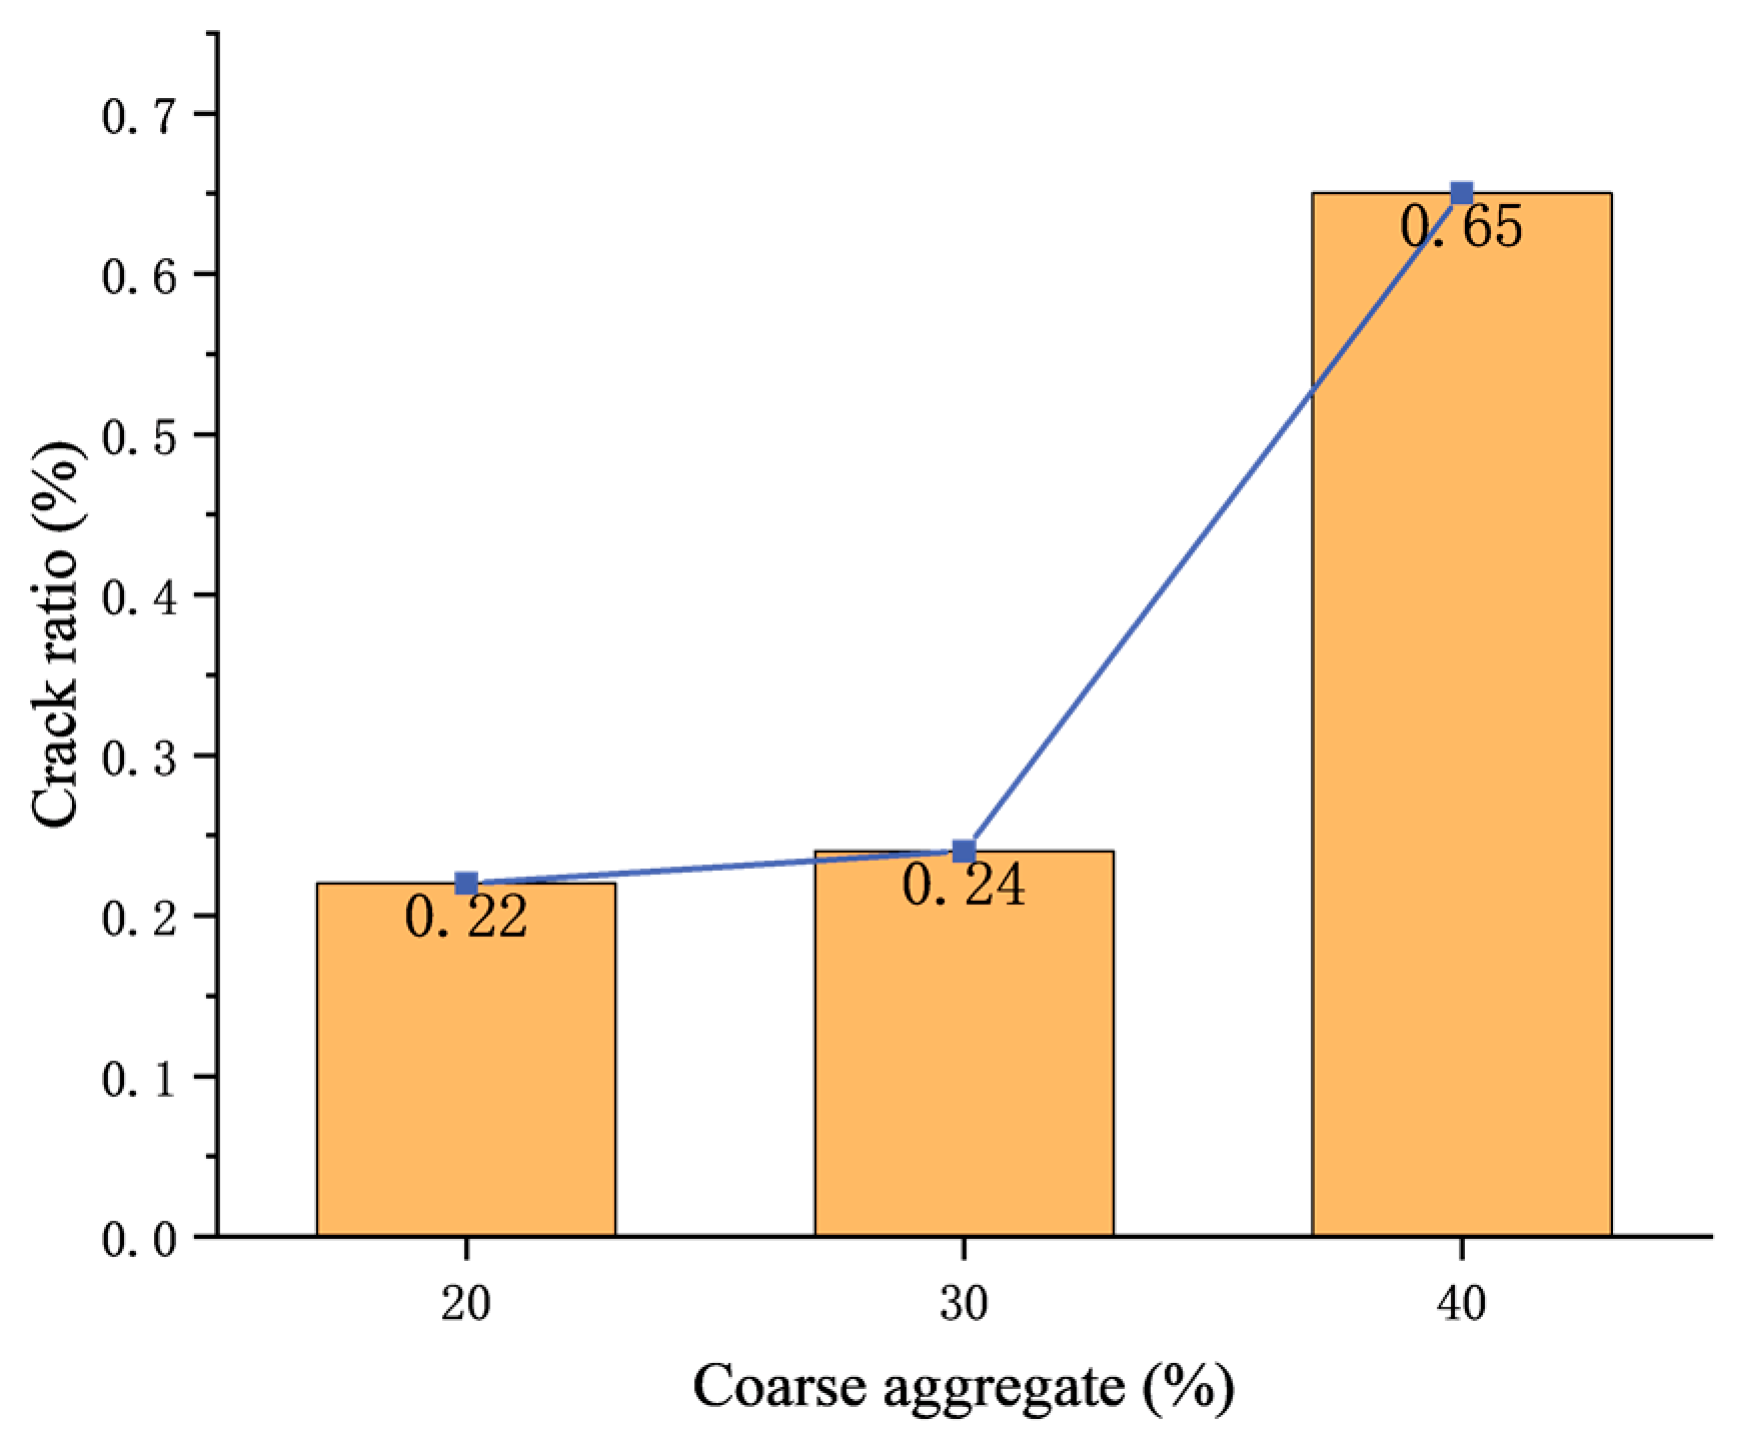
3.2.3. CT Image Analysis under Different Coarse Aggregate Contents
- ①
- In 20% coarse aggregate concrete, cracks are mainly located in the interface layer and mortar. Lower aggregate content leads to a more significant degradation in the mortar and a higher incidence of cracks. This is because lower aggregate content results in a higher proportion of mortar, which is less resistant to thermal and mechanical stresses than aggregates.
- ②
- In concrete with 20%, 30%, and 40% coarse aggregate contents, the thicknesses of severely deteriorated areas at the bottom are 25 mm, 20 mm, and 15 mm, respectively. The damage is more pronounced at the bottom of the concrete samples, with lower aggregate contents showing deeper damage. This is because aggregates can distribute and possibly reduce stress within the mortar matrix, mitigating the extent of thermal and mechanical damage.
- ③
- The 20% aggregate content concrete shows degradation mainly at the bottom, where the temperature is high, and in low-temperature areas on the opposite side, where aggregates are absent, which could not dissipate the heat and stress. In contrast, higher aggregate contents (30% and 40%) show a more distributed degradation, including in the middle areas, likely due to the aggregates’ role in transferring heat and stress more evenly throughout the sample.
3.3. Correlation Research on Macro and Micro Damage of Lining Concrete
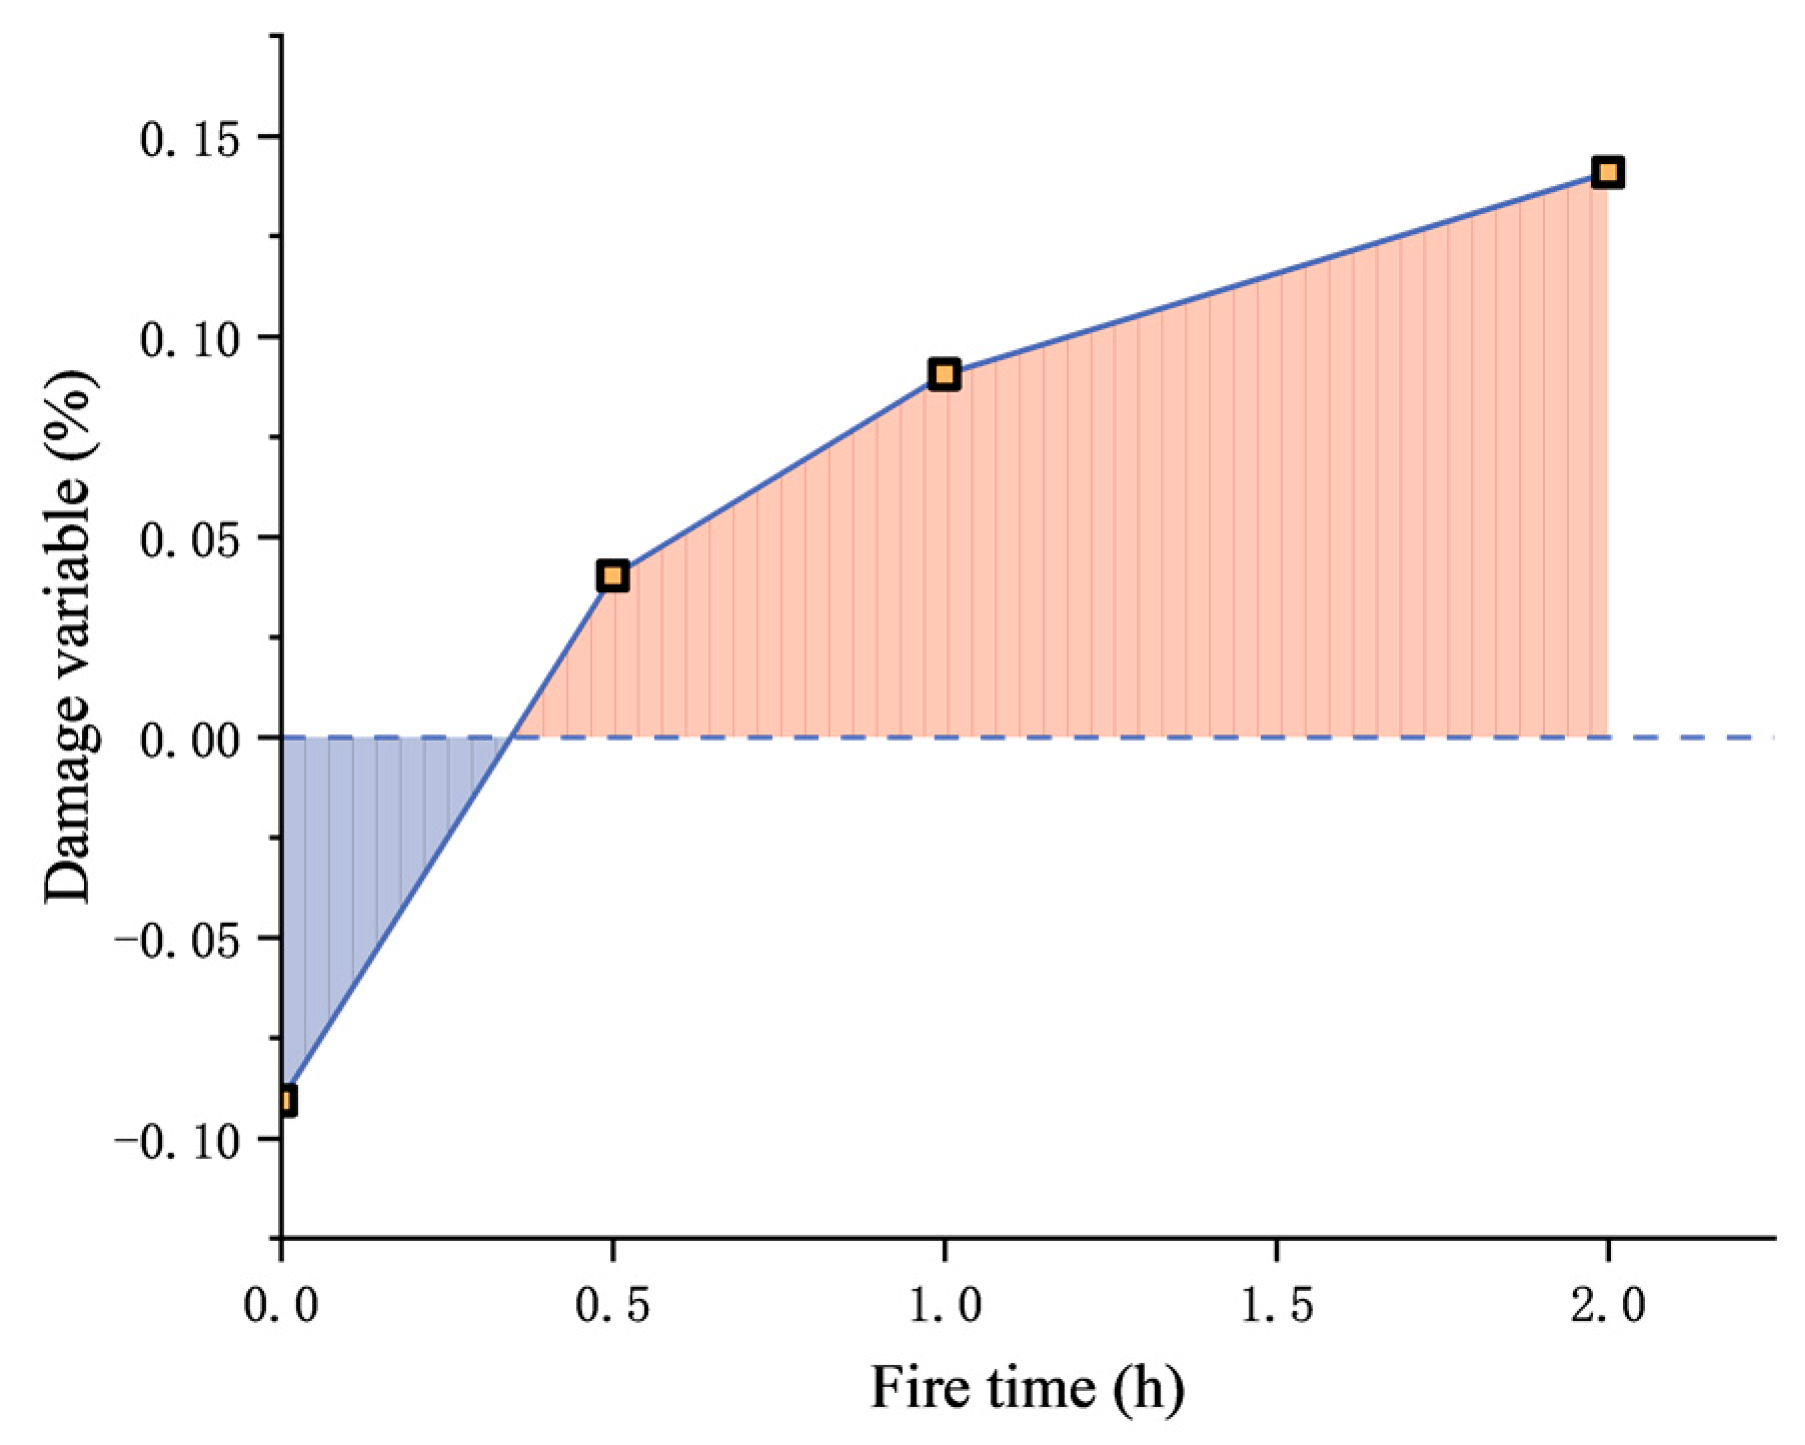
3.3.1. Definition of the Damage Variable
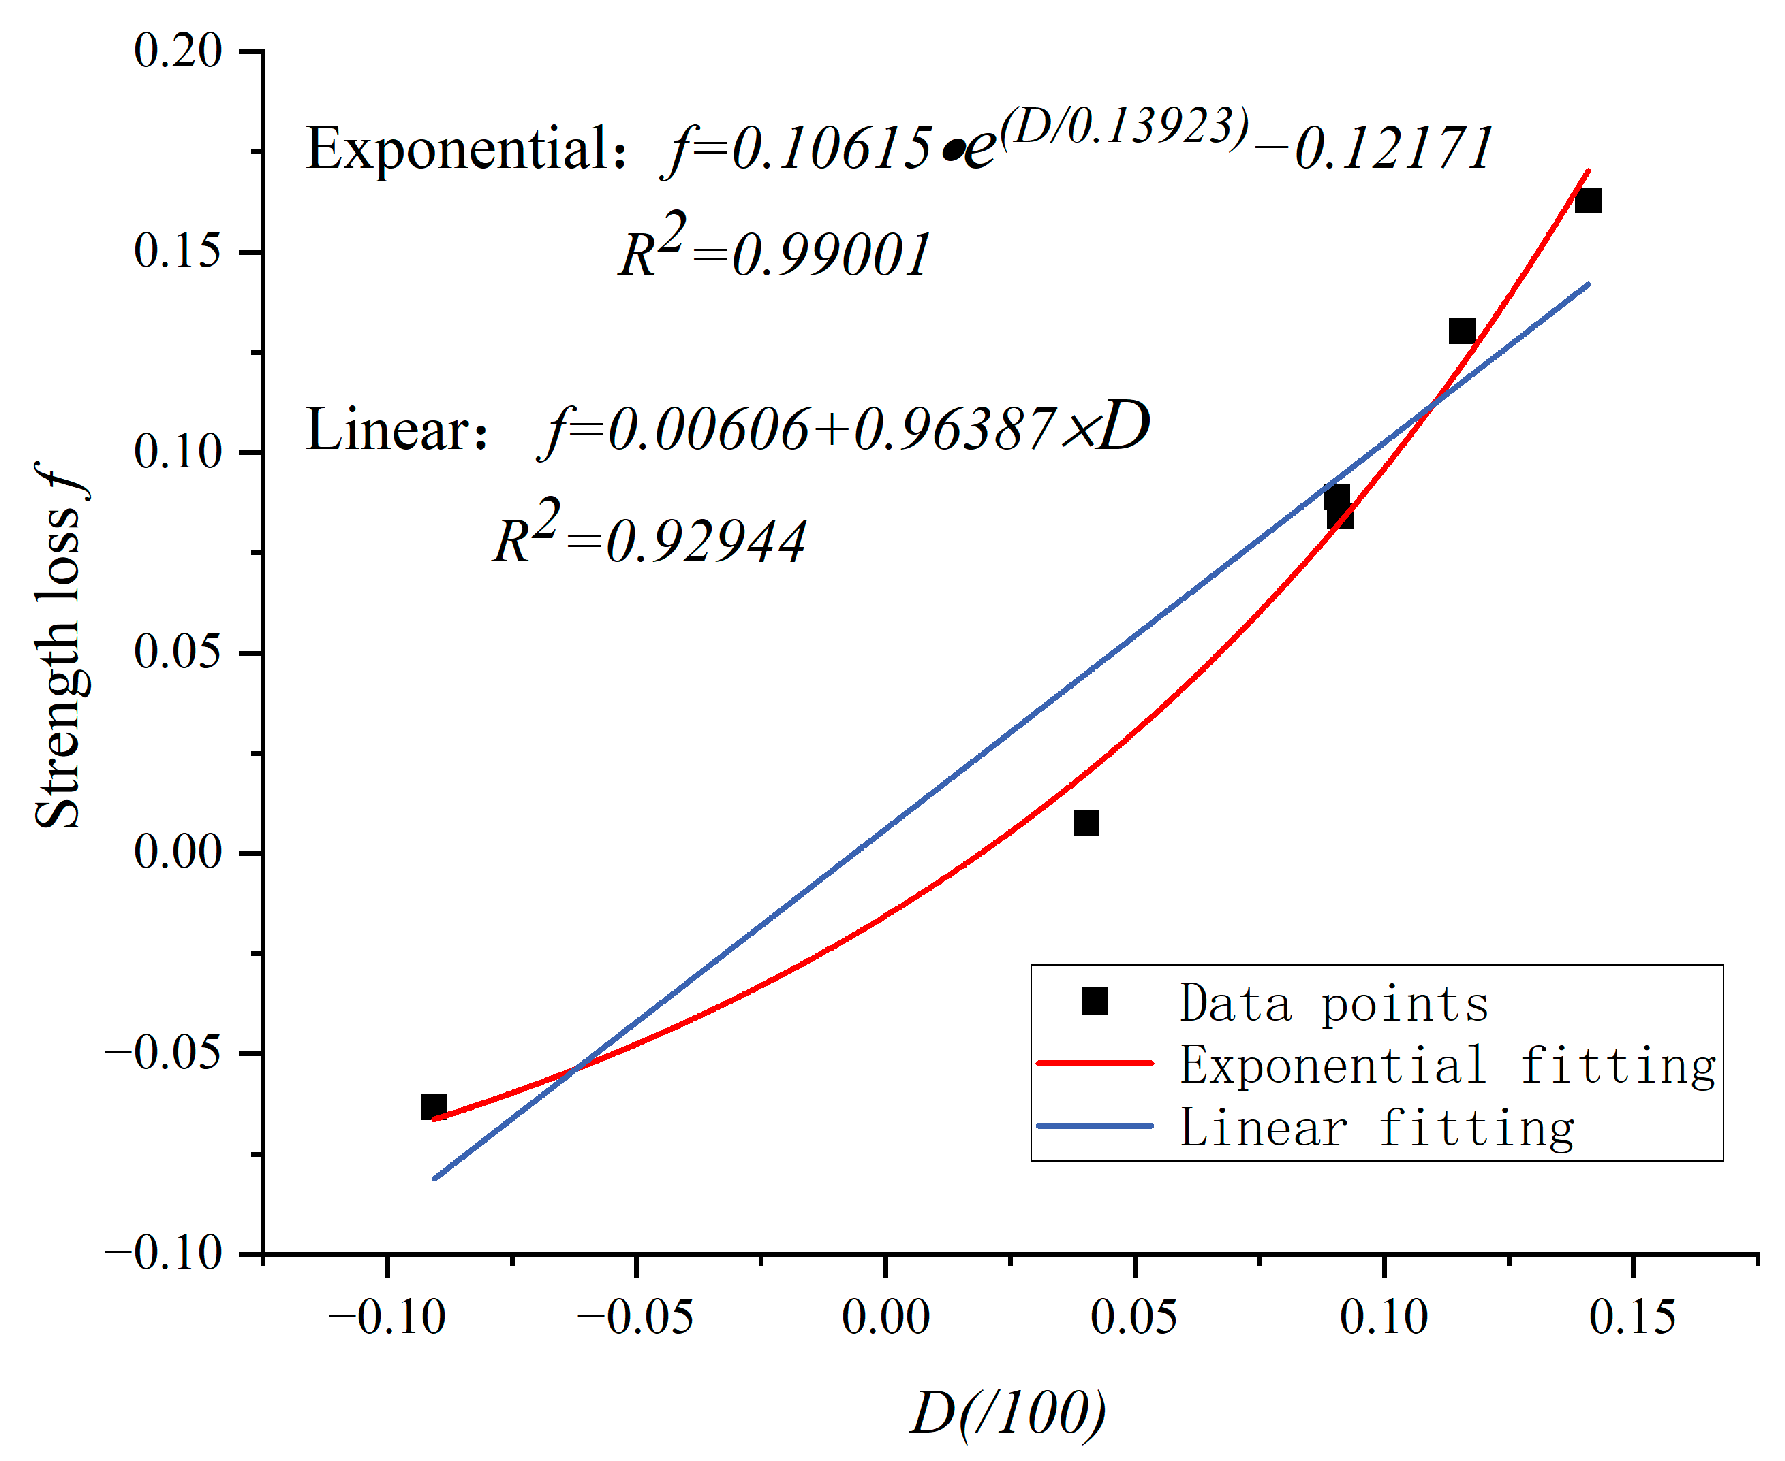
3.3.2. Correlation Analysis
4. Conclusions
- Under the same thermal–mechanical coupling condition, the lower the content of concrete coarse aggregate, the weaker the fire resistance;
- Under the same fire exposure time, the higher the content of concrete coarse aggregate, the faster the temperature transfer to the interior. This is due to the difference in mortar content, whose thermal conductivity is worse than that of the aggregate.
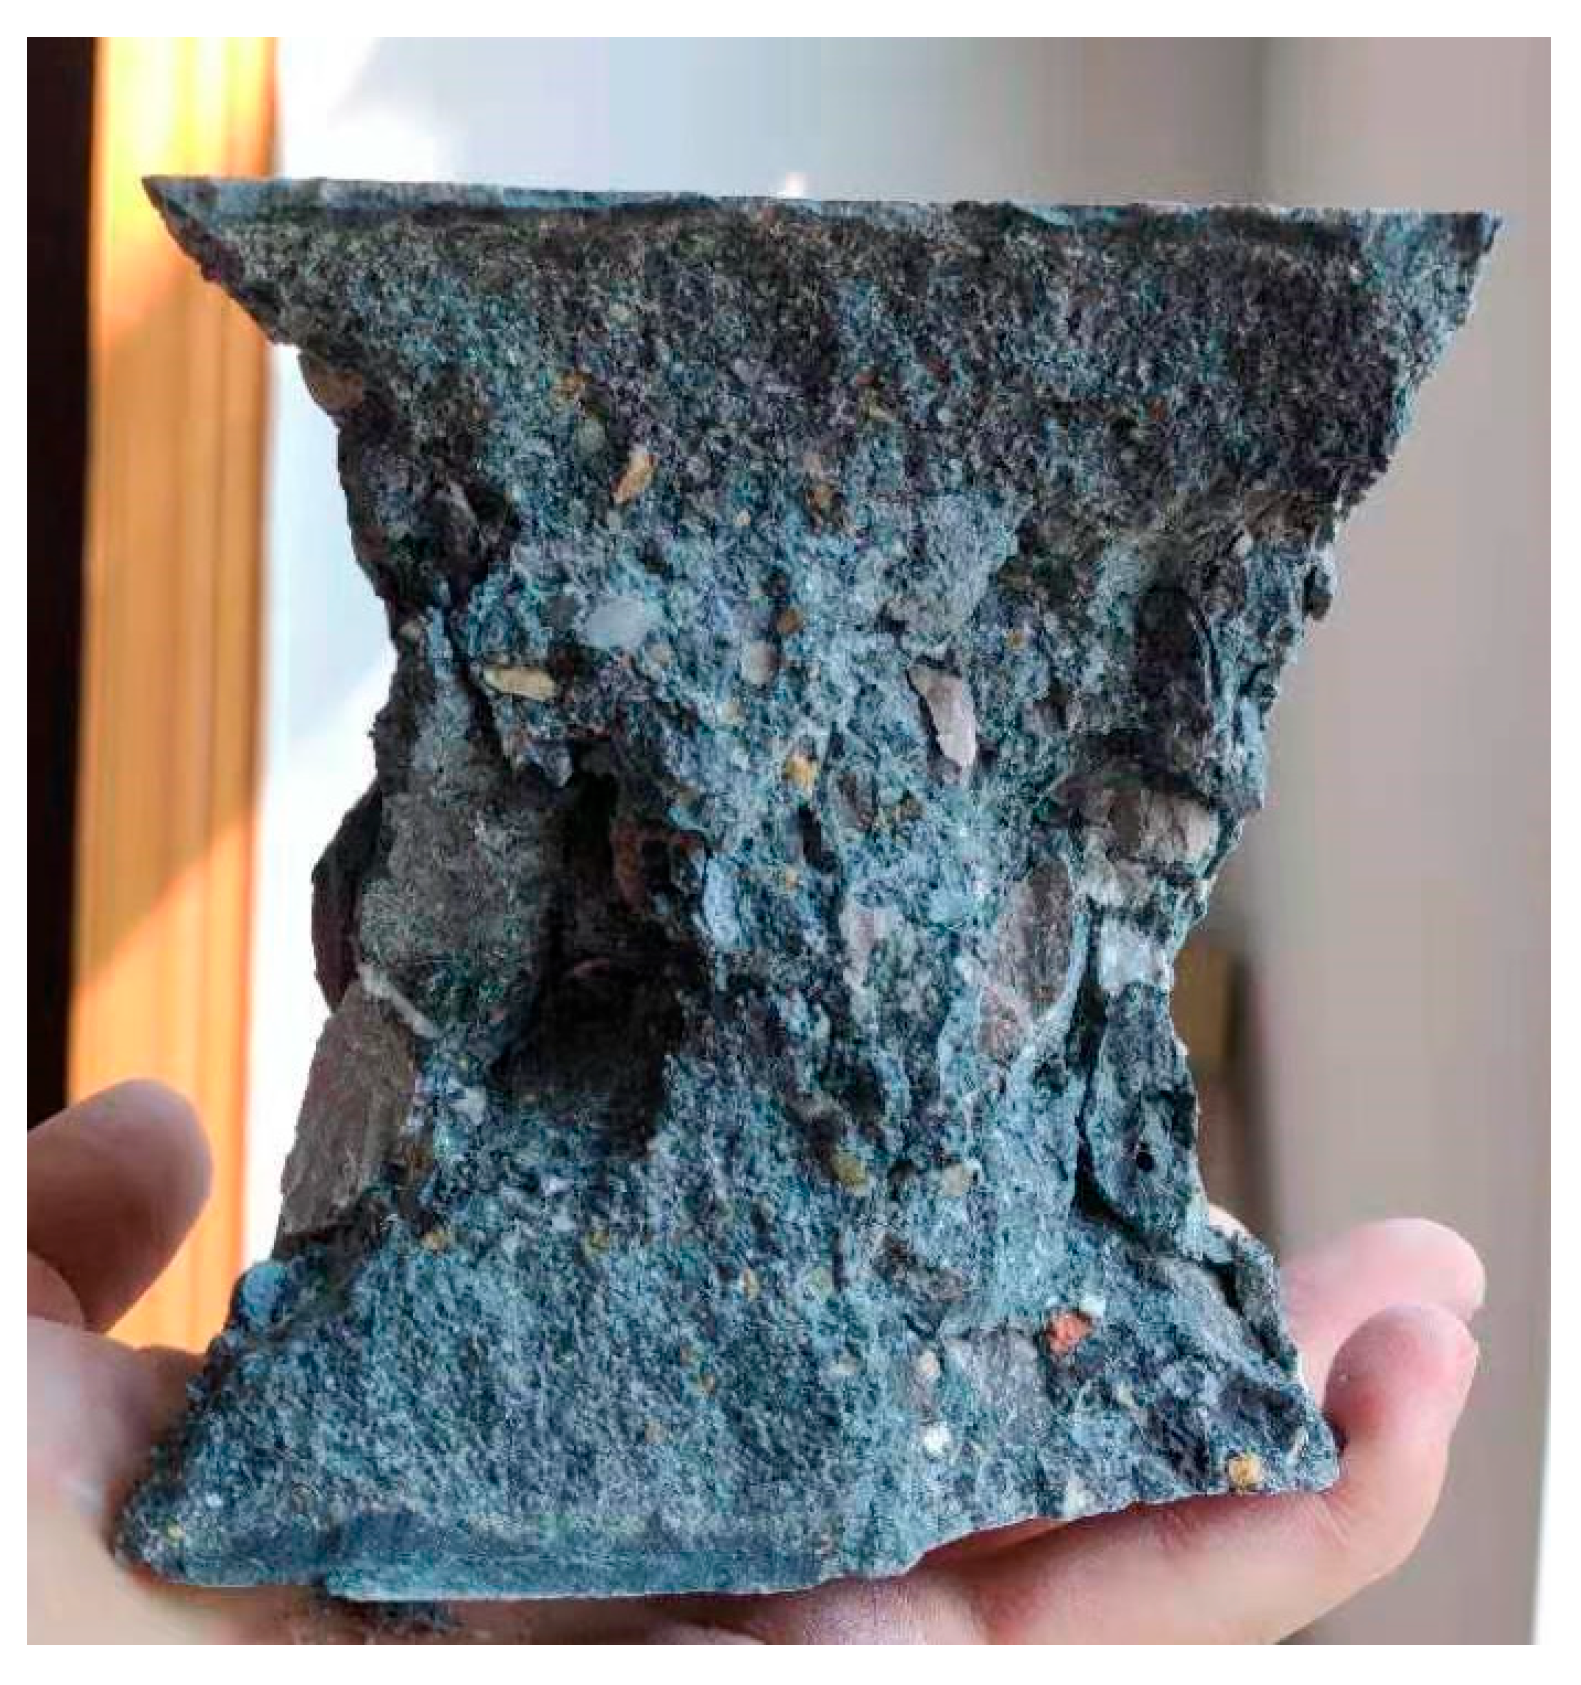
- Mesoscopic deterioration characteristics of different coarse aggregate contents and fire exposure times were observed, mainly reflected in mesoscopic damage phenomena, such as pores’ distribution, regional damage characteristics, the evolution of cracks, and the “aggregate protrusion” phenomenon.
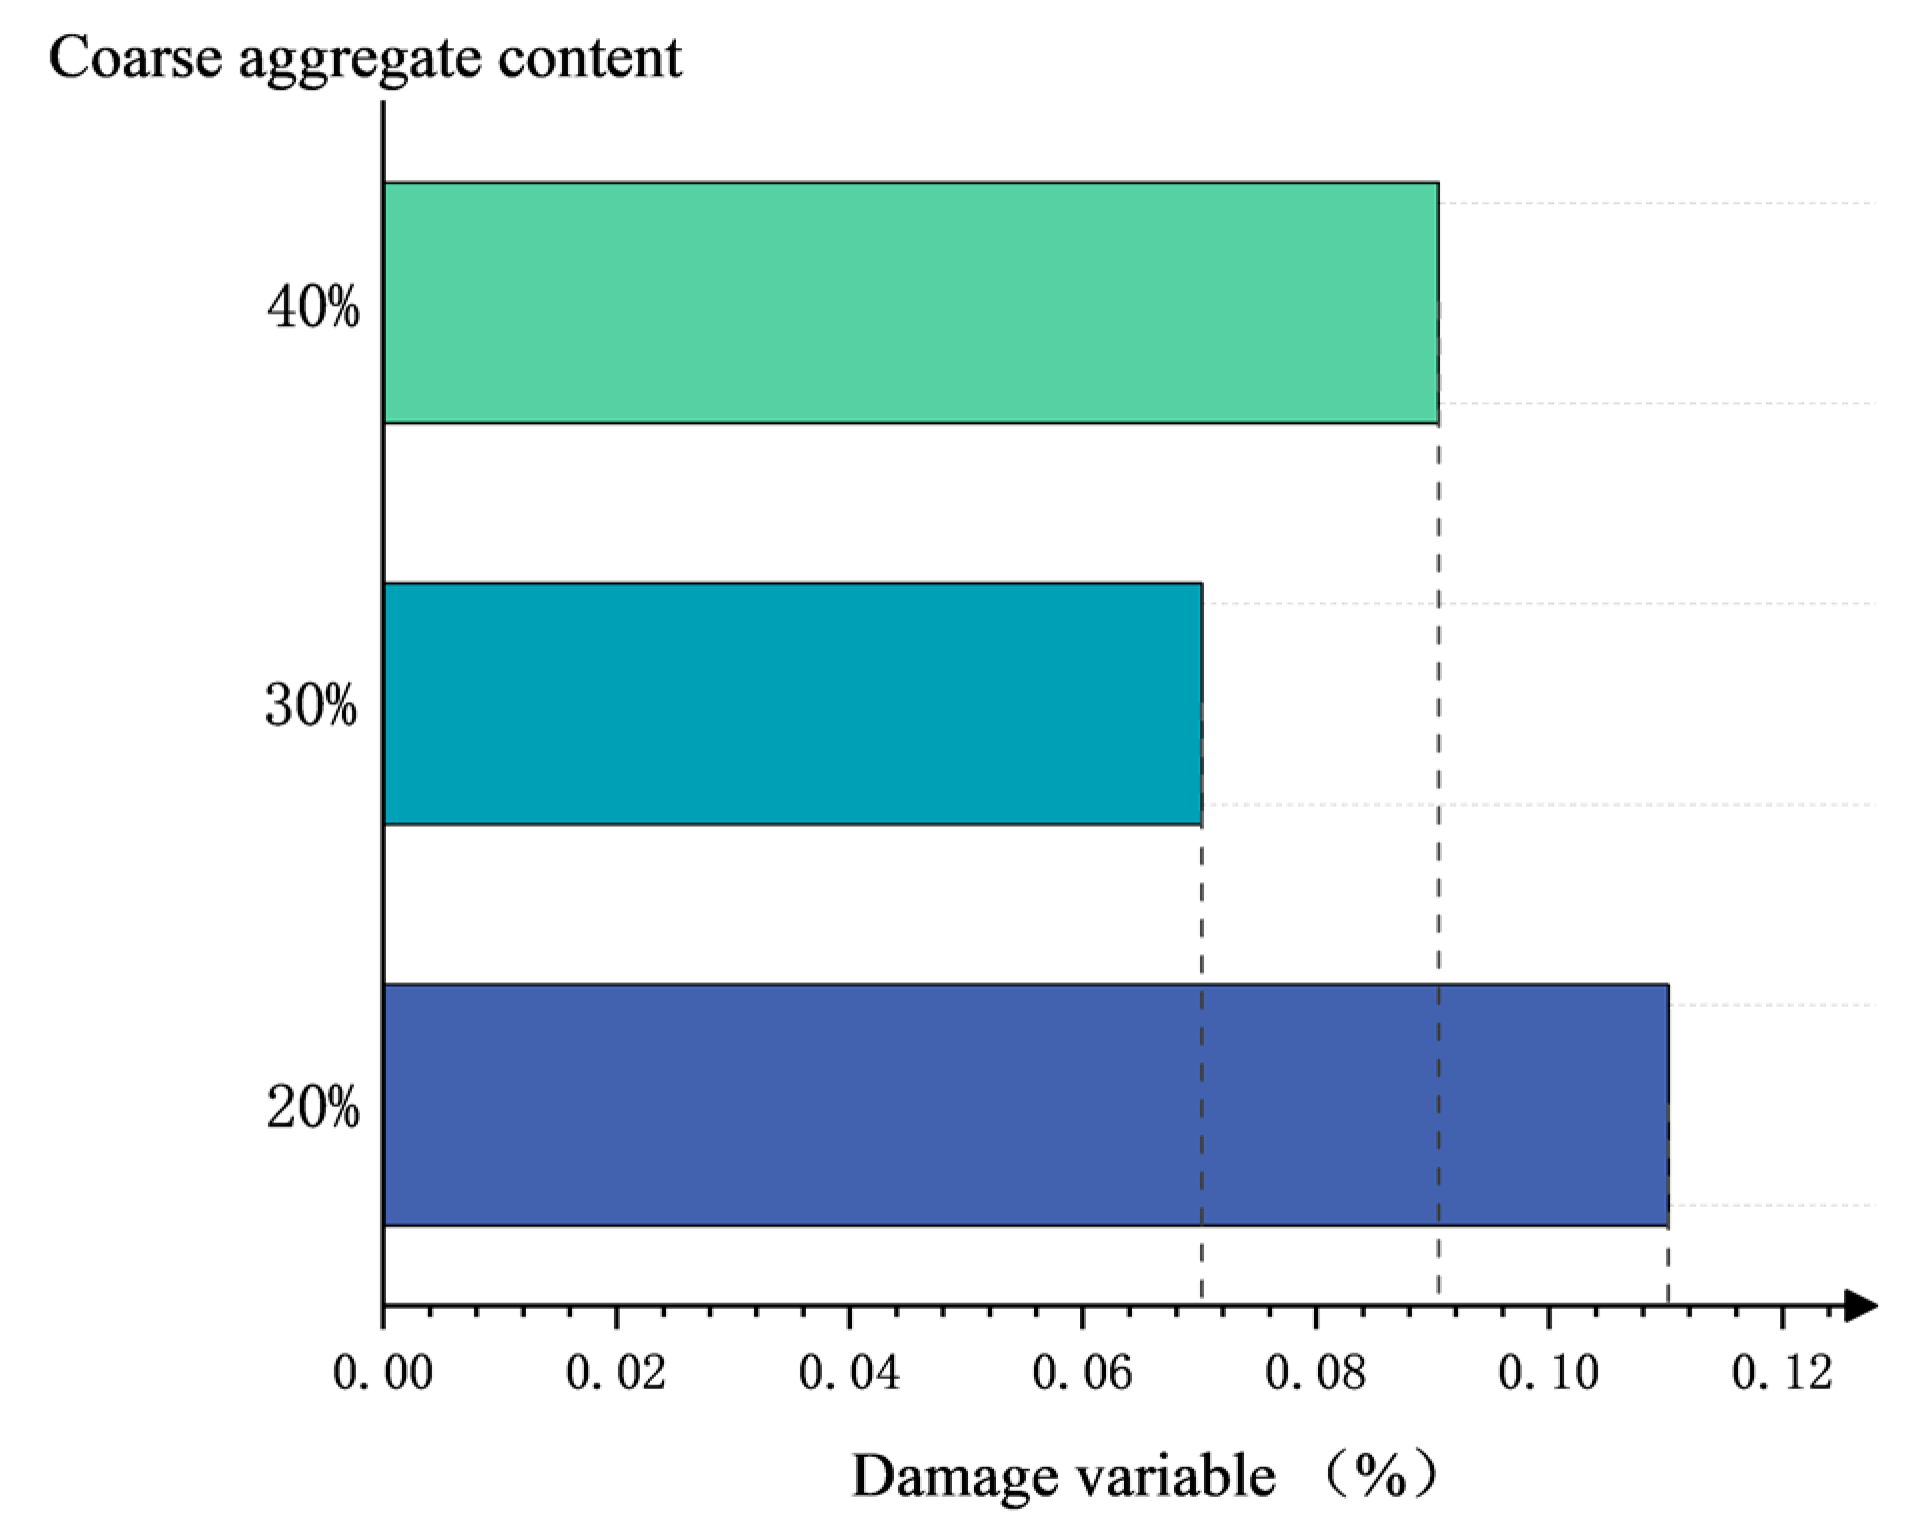
- Based on the crack ratio, the microscopic damage variable D is defined to quantify microscopic damage. The longer the fire exposure time, the greater the damage variable; under the same fire exposure time, the damage variable shows a descending trend with the increase in coarse aggregate content. Finally, the relationship between mesoscopic damage variable and the loss of compressive strength is established, which can be fitted with the exponential function. The change in macroscopic mechanical properties can be predicted by this function from the perspective of mesoscopic damage.
Author Contributions
Funding
Institutional Review Board Statement
Informed Consent Statement
Data Availability Statement
Conflicts of Interest
References
- Ministry of Transport of the People’s Republic of China. 2022 Statistical Bulletin on the Development of the Transportation Industry. Available online: https://xxgk.mot.gov.cn/2020/jigou/zhghs/202306/t20230615_3847023.html (accessed on 16 June 2023).
- Gong, J.F.; Wang, W.; Li, X.; Zhu, Y. Statistics of railway tunnels in China by the end of 2022 and overview of key tunnels of projects newly put into operation in 2022. Tunn. Constr. 2023, 43, 721–738. [Google Scholar]
- Othuman Mydin, M.A. Evaluation of the Mechanical Properties of Lightweight Foamed Concrete at Varying Elevated Temperatures. Fire 2023, 6, 53. [Google Scholar] [CrossRef]
- Saleheen, Z.; Krishnamoorthy, R.R.; Nadjai, A. A review on behavior, material properties and finite element simulation of concrete tunnel linings under fire. Tunn. Undergr. Space Technol. 2022, 126, 104534. [Google Scholar] [CrossRef]
- Gong, C.; Wang, Y.; Peng, Y.; Ding, W.; Lei, M.; Da, Z.; Shi, C. Three-dimensional coupled hydromechanical analysis of localized joint leakage in segmental tunnel linings. Tunn. Undergr. Space Technol. 2022, 130, 104726. [Google Scholar] [CrossRef]
- Guo, J.H.; Xi, B.P.; Tian, J.B.; Li, Z.; Zhang, X. Experimental research on mechanical property of tunnel concrete lining after high temperature of fire. Chin. J. Undergr. Space Eng. 2015, 11, 1316–1321+1338. [Google Scholar]
- Maluk, C.; Tignard, J.; Ridout, A.; Clarke, T.; Winterberg, R. Experimental study on the fire behaviour of fibre reinforced concrete used in tunnel applications. Fire Saf. J. 2021, 120, 103173. [Google Scholar] [CrossRef]
- Bensalem, H.; Djaknoun, S.; Ouedraogo, E.; Amrouche, R. Analysis of thermal-induced spalling tests on high to ultra-high performance concrete subjected to standard fire. Case Stud. Constr. Mater. 2021, 15, e00704. [Google Scholar] [CrossRef]
- Najm, H.M.; Nanayakkara, O.; Ahmad, M.; Sabri, M.M.S. Colour change of sustainable concrete containing waste ceramic and hybrid fibre: Effect of temperature. Materials 2022, 15, 2174. [Google Scholar] [CrossRef]
- Banerji, S.; Kodur, V.; Solhmirzaei, R. Experimental behavior of ultra high performance fiber reinforced concrete beams under fire conditions. Eng. Struct. 2020, 208, 110316. [Google Scholar] [CrossRef]
- Dong, Y.; Duan, J.; Zhang, D.; Liu, J.; Zhu, S.; Qi, J. Experimental research on fire resistance of the reduced scale immersed tunnel with fire in both traffic tubes. Tunn. Undergr. Space Technol. 2023, 132, 104922. [Google Scholar] [CrossRef]
- Yang, X.R. Experimental study on performance of lining concrete for subsea tunnel subjected to high temperature. J. Highw. Transp. Res. Dev. 2018, 35, 72–78. [Google Scholar]
- Alhawat, H.; Hamid, R.; Baharom, S.; Azmi, M.R.; Kaish, A.B.M.A. Assessing the quality of concrete tunnel lining exposed to tunnel fire through residual compressive strength. Adv. Civ. Eng. 2023, 2023, 9735496. [Google Scholar] [CrossRef]
- Homel, M.A.; Iyer, J.; Semnani, S.J.; Herbold, E.B. Mesoscale model and X-ray computed micro-tomographic imaging of damage progression in ultra-high-performance concrete. Cem. Concr. Res. 2022, 157, 106799. [Google Scholar] [CrossRef]
- Sun, Q.; Martin, B.; Williams, B.; Heard, W.; Frew, D.; Nie, X. Comparative study on the impact-induced microstructural damage in concrete using X-ray computed micro-tomography. Mech. Mater. 2022, 168, 104277. [Google Scholar] [CrossRef]
- Lublóy, É.; Balázs, G.L.; Kapitány, K.; Barsi, A.; Ingason, H.; Lee, C.; Lee, S.; Ko, K.; Yang, J.-M.; Soutsos, M.; et al. CT analysis of core samples from fire-damaged concrete structures. Mag. Concr. Res. 2017, 69, 802–810. [Google Scholar] [CrossRef]
- Yang, Z.; Wang, L. Fractal analysis of tunnel structural damage caused by high-temperature and explosion impact. Buildings 2022, 12, 1410. [Google Scholar] [CrossRef]
- Henry, M.; Darma, I.S.; Sugiyama, T. Analysis of the effect of heating and re-curing on the microstructure of high-strength concrete using X-ray CT. Constr. Build. Mater. 2014, 67, 37–46. [Google Scholar] [CrossRef]
- Naderi, S.; Tu, W.L.; Zhang, M.Z. Meso-scale modelling of compressive fracture in concrete with irregularly shaped aggregates. Cem. Concr. Res. 2021, 140, 106317. [Google Scholar] [CrossRef]
- GB/T 50081-2019; Standard for Test Methods of Concrete Physical and Mechanical Properties. MOHURD: Beijing, China, 2019.
- ISO 834-1; Fire-Resistance Tests—Elements of Building Construction—Part 1: General Requirements. International Organization for Standardization: Geneva, Switzerland, 1999.
- Meddah, M.S.; Zitouni, S.; Belâabes, S. Effect of content and particle size distribution of coarse aggregate on the compressive strength of concrete. Constr. Build. Mater. 2010, 24, 505–512. [Google Scholar] [CrossRef]
- Peng, L.M.; Liu, X.B.; Du, S.C. Experimental research on the degree of damage to the strength of tunnel lining at different levels of combustion temperature. J. China Railw. Soc. 1997, 19, 87–94. [Google Scholar]
- Saha, A.K.; Sarker, P.K.; Golovanevskiy, V. Thermal properties and residual strength after high temperature exposure of cement mortar using ferronickel slag aggregate. Constr. Build. Mater. 2019, 199, 601–612. [Google Scholar] [CrossRef]
- Tantawy, M.A. Effect of high temperatures on the microstructure of cement paste. J. Mater. Sci. Chem. Eng. 2017, 5, 601–612. [Google Scholar] [CrossRef]
- Both, C.; Wolsink, G.M.; Breunese, A.J. Spalling of concrete tunnel linings in fire. In Proceedings of the ITA World Tunnel Congress 2003, Amsterdam, The Netherlands, 12–17 April 2003; pp. 227–231. [Google Scholar]
- Krajcinovic, D.; Lemaitre, J. Continuum Damage Mechanics Theory and Applications; Springer: New York, NY, USA, 1987; pp. 233–294. [Google Scholar]
- Obara, Y.; Tanikura, I.; Jung, J.; Shintani, R.; Watanabe, S. Evaluation of micro-damage of concrete specimens under cyclic uniaxial loading by X-ray CT method. J. Adv. Concr. Technol. 2016, 14, 433–443. [Google Scholar] [CrossRef]
- Zhong, M. Simplified method for analysis of damage characteristic of RC columns under and after low cyclic loading. China Civ. Eng. J. 2016, 49, 84–91. [Google Scholar]
- Suzuki, T.; Shiotani, T.; Ohtsu, M. Evaluation of cracking damage in freeze-thawed concrete using acoustic emission and X-ray CT image. Constr. Build. Mater. 2017, 136, 619–626. [Google Scholar] [CrossRef]
- Tian, W.; Han, N. Evaluation of meso-damage processes in concrete by X-Ray CT scanning techniques under real-time uniaxial compression testing. J. Nondestruct. Eval. 2019, 38, 1–12. [Google Scholar] [CrossRef]
- Koenig, A. Analysis of air voids in cementitious materials using micro X-ray computed tomography (µXCT). Constr. Build. Mater. 2020, 244, 118313. [Google Scholar] [CrossRef]
- Dang, F.N.; Yin, X.T.; Ding, W.H.; Yang, H.X. Subarea breakage constitutive model of rock mass based on CT test. Chin. J. Rock Mech. Eng. 2005, 22, 4003–4009. [Google Scholar]
- Lu, Z.H.; Chen, Z.H.; Pu, Y.B. A CT study on the crack evolution of expansive soil during drying and wetting cycles. Rock Soil Mech. 2002, 04, 417–422. [Google Scholar]


| Coarse Aggregate | Water–Binder Ratio | Water | Cement | Fly Ash | Slag | Big Gravel | Small Gravel | River Sand | Superplasticizer |
|---|---|---|---|---|---|---|---|---|---|
| 40% | 0.35 | 147 | 189 | 105 | 126 | 733 | 314 | 775 | 4.2 |
| 30% | 0.35 | 228 | 292 | 163 | 195 | 563 | 242 | 606 | 0.4 |
| 20% | 0.35 | 318 | 408 | 227 | 272 | 375 | 161 | 404 | 0.16 |
| Purpose | Test Type | Fire Exposure Time/h | Load Ratio 1 | Coarse Aggregate Volume Fraction/% | Specimen Number | Total Number 2 |
|---|---|---|---|---|---|---|
| Mesoscopic observation | CT scan (before and after fire test) | 0 | None | 40 | WA (WAT) | 12 (including 6 temperature test specimens) |
| 0.5 | Yes | 40 | WA1 (WAT1) | |||
| 1 | WA2 (WAT2) | |||||
| 2 | WA3 (WAT3) | |||||
| 1 | 30 | WB (WBT) | ||||
| 20 | WC (WCT) | |||||
| Strength calibration | Static load test | / | None | 40 | WS1–WS3 WS1′–WS3′ | 18 (WS1′–WS9′ are used to obtain strength parameters before fire test) |
| 30 | WS4–WS6, WS4′–WS6′ | |||||
| 20 | WS7–WS9, WS7′–WS9′ | |||||
| Influence of fire and mesoscopic components | Fire test | 0.5 | Yes | 40 | WA1 | 5 |
| 1 | WA2 | |||||
| 2 | WA3 | |||||
| 1 | 30 | WB | ||||
| 20 | WC | |||||
| Mechanical performance test after fire | Static load test | 0 | Yes | 40 | WA | 6 |
| 0.5 | WA1 | |||||
| 1 | WA2 | |||||
| 2 | WA3 | |||||
| 1 | 30 | WB | ||||
| 20 | WC |
| Coarse Aggregate Content/% | Compressive Strength/MPa |
|---|---|
| 20 | 57.16 |
| 30 | 58.01 |
| 40 | 61.72 |
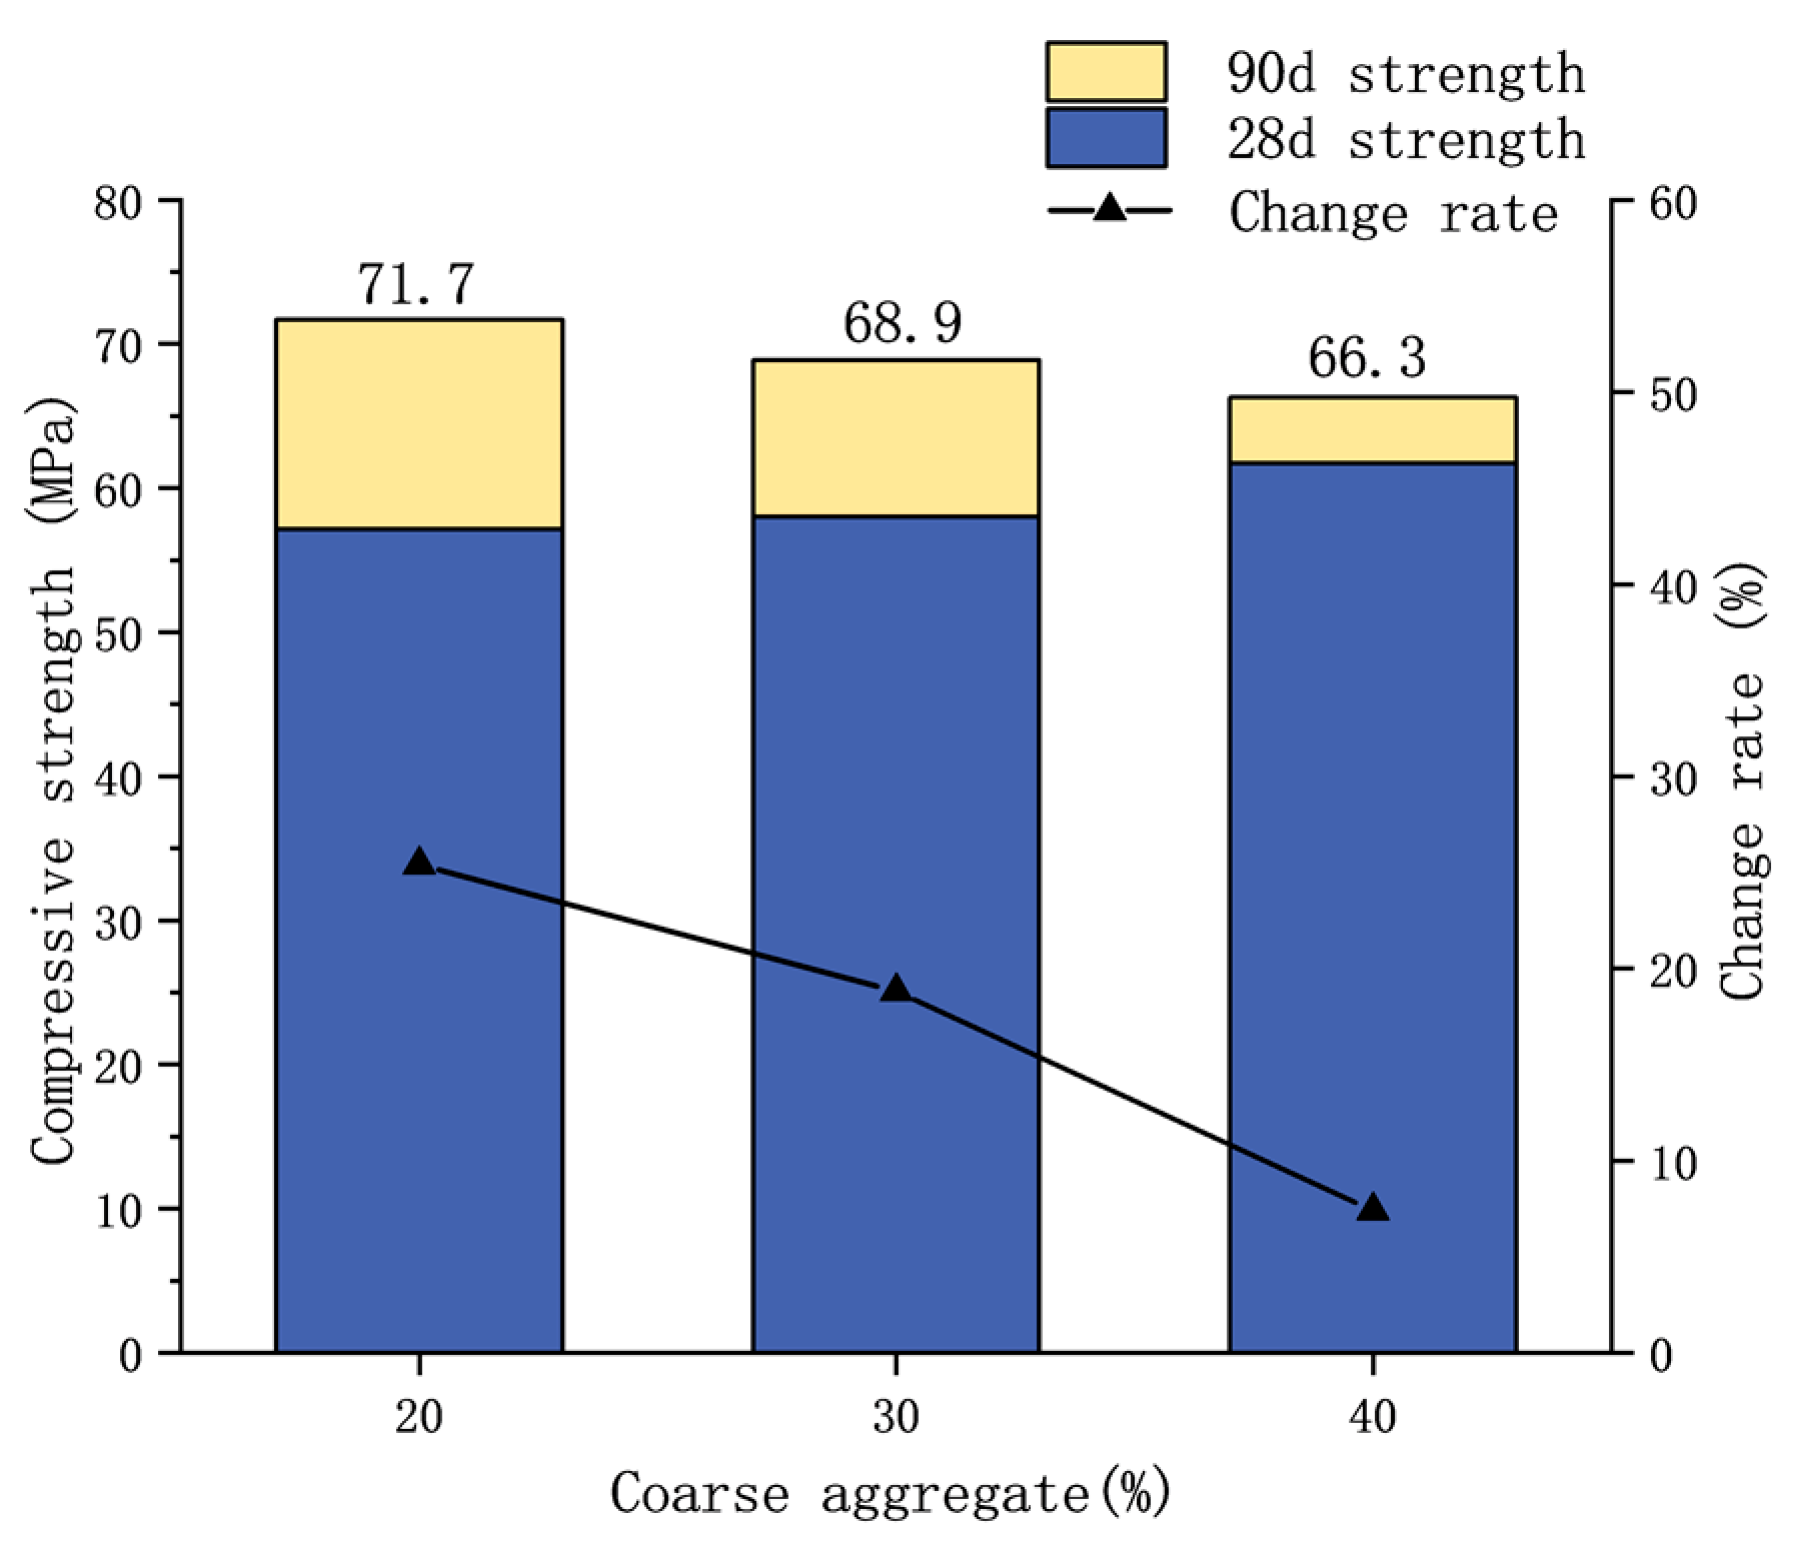
| Type | 28-Day Strength/MPa | 90-Day Strength/MPa | Rate of Change/% |
|---|---|---|---|
| 40% coarse aggregate | 61.72 | 66.3 | 7.4 |
| 30% coarse aggregate | 58.01 | 68.9 | 18.8 |
| 20% coarse aggregate | 57.16 | 71.7 | 25.4 |
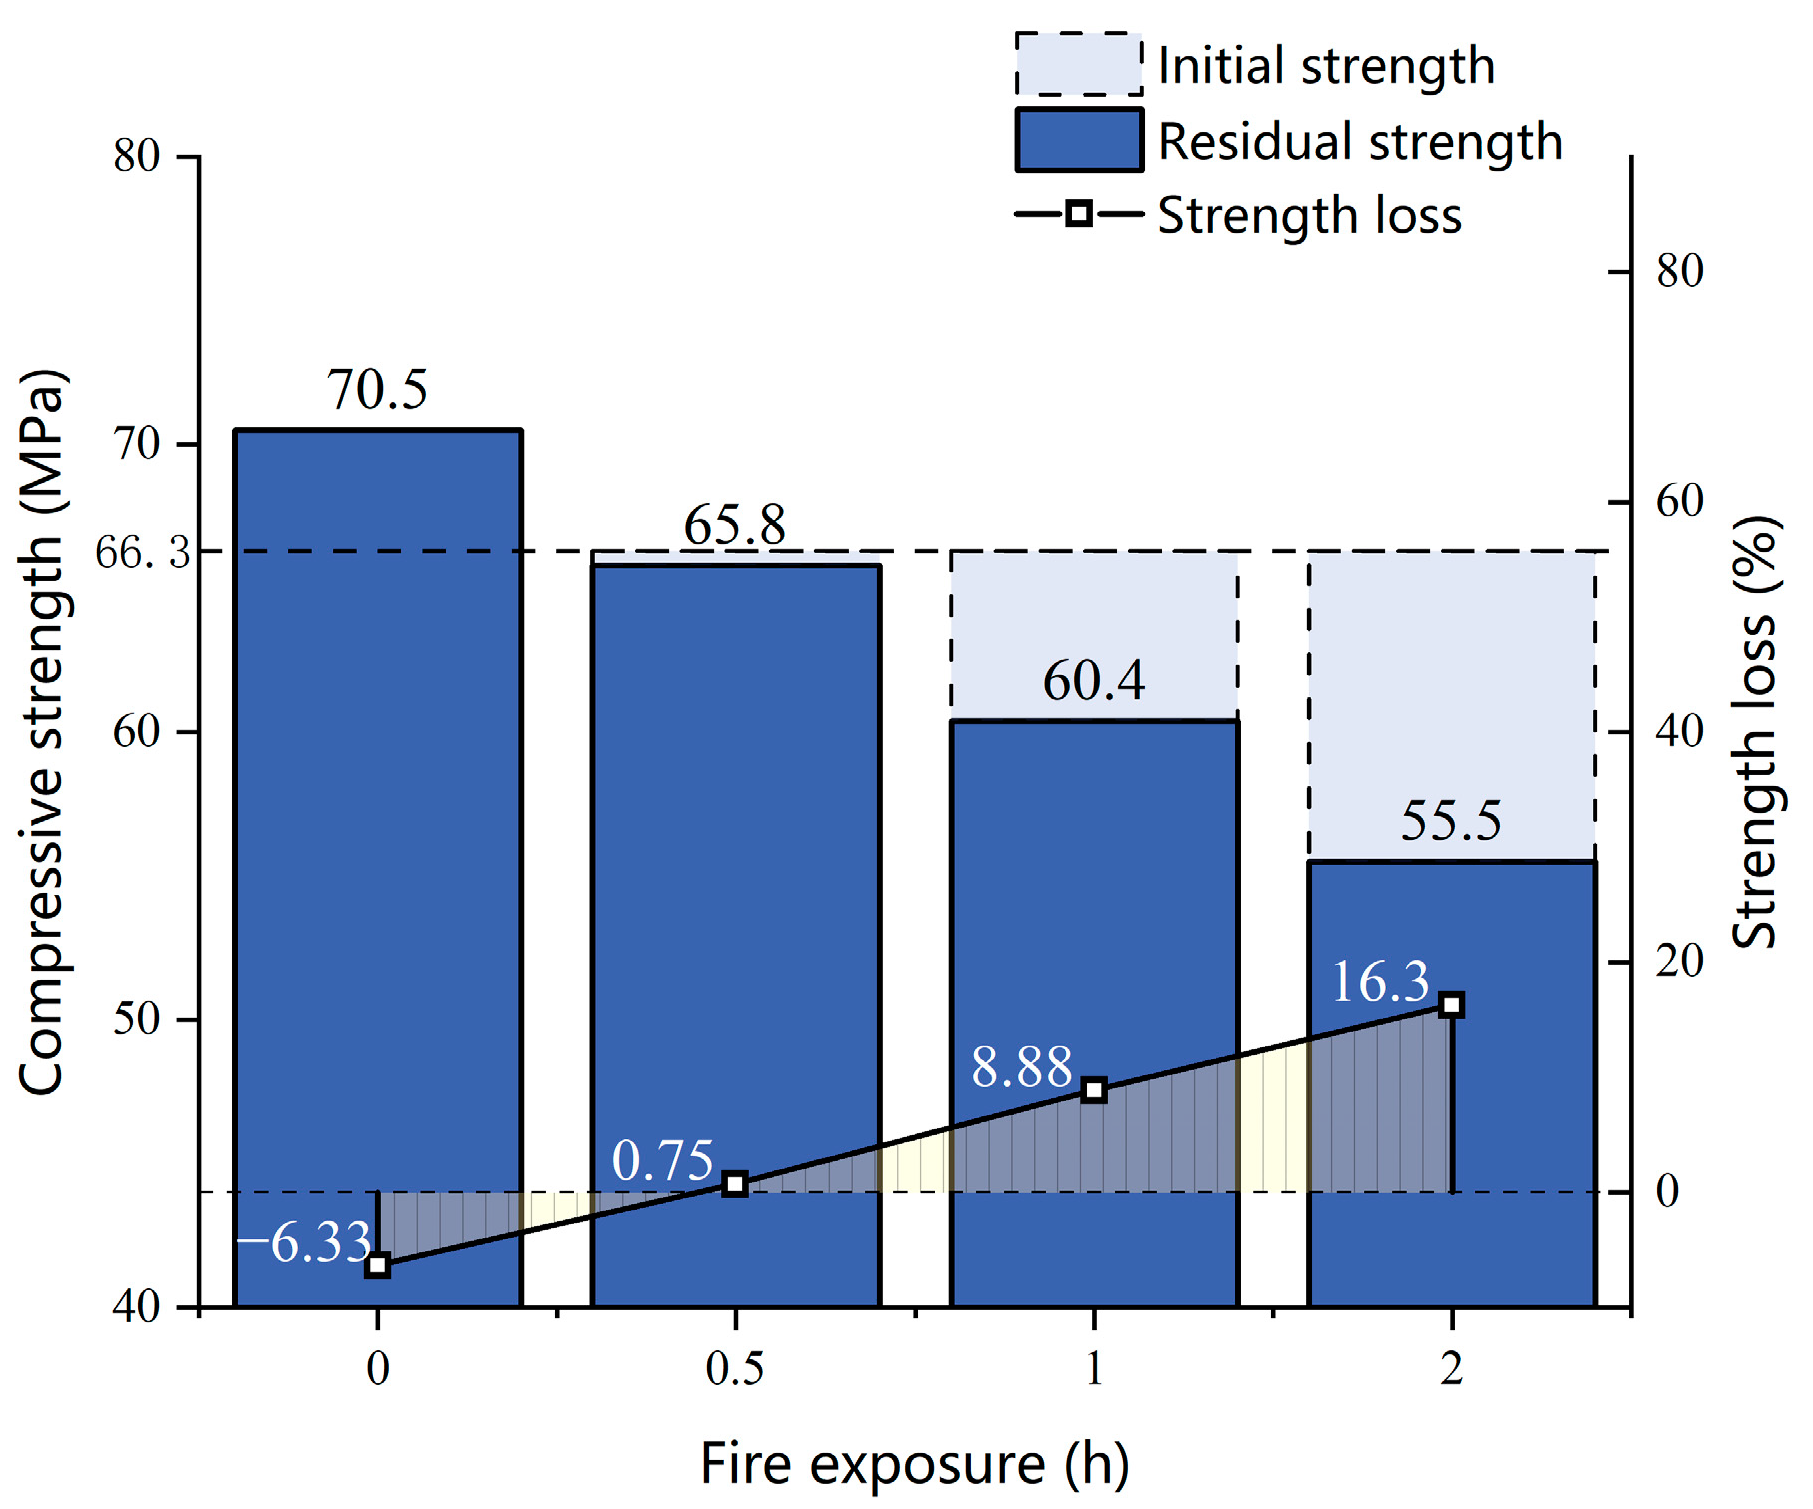
| Name | Compressive Strength σ0/MPa | Residual Strength σs/MPa | Strength Loss f/% |
|---|---|---|---|
| WA | 66.3 | 70.5 | −6.33 |
| WA1 | 66.3 | 65.8 | 0.75 |
| WA2 | 66.3 | 60.41 | 8.88 |
| WA3 | 66.3 | 55.5 | 16.3 |
| WB | 68.9 | 63.1 | 8.42 |
| WC | 71.7 | 62.36 | 13.03 |
| Name | Crack Ratio before Test/% | Crack Ratio after Test/% | Damage Variable/% |
|---|---|---|---|
| WA | 0.67 | 0.58 | −0.0906 |
| WA1 | 0.64 | 0.68 | 0.0403 |
| WA2 | 0.63 | 0.72 | 0.0905 |
| WA3 | 0.67 | 0.81 | 0.1409 |
| WB | 0.24 | 0.31 | 0.0702 |
| WC | 0.22 | 0.33 | 0.1102 |
Disclaimer/Publisher’s Note: The statements, opinions and data contained in all publications are solely those of the individual author(s) and contributor(s) and not of MDPI and/or the editor(s). MDPI and/or the editor(s) disclaim responsibility for any injury to people or property resulting from any ideas, methods, instructions or products referred to in the content. |
© 2024 by the authors. Licensee MDPI, Basel, Switzerland. This article is an open access article distributed under the terms and conditions of the Creative Commons Attribution (CC BY) license (https://creativecommons.org/licenses/by/4.0/).
Share and Cite
Zheng, X.; Wang, W.; Zhang, Y.; Qi, J.; Yao, X. Macro–Meso Damage Analysis of Tunnel Lining Concrete under Thermal–Mechanical Coupling Based on CT Images. Materials 2024, 17, 253. https://doi.org/10.3390/ma17010253
Zheng X, Wang W, Zhang Y, Qi J, Yao X. Macro–Meso Damage Analysis of Tunnel Lining Concrete under Thermal–Mechanical Coupling Based on CT Images. Materials. 2024; 17(1):253. https://doi.org/10.3390/ma17010253
Chicago/Turabian StyleZheng, Xudong, Wei Wang, Yanfei Zhang, Jinhui Qi, and Xuedan Yao. 2024. "Macro–Meso Damage Analysis of Tunnel Lining Concrete under Thermal–Mechanical Coupling Based on CT Images" Materials 17, no. 1: 253. https://doi.org/10.3390/ma17010253