

Gas-Sensing Properties and Mechanisms of 3D Networks Composed of ZnO Tetrapod Micro-Nano Structures at Room Temperature

 ,
,  ,
,
Abstract
:1. Introduction
2. Experimental Section
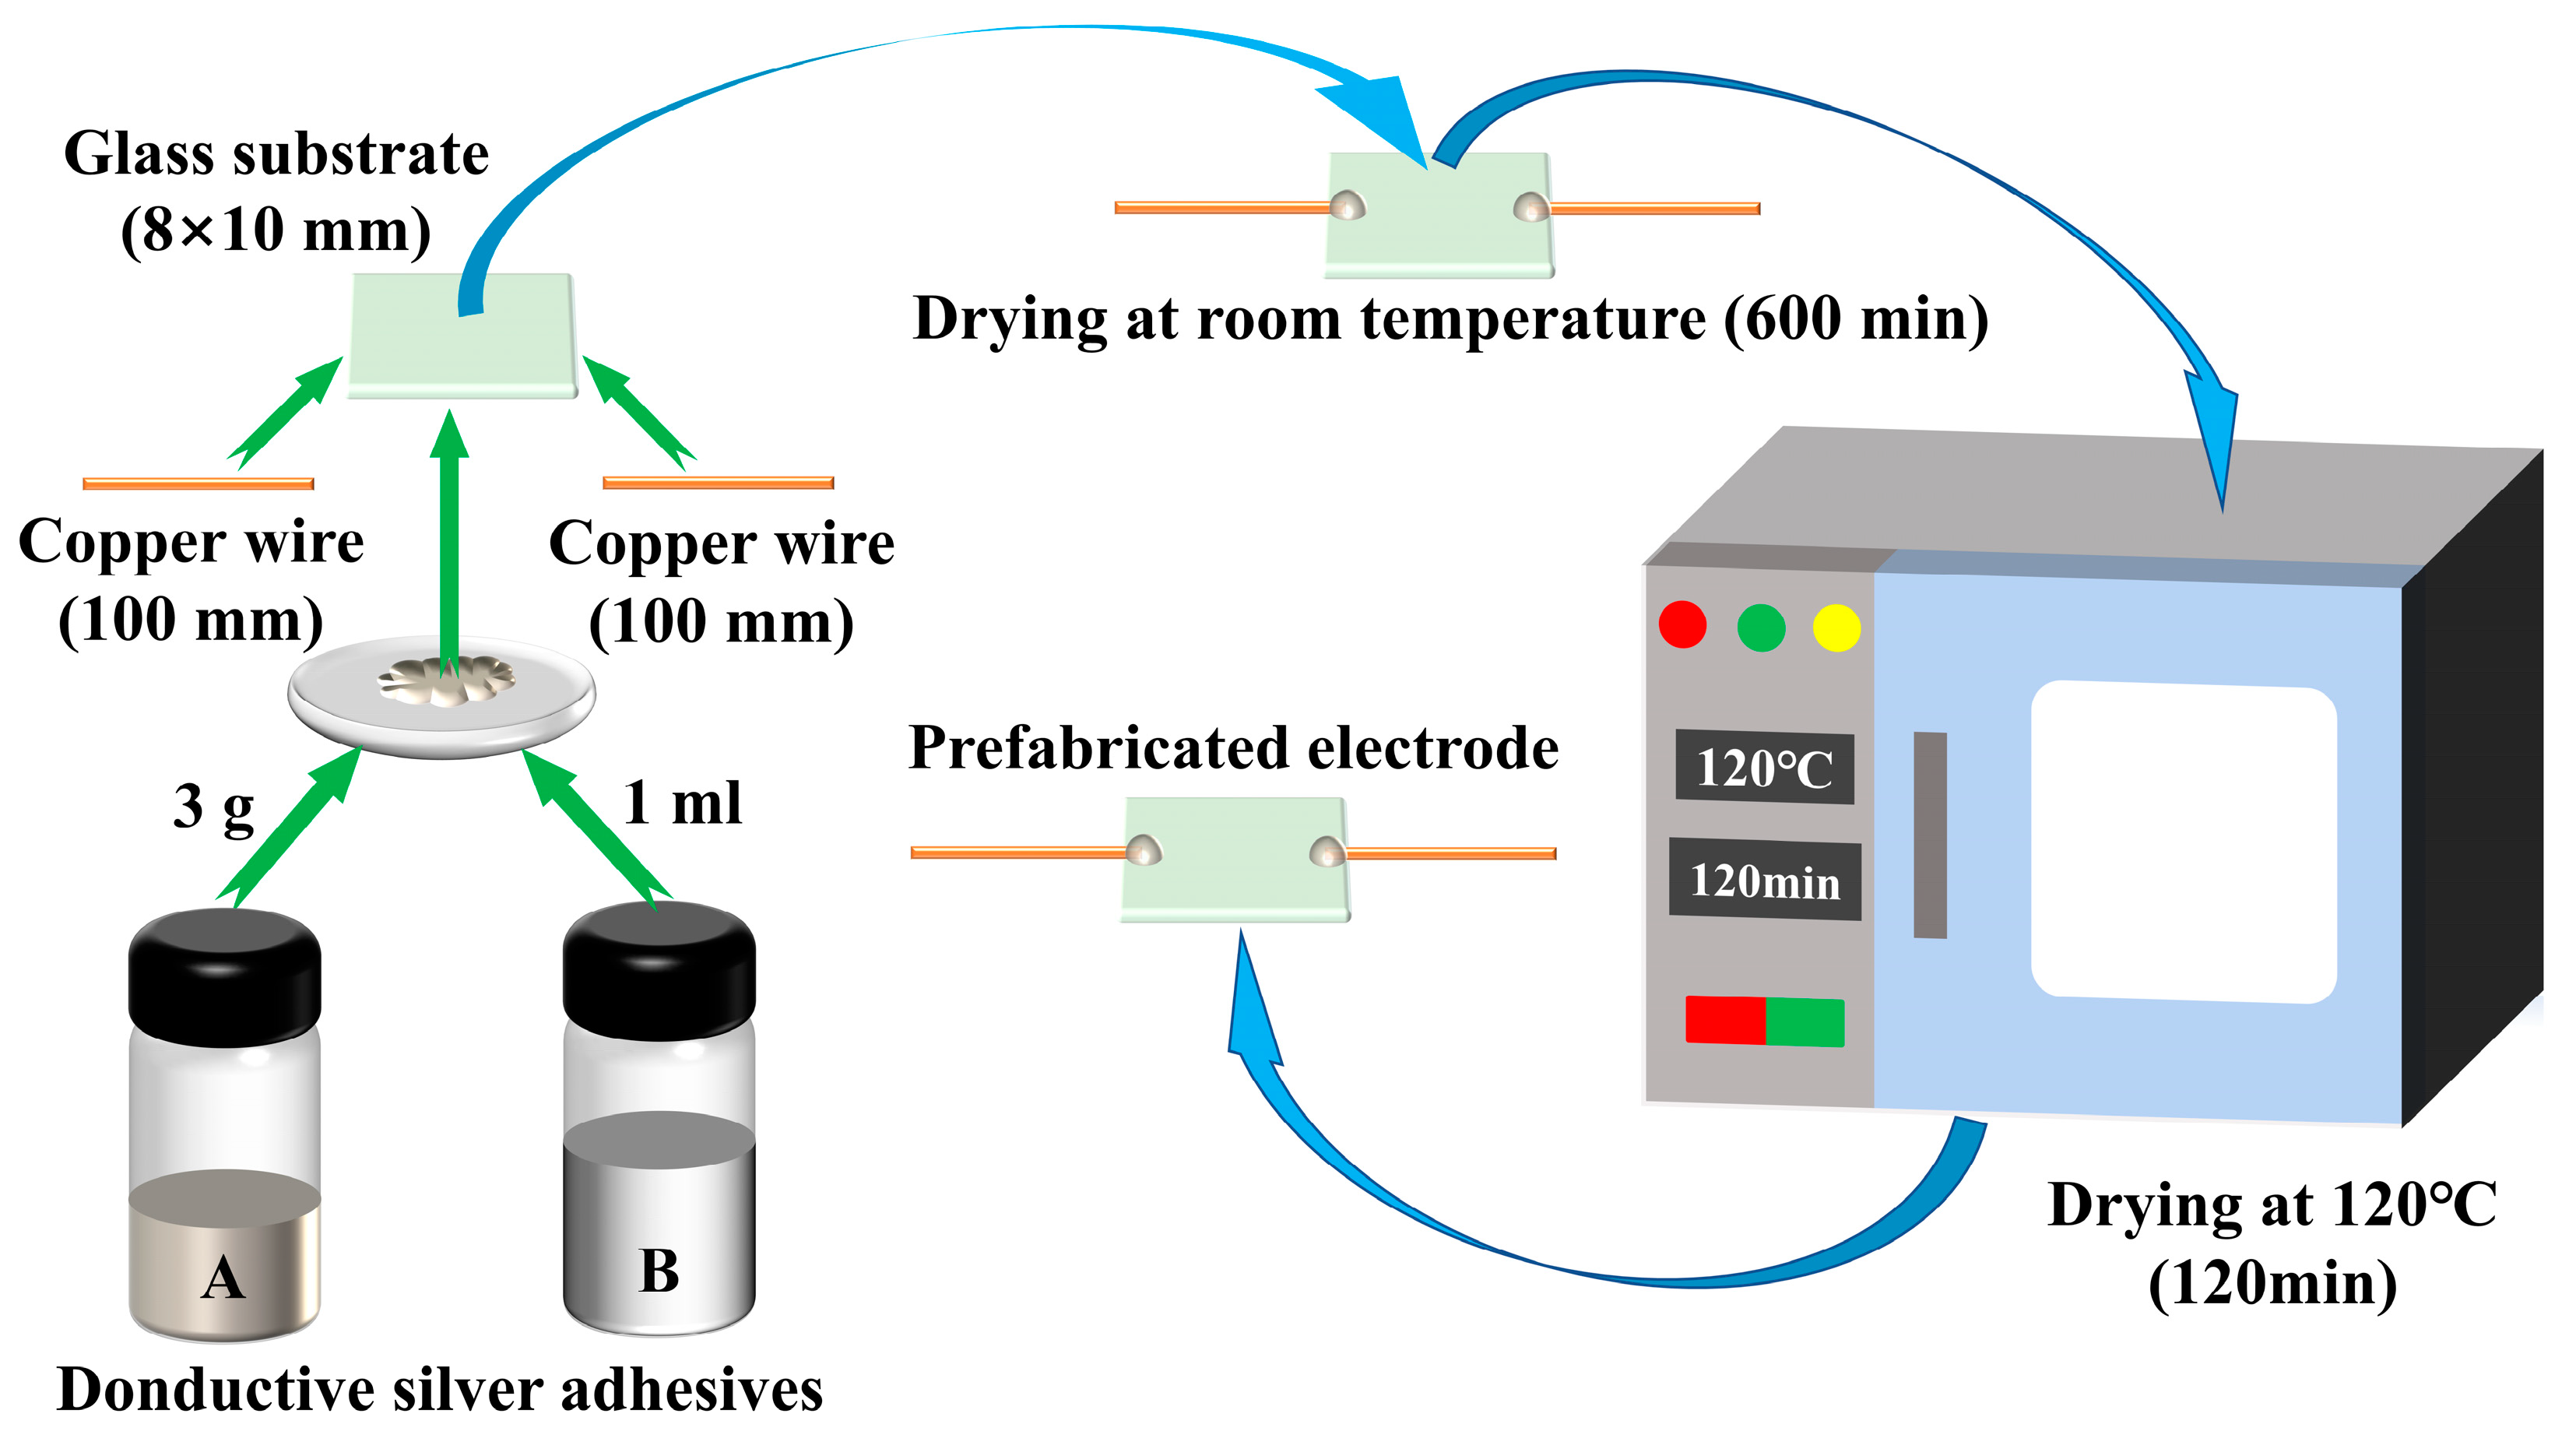
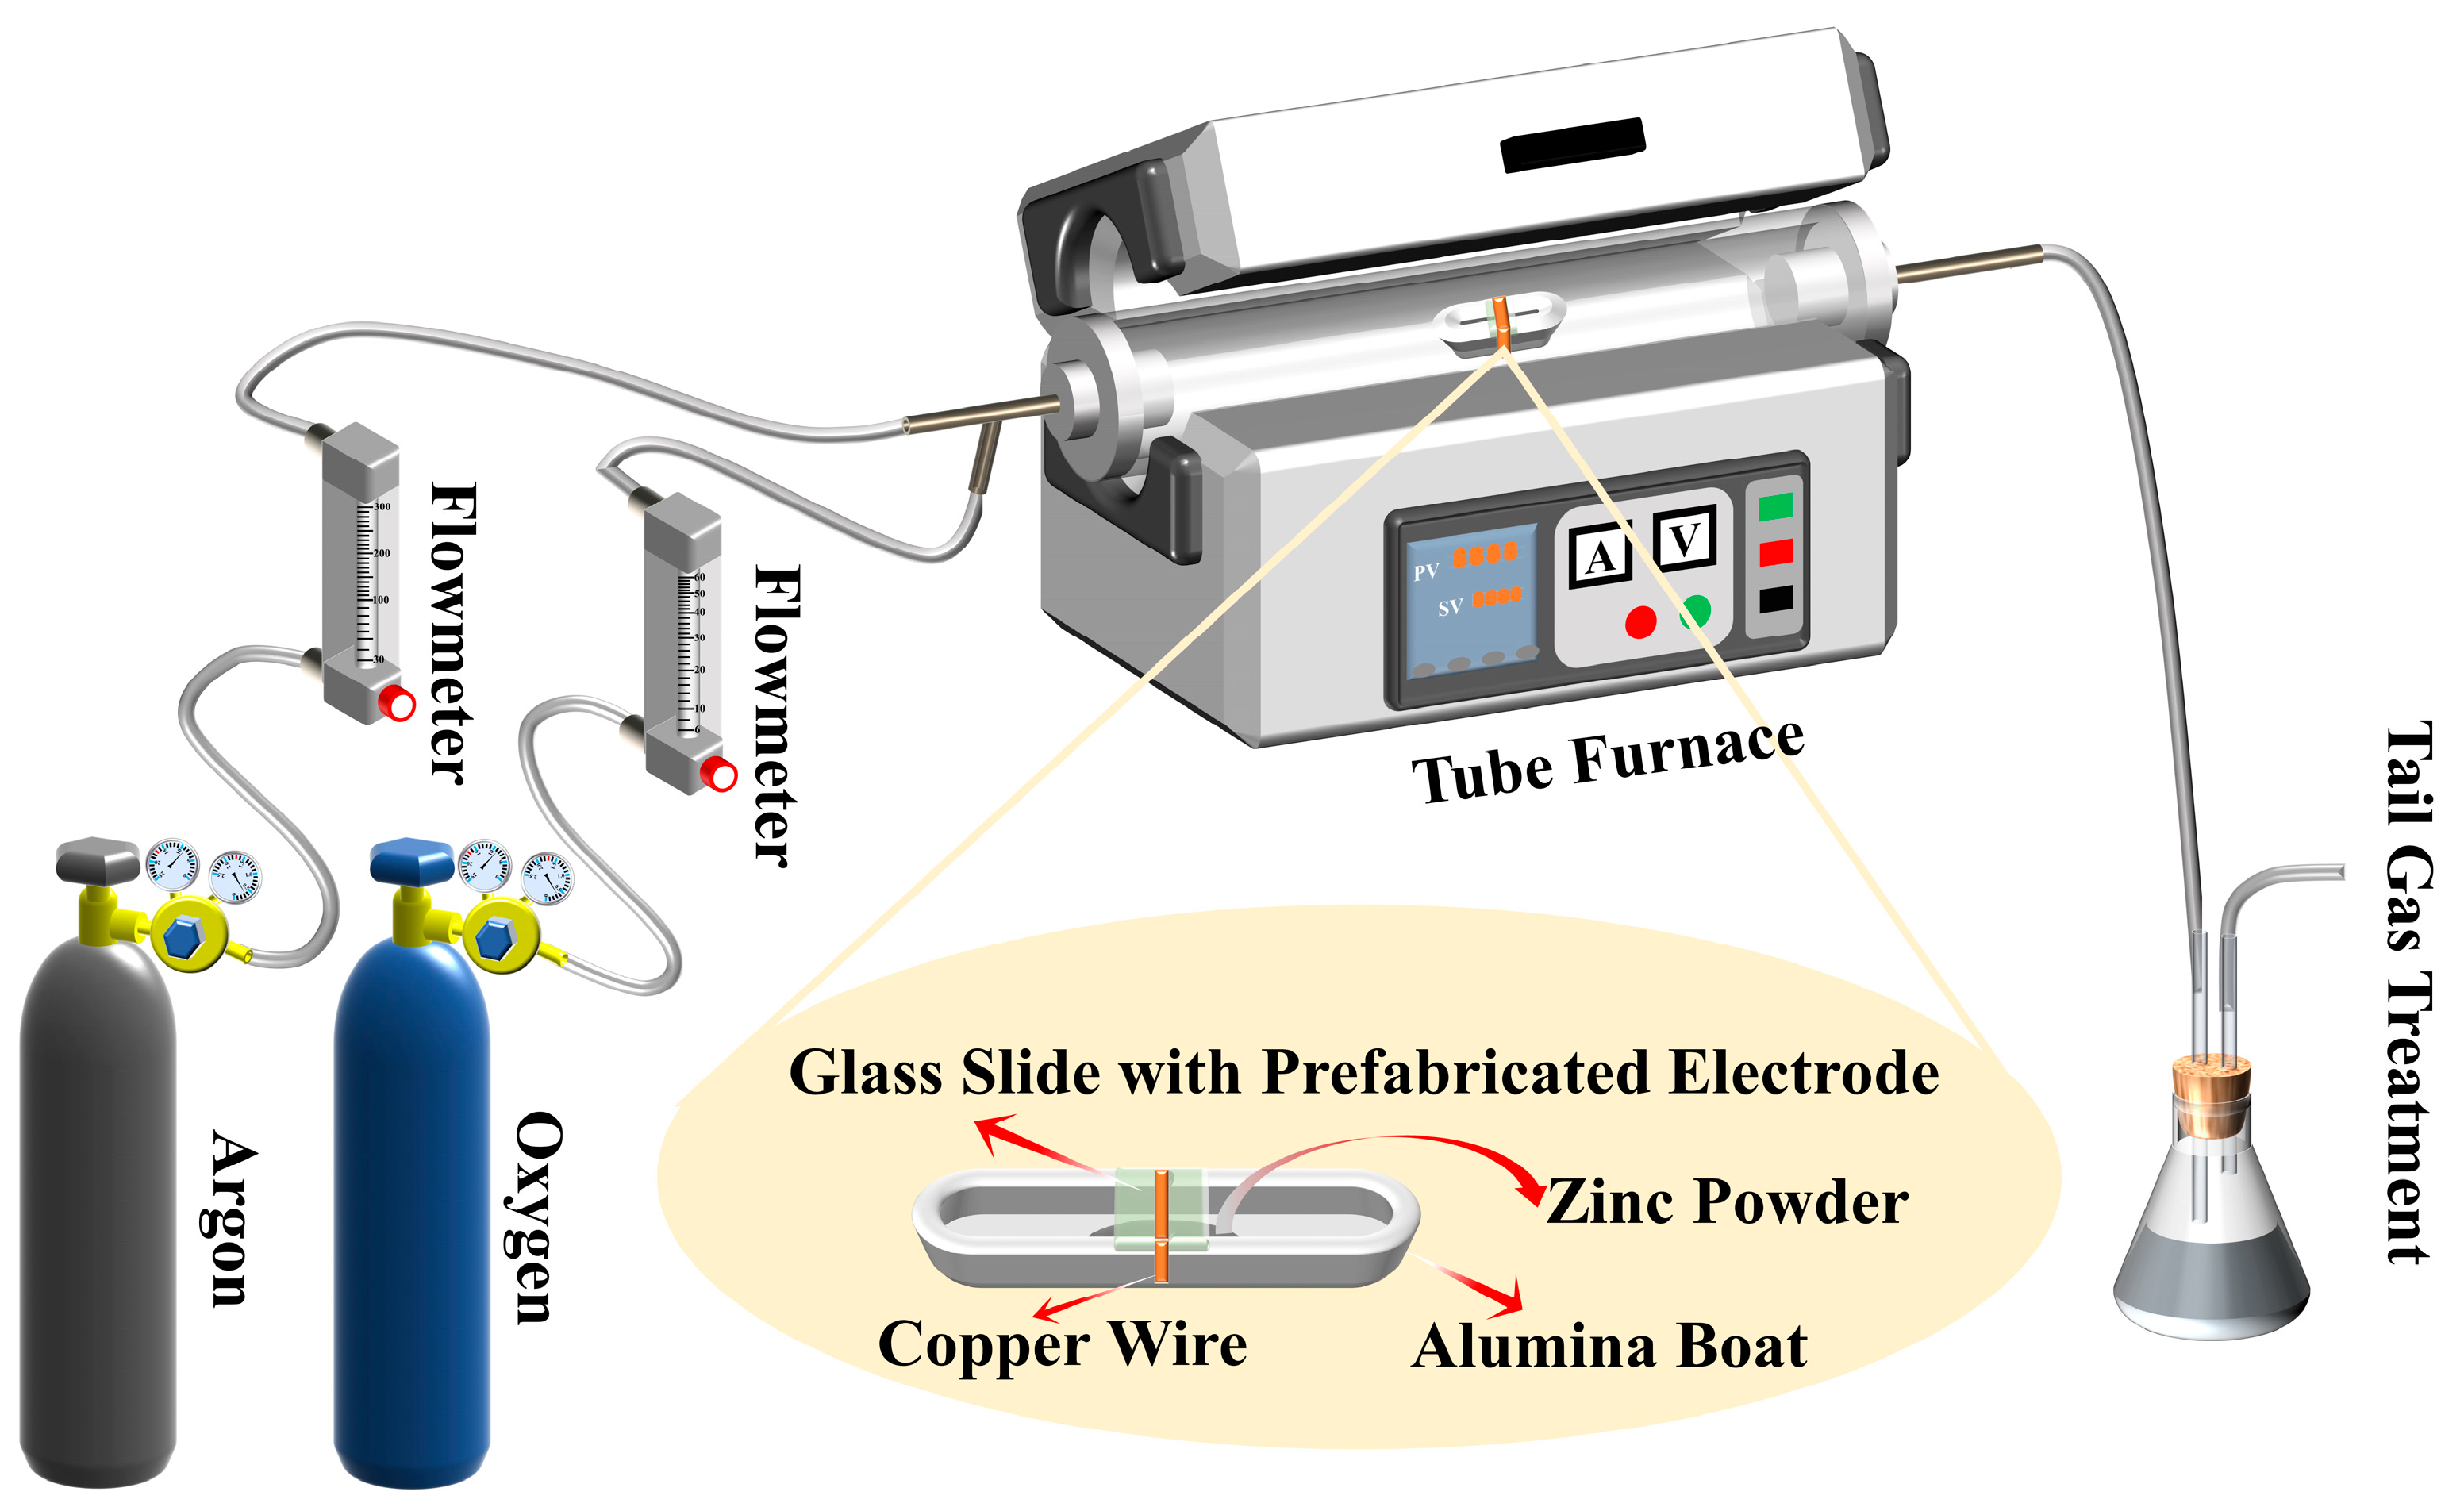
2.1. Synthesis Process
2.2. Characterization
2.3. Gas-Sensing Measurements
3. Results and Discussion
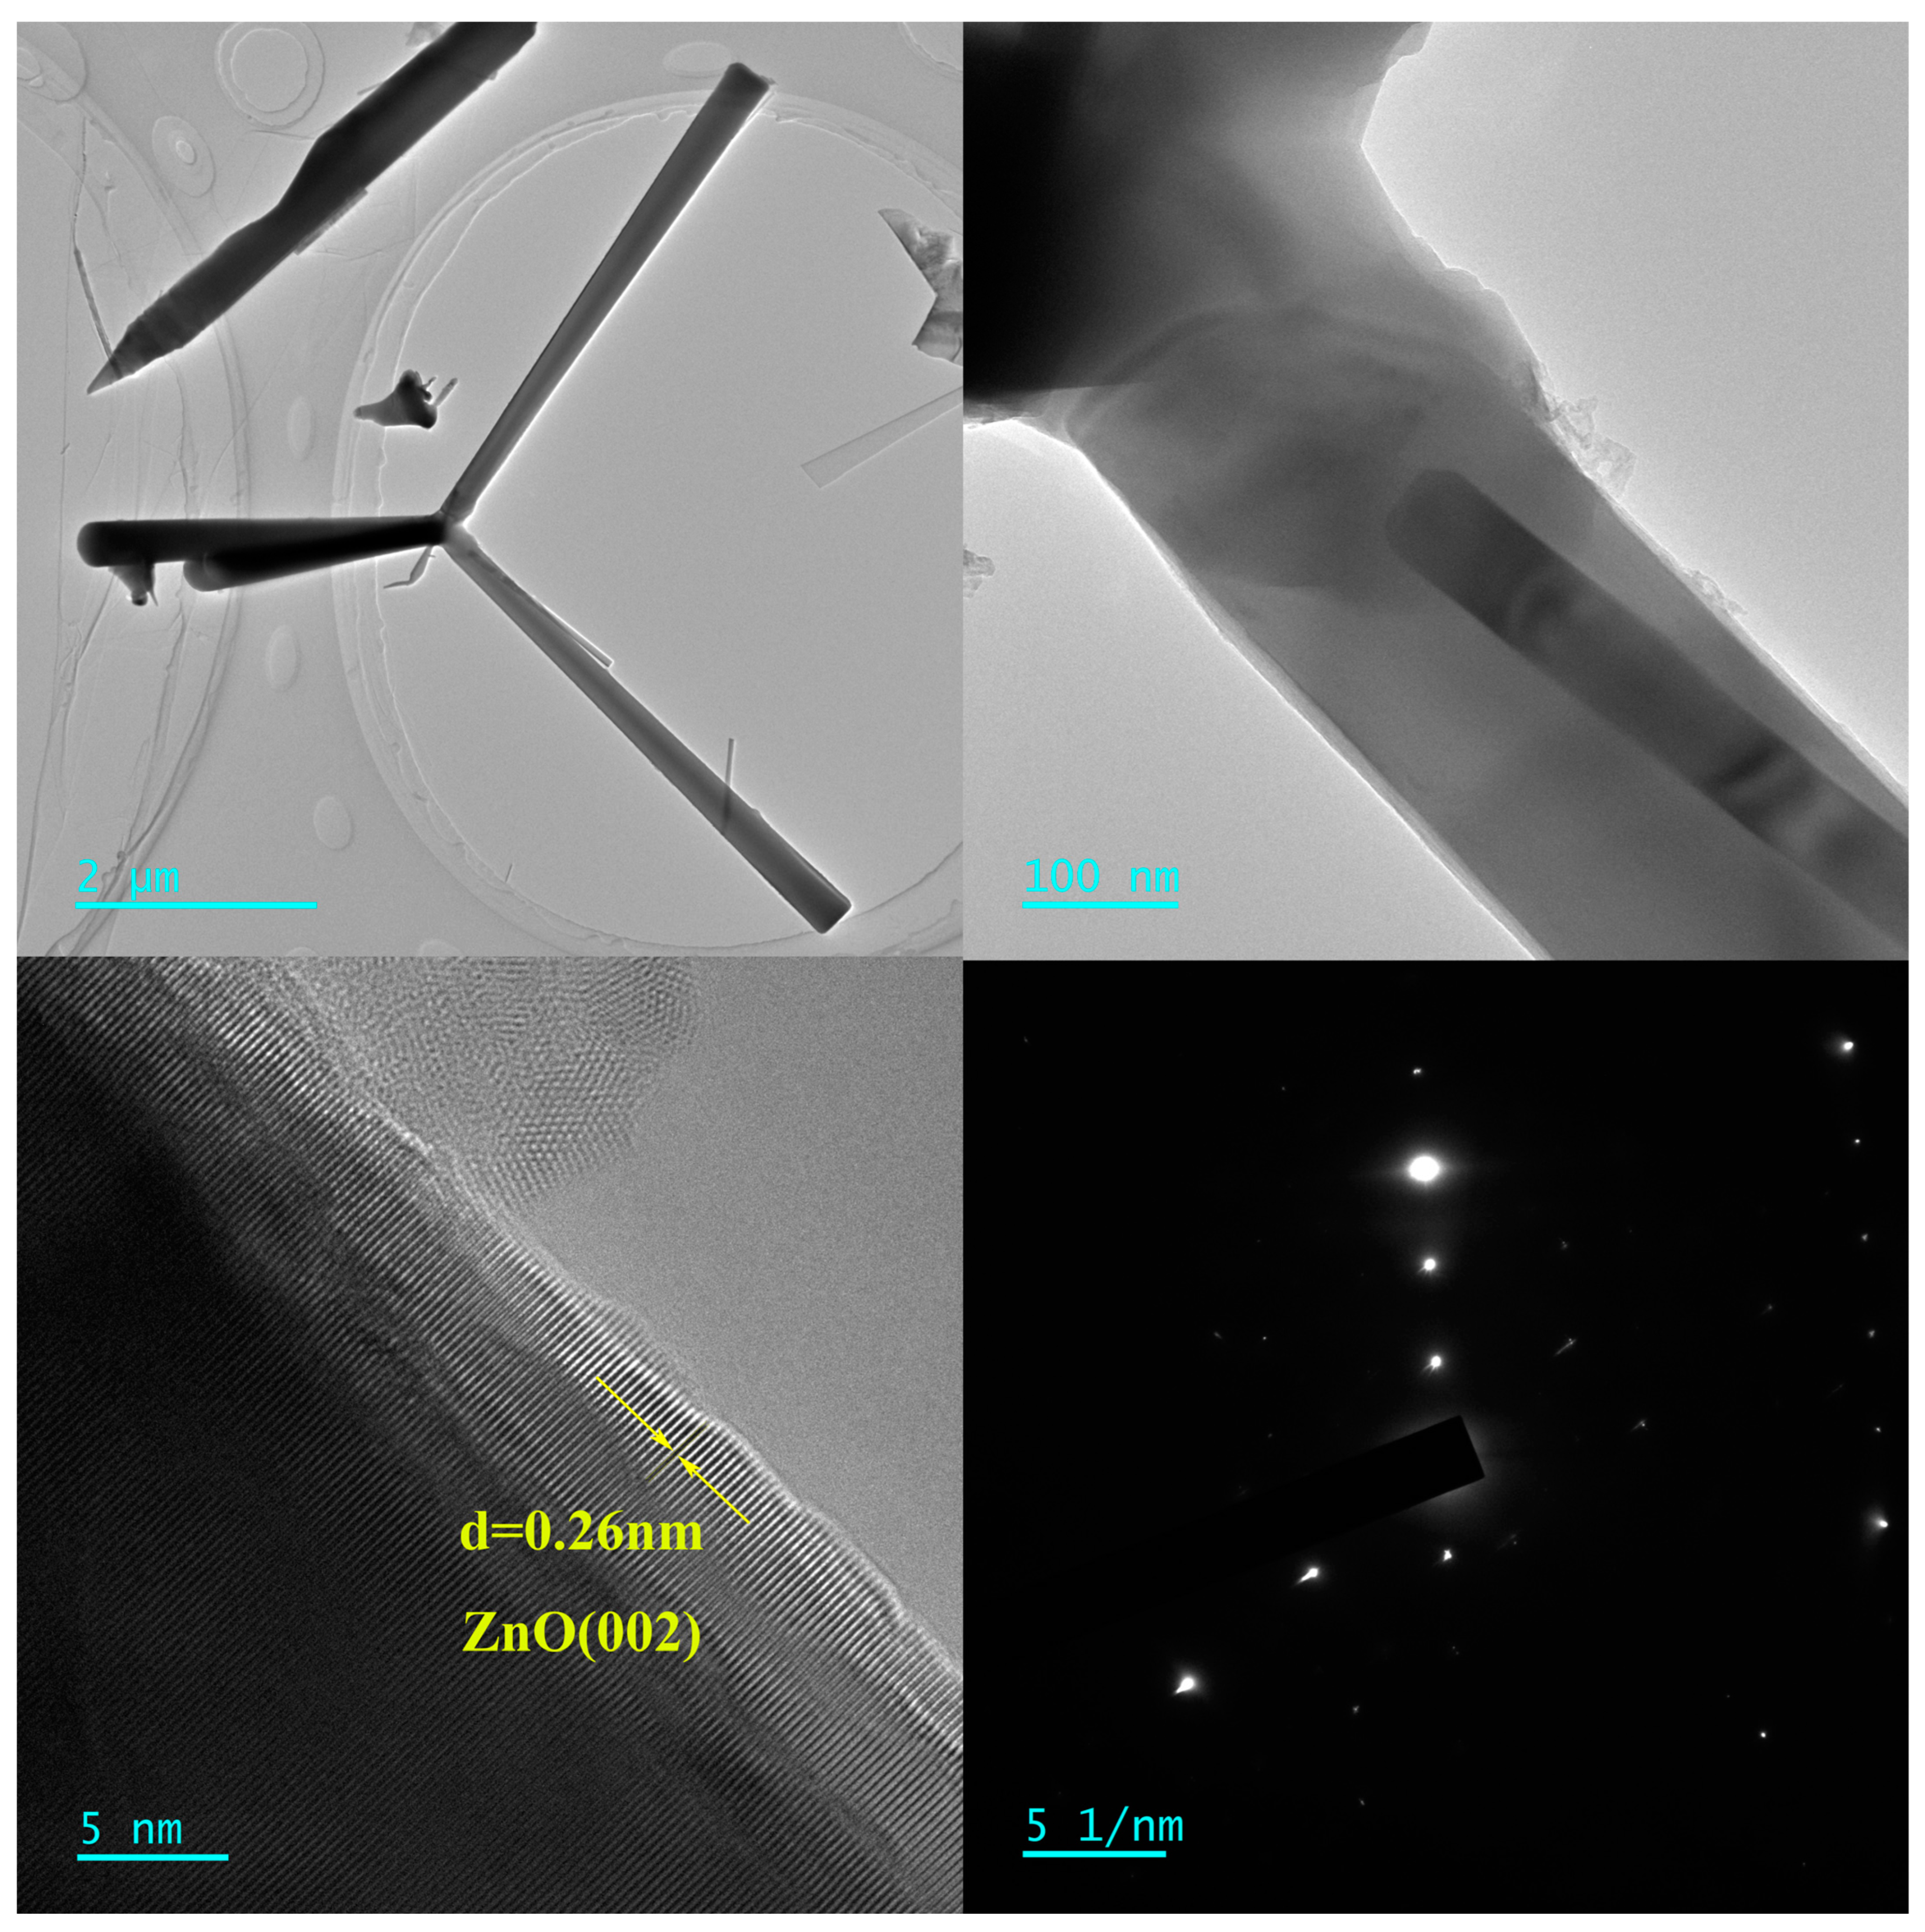
3.1. Morphology and Structure of the Thin Film
3.2. FTIR Analysis
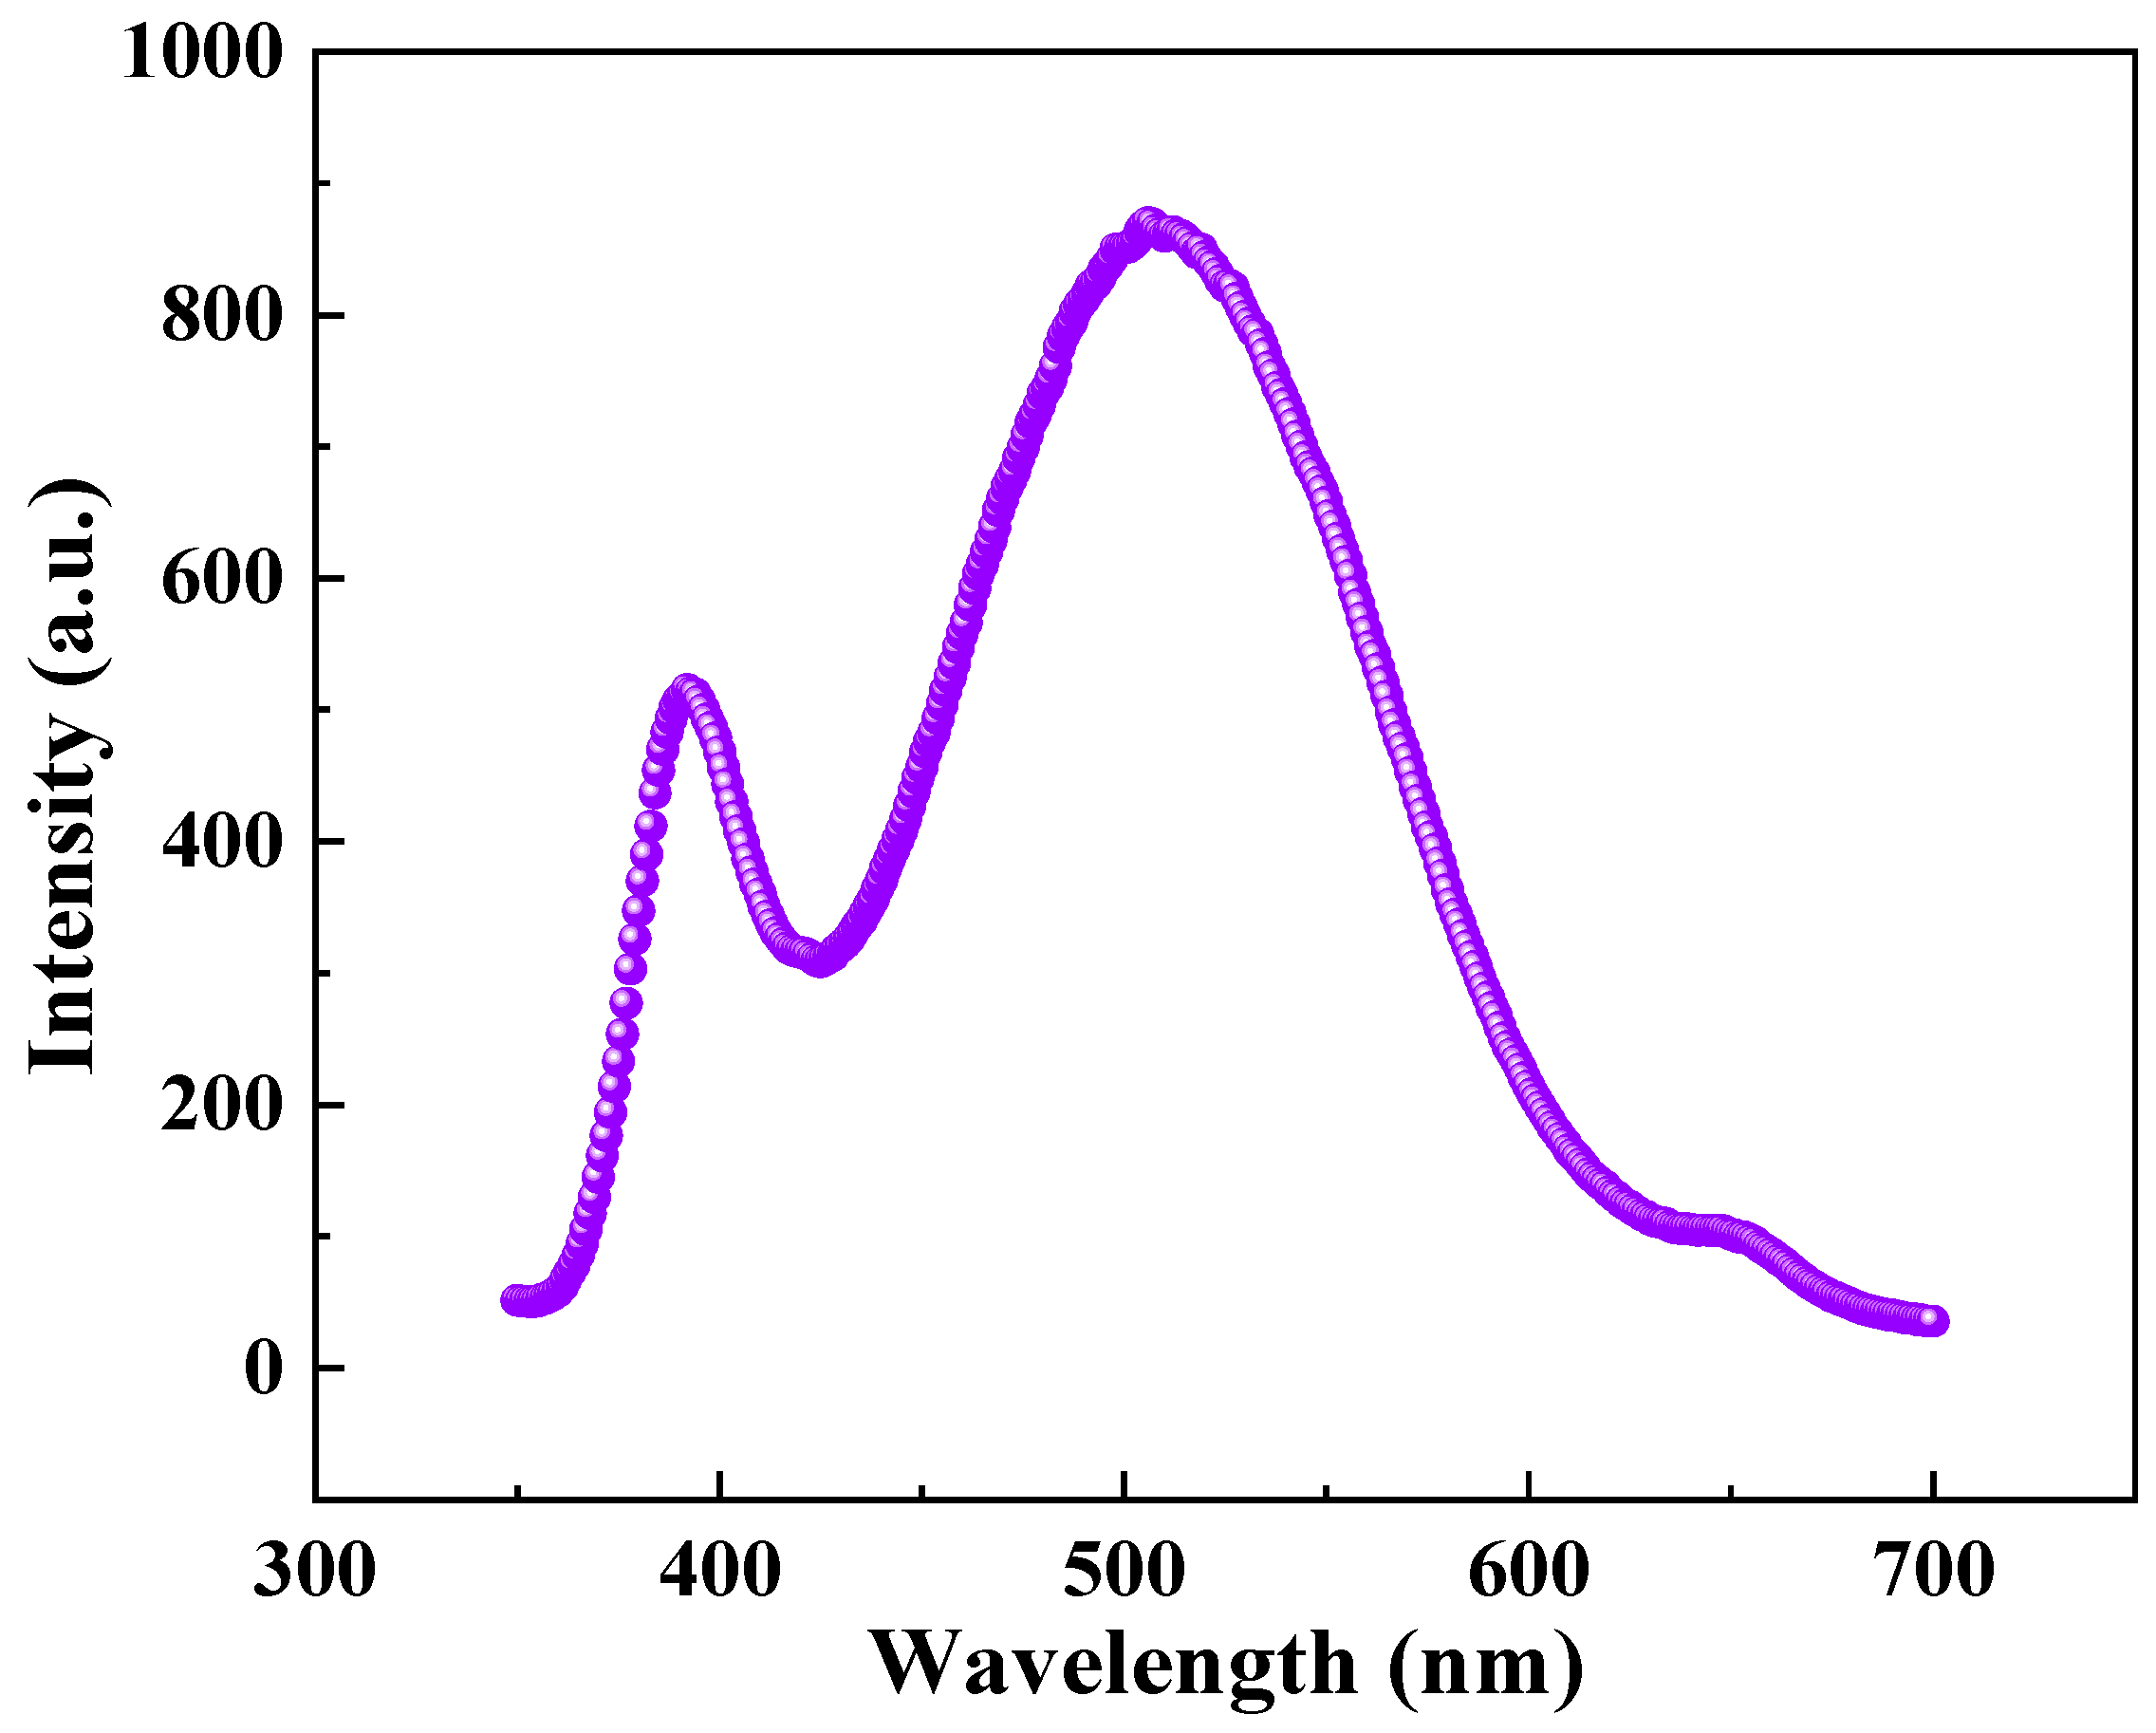
3.3. PL Analysis
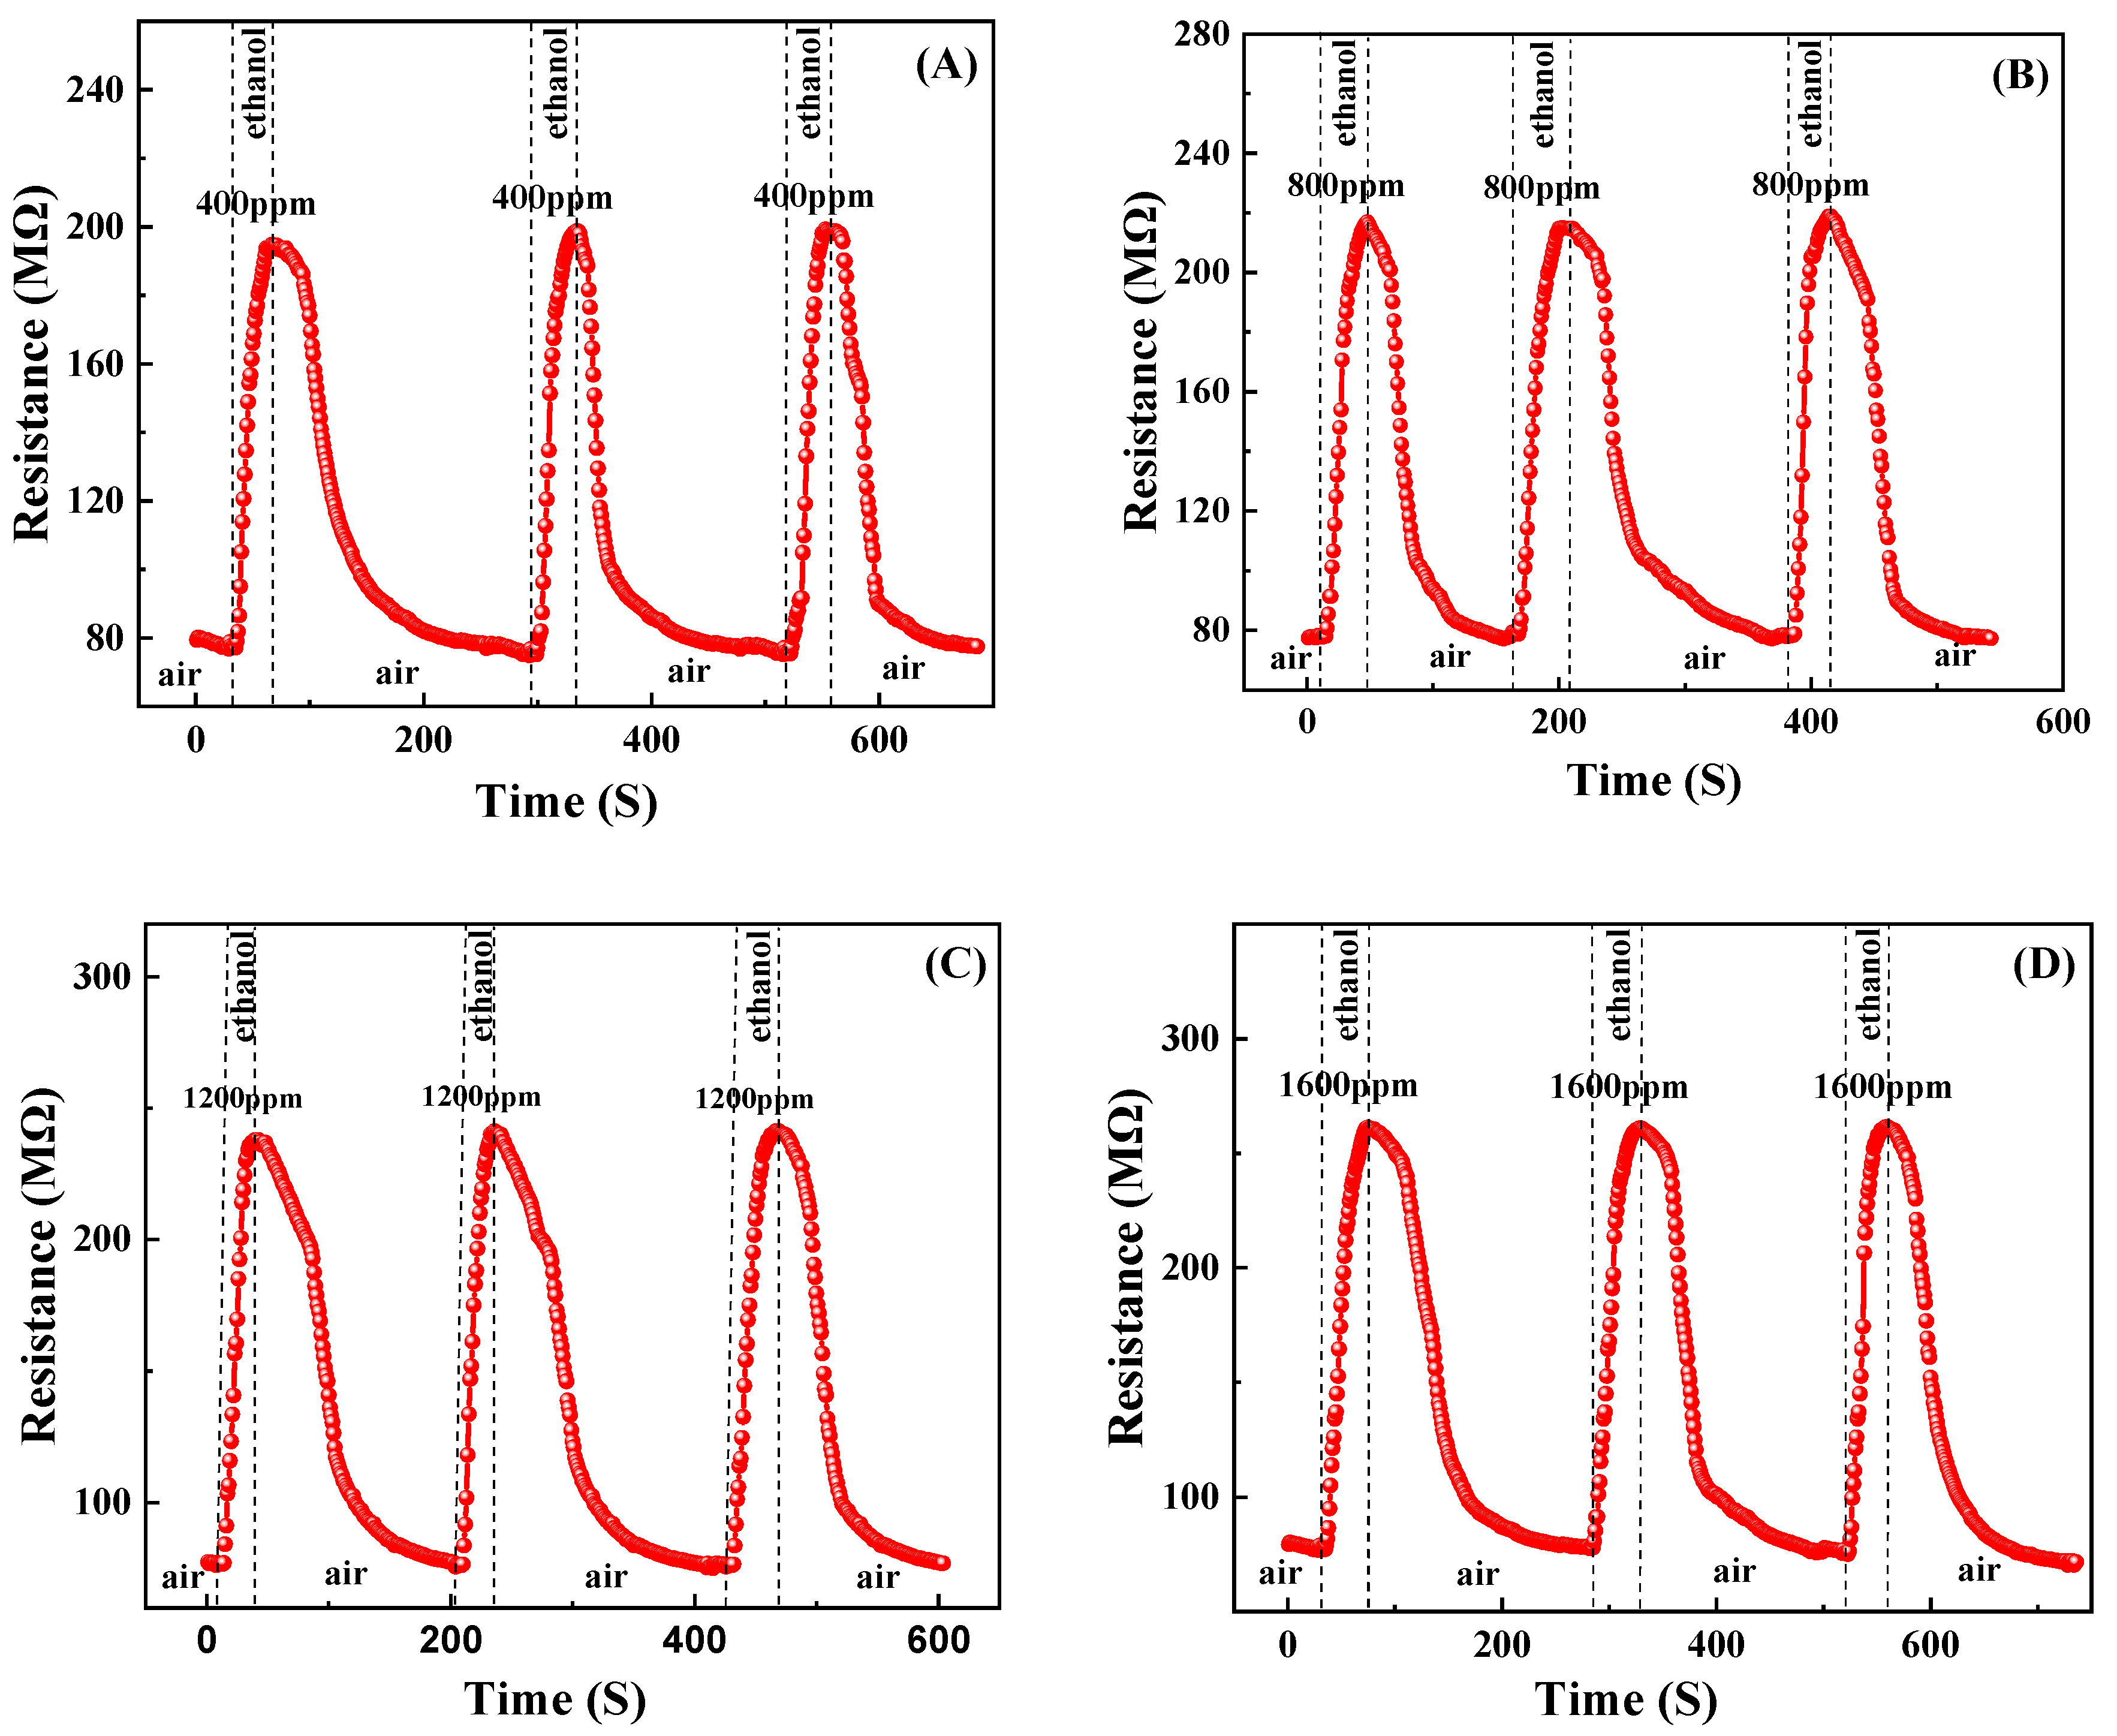
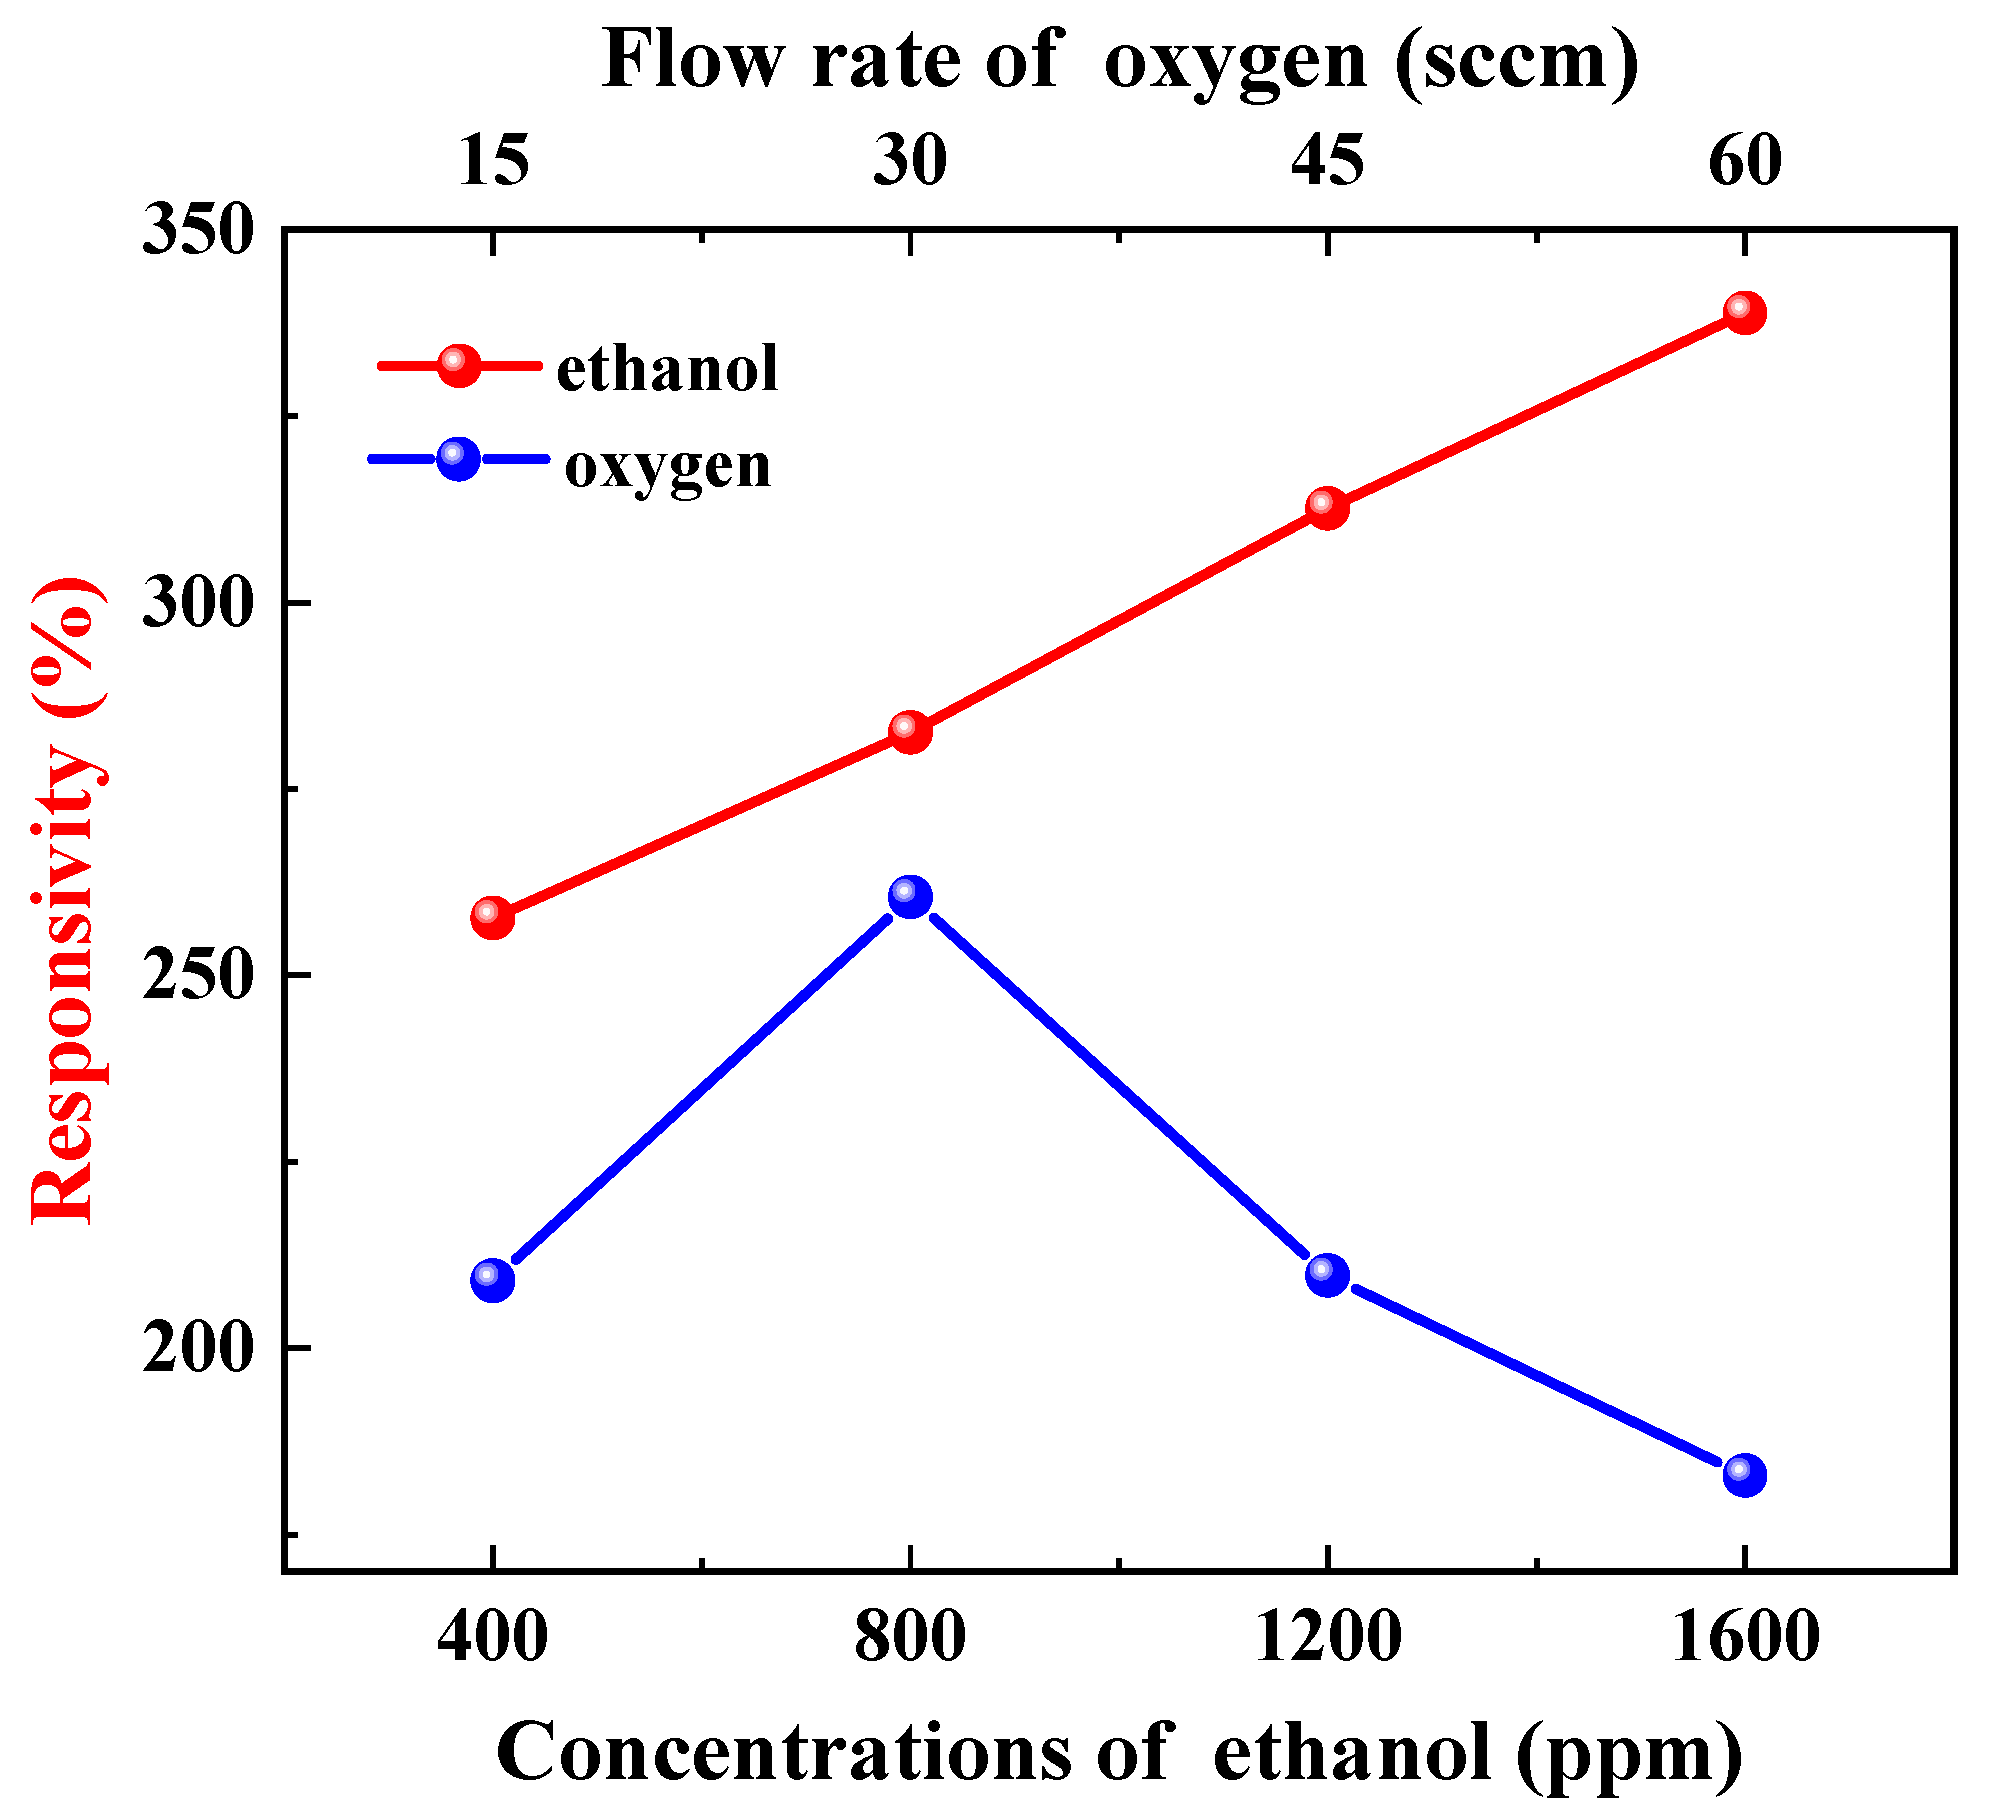
3.4. Gas-Sensing Properties
3.5. Gas-Sensing Mechanisms
4. Conclusions
Author Contributions
Funding
Institutional Review Board Statement
Informed Consent Statement
Data Availability Statement
Conflicts of Interest
References
- Sovacool, B.K.; Griffiths, S.; Kim, J.; Bazilian, M. Climate change and industrial F-gases: A critical and systematic review of developments, sociotechnical systems and policy options for reducing synthetic greenhouse gas emissions. Renew. Sustain. Energy Rev. 2021, 141, 110759. [Google Scholar] [CrossRef]
- Manisalidis, I.; Stavropoulou, E.; Stavropoulos, A.; Bezirtzoglou, E. Environmental and Health Impacts of Air Pollution: A Review. Front. Public Health 2020, 8, 00014. [Google Scholar] [CrossRef] [PubMed]
- Shakoor, A.; Shakoor, S.; Rehman, A.; Ashraf, F.; Abdullah, M.; Shahzad, S.M.; Farooq, T.H.; Ashraf, M.; Manzoor, M.A.; Altaf, M.M.; et al. Effect of animal manure, crop type, climate zone, and soil attributes on greenhouse gas emissions from agricultural soils—A global meta-analysis. J. Clean. Prod. 2021, 278, 124019. [Google Scholar] [CrossRef]
- Gabhane, L.R.; Kanidarapu, N. Environmental Risk Assessment Using Neural Network in Liquefied Petroleum Gas Terminal. Toxics 2023, 11, 348. [Google Scholar] [CrossRef] [PubMed]
- Kim, S.; Lee, K.; Kang, C.; Jung, S. Tracer Gas Test and CFD Analysis of Semiconductor Gas Box for Flammable Gas Leakage. Energies 2022, 15, 8166. [Google Scholar] [CrossRef]
- Sánchez-Squella, A.; Fernández, D.; Benavides, R.; Saldias, J. Risk Analysis, Regulation Proposal and Technical Guide for Pilot Tests of Hydrogen Vehicles in Underground Mining. Int. J. Hydrogen Energy 2022, 47, 18799–18809. [Google Scholar] [CrossRef]
- Bezdek, M.J.; Luo, S.-X.L.; Ku, K.H.; Swager, T.M. A Chemiresistive Methane Sensor. Proc. Natl. Acad. Sci. USA 2020, 118, e2022515118. [Google Scholar] [CrossRef]
- Shu, L.; Chen, Y.; Sun, Z.; Tong, F.; Mukherjee, M. Detecting the Dangerous Area of Toxic Gases with Wireless Sensor Networks. IEEE Trans. Emerg. Top. Comput. 2020, 8, 137–147. [Google Scholar] [CrossRef]
- Li, H.Y.; Zhao, S.N.; Zang, S.Q.; Li, J. Functional metal-organic frameworks as effective sensors of gases and volatile compounds. Chem. Soc. Rev. 2020, 49, 6364–6401. [Google Scholar] [CrossRef]
- Chaudhary, V.; Ashraf, N.; Khalid, M.; Walvekar, R.; Yang, Y.; Kaushik, A.; Mishra, Y.K. Emergence of MXene–Polymer Hybrid Nanocomposites as High-Performance Next-Generation Chemiresistors for Efficient Air Quality Monitoring. Adv. Funct. Mater. 2022, 32, 2112913. [Google Scholar] [CrossRef]
- Collins, W.; Orbach, R.; Bailey, M.; Biraud, S.; Coddington, I.; DiCarlo, D.; Peischl, J.; Radhakrishnan, A.; Schimel, D. Monitoring methane emissions from oil and gas operations. Opt. Express 2022, 30, 24326. [Google Scholar] [CrossRef] [PubMed]
- Kim, N.; Cho, H.H.; Kim, Y.; Hwang, J.; Choi, J.-Y.; Yu, H.K. Formation of Palladium Nano-Gap on Self-Cracked WO3 for Hydrogen Gas Sensors. Int. J. Hydrogen Energy 2023, 48, 1234–1239. [Google Scholar] [CrossRef]
- Martinazzo, J.; Moraes, M.C.B.; Steffens, J.; Steffens, C. Application of Gas Nanosensor for Detection Pheromone and Its Interferents Compounds in Vivo Euschistus Heros (F.) Stink Bugs Insects. Sens. Actuator Phys. 2022, 345, 113804. [Google Scholar] [CrossRef]
- Das, S.; Mojumder, S.; Saha, D.; Pal, M. Influence of Major Parameters on the Sensing Mechanism of Semiconductor Metal Oxide Based Chemiresistive Gas Sensors: A Review Focused on Personalized Healthcare. Sens. Actuators B Chem. 2022, 352, 131066. [Google Scholar] [CrossRef]
- Baur, T.; Amann, J.; Schultealbert, C.; Schütze, A. Field Study of Metal Oxide Semiconductor Gas Sensors in Temperature Cycled Operation for Selective VOC Monitoring in Indoor Air. Atmosphere 2021, 12, 647. [Google Scholar] [CrossRef]
- Yang, B.; Myung, N.V.; Tran, T. 1D Metal Oxide Semiconductor Materials for Chemiresistive Gas Sensors: A Review. Adv. Electron. Mater. 2021, 7, 2100271. [Google Scholar] [CrossRef]
- Isaac, N.A.; Pikaar, I.; Biskos, G. Metal Oxide Semiconducting Nanomaterials for Air Quality Gas Sensors: Operating Principles, Performance, and Synthesis Techniques. Microchim. Acta 2022, 189, 1–22. [Google Scholar] [CrossRef]
- Souissi, R.; Bouricha, B.; Bouguila, N.; El Mir, L.; Labidi, A.; Abderrabba, M. Chemical VOC Sensing Mechanism of Sol–Gel ZnO Pellets and Linear Discriminant Analysis for Instantaneous Selectivity. RSC Adv. 2023, 13, 20651–20662. [Google Scholar] [CrossRef]
- Jamnani, S.R.; Moghaddam, H.M.; Leonardi, S.G.; Neri, G.; Ferlazzo, A. VOCs Sensing Properties of Samarium Oxide Nanorods. Ceram. Int. 2023, 50, 403–411. [Google Scholar] [CrossRef]
- Perrone, O.M.; Roveda, A.C.; de Moraes, D.A.; Theodoro, R.d.S.; Volanti, D.P. Highly Efficient Detection of Ethanol by SnO2 Nanoparticles-Decored NiO Nanocuboids. Mater. Res. Bull. 2023, 158, 112086. [Google Scholar] [CrossRef]
- Seiyama, T.; Kato, A.; Fujiishi, K.; Nagatani, M. A New Detector for Gaseous Components Using Semiconductive Thin Films. Anal. Chem. 1962, 34, 1502–1503. [Google Scholar] [CrossRef]
- Kim, T.; Lee, S.; Cho, W.; Kwon, Y.M.; Baik, J.M.; Shin, H. Development of a Novel Gas-Sensing Platform Based on a Network of Metal Oxide Nanowire Junctions Formed on a Suspended Carbon Nanomesh Backbone. Sensors 2021, 21, 4525. [Google Scholar] [CrossRef] [PubMed]
- Alev, O.; Ergün, İ.; Özdemir, O.; Arslan, L.Ç.; Büyükköse, S.; Öztürk, Z.Z. Enhanced Ethanol Sensing Performance of Cu-Doped ZnO Nanorods. Mater. Sci. Semicond. Process. 2021, 136, 106149. [Google Scholar] [CrossRef]
- Kei, C.C.; Wang, C.C.; Perng, T.P. Modulation of wall thickness of Al-doped ZnO nanotubes by nanolamination of atomic layer deposition for oxygen sensing. J. Am. Ceram. Soc. 2021, 104, 4938–4945. [Google Scholar] [CrossRef]
- Choi, M.S.; Kim, M.Y.; Mirzaei, A.; Kim, H.S.; Kim, S.I.; Baek, S.H.; Chun, D.W.; Jin, C. Hyoung Lee, Selective, sensitive, and stable NO2 gas sensor based on porous ZnO nanosheets. Appl. Surf. Sci. 2021, 568, 150910. [Google Scholar] [CrossRef]
- Bruce, J.; Bosnick, K.; Kamali Heidari, E. Pd-Decorated ZnO Nanoflowers as a Promising Gas Sensor for the Detection of Meat Spoilage. Sens. Actuators B Chem. 2022, 355, 131316. [Google Scholar] [CrossRef]
- Sayago, I.; Santos, J.P.; Sánchez-Vicente, C. The Effect of Rare Earths on the Response of Photo UV-Activate ZnO Gas Sensors. Sensors 2022, 22, 8150. [Google Scholar] [CrossRef]
- Hsueh, T.J.; Peng, C.H.; Chen, W.S. A transparent ZnO nanowire MEMS gas sensor prepared by an ITO micro-heater. Sens. Actuators B Chem. 2020, 304, 127319. [Google Scholar] [CrossRef]
- Cai, Z.; Park, J.; Park, S. Porous In2O3–ZnO Nanofiber-Based Sensor for Ultrasensitive Room-Temperature Detection of Toluene Gas under UV Illumination. J. Mater. Res. Technol. 2023, 24, 2482–2499. [Google Scholar] [CrossRef]
- Jang, M.; Lee, J.; Park, S.Y.; Lee, J.; Lee, K.M.; Song, W.; Myung, S.; Lee, S.S.; Jung, H.K.; Kang, Y.C.; et al. Rational surface modification of ZnO with siloxane polymers for room-temperature-operated thin-film transistor-based gas sensors. Appl. Surf. Sci. 2021, 542, 148704. [Google Scholar] [CrossRef]
- Hussein, H.T.; Kareem, M.H.; Abdul Hussein, A.M. Synthesis and Characterization of Carbon Nanotube Doped with Zinc Oxide Nanoparticles CNTs-ZnO/PS as Ethanol Gas Sensor. Optik 2021, 248, 168107. [Google Scholar] [CrossRef]
- Abideen, Z.U.; Choi, J.-G.; Yuwono, J.A.; Lee, W.-J.; Murugappan, K.; Kumar, P.V.; Nisbet, D.R.; Trần-Phú, T.; Yoon, M.-H.; Tricoli, A. Structural Engineering Three-Dimensional Nano-Heterojunction Networks for High-Performance Photochemical Sensing. ACS Appl. Mater. Interfaces 2023, 15, 56464–56477. [Google Scholar] [CrossRef] [PubMed]
- Greijer, H.; Mirotta, N.; Treossi, E.; Valorosi, F.; Schütt, F.; Siebert, L.; Mishra, Y.K.; Adelung, R.; Palermo, V.; Hillborg, H. Tuneable conductivity at extreme electric fields in ZnO tetrapod-silicone composites for high-voltage power cable insulation. Sci. Rep. 2022, 12, 6035. [Google Scholar] [CrossRef] [PubMed]
- Babayevska, N.; Przysiecka, Ł.; Iatsunskyi, I.; Nowaczyk, G.; Jarek, M.; Janiszewska, E.; Jurga, S. ZnO size and shape effect on antibacterial activity and cytotoxicity profile. Sci. Rep. 2022, 12, 8148. [Google Scholar] [CrossRef] [PubMed]
- Chamoli, P.; Shukla, R.K.; Bezbaruah, A.N.; Kar, K.K.; Raina, K.K. Microwave-assisted rapid synthesis of honeycomb core-ZnO tetrapods nanocomposites for excellent photocatalytic activity against different organic dyes. Appl. Surf. Sci. 2021, 555, 149663. [Google Scholar] [CrossRef]
- Rodrigues, J.; Becker, C.; Sedrine, N.B.; Kamp, M.; Kienle, L.; Adelung, R.; Mishra, Y.K.; Parak, W.J.; Chakraborty, I.; Correia, M.R.; et al. Luminescent silver nanoclusters decorated on ZnO tetrapods: A detailed understanding of their role in photoluminescence features. J. Mater. Chem. C Mater. 2021, 9, 7014–7026. [Google Scholar] [CrossRef]
- Li, D.; Ma, J.; Chen, K. 2-D zinc ferrite “moss” furred on 3-D zinc oxide tetrapods to boost detection sensitivity of hydrogen sulfide. J. Phys. Chem. Solids 2021, 148, 109656. [Google Scholar] [CrossRef]
- Mishra, Y.K.; Adelung, R. ZnO tetrapod materials for functional applications. Mater. Today 2018, 21, 631–651. [Google Scholar] [CrossRef]
- Hsu, C.L.; Chen, K.C.; Tsai, T.Y.; Hsueh, T.J. Fabrication of gas sensor based on p-type ZnO nanoparticles and n-type ZnO nanowires. Sens. Actuators B Chem. 2013, 182, 190–196. [Google Scholar] [CrossRef]
- Shao, C.; Chang, Y.; Long, Y. High performance of nanostructured ZnO film gas sensor at room temperature. Sens. Actuators B Chem. 2014, 204, 666–672. [Google Scholar] [CrossRef]
- Chaabouni, F.; Abaab, M.; Rezig, B. Metrological characteristics of ZNO oxygen sensor at room temperature. Sens. Actuators B Chem. 2004, 100, 200–204. [Google Scholar] [CrossRef]
- Eyvaraghi, A.M.; Mohammadi, E.; Manavizadeh, N.; Nadimi, E.; Ma’mani, L.; Broumand, F.A.; Zeidabadi, M.A. Experimental and Density Functional Theory Computational Studies on Highly Sensitive Ethanol Gas Sensor Based on Au-Decorated ZnO Nanoparticles. Thin Solid. Film. 2022, 741, 139014. [Google Scholar] [CrossRef]
- Lin, C.-H.; Chang, S.-J.; Hsueh, T.-J. A Low-Temperature ZnO Nanowire Ethanol Gas Sensor Prepared on Plastic Substrate. Mater. Res. Express 2016, 3, 095002. [Google Scholar] [CrossRef]
- Hao, M.; Zhang, R.; Jia, X.; Gao, X.; Gao, W.; Cheng, L.; Qin, Y. A Polymer Based Self-Powered Ethanol Gas Sensor to Eliminate the Interference of Ultraviolet Light. Sens. Actuator Phys. 2021, 332, 113173. [Google Scholar] [CrossRef]
- Zigya Resource Centre. 2023. Available online: https://www.zigya.com/question/UTBoRlRqRXlNRFEzT0RBMQ== (accessed on 30 April 2023).


| 400 | 800 | 1200 | 1600 | 15 | 30 | 45 | 60 | |
|---|---|---|---|---|---|---|---|---|
| response time | 16 | 23 | 18 | 20 | 58 | 67 | 40 | 48 |
| recovery time | 61 | 60 | 81 | 77 | 63 | 94 | 73 | 77 |
Disclaimer/Publisher’s Note: The statements, opinions and data contained in all publications are solely those of the individual author(s) and contributor(s) and not of MDPI and/or the editor(s). MDPI and/or the editor(s) disclaim responsibility for any injury to people or property resulting from any ideas, methods, instructions or products referred to in the content. |
© 2023 by the authors. Licensee MDPI, Basel, Switzerland. This article is an open access article distributed under the terms and conditions of the Creative Commons Attribution (CC BY) license (https://creativecommons.org/licenses/by/4.0/).
Share and Cite
Hu, J.; Ma, H.; Zhou, Y.; Ma, L.; Zhao, S.; Shi, S.; Li, J.; Chang, Y. Gas-Sensing Properties and Mechanisms of 3D Networks Composed of ZnO Tetrapod Micro-Nano Structures at Room Temperature. Materials 2024, 17, 203. https://doi.org/10.3390/ma17010203
Hu J, Ma H, Zhou Y, Ma L, Zhao S, Shi S, Li J, Chang Y. Gas-Sensing Properties and Mechanisms of 3D Networks Composed of ZnO Tetrapod Micro-Nano Structures at Room Temperature. Materials. 2024; 17(1):203. https://doi.org/10.3390/ma17010203
Chicago/Turabian StyleHu, Jinjiang, Hong Ma, Yang Zhou, Liyong Ma, Shuyin Zhao, Shuzheng Shi, Jirong Li, and Yongqin Chang. 2024. "Gas-Sensing Properties and Mechanisms of 3D Networks Composed of ZnO Tetrapod Micro-Nano Structures at Room Temperature" Materials 17, no. 1: 203. https://doi.org/10.3390/ma17010203