


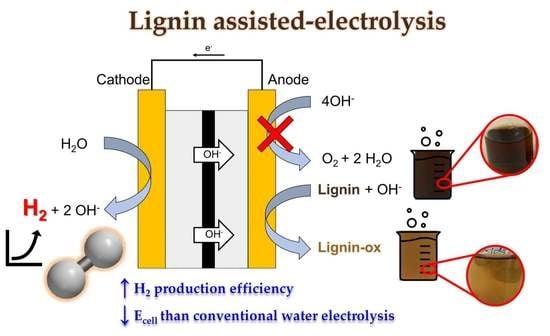
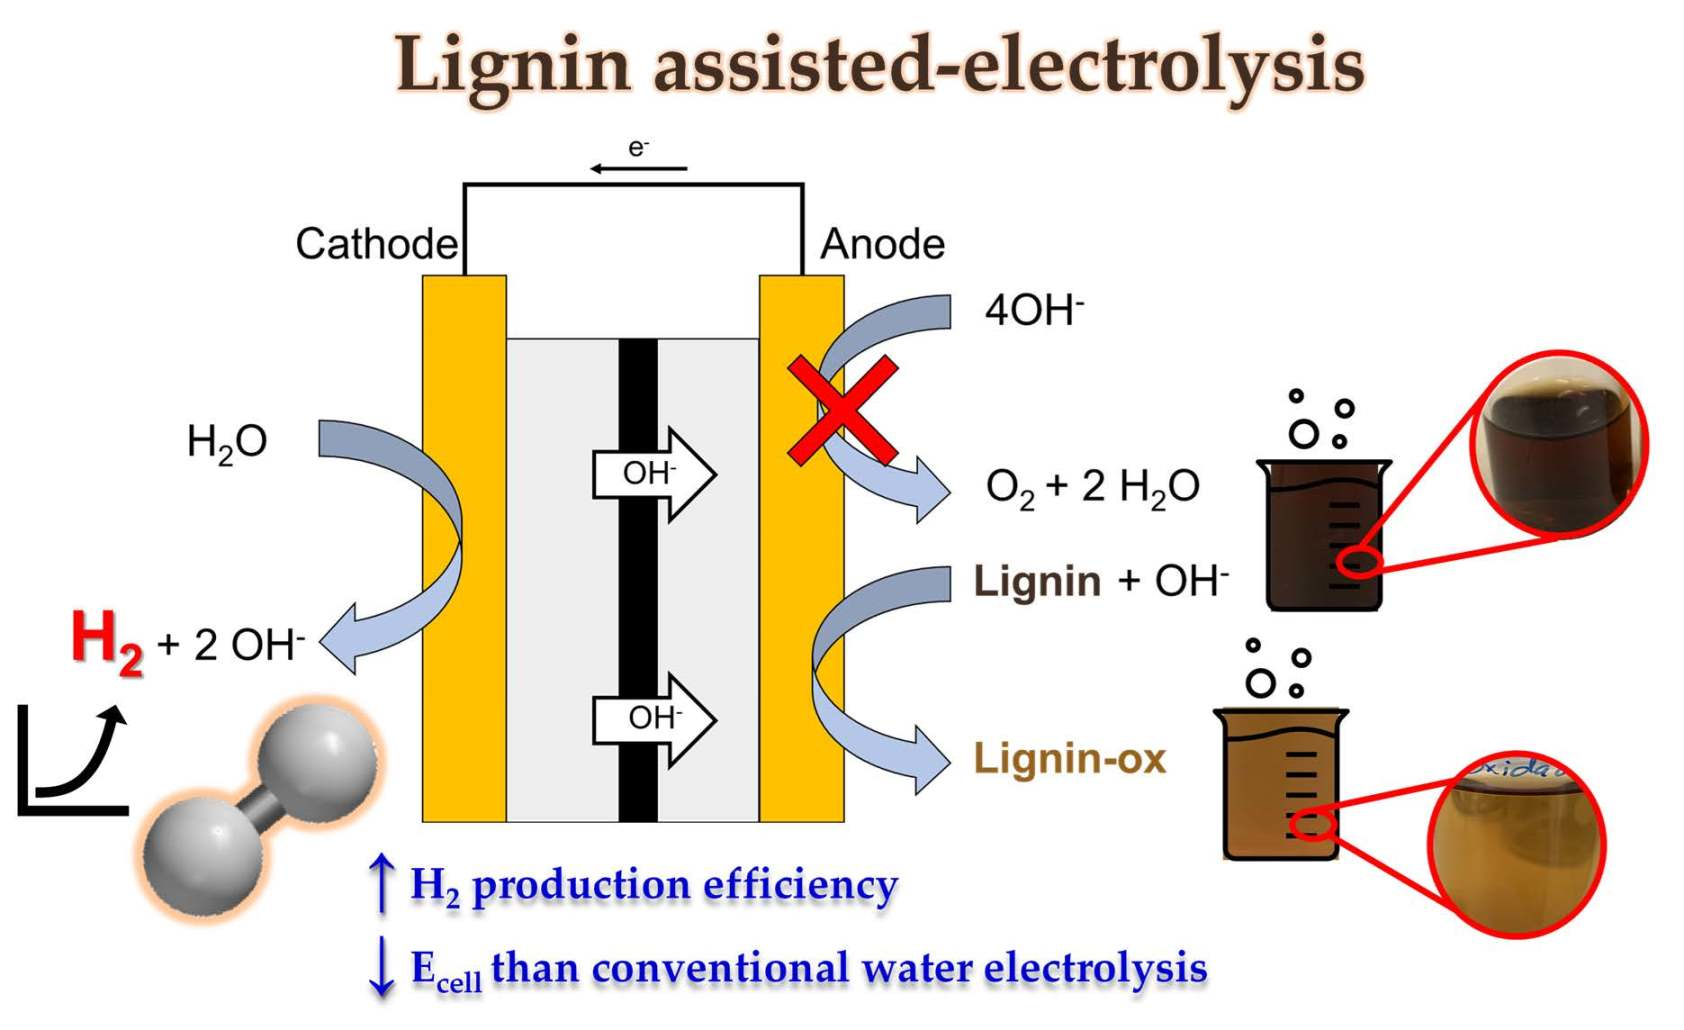
Clean H2 Production by Lignin-Assisted Electrolysis in a Polymer Electrolyte Membrane Flow Reactor


Abstract
:
1. Introduction
2. Materials and Methods
2.1. Materials
2.1.1. Catalysts
2.1.2. Membrane
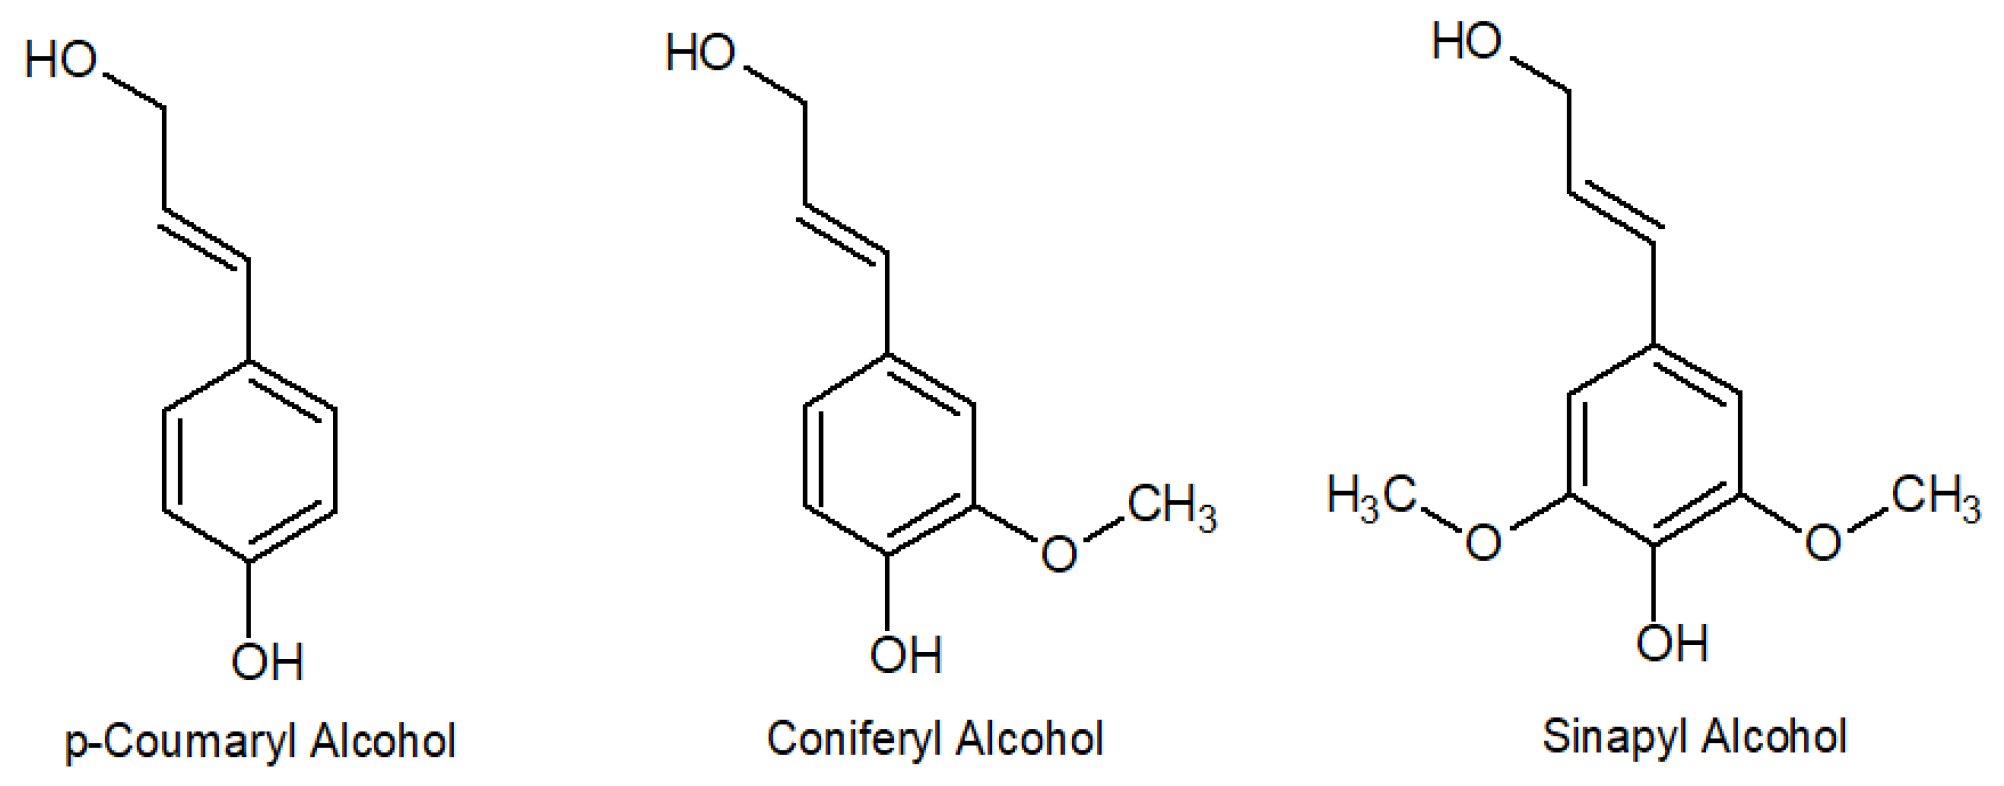
2.1.3. Lignins
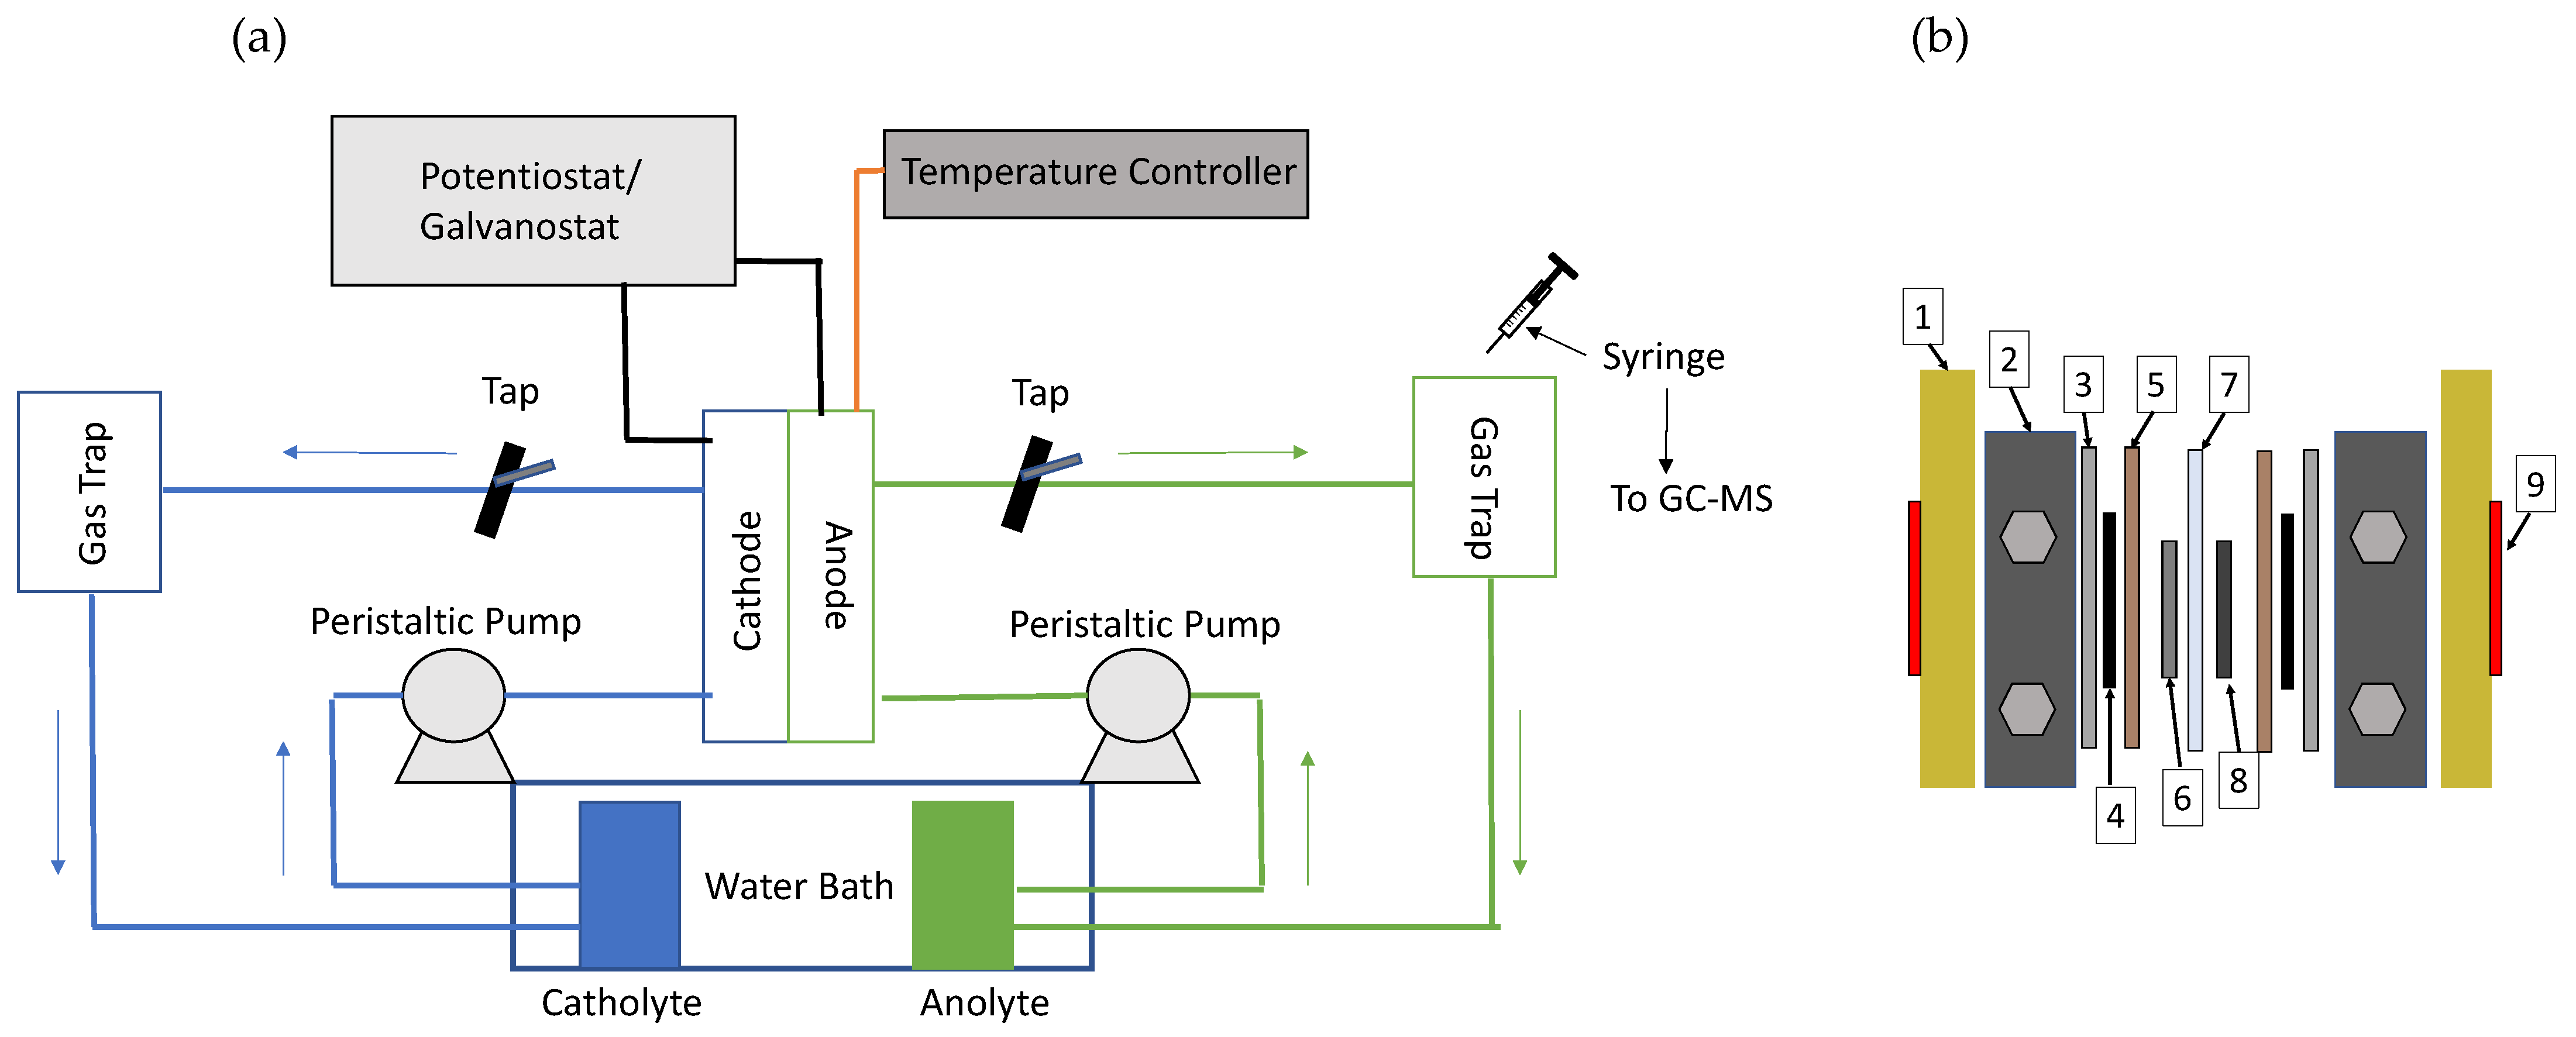
2.1.4. Equipment
2.2. Methods
2.2.1. Solubility Test
2.2.2. Viscosity Measurements
2.2.3. FT-IR with ATR Characterisation
2.2.4. Mass Spectrometry Coupled with Gas Chromatography
2.2.5. NMR Characterisation
2.2.6. UV-Vis Spectroscopy Characterisation
2.2.7. Experimental Assembly
2.2.8. Electrochemical Measurements
3. Results and Discussion
3.1. Solubility Tests
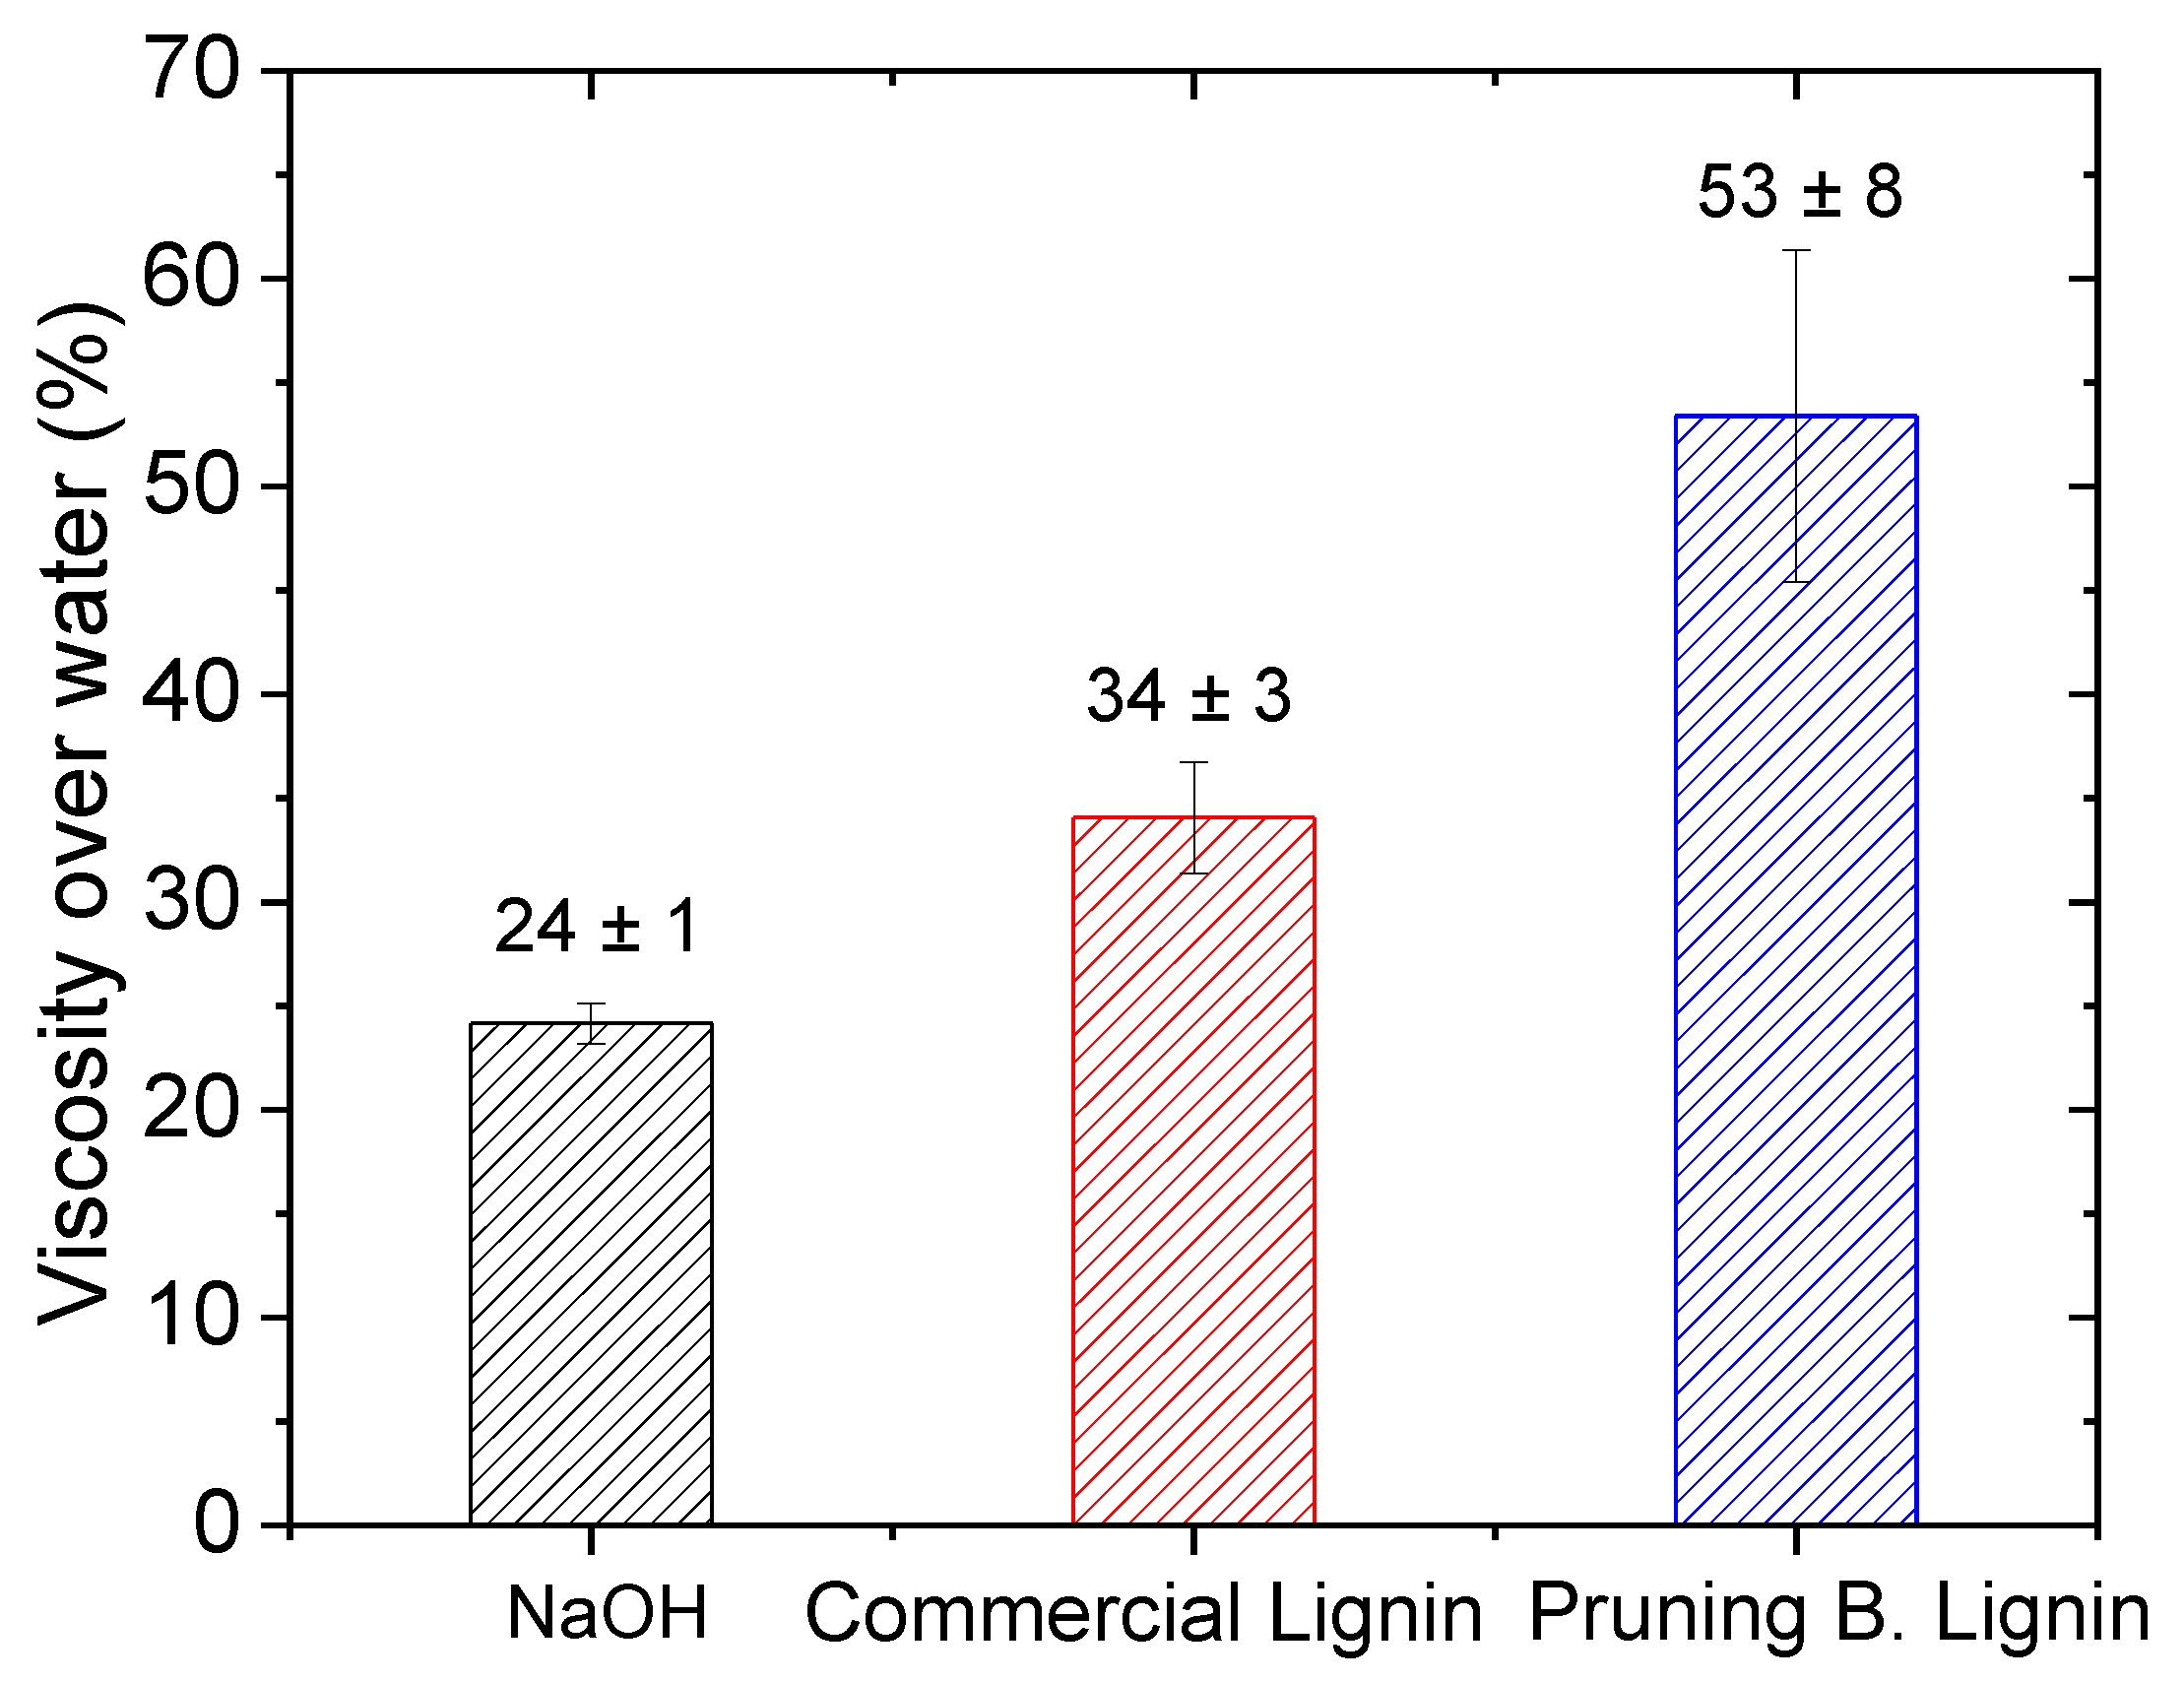
3.2. Viscosity Measurements
3.3. Electrochemical Characterisation
3.3.1. Three-Electrode Cell
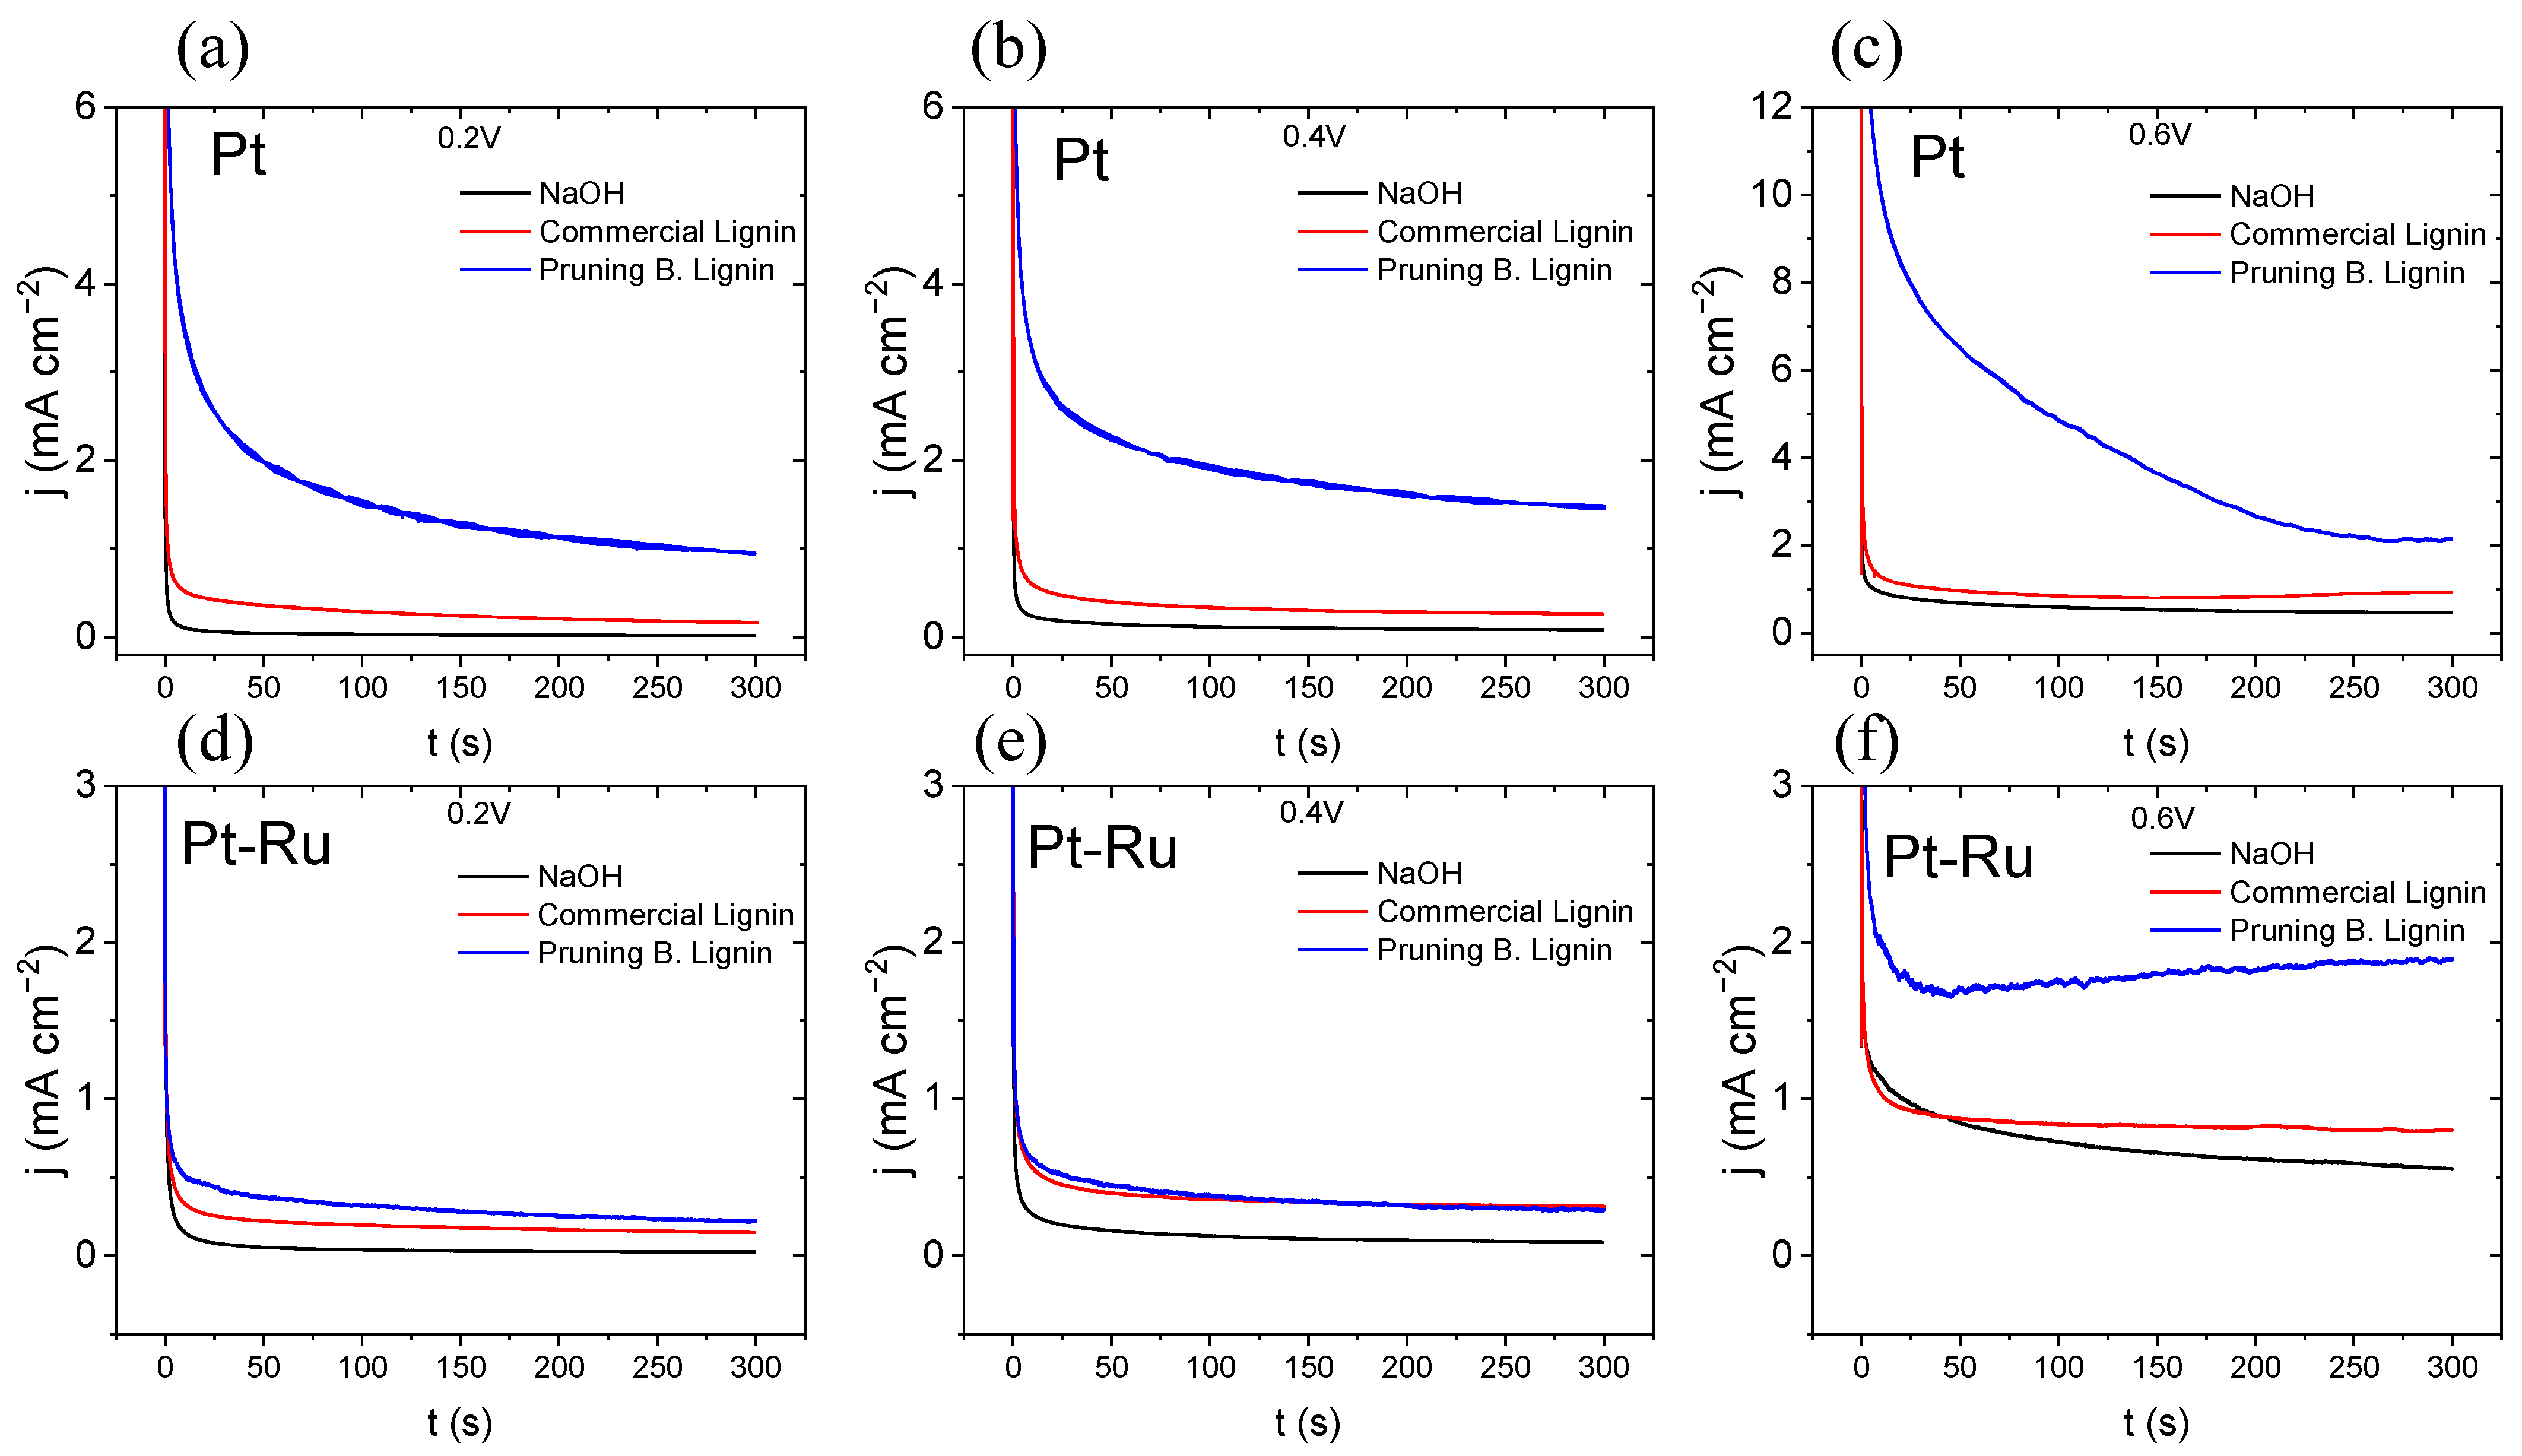
3.3.2. Chronoamperometry
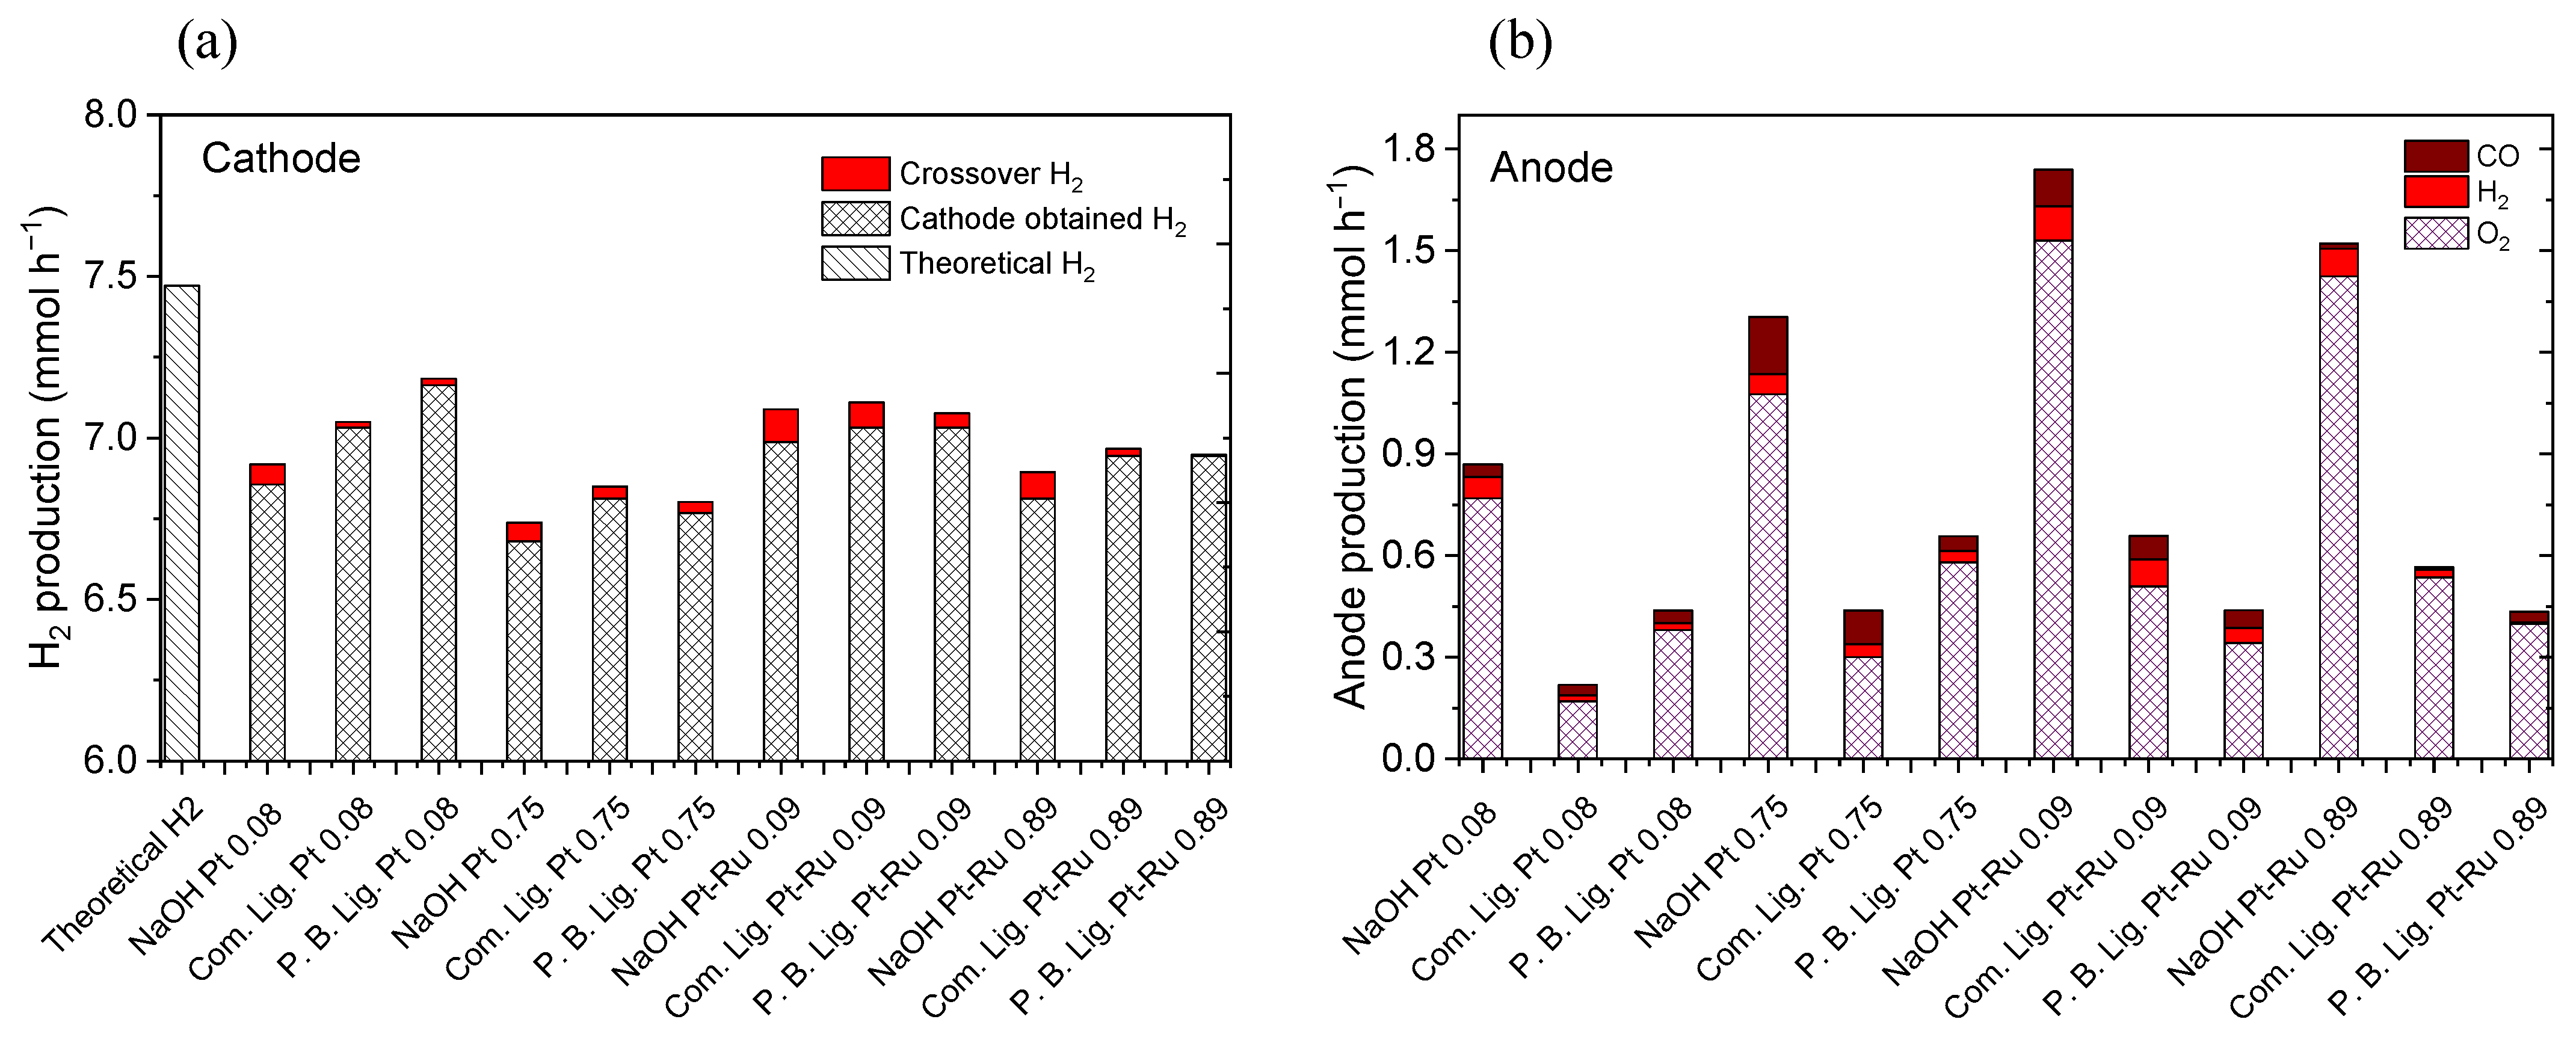
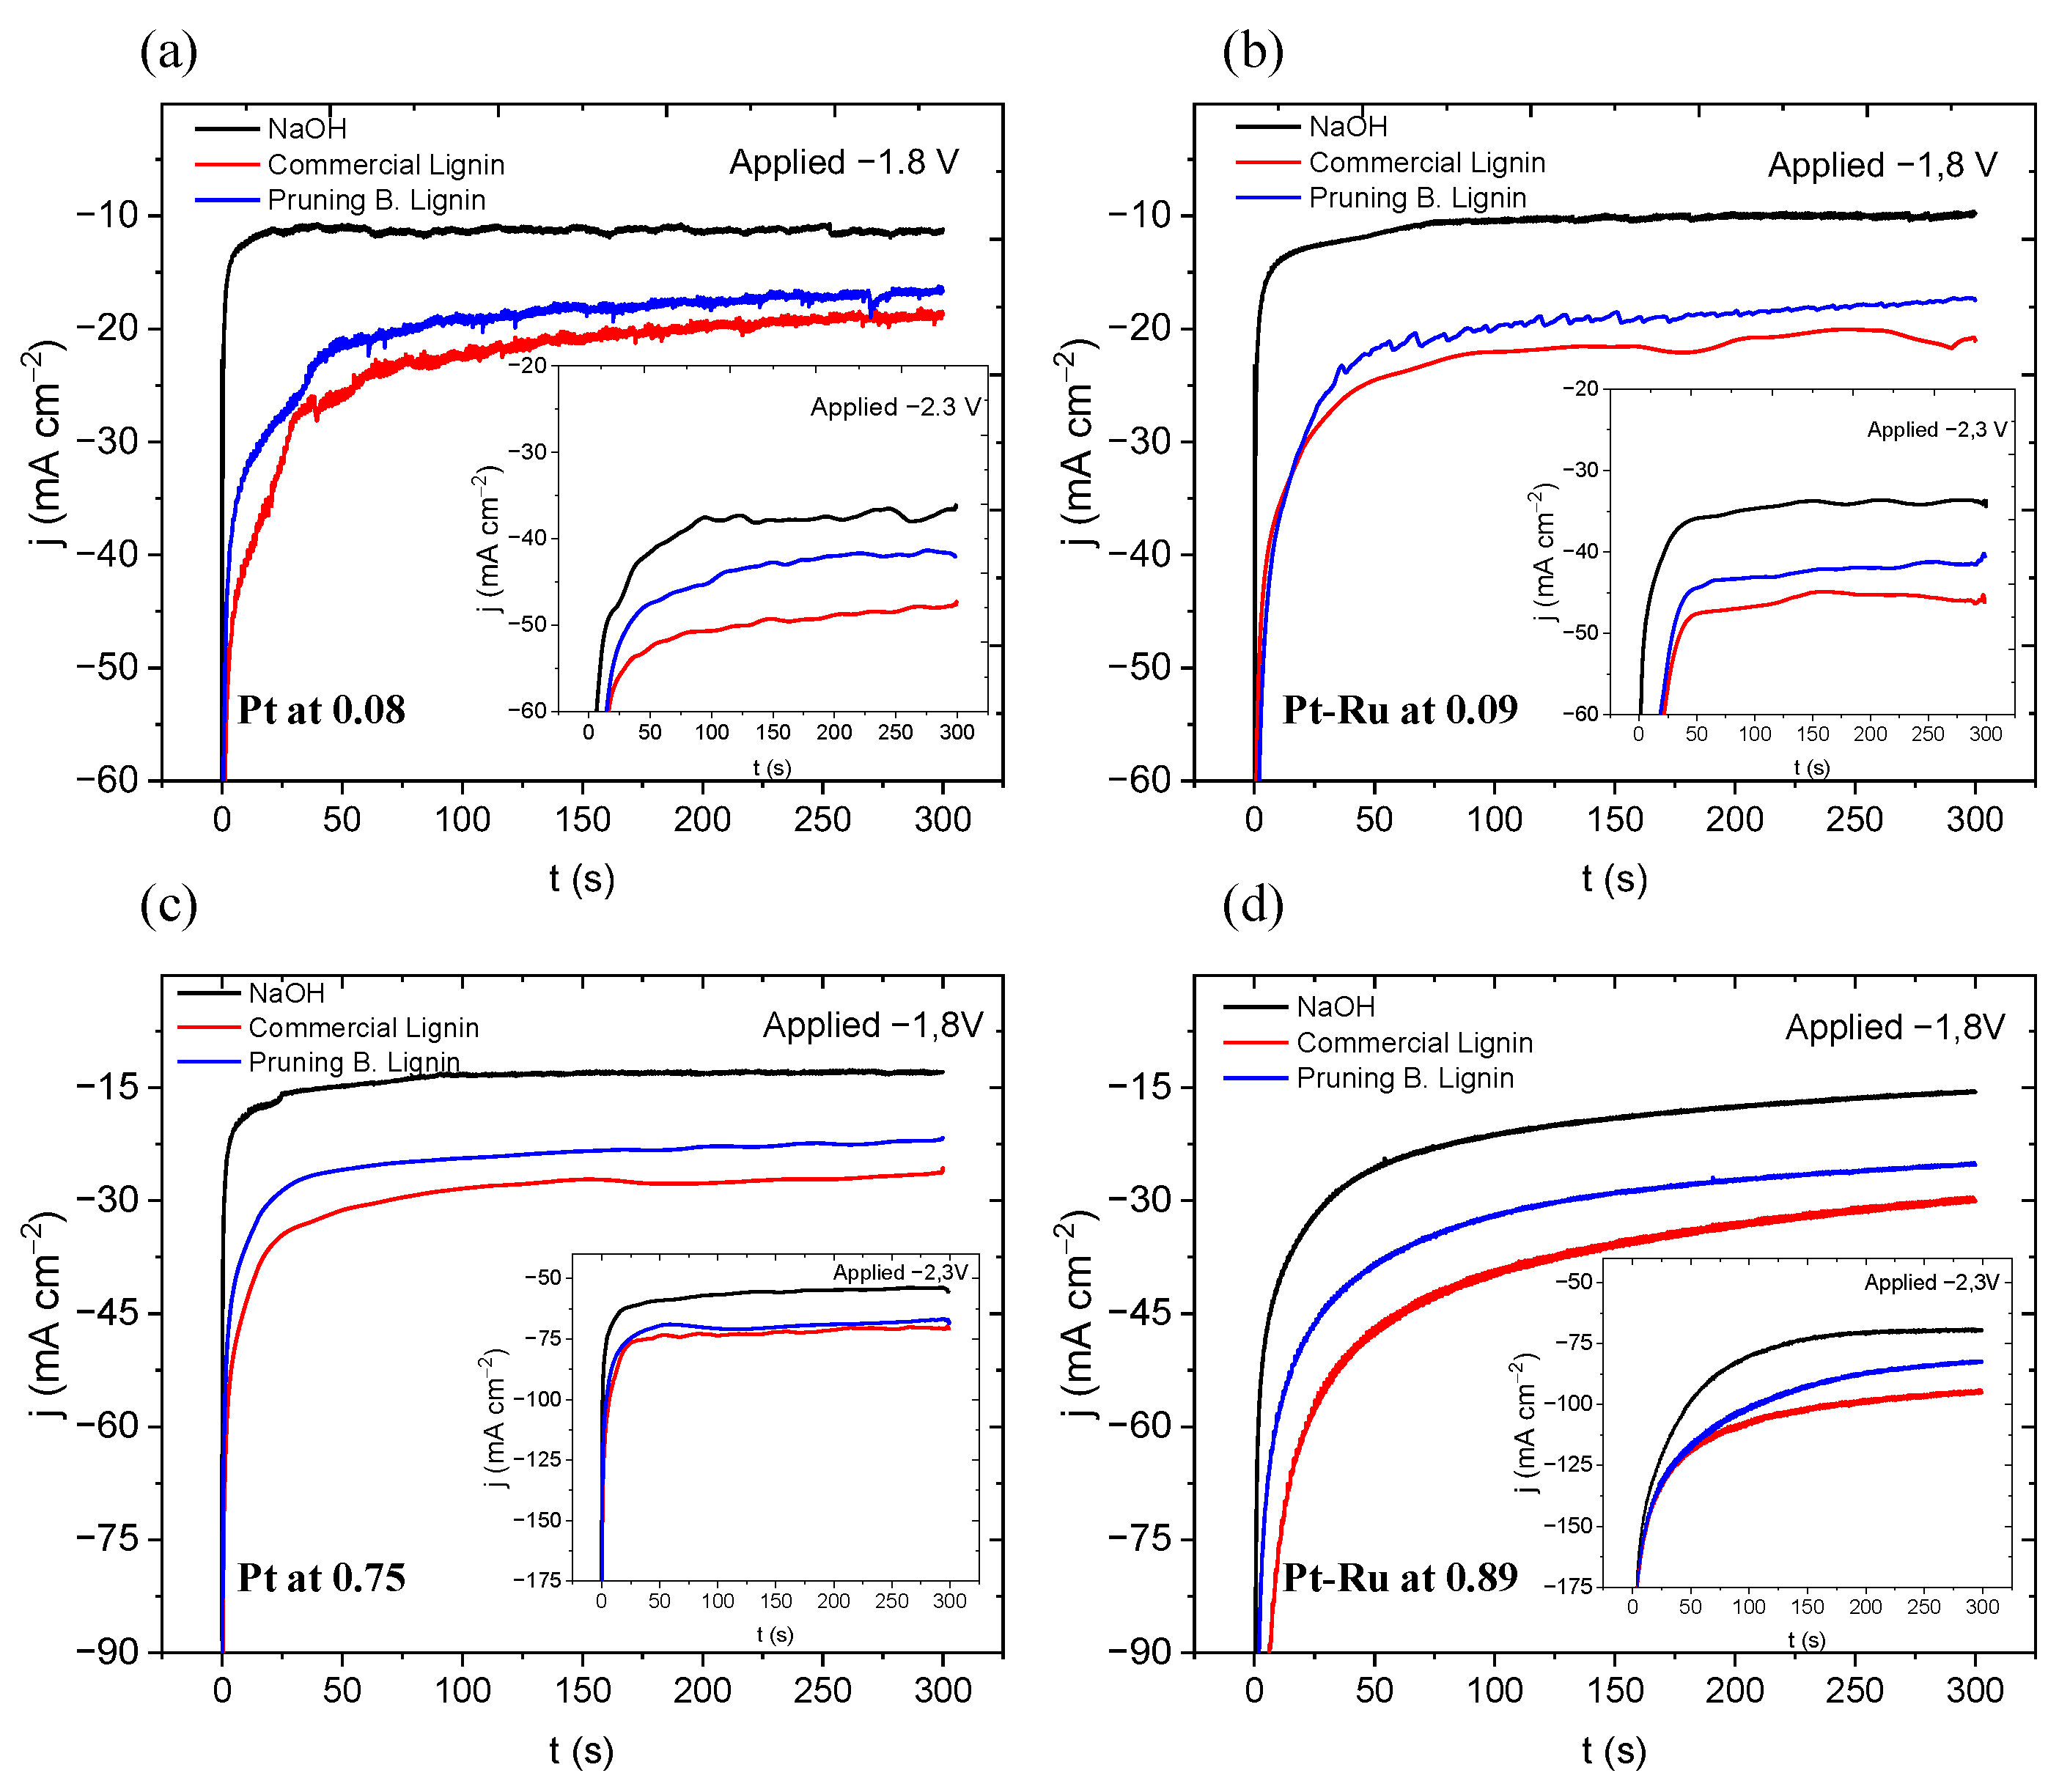
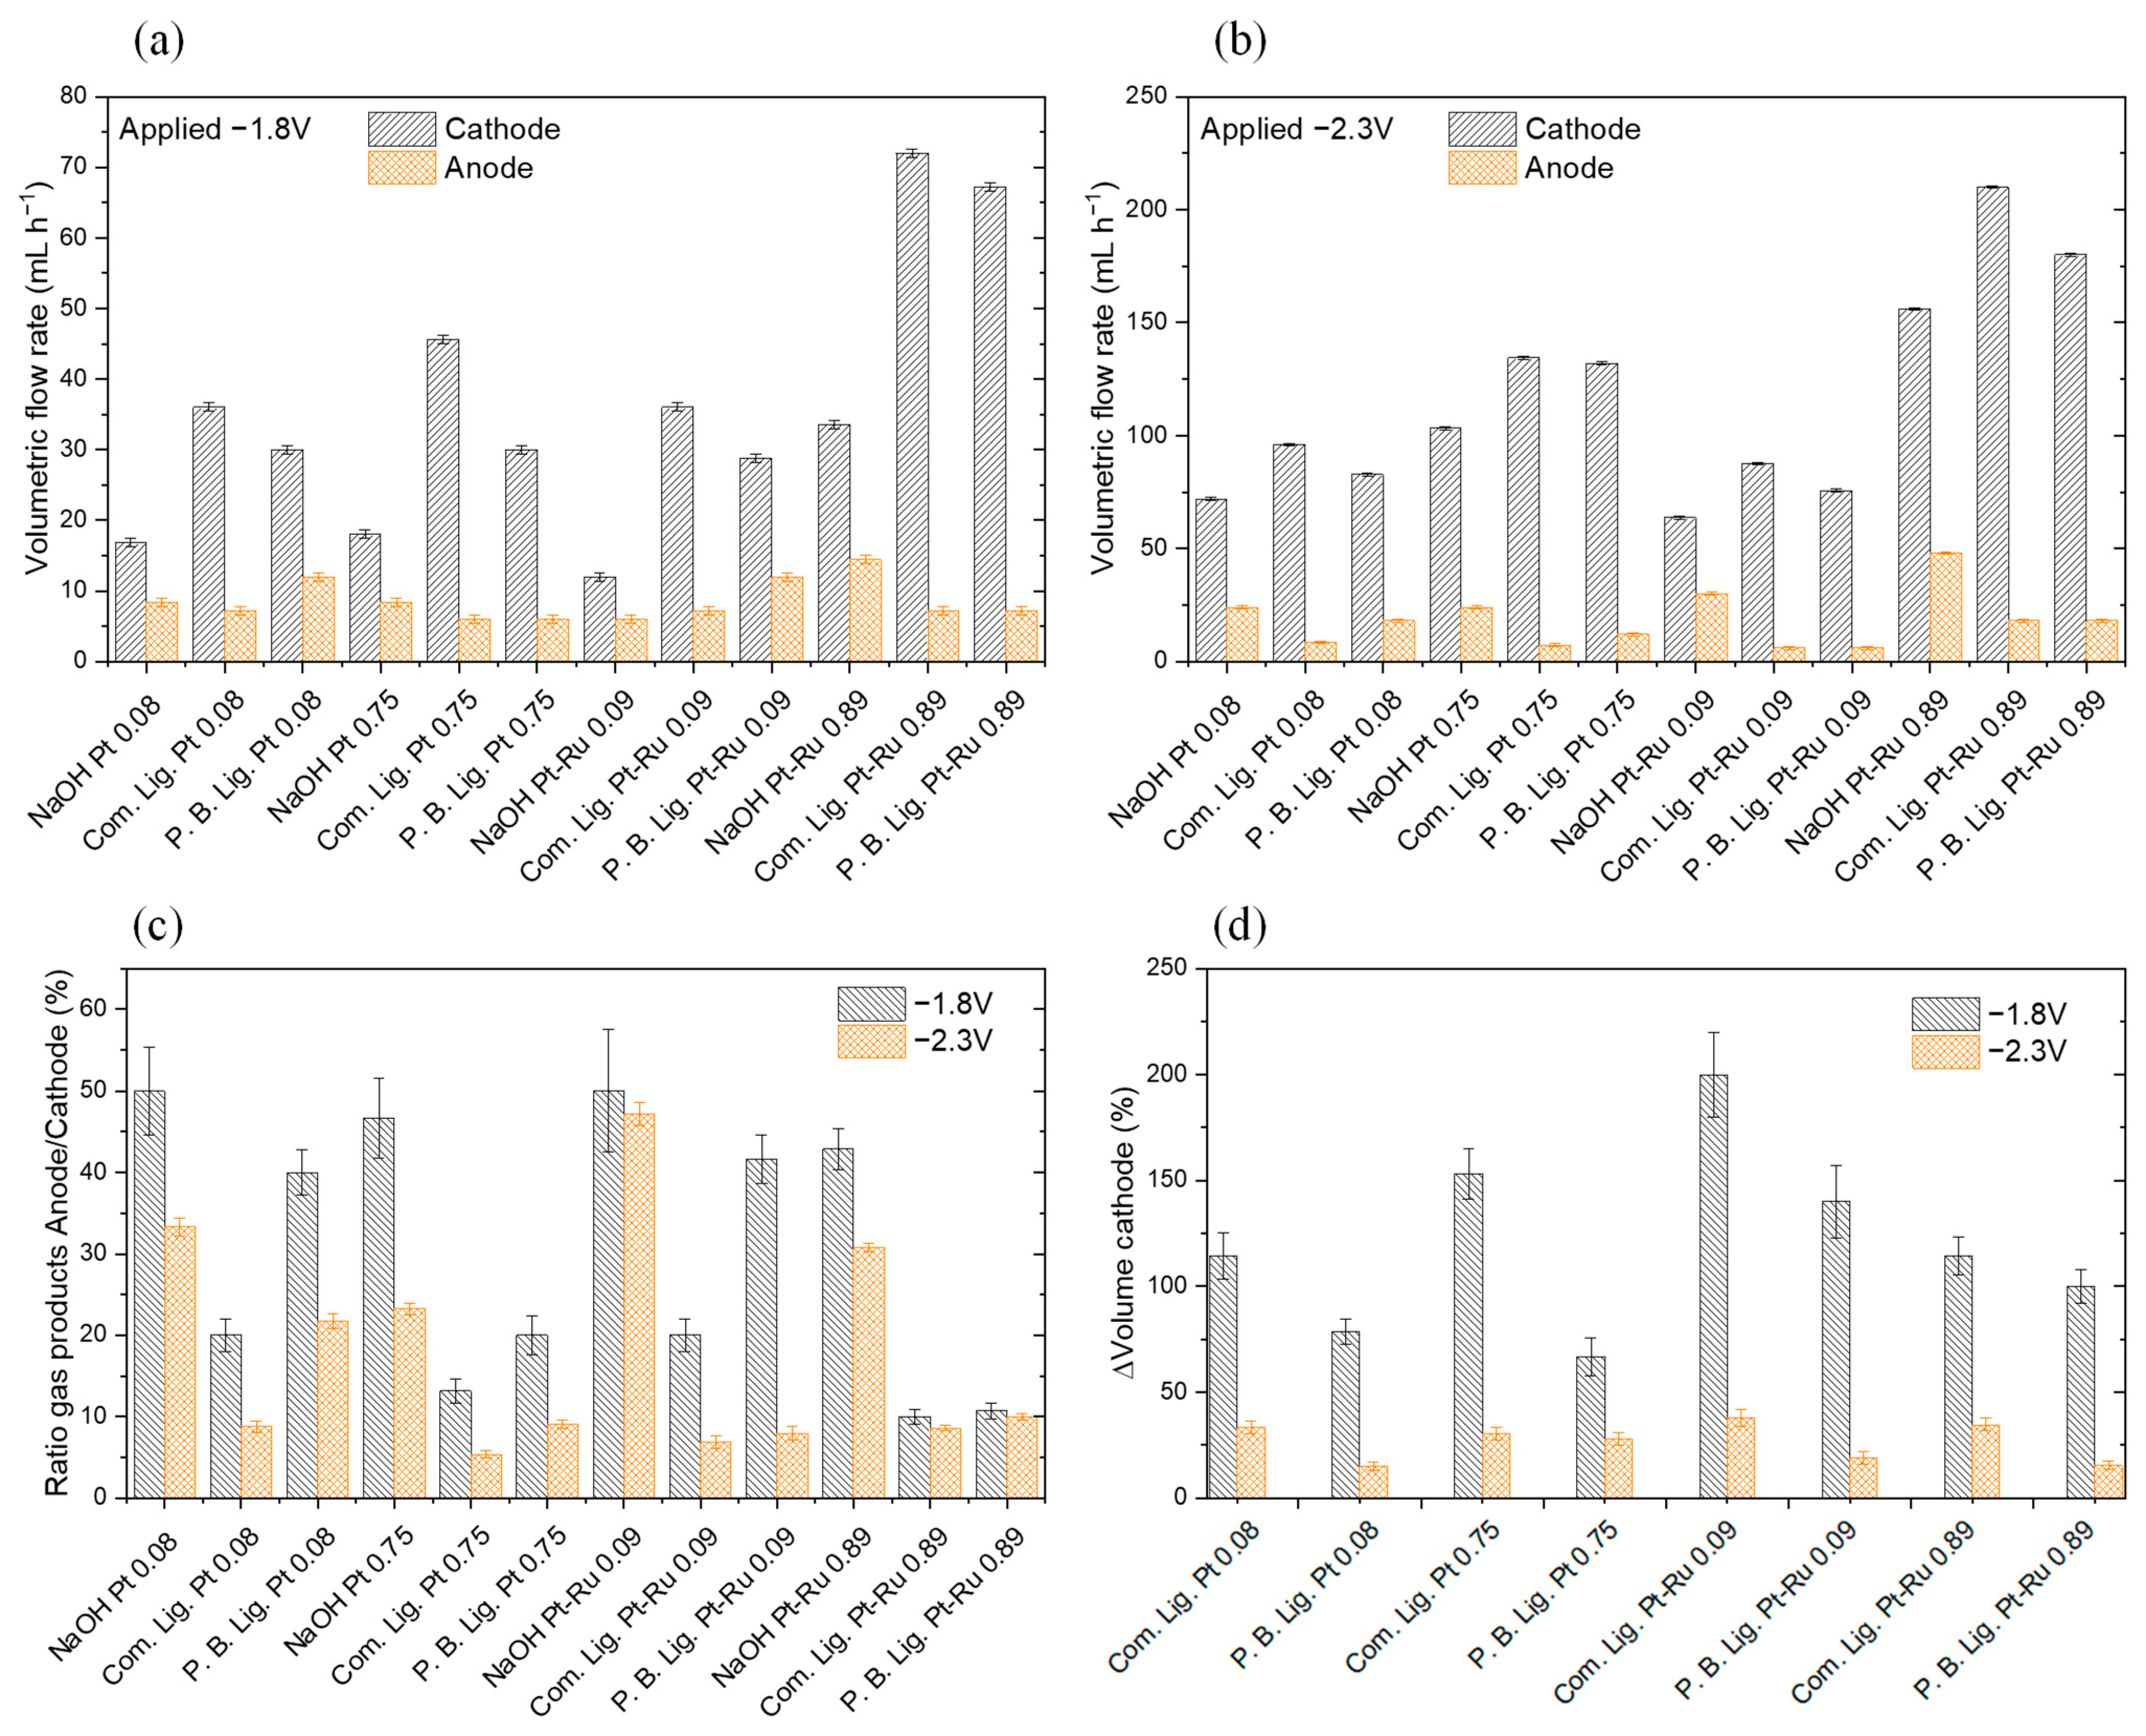
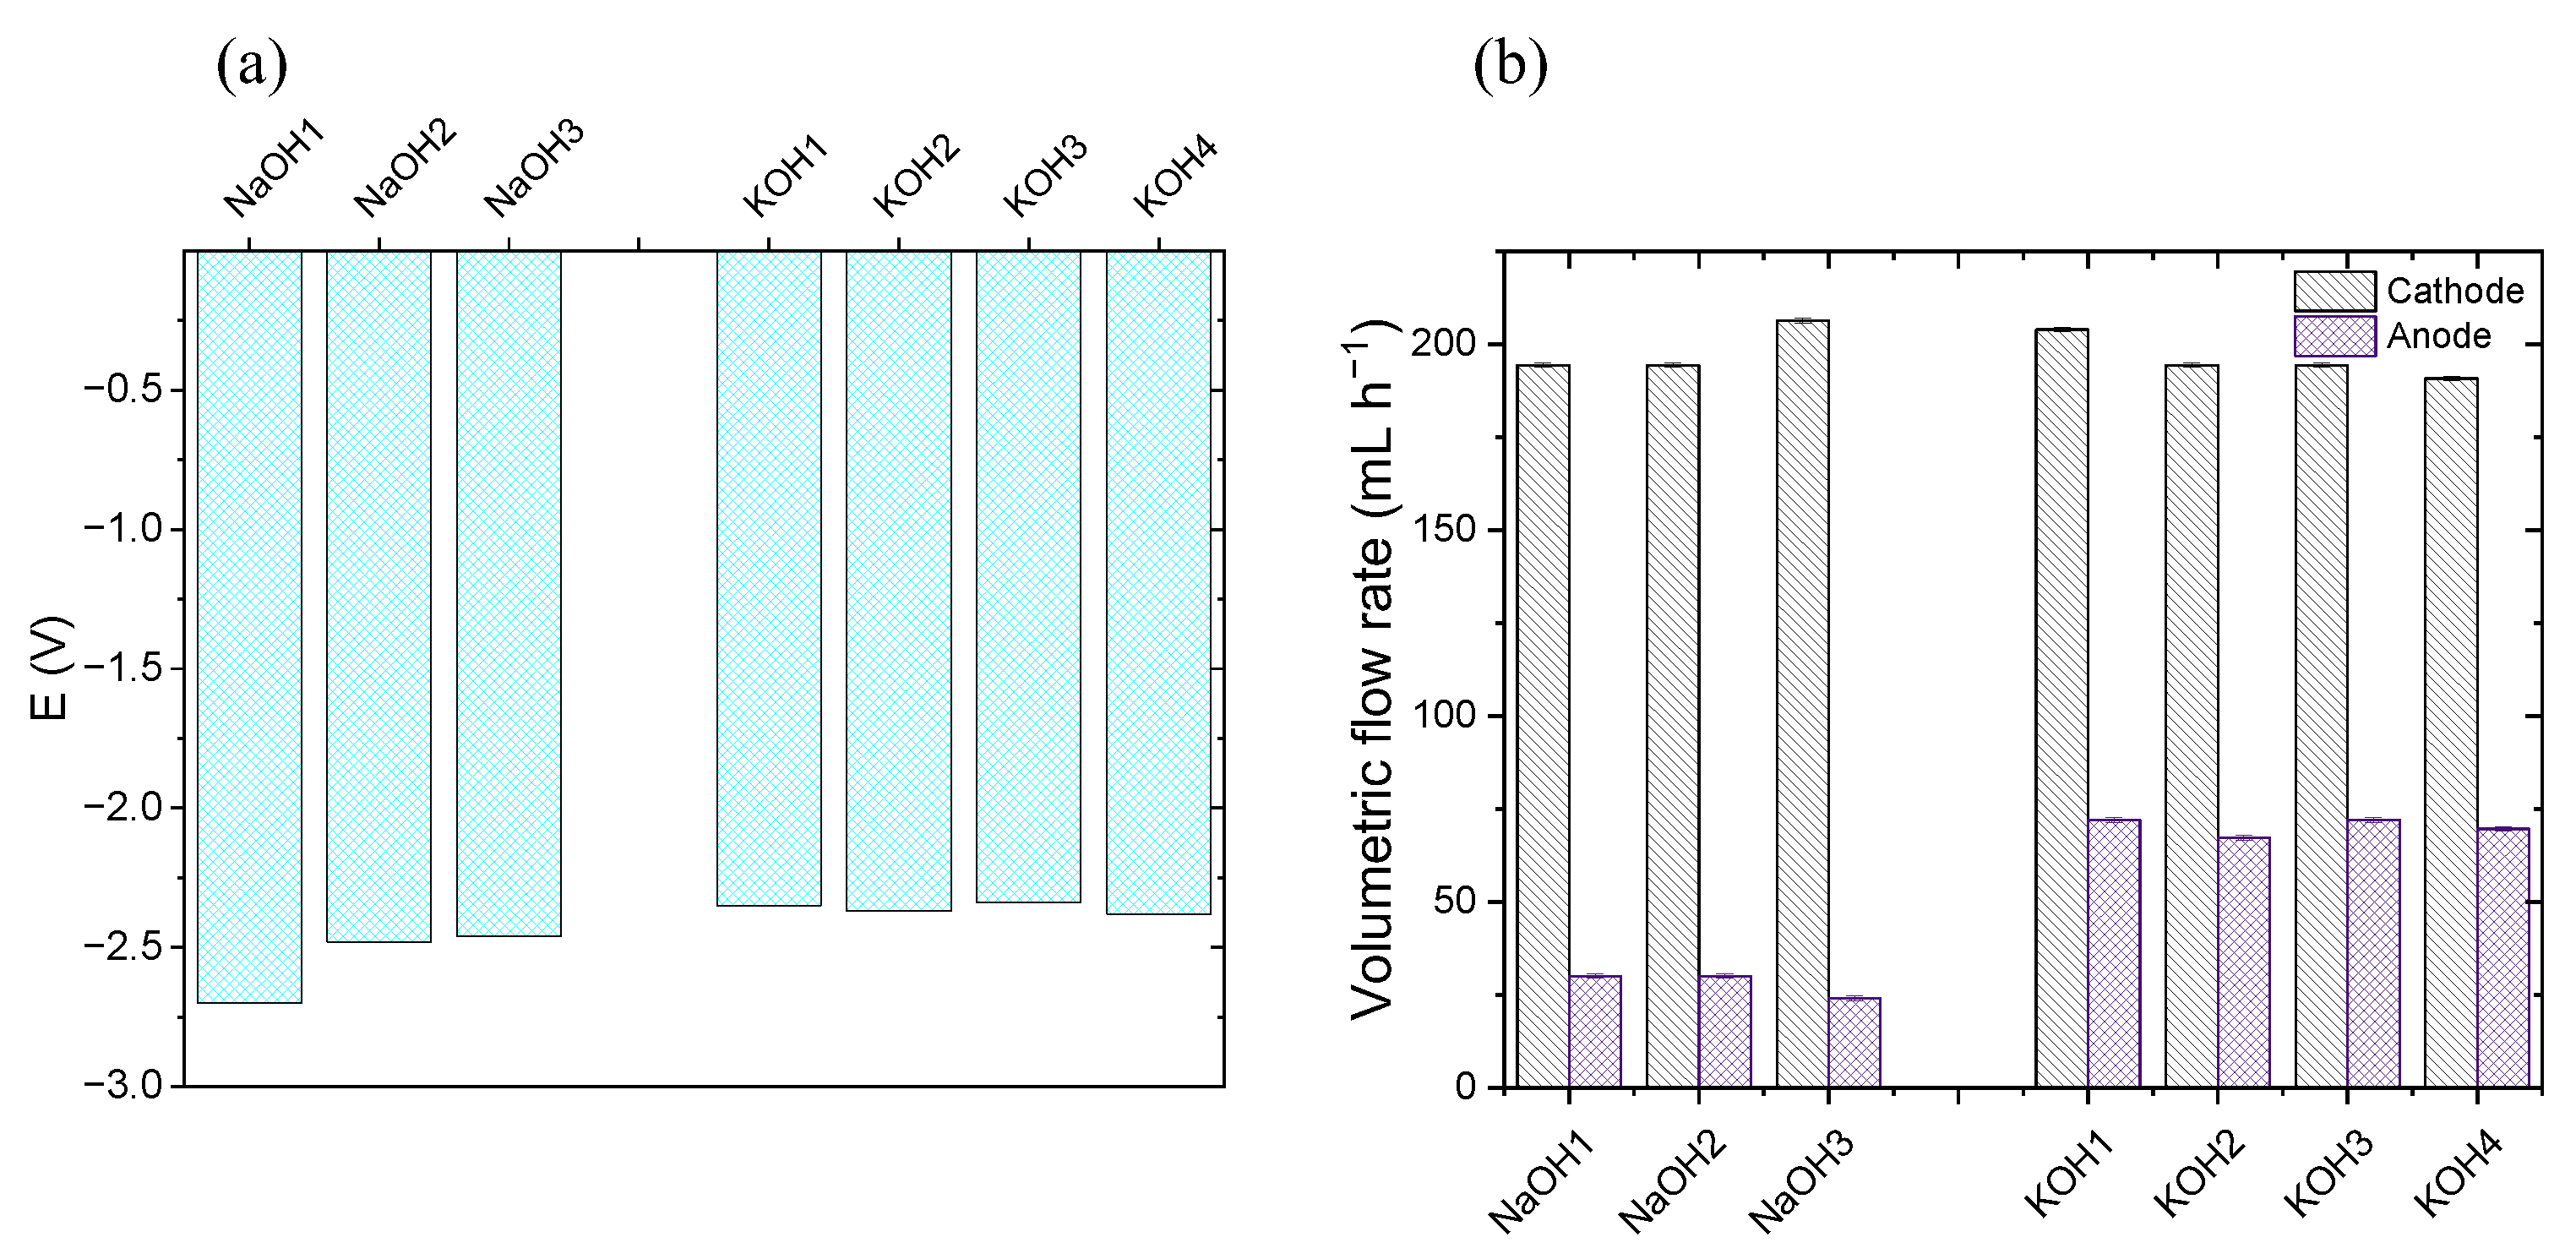
3.4. Polymer Electrolyte Membrane Reactor Flow cell
3.5. Spectroscopic Characterisation of Lignins
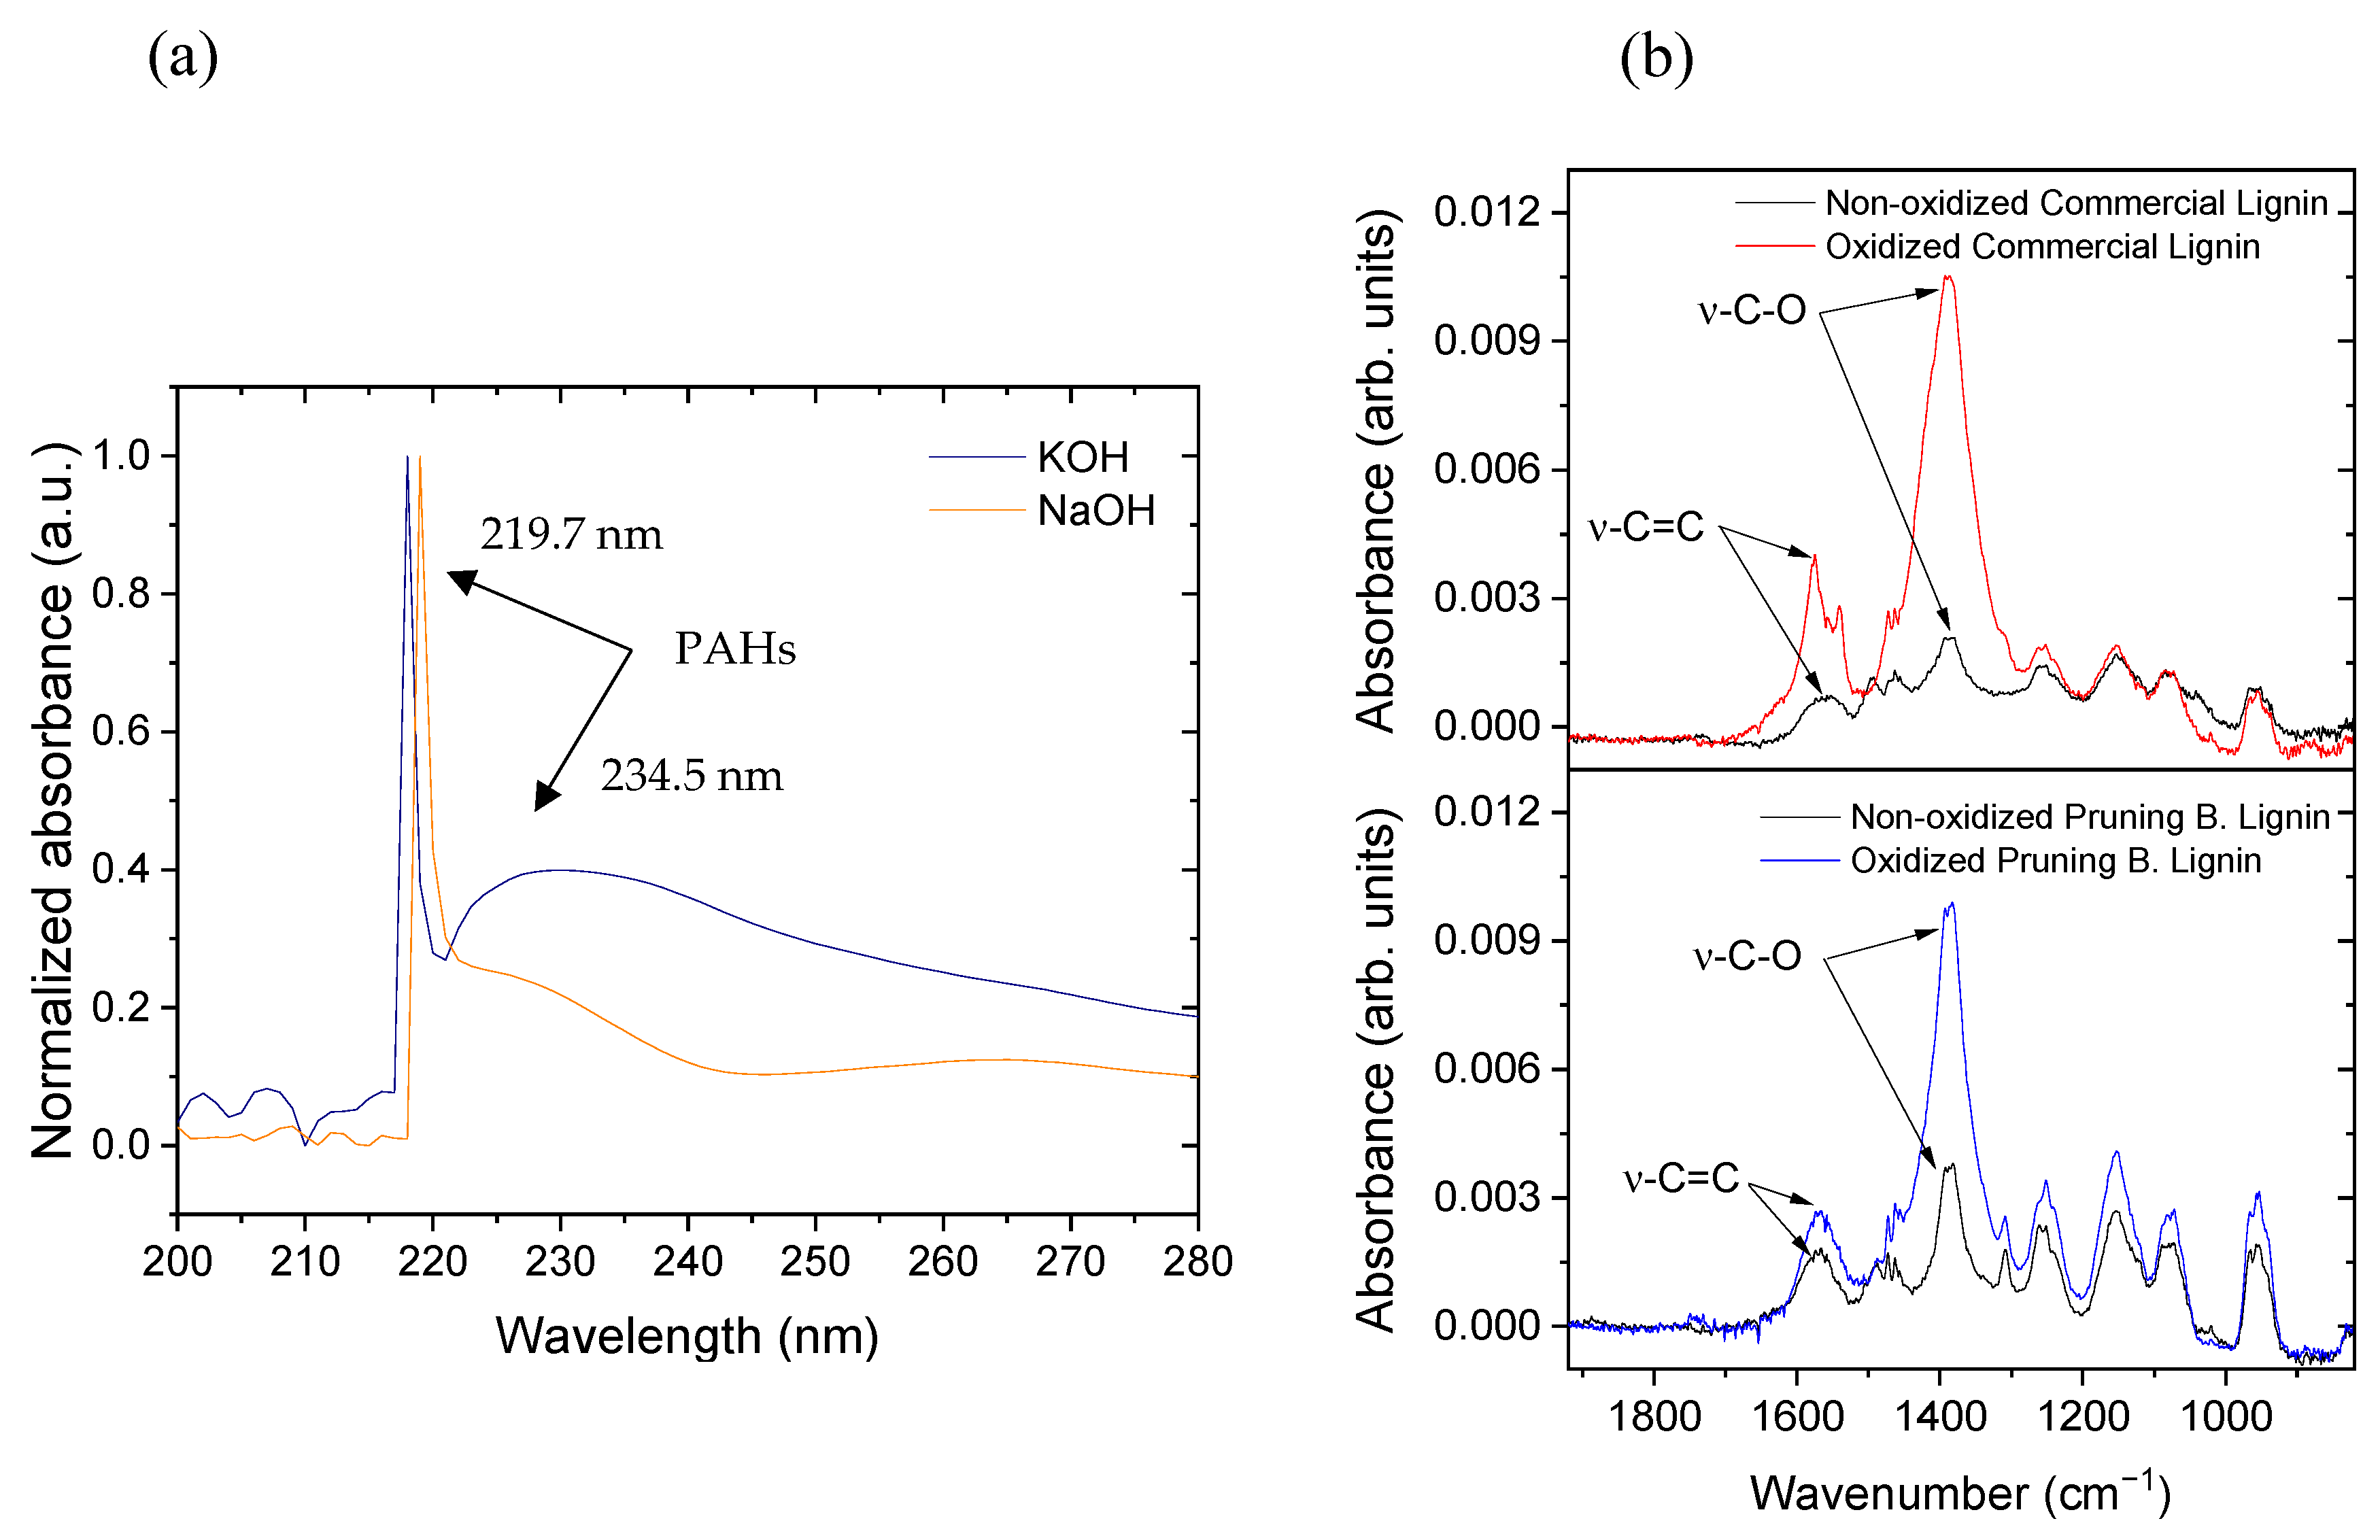
3.5.1. IR Characterisation
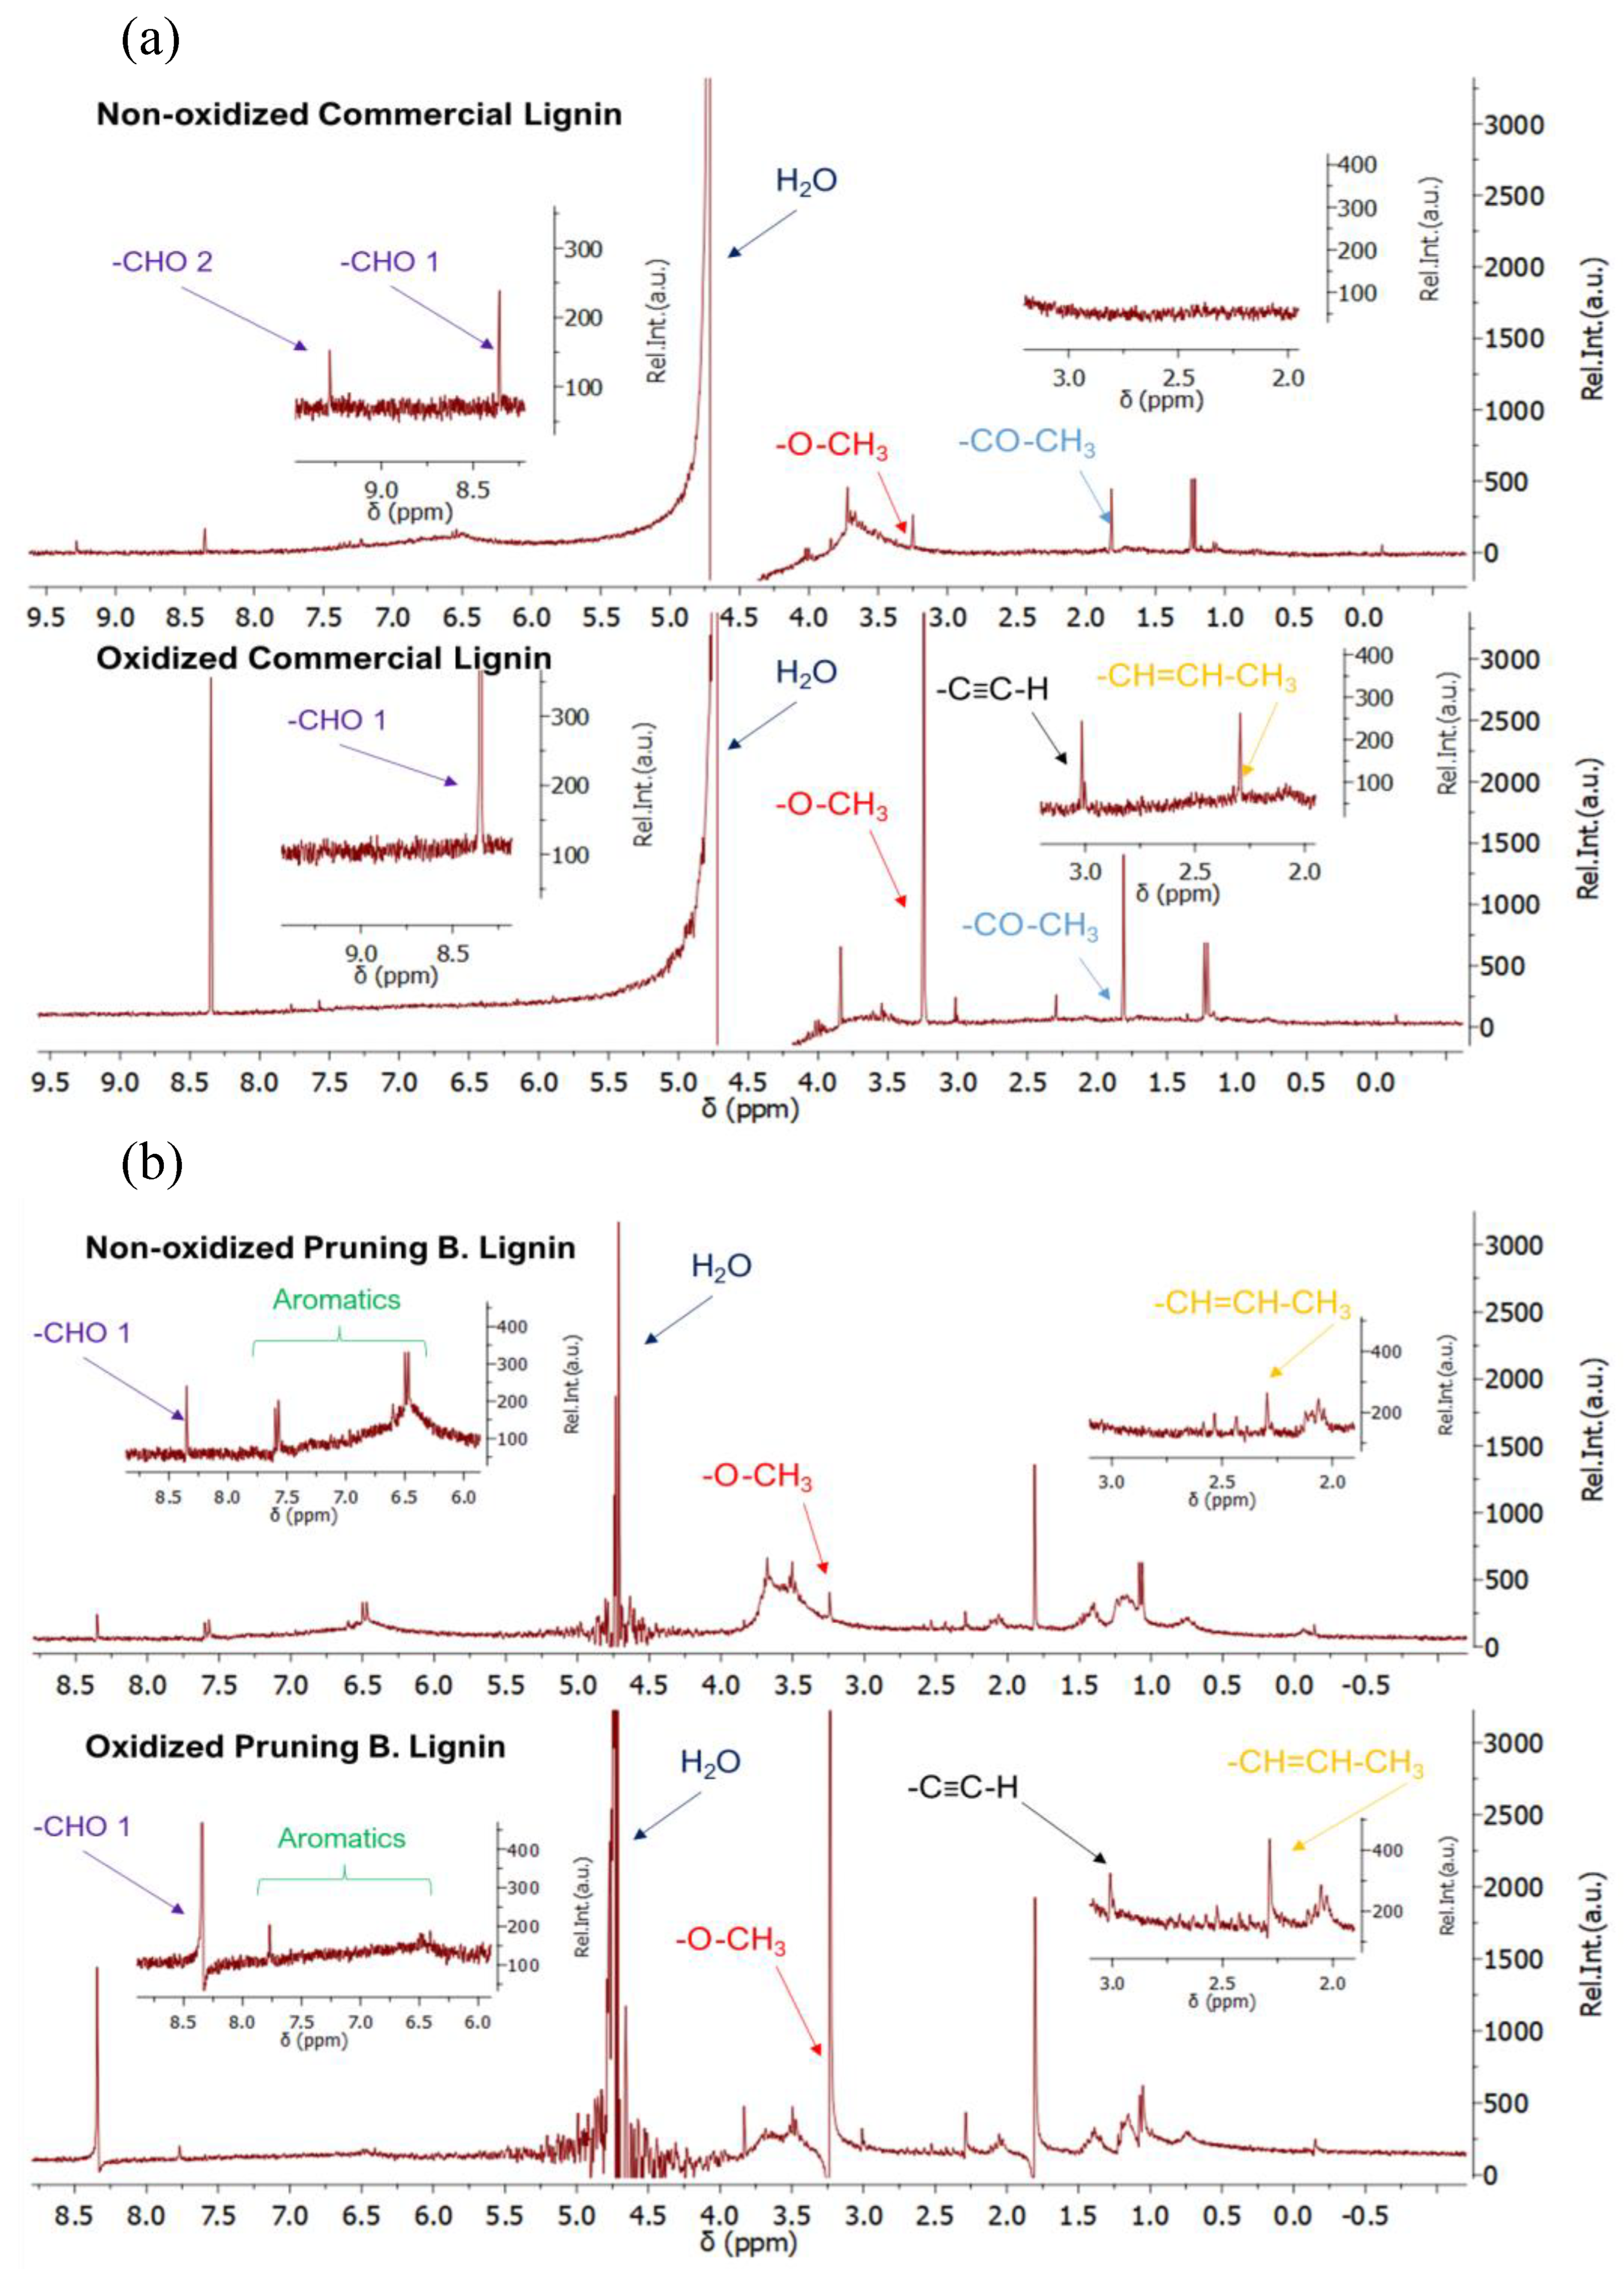
3.5.2. NMR Characterisation
4. Conclusions
Supplementary Materials
Author Contributions
Funding
Institutional Review Board Statement
Informed Consent Statement
Data Availability Statement
Acknowledgments
Conflicts of Interest
References
- Pachauri, R.K.; Allen, M.R.; Barros, V.R.; Broome, J.; Cramer, W.; Christ, R.; Church, J.A.; Clarke, L.; Dahe, Q.; Dasgupta, P.; et al. Climate Change 2014: Synthesis Report. Contribution of Working Groups I, II and III to the Fifth Assessment Report of the Intergovernmental Panel on Climate Change; Pachauri, R.K., Meyer, L., Eds.; IPCC: Geneva, Switzerland, 2014; p. 151. ISBN 978-92-9169-143-2. [Google Scholar]
- Antolini, D.; Piazzi, S.; Menin, L.; Baratieri, M.; Patuzzi, F. High hydrogen content syngas for biofuels production from biomass air gasification: Experimental evaluation of a char-catalyzed steam reforming unit. Int. J. Hydrogen Energy 2022, 47, 27421–27436. [Google Scholar] [CrossRef]
- Toktarova, A.; Göransson, L.; Johnsson, F. Design of Clean Steel Production with Hydrogen: Impact of Electricity System Composition. Energies 2021, 14, 8349. [Google Scholar] [CrossRef]
- Giddey, S.; Badwal, S.; Kulkarni, A. Review of electrochemical ammonia production technologies and materials. Int. J. Hydrogen Energy 2013, 38, 14576–14594. [Google Scholar] [CrossRef]
- Parthasarathy, P.; Narayanan, K.S. Hydrogen production from steam gasification of biomass: Influence of process parameters on hydrogen yield—A review. Renew. Energy 2014, 66, 570–579. [Google Scholar] [CrossRef]
- Balat, H.; Kırtay, E. Hydrogen from biomass—Present scenario and future prospects. Int. J. Hydrogen Energy 2010, 35, 7416–7426. [Google Scholar] [CrossRef]
- Kothari, R.; Buddhi, D.; Sawhney, R. Comparison of environmental and economic aspects of various hydrogen production methods. Renew. Sustain. Energy Rev. 2008, 12, 553–563. [Google Scholar] [CrossRef]
- Ehlers, J.C.; Feidenhans’l, A.A.; Therkildsen, K.T.; Larrazábal, G.O. Affordable Green Hydrogen from Alkaline Water Electrolysis: Key Research Needs from an Industrial Perspective. ACS Energy Lett. 2023, 8, 1502–1509. [Google Scholar] [CrossRef]
- Martinez-Lazaro, A.; Caprì, A.; Gatto, I.; Ledesma-García, J.; Rey-Raap, N.; Arenillas, A.; Espinosa-Lagunes, F.; Baglio, V.; Arriaga, L. NiFe2O4 hierarchical nanoparticles as electrocatalyst for anion exchange membrane water electrolysis. J. Power Sources 2023, 556, 232417. [Google Scholar] [CrossRef]
- Ďurovič, M.; Hnát, J.; Strečková, M.; Bouzek, K. Efficient cathode for the hydrogen evolution reaction in alkaline membrane water electrolysis based on NiCoP embedded in carbon fibres. J. Power Sources 2023, 556, 232506. [Google Scholar] [CrossRef]
- Sampathkumar, S.N.; Ferriday, T.; Middleton, P.; Van Herle, J. Activation of stainless steel 316L anode for anion exchange membrane water electrolysis. Electrochem. Commun. 2023, 146, 107418. [Google Scholar] [CrossRef]
- Trisno, M.L.A.; Dayan, A.; Lee, S.J.; Egert, F.; Gerle, M.; Kraglund, M.R.; Jensen, J.O.; Aili, D.; Roznowska, A.; Michalak, A.; et al. Reinforced gel-state polybenzimidazole hydrogen separators for alkaline water electrolysis. Energy Environ. Sci. 2022, 15, 4362–4375. [Google Scholar] [CrossRef]
- Lv, B.; Yang, Y.; Yang, C.; Huang, Z.; Zhou, Y.; Song, W.; Hao, J.; Shao, Z. Layered double hydroxide composite membrane for advanced alkaline water electrolysis. Int. J. Energy Res. 2022, 46, 11892–11902. [Google Scholar] [CrossRef]
- Naqvi, S.A.H.; Taner, T.; Ozkaymak, M.; Ali, H.M. Hydrogen Production through Alkaline Electrolyzers: A Techno-Economic and Enviro-Economic Analysis. Chem. Eng. Technol. 2023, 46, 474–481. [Google Scholar] [CrossRef]
- Patonia, A.; Poudineh, R. Cost-Competitive Green Hydrogen: How to Lower the Cost of Electrolysers? Oxford Institute for Energy Studies: Oxford, UK, 2022. [Google Scholar]
- Song, J.; Wei, C.; Huang, Z.F.; Liu, C.; Zeng, L.; Wang, X.; Xu, Z.J. A review on fundamentals for designing oxygen evolution electrocatalysts. Chem. Soc. Rev. 2020, 49, 2196–2214. [Google Scholar] [CrossRef] [PubMed]
- Yan, Y.; Xia, B.Y.; Zhao, B.; Wang, X. A review on noble-metal-free bifunctional heterogeneous catalysts for overall electrochemical water splitting. J. Mater. Chem. A 2016, 4, 17587–17603. [Google Scholar] [CrossRef]
- Reier, T.; Oezaslan, M.; Strasser, P. Electrocatalytic Oxygen Evolution Reaction (OER) on Ru, Ir, and Pt Catalysts: A Comparative Study of Nanoparticles and Bulk Materials. ACS Catal. 2012, 2, 1765–1772. [Google Scholar] [CrossRef]
- Ying, J.; Chen, J.-B.; Xiao, Y.-X.; de Torresi, S.I.C.; Ozoemena, K.I.; Yang, X.-Y. Recent advances in Ru-based electrocatalysts for oxygen evolution reaction. J. Mater. Chem. A 2023, 11, 1634–1650. [Google Scholar] [CrossRef]
- Zeng, F.; Mebrahtu, C.; Liao, L.; Beine, A.K.; Palkovits, R. Stability and deactivation of OER electrocatalysts: A review. J. Energy Chem. 2022, 69, 301–329. [Google Scholar] [CrossRef]
- Oliveira, R.C.P.; Mateus, M.; Santos, D.M. Black Liquor Electrolysis for Hydrogen and Lignin Extraction. ECS Trans. 2016, 72, 43–53. [Google Scholar] [CrossRef]
- Gonçalves, J.R.M.; Cecílio, D.M.; Oliveira, R.C.P.; Mateus, M.M.; Santos, D.M.F. Development of an Aspen Plus® Model for the Process of Hydrogen Production by Black Liquor Electrolysis. Symmetry 2022, 14, 1676. [Google Scholar] [CrossRef]
- Coutanceau, C.; Baranton, S. Electrochemical conversion of alcohols for hydrogen production: A short overview. WIREs Energy Environ. 2016, 5, 388–400. [Google Scholar] [CrossRef]
- Ghatak, H.R.; Kumar, S.; Kundu, P. Electrode processes in black liquor electrolysis and their significance for hydrogen production. Int. J. Hydrogen Energy 2008, 33, 2904–2911. [Google Scholar] [CrossRef]
- Ghatak, H.R. Electrolysis of black liquor for hydrogen production: Some initial findings. Int. J. Hydrogen Energy 2006, 31, 934–938. [Google Scholar] [CrossRef]
- Caravaca, A.; de Lucas-Consuegra, A.; Calcerrada, A.; Lobato, J.; Valverde, J.; Dorado, F. From biomass to pure hydrogen: Electrochemical reforming of bio-ethanol in a PEM electrolyser. Appl. Catal. B Environ. 2013, 134–135, 302–309. [Google Scholar] [CrossRef]
- Nong, G.; Zhou, Z.; Wang, S. Generation of Hydrogen, Lignin and Sodium Hydroxide from Pulping Black Liquor by Electrolysis. Energies 2016, 9, 13. [Google Scholar] [CrossRef]
- Qiu, Z.; Martín-Yerga, D.; Lindén, P.A.; Henriksson, G.; Cornell, A. Green hydrogen production via electrochemical conversion of components from alkaline carbohydrate degradation. Int. J. Hydrogen Energy 2022, 47, 3644–3654. [Google Scholar] [CrossRef]
- Liu, W.; Cui, Y.; Du, X.; Zhang, Z.; Chao, Z.; Deng, Y. High efficiency hydrogen evolution from native biomass electrolysis. Energy Environ. Sci. 2016, 9, 467–472. [Google Scholar] [CrossRef]
- Dolle, C.; Neha, N.; Coutanceau, C. Electrochemical hydrogen production from biomass. Curr. Opin. Electrochem. 2022, 31, 100841. [Google Scholar] [CrossRef]
- Sołowski, G.; Shalaby, M.; Abdallah, H.; Shaban, A.; Cenian, A. Production of hydrogen from biomass and its separation using membrane technology. Renew. Sustain. Energy Rev. 2018, 82, 3152–3167. [Google Scholar] [CrossRef]
- Lamy, C. Electrocatalytic oxidation of low weight oxygenated organic compounds: A review on their use as a chemical source to produce either electricity in a Direct Oxidation Fuel Cell or clean hydrogen in an electrolysis cell. J. Electroanal. Chem. 2020, 875, 114426. [Google Scholar] [CrossRef]
- Lamy, C.; Jaubert, T.; Baranton, S.; Coutanceau, C. Clean hydrogen generation through the electrocatalytic oxidation of ethanol in a Proton Exchange Membrane Electrolysis Cell (PEMEC): Effect of the nature and structure of the catalytic anode. J. Power Sources 2014, 245, 927–936. [Google Scholar] [CrossRef]
- Hibino, T.; Kobayashi, K.; Nagao, M.; Teranishi, S. Hydrogen Production by Direct Lignin Electrolysis at Intermediate Temperatures. Chemelectrochem 2017, 4, 3032–3036. [Google Scholar] [CrossRef]
- Lalvani, S.B.; Rajagopal, P. Lignin-Augmented Water Electrolysis. J. Electrochem. Soc. 1992, 139, L1–L2. [Google Scholar] [CrossRef]
- Beliaeva, K.; Grimaldos-Osorio, N.; Ruiz-López, E.; Burel, L.; Vernoux, P.; Caravaca, A. New insights into lignin electrolysis on nickel-based electrocatalysts: Electrochemical performances before and after oxygen evolution. Int. J. Hydrogen Energy 2021, 46, 35752–35764. [Google Scholar] [CrossRef]
- Caravaca, A.; Garcia-Lorefice, W.E.; Gil, S.; Consuegra, A.D.L.; Vernoux, P. Towards a sustainable technology for H2 production: Direct lignin electrolysis in a continuous-flow Polymer Electrolyte Membrane reactor. Electrochem. Commun. 2019, 100, 43–47. [Google Scholar] [CrossRef]
- González-Cobos, J.; Prévot, M.S.; Vernoux, P. Electrolysis of lignin for production of chemicals and hydrogen. Curr. Opin. Electrochem. 2023, 39, 101255. [Google Scholar] [CrossRef]
- Lalvani, S.; Rajagopal, P. Hydrogen Production from Lignin-Water Solution by Electrolysis. Holzforschung 1993, 47, 283–286. [Google Scholar] [CrossRef]
- Khalid, M.; De, B.S.; Singh, A.; Shahgaldi, S. Lignin Electrolysis at Room Temperature on Nickel Foam for Hydrogen Generation: Performance Evaluation and Effect of Flow Rate. Catalysts 2022, 12, 1646. [Google Scholar] [CrossRef]
- Li, J.; Zhou, W.; Huang, Y.; Gao, J. Lignin-Assisted Water Electrolysis for Energy-Saving Hydrogen Production With Ti/PbO2 as the Anode. Front. Energy Res. 2021, 9, 762346. [Google Scholar] [CrossRef]
- Bateni, F.; NaderiNasrabadi, M.; Ghahremani, R.; Staser, J.A. Low-Cost Nanostructured Electrocatalysts for Hydrogen Evolution in an Anion Exchange Membrane Lignin Electrolysis Cell. J. Electrochem. Soc. 2019, 166, F1037–F1046. [Google Scholar] [CrossRef]
- Du, X.; Zhang, H.; Sullivan, K.P.; Gogoi, P.; Deng, Y. Electrochemical Lignin Conversion. Chemsuschem 2020, 13, 4318–4343. [Google Scholar] [CrossRef]
- King, J.; Chuang, S.S. Photoelectrochemical conversion of lignin to hydrogen: Lignin as an electron donor. Catal. Commun. 2021, 149, 106219. [Google Scholar] [CrossRef]
- Aro, T.; Fatehi, P. Production and Application of Lignosulfonates and Sulfonated Lignin. Chemsuschem 2017, 10, 1861–1877. [Google Scholar] [CrossRef] [PubMed]
- Ponnusamy, V.K.; Nguyen, D.D.; Dharmaraja, J.; Shobana, S.; Banu, J.R.; Saratale, R.G.; Chang, S.W.; Kumar, G. A review on lignin structure, pretreatments, fermentation reactions and biorefinery potential. Bioresour. Technol. 2019, 271, 462–472. [Google Scholar] [CrossRef] [PubMed]
- Dixon, R.A.; Barros-Rios, J. Lignin biosynthesis: Old roads revisited and new roads explored. Open Biol. 2019, 9, 190215. [Google Scholar] [CrossRef]
- Brown, S.A. Lignins. Annu. Rev. Plant Physiol. 1966, 17, 223–244. [Google Scholar] [CrossRef]
- Calvo-Flores, F.G.; Dobado, J.A. Lignin as Renewable Raw Material. Chemsuschem 2010, 3, 1227–1235. [Google Scholar] [CrossRef]
- Hatakeyama, H.; Hatakeyama, T. Lignin Structure, Properties, and Applications. In Biopolymers: Lignin, Proteins, Bioactive Nanocomposites; Abe, A., Dusek, K., Kobayashi, S., Eds.; Advances in Polymer Science; Springer: Berlin/Heidelberg, Germany, 2010; pp. 1–63. ISBN 978-3-642-13630-6. [Google Scholar]
- Sifontes, M.C.; Domine, M.E. Lignina, estructura y aplicaciones: Métodos de despolimerización para la obtención de derivados aromáticos de interés industrial. Av. Cienc. Ing. 2013, 4, 15–46. [Google Scholar]
- Ralph, J.; Lundquist, K.; Brunow, G.; Lu, F.; Kim, H.; Schatz, P.F.; Marita, J.M.; Hatfield, R.D.; Ralph, S.A.; Christensen, J.H.; et al. Lignins: Natural polymers from oxidative coupling of 4-hydroxyphenyl- propanoids. Phytochem. Rev. 2004, 3, 29–60. [Google Scholar] [CrossRef]
- Hu, X.; Tian, X.; Lin, Y.-W.; Wang, Z. Nickel foam and stainless steel mesh as electrocatalysts for hydrogen evolution reaction, oxygen evolution reaction and overall water splitting in alkaline media. RSC Adv. 2019, 9, 31563–31571. [Google Scholar] [CrossRef]
- Lara-Serrano, M.; Sboiu, D.M.; Morales-Delarosa, S.; Campos-Martin, J.M. Selective Fragmentation of Lignocellulosic Biomass with ZnCl2·4H2O Using a Dissolution/Precipitation Method. Appl. Sci. 2023, 13, 2953. [Google Scholar] [CrossRef]
- Lara-Serrano, M.; Morales-Delarosa, S.; Campos-Martín, J.M.; Fierro, J.L.G. Fractionation of Lignocellulosic Biomass by Selective Precipitation from Ionic Liquid Dissolution. Appl. Sci. 2019, 9, 1862. [Google Scholar] [CrossRef]
- Melro, E.; Alves, L.; Antunes, F.E.; Medronho, B. A brief overview on lignin dissolution. J. Mol. Liq. 2018, 265, 578–584. [Google Scholar] [CrossRef]
- Evstigneev, E.I. Factors affecting lignin solubility. Russ. J. Appl. Chem. 2011, 84, 1040–1045. [Google Scholar] [CrossRef]
- Frías-Ferrer, Á.; González-García, J.; Sáez, V.; de León, C.P.; Walsh, F.C. The effects of manifold flow on mass transport in electrochemical filter-press reactors. AIChE J. 2008, 54, 811–823. [Google Scholar] [CrossRef]
- Yi, Y.; Weinberg, G.; Prenzel, M.; Greiner, M.; Heumann, S.; Becker, S.; Schlögl, R. Electrochemical corrosion of a glassy carbon electrode. Catal. Today 2017, 295, 32–40. [Google Scholar] [CrossRef]
- Bussetti, G.; Campione, M.; Bossi, A.; Goletti, C.; Duò, L.; Ciccacci, F.; Biroli, A.O. In situ atomic force microscopy: The case study of graphite immersed in aqueous NaOH electrolyte. Eur. Phys. J. Plus 2020, 135, 329. [Google Scholar] [CrossRef]
- Zhou, X.; Jin, H.; Ma, Z.; Li, N.; Li, G.; Zhang, T.; Lu, P.; Gong, X. Biochar sacrificial anode assisted water electrolysis for hydrogen production. Int. J. Hydrogen Energy 2022, 47, 36482–36492. [Google Scholar] [CrossRef]
- Amikam, G.; Fridman-Bishop, N.; Gendel, Y. Biochar-Assisted Iron-Mediated Water Electrolysis Process for Hydrogen Production. ACS Omega 2020, 5, 31908–31917. [Google Scholar] [CrossRef]
- Chen, L.; Nakamoto, R.; Kudo, S.; Asano, S.; Hayashi, J.-I. Biochar-Assisted Water Electrolysis. Energy Fuels 2019, 33, 11246–11252. [Google Scholar] [CrossRef]


| Total H2 Efficiency (%) | H2 Efficiency on the Cathode (%) | ||
|---|---|---|---|
| Pt 0.08 | NaOH | 92.8 | 91.8 |
| Commercial Lig. | 95.1 | 94.1 | |
| Pruning B. Lig. | 96.9 | 95.9 | |
| Pt 0.75 | NaOH | 90.4 | 89.4 |
| Commercial Lig. | 92.2 | 91.2 | |
| Pruning B. Lig. | 91.6 | 90.6 | |
| Pt-Ru 0.09 | NaOH | 94.5 | 93.5 |
| Commercial Lig. | 95.1 | 94.1 | |
| Pruning B. Lig. | 95.1 | 94.1 | |
| Pt-Ru 0.89 | NaOH | 92.2 | 91.2 |
| Commercial Lig. | 93.9 | 92.9 | |
| Pruning B. Lig. | 93.9 | 92.9 |
Disclaimer/Publisher’s Note: The statements, opinions and data contained in all publications are solely those of the individual author(s) and contributor(s) and not of MDPI and/or the editor(s). MDPI and/or the editor(s) disclaim responsibility for any injury to people or property resulting from any ideas, methods, instructions or products referred to in the content. |
© 2023 by the authors. Licensee MDPI, Basel, Switzerland. This article is an open access article distributed under the terms and conditions of the Creative Commons Attribution (CC BY) license (https://creativecommons.org/licenses/by/4.0/).
Share and Cite
Rodríguez-Fernández, J.-E.; Rojo, M.; Avilés-Moreno, J.R.; Ocón, P. Clean H2 Production by Lignin-Assisted Electrolysis in a Polymer Electrolyte Membrane Flow Reactor. Materials 2023, 16, 3525. https://doi.org/10.3390/ma16093525
Rodríguez-Fernández J-E, Rojo M, Avilés-Moreno JR, Ocón P. Clean H2 Production by Lignin-Assisted Electrolysis in a Polymer Electrolyte Membrane Flow Reactor. Materials. 2023; 16(9):3525. https://doi.org/10.3390/ma16093525
Chicago/Turabian StyleRodríguez-Fernández, José-Enrique, María Rojo, Juan Ramón Avilés-Moreno, and Pilar Ocón. 2023. "Clean H2 Production by Lignin-Assisted Electrolysis in a Polymer Electrolyte Membrane Flow Reactor" Materials 16, no. 9: 3525. https://doi.org/10.3390/ma16093525