
Improvement of the Surface Properties of Polyether Ether Ketone via Arc Evaporation for Biomedical Applications
 ,
,  , , and
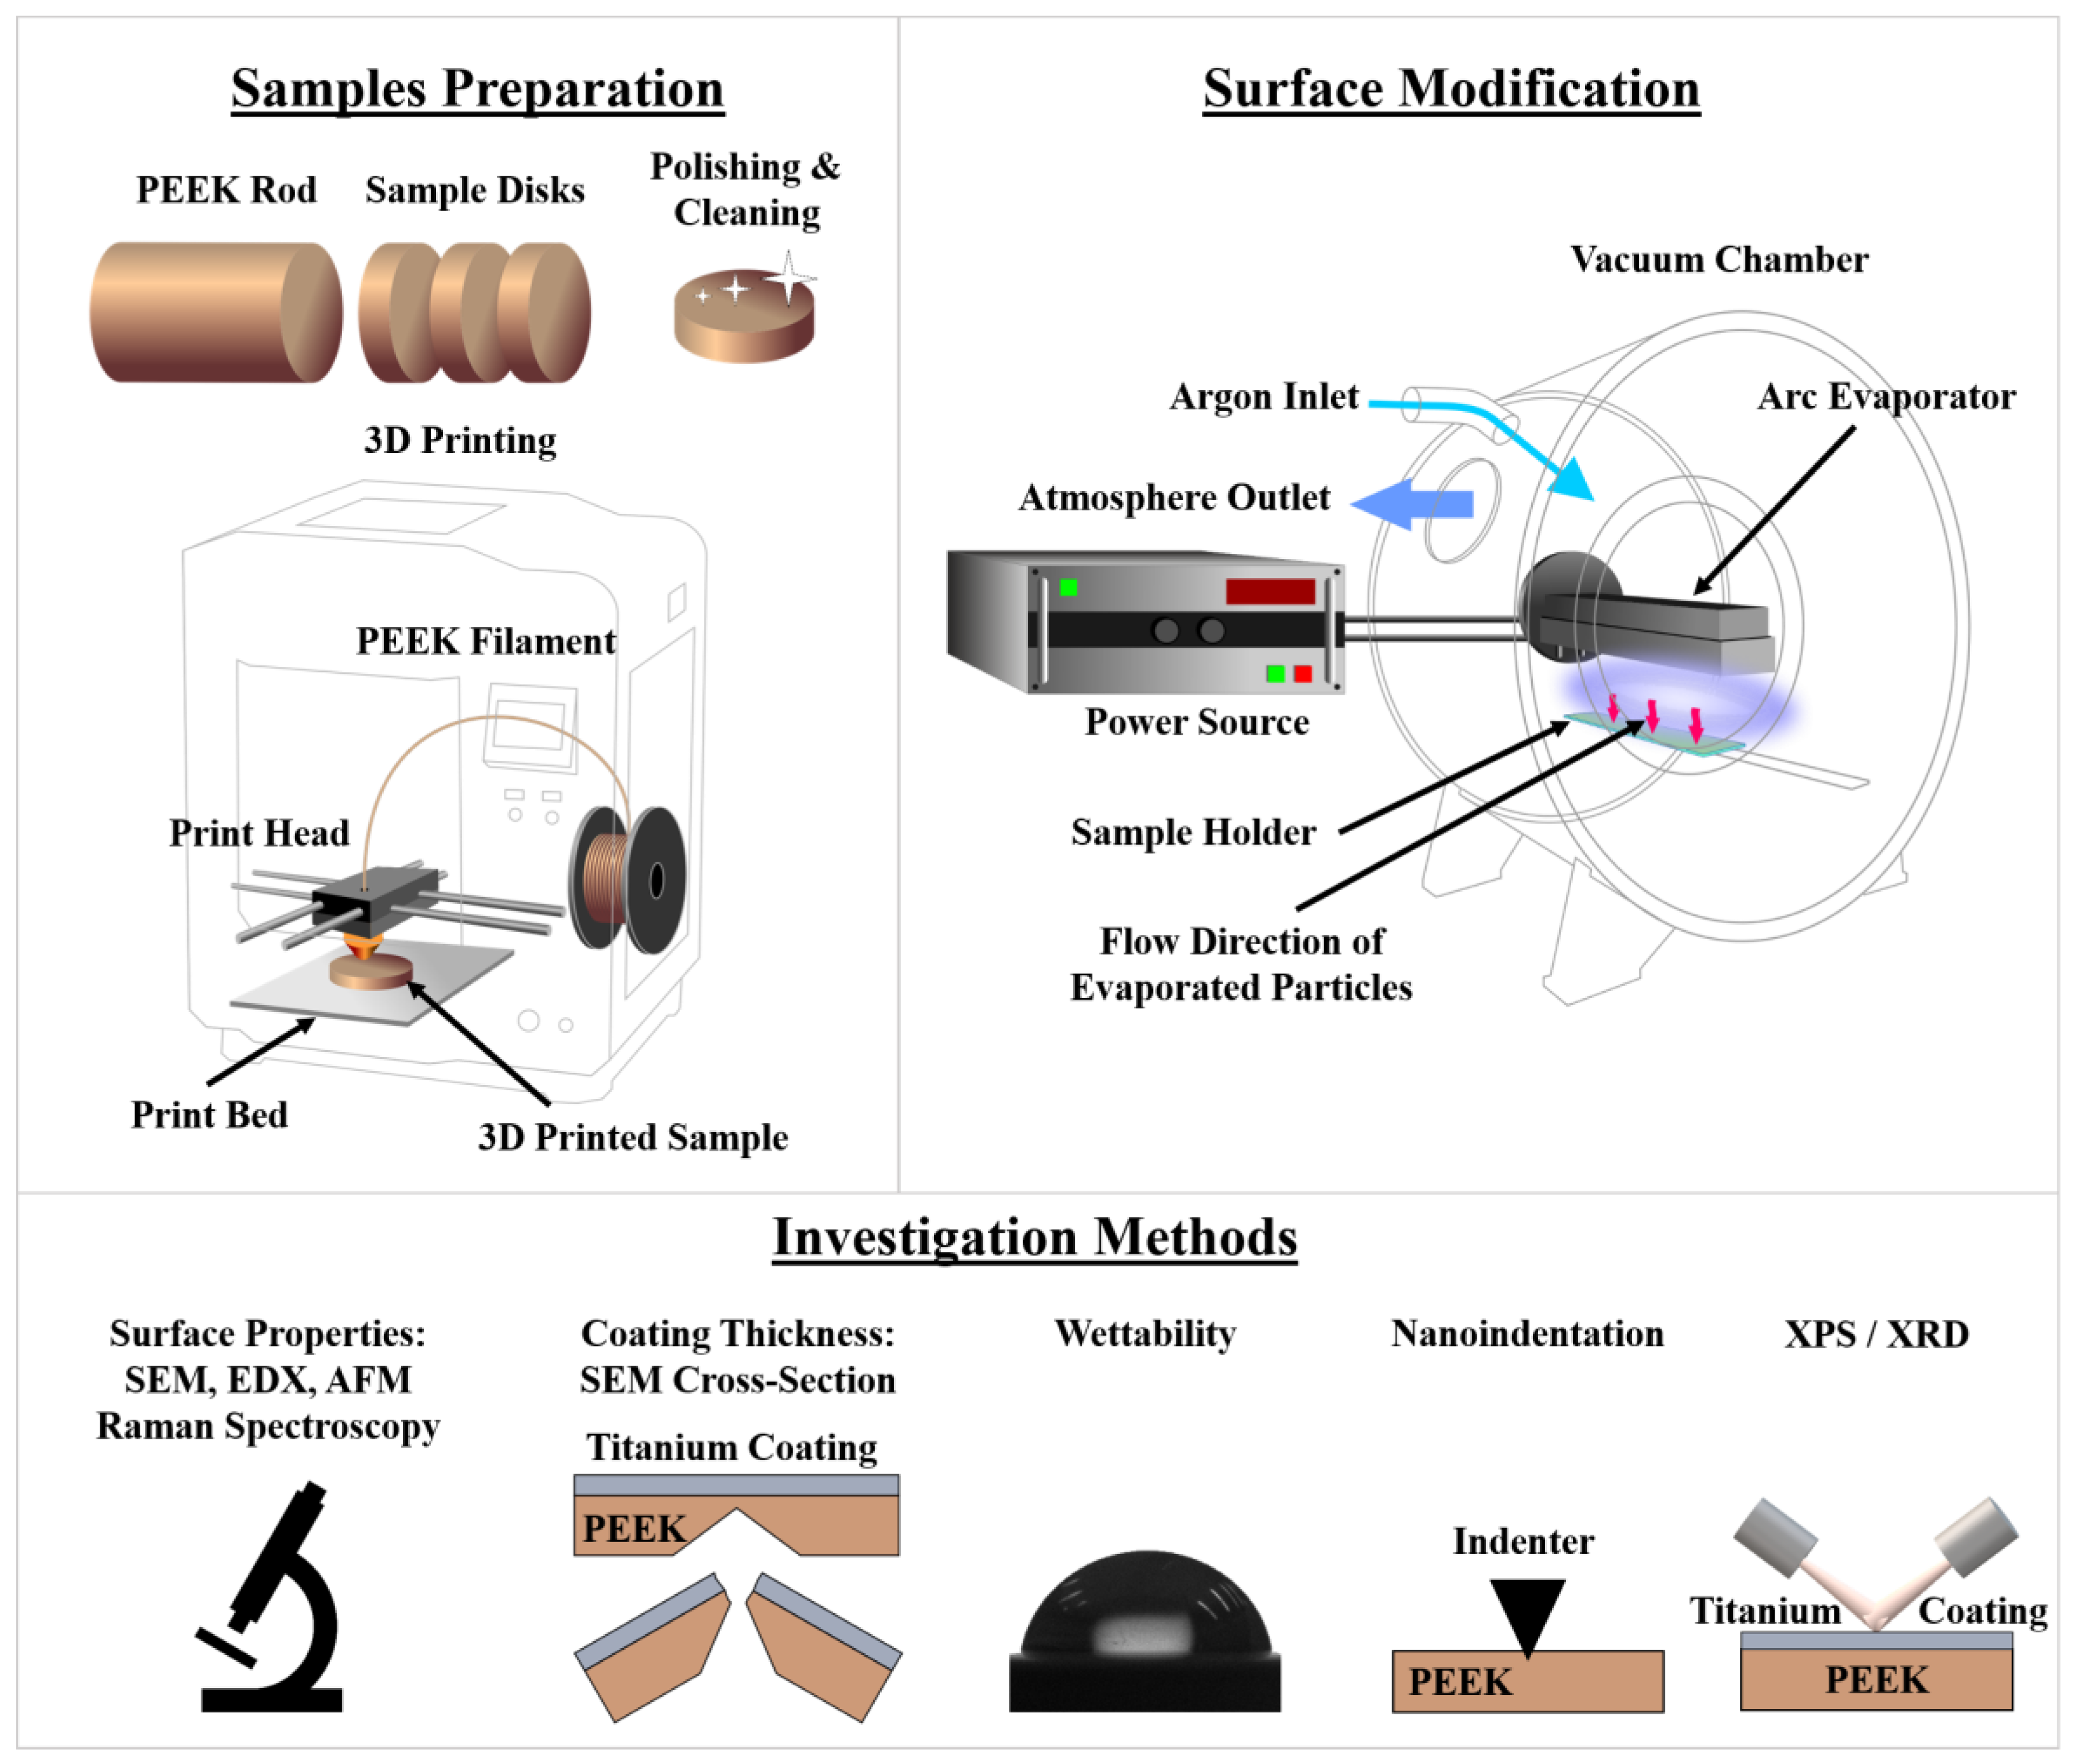
Abstract
:1. Introduction
2. Materials and Methods
2.1. Substrate Preparation
2.2. Surface Modification Parameters
2.3. Investigation Methods
3. Results and Discussion
4. Conclusions
Supplementary Materials
Author Contributions
Funding
Data Availability Statement
Acknowledgments
Conflicts of Interest
References
- Bencharit, S.; Byrd, W.C.; Altarawneh, S.; Hosseini, B.; Leong, A.; Reside, G.; Morelli, T.; Offenbacher, S. Development and Applications of Porous Tantalum Trabecular Metal-Enhanced Titanium Dental Implants. Clin. Implant Dent. Relat. Res. 2014, 16, 817–826. [Google Scholar] [CrossRef] [Green Version]
- Sidambe, A. Biocompatibility of Advanced Manufactured Titanium Implants—A Review. Materials 2014, 7, 8168–8188. [Google Scholar] [CrossRef] [PubMed] [Green Version]
- Özcan, M.; Hämmerle, C. Titanium as a Reconstruction and Implant Material in Dentistry: Advantages and Pitfalls. Materials 2012, 5, 1528–1545. [Google Scholar] [CrossRef] [Green Version]
- Pereira, A.F.; Javaheri, B.; Pitsillides, A.A.; Shefelbine, S.J. Predicting Cortical Bone Adaptation to Axial Loading in the Mouse Tibia. J. R. Soc. Interface 2015, 12, 20150590. [Google Scholar] [CrossRef] [Green Version]
- Bertrand, E.; Gloriant, T.; Gordin, D.M.; Vasilescu, E.; Drob, P.; Vasilescu, C.; Drob, S.I. Synthesis and Characterisation of a New Superelastic Ti–25Ta–25Nb Biomedical Alloy. J. Mech. Behav. Biomed. Mater. 2010, 3, 559–564. [Google Scholar] [CrossRef]
- Liao, C.; Li, Y.; Tjong, S.C. Polyetheretherketone and Its Composites for Bone Replacement and Regeneration. Polymers 2020, 12, 2858. [Google Scholar] [CrossRef] [PubMed]
- Pulipaka, A.; Gide, K.M.; Beheshti, A.; Bagheri, Z.S. Effect of 3D Printing Process Parameters on Surface and Mechanical Properties of FFF-Printed PEEK. J. Manuf. Process. 2023, 85, 368–386. [Google Scholar] [CrossRef]
- Luo, C.; Liu, Y.; Peng, B.; Chen, M.; Liu, Z.; Li, Z.; Kuang, H.; Gong, B.; Li, Z.; Sun, H. PEEK for Oral Applications: Recent Advances in Mechanical and Adhesive Properties. Polymers 2023, 15, 386. [Google Scholar] [CrossRef]
- Mishra, S.; Chowdhary, R. PEEK Materials as an Alternative to Titanium in Dental Implants: A Systematic Review. Clin. Implant Dent. Relat. Res. 2019, 21, 208–222. [Google Scholar] [CrossRef] [PubMed] [Green Version]
- Zheng, Z.; Liu, P.; Zhang, X.; Xin, J.; Wang, Y.; Zou, X.; Mei, X.; Zhang, S.; Zhang, S. Strategies to Improve Bioactive and Antibacterial Properties of Polyetheretherketone (PEEK) for Use as Orthopedic Implants. Mater. Today Bio 2022, 16, 100402. [Google Scholar] [CrossRef] [PubMed]
- Popa, M.V.; Moreno, J.M.C.; Popa, M.; Vasilescu, E.; Drob, P.; Vasilescu, C.; Drob, S.I. Electrochemical Deposition of Bioactive Coatings on Ti and Ti–6Al–4V Surfaces. Surf. Coat. Technol. 2011, 205, 4776–4783. [Google Scholar] [CrossRef]
- Safavi, M.S.; Surmeneva, M.A.; Surmenev, R.A.; Khalil-Allafi, J. RF-Magnetron Sputter Deposited Hydroxyapatite-Based Composite & Multilayer Coatings: A Systematic Review from Mechanical, Corrosion, and Biological Points of View. Ceram. Int. 2021, 47, 3031–3053. [Google Scholar] [CrossRef]
- Liu, X.; Huang, A.; Ding, C.; Chu, P.K. Bioactivity and Cytocompatibility of Zirconia (ZrO2) Films Fabricated by Cathodic Arc Deposition. Biomaterials 2006, 27, 3904–3911. [Google Scholar] [CrossRef] [PubMed]
- Almasi, D.; Izman, S.; Assadian, M.; Ghanbari, M.; Kadir, M.R.A. Crystalline Ha Coating on Peek via Chemical Deposition. Appl. Surf. Sci. 2014, 314, 1034–1040. [Google Scholar] [CrossRef]
- Arias, D.F.; Arango, Y.C.; Devia, A. Study of TiN and ZrN Thin Films Grown by Cathodic Arc Technique. Appl. Surf. Sci. 2006, 253, 1683–1690. [Google Scholar] [CrossRef]
- Ji, Y.; Yu, X.; Zhu, H. Fabrication of Mg Coating on PEEK and Antibacterial Evaluation for Bone Application. Coatings 2021, 11, 1010. [Google Scholar] [CrossRef]
- Hu, Q.; Wang, Y.; Liu, S.; Liu, Q.; Zhang, H. 3D Printed Polyetheretherketone Bone Tissue Substitute Modified via Amoxicillin-Laden Hydroxyapatite Nanocoating. J. Mater. Sci. 2022, 57, 18601–18614. [Google Scholar] [CrossRef]
- Wu, C.; Zeng, B.; Shen, D.; Deng, J.; Zhong, L.; Hu, H.; Wang, X.; Li, H.; Xu, L.; Deng, Y. Biomechanical and Osteointegration Study of 3D-Printed Porous PEEK Hydroxyapatite-Coated Scaffolds. J. Biomater. Sci. Polym. Ed. 2023, 34, 435–448. [Google Scholar] [CrossRef]
- Boonpok, S.; Koonrungsrisomboon, K.; Suttiat, K.; Yavirach, P.; Boonyawan, D. Dissolution Behavior of Hydrothermally Treated Hydroxyapatite–Titanium Nitride Films Coated on PEEK: In Vitro Study. J. Funct. Biomater. 2022, 13, 99. [Google Scholar] [CrossRef]
- Kjellin, P.; Danielsson, K.; Håkansson, J.; Agrenius, K.; Andersson, T.; Stenlund, P. Biomechanical and Histomorphometric Evaluation of Skin Integration on Titanium and PEEK Implants with Different Surface Treatments. J. Mater. Sci. Mater. Med. 2022, 33, 68. [Google Scholar] [CrossRef]
- Ferroni, L.; D’Amora, U.; Leo, S.; Tremoli, E.; Raucci, M.G.; Ronca, A.; Ambrosio, L.; Zavan, B. PEEK and Hyaluronan-Based 3D Printed Structures: Promising Combination to Improve Bone Regeneration. Molecules 2022, 27, 8749. [Google Scholar] [CrossRef] [PubMed]
- Pidhatika, B.; Widyaya, V.T.; Nalam, P.C.; Swasono, Y.A.; Ardhani, R. Surface Modifications of High-Performance Polymer Polyetheretherketone (PEEK) to Improve Its Biological Performance in Dentistry. Polymers 2022, 14, 5526. [Google Scholar] [CrossRef] [PubMed]
- Singhatanadgige, W.; Tangchitcharoen, N.; Kerr, S.J.; Tanasansomboon, T.; Yingsakmongkol, W.; Kotheeranurak, V.; Limthongkul, W. A Comparison of Polyetheretherketone and Titanium-Coated Polyetheretherketone in Minimally Invasive Transforaminal Lumbar Interbody Fusion: A Randomized Clinical Trial. World Neurosurg. 2022, 168, e471–e479. [Google Scholar] [CrossRef] [PubMed]
- Godlewski, B.; Bebenek, A.; Dominiak, M.; Karpinski, G.; Cieslik, P.; Pawelczyk, T. PEEK versus Titanium-Coated PEEK Cervical Cages: Fusion Rate. Acta Neurochir. 2022, 164, 1501–1507. [Google Scholar] [CrossRef]
- Oliver, W.C.; Pharr, G.M. An Improved Technique for Determining Hardness and Elastic Modulus Using Load and Displacement Sensing Indentation Experiments. J. Mater. Res. 1992, 7, 1564–1583. [Google Scholar] [CrossRef]
- Kuprin, A.S.; Ovcharenko, V.D.; Gilewicz, A.; Tolmachova, G.N.; Kolodiy, I.V.; Vasilenko, R.L.; Kuznetsova, T.; Lapitskaya, V.; Warcholinski, B. Structural, Mechanical and Tribological Properties of Cr-V-N Coatings Deposited by Cathodic Arc Evaporation. Tribol. Int. 2022, 165, 107246. [Google Scholar] [CrossRef]
- Vereschaka, A.; Milovich, F.; Andreev, N.; Sotova, C.; Alexandrov, I.; Muranov, A.; Mikhailov, M.; Tatarkanov, A. Investigation of the Structure and Phase Composition of the Microdroplets Formed during the Deposition of PVD Coatings. Surf. Coat. Technol. 2022, 441, 128574. [Google Scholar] [CrossRef]
- Kameneva, A.; Antonova, N.; Pesin, M.; Makarov, V.; Nikitin, S.; Bublik, N. Structural and Phase Transformations Control in Ti and Al Cathode Materials, WC-Co Substrate, and Ti1-XAlxN Coating to Improve Their Physico-Mechanical and Wear Properties. Int. J. Refract. Metals. Hard. Mater. 2022, 102, 105726. [Google Scholar] [CrossRef]
- Macak, J.M.; Tsuchiya, H.; Taveira, L.; Ghicov, A.; Schmuki, P. Self-Organized Nanotubular Oxide Layers on Ti-6Al-7Nb and Ti-6Al-4V Formed by Anodization in NH4F Solutions. J. Biomed. Mater. Res. A 2005, 75A, 928–933. [Google Scholar] [CrossRef]
- Münstedt, H.; Grossmann, J. Surface Modifications of Polyetheretherketone (PEEK): Results from the Literature and Special Studies of Copper-Coated Films. Polymers 2022, 14, 4797. [Google Scholar] [CrossRef]
- Zhang, Y.; Chen, K.; Zhang, J.; Huang, K.; Liang, Y.; Hu, H.; Xu, X.; Chen, D.; Chang, M.; Wang, Y. Dense and Uniform Growth of TiO2 Nanoparticles on the Pomelo-Peel-Derived Biochar Surface for Efficient Photocatalytic Antibiotic Degradation. J. Environ. Chem. Eng. 2023, 11, 109358. [Google Scholar] [CrossRef]
- Liu, S.; Bao, L.; Jia, Q.; Qiao, X.; Wang, D. Controllable Preparation of Black Titanium Dioxide and Its Wave-Absorbing Properties. Appl. Phys. A Mater. Sci. Process. 2023, 129, 119. [Google Scholar] [CrossRef]
- Zhu, Y.; Cao, Z.; Peng, Y.; Hu, L.; Guney, T.; Tang, B. Facile Surface Modification Method for Synergistically Enhancing the Biocompatibility and Bioactivity of Poly(Ether Ether Ketone) That Induced Osteodifferentiation. ACS Appl. Mater. Interfaces 2019, 11, 27503–27511. [Google Scholar] [CrossRef]
- Yao, J.H.; Guo, H. Shadowing Instability in Three Dimensions. Phys. Rev. E 1993, 47, 1007. [Google Scholar] [CrossRef]
- Drotar, J.T.; Zhao, Y.; Lu, T.; Wang, G. Surface Roughening in Shadowing Growth and Etching in 2 + 1 Dimensions. Phys. Rev. B 2000, 62, 2118. [Google Scholar] [CrossRef] [Green Version]
- Turkin, A.A.; Pei, Y.T.; Shaha, K.P.; Chen, C.Q.; Vainshtein, D.I.; De Hosson, J.T.M. On the Evolution of Film Roughness during Magnetron Sputtering Deposition. J. Appl. Phys. 2010, 108, 094330. [Google Scholar] [CrossRef] [Green Version]
- Lin, J.; Cai, X.; Liu, Z.; Liu, N.; Xie, M.; Zhou, B.; Wang, H.; Guo, Z. Anti-liquid-Interfering and Bacterially Antiadhesive Strategy for Highly Stretchable and Ultrasensitive Strain Sensors Based on Cassie-Baxter Wetting State. Adv. Funct. Mater. 2020, 30, 2000398. [Google Scholar] [CrossRef]
- Kuznetsov, G.V.; Feoktistov, D.V.; Orlova, E.G.; Zykov, I.Y.; Batishcheva, K.A. The Influence of the Drop Formation Rate at Spreading over a Microstructured Surface on the Contact Angle. Thermophys. Aeromechanics 2018, 25, 237–244. [Google Scholar] [CrossRef]
- Hallab, N.J.; Bundy, K.J.; O’Connor, K.; Clark, R.; Moses, R.L. Cell Adhesion to Biomaterials: Correlations between Surface Charge, Surface Roughness, Adsorbed Protein, and Cell Morphology. J. Long Term Eff. Med. Implants 1995, 5, 209–231. [Google Scholar] [PubMed]
- Hallab, N.J.; Bundy, K.J.; O’Connor, K.; Moses, R.L.; Jacobs, J.J. Evaluation of Metallic and Polymeric Biomaterial Surface Energy and Surface Roughness Characteristics for Directed Cell Adhesion. Tissue Eng. 2001, 7, 55–71. [Google Scholar] [CrossRef] [Green Version]
- PeŠŠková, V.; Kubies, D.; Hulejová, H.; Himmlová, L. The Influence of Implant Surface Properties on Cell Adhesion and Proliferation. J. Mater. Sci. Mater. Med. 2007, 18, 465–473. [Google Scholar] [CrossRef] [PubMed]
- Al-Noaman, A.; Charles, S.; Rawlinson, F. A Novel Bioactive Glass/Graphene Oxide Composite Coating for a Polyether Ether Ketone-Based Dental Implant. Eur. J. Oral. Sci. 2023, 131, e12915. [Google Scholar] [CrossRef] [PubMed]
- Eufinger, K.; Poelman, D.; Poelman, H.; De Gryse, R.; Marin, G.B. Photocatalytic Activity of Dc Magnetron Sputter Deposited Amorphous TiO2 Thin Films. Appl. Surf. Sci. 2007, 254, 148–152. [Google Scholar] [CrossRef]
- Hrubý, J.; Vavrečková, Š.; Masaryk, L.; Sojka, A.; Navarro-Giraldo, J.; Bartoš, M.; Herchel, R.; Moncol, J.; Nemec, I.; Neugebauer, P. Deposition of Tetracoordinate Co(II) Complex with Chalcone Ligands on Graphene. Molecules 2020, 25, 5021. [Google Scholar] [CrossRef]
- Challagulla, S.; Tarafder, K.; Ganesan, R.; Roy, S. Structure Sensitive Photocatalytic Reduction of Nitroarenes over TiO2. Sci. Rep. 2017, 7, 8783. [Google Scholar] [CrossRef] [PubMed]
- Chen, W.; Zhang, X.; Tan, D.; Xu, P.; Yang, B.; Shi, K.; Zhu, B.; Liu, Q.; Lei, Y.; Liu, S.; et al. Improvement in Mechanical Properties of 3D-Printed PEEK Structure by Nonsolvent Vapor Annealing. Macromol. Rapid Commun. 2022, 43, 2100874. [Google Scholar] [CrossRef]
- Yang, D.; Cao, Y.; Zhang, Z.; Yin, Y.; Li, D. Effects of Crystallinity Control on Mechanical Properties of 3D-Printed Short-Carbon-Fiber-Reinforced Polyether Ether Ketone Composites. Polym. Test. 2021, 97, 107149. [Google Scholar] [CrossRef]


Disclaimer/Publisher’s Note: The statements, opinions and data contained in all publications are solely those of the individual author(s) and contributor(s) and not of MDPI and/or the editor(s). MDPI and/or the editor(s) disclaim responsibility for any injury to people or property resulting from any ideas, methods, instructions or products referred to in the content. |
© 2023 by the authors. Licensee MDPI, Basel, Switzerland. This article is an open access article distributed under the terms and conditions of the Creative Commons Attribution (CC BY) license (https://creativecommons.org/licenses/by/4.0/).
Share and Cite
Fedotkin, A.Y.; Akimchenko, I.O.; Tran, T.-H.; Shugurov, A.R.; Shesterikov, E.V.; Kozelskaya, A.I.; Rutkowski, S.; Tverdokhlebov, S.I. Improvement of the Surface Properties of Polyether Ether Ketone via Arc Evaporation for Biomedical Applications. Materials 2023, 16, 2990. https://doi.org/10.3390/ma16082990
Fedotkin AY, Akimchenko IO, Tran T-H, Shugurov AR, Shesterikov EV, Kozelskaya AI, Rutkowski S, Tverdokhlebov SI. Improvement of the Surface Properties of Polyether Ether Ketone via Arc Evaporation for Biomedical Applications. Materials. 2023; 16(8):2990. https://doi.org/10.3390/ma16082990
Chicago/Turabian StyleFedotkin, Alexander Y., Igor O. Akimchenko, Tuan-Hoang Tran, Artur R. Shugurov, Evgeniy V. Shesterikov, Anna I. Kozelskaya, Sven Rutkowski, and Sergei I. Tverdokhlebov. 2023. "Improvement of the Surface Properties of Polyether Ether Ketone via Arc Evaporation for Biomedical Applications" Materials 16, no. 8: 2990. https://doi.org/10.3390/ma16082990