
Preparation of Butyl Acrylate Copolymer Emulsion and Its Regulation Effect on Cement Hydration
Abstract
:1. Introduction
2. Materials and Methods
2.1. Materials
2.1.1. Raw Materials for Synthesizing Polymer Emulsions
2.1.2. Cementitious Materials
2.1.3. ISO Standard Sand
2.2. Methods
2.2.1. Preparation Method of Polymer Emulsion
2.2.2. Characterization of Polymer Emulsion
- Solid content test.
- The steps for determining the solid content of an emulsion are as follows:
- Prepare the sample: Dry a flat-bottomed weighing bottle with a diameter of 50 mm in a constant temperature drying oven until it reaches a constant weight. Weigh 1 g of the prepared polymer emulsion sample into the weighing bottle (accurate to 0.0001 g) and allow it to self-level. Place the bottle in the drying oven with the shelf positioned at a height of 2/3 of the oven, and control the temperature at around 105 °C. After drying to a constant weight, remove the bottle and cool it to room temperature in a desiccator before weighing.
- The solid content (S) is calculated using the following formula:
- .
- M—the weight of the original sample.
- m1—the weight of the weighing bottle before adding the sample.
- m2—the weight of the weighing bottle with the dried sample.
- Centrifugal stability test.
- Inject the emulsion into a centrifuge tube, centrifuge at a speed of 4000 r·min−1 for 15 min in a centrifuge, and observe if it separates into layers. The polymer emulsion prepared in this study does not separate into layers within six months and exhibits good stability.
- Fourier-transform infrared (FTIR).
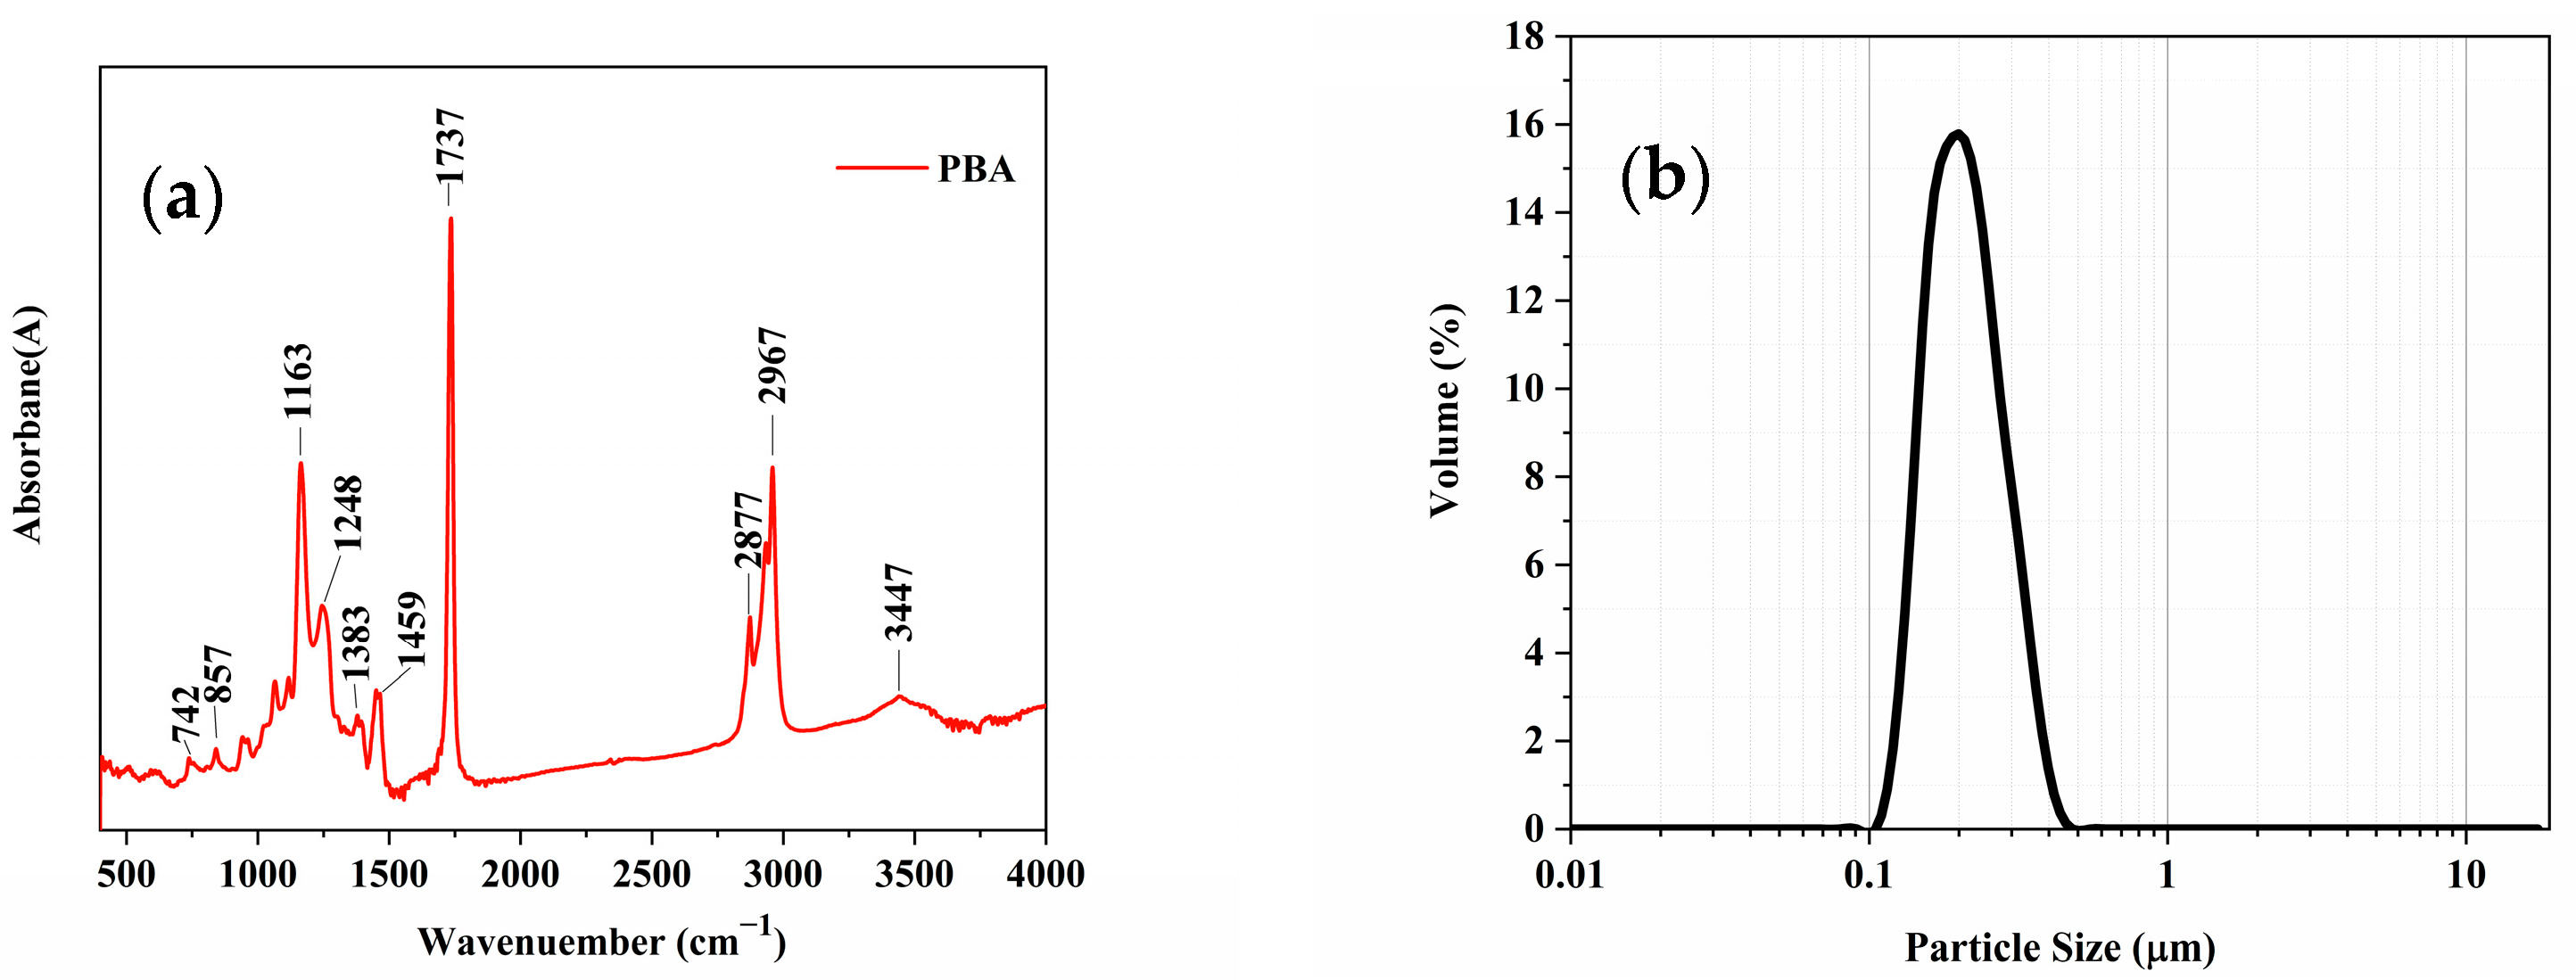
- FTIR (Fourier-transform infrared) spectroscopy was used to characterize the polymer emulsion. The instrument used was Nicolet IS5 FTIR from Thermo Fisher in Massachusetts, USA. The purified polymer was dissolved in ethyl acetate and dropped onto a potassium bromide (KBr) plate, and then dried to form a thin film. The sample was measured in transmission mode over the range of 4000–400 cm−1 with a resolution of 4 cm−1 and 32 scans. In the infrared spectrum, the x-axis represents the wavenumber and the y-axis represents the absorbance.
- Gel permeation chromatography (GPC).
- The synthesized polymer emulsion molecular weight and molecular weight distribution were determined using gel permeation chromatography (GPC) with triple detectors. The specific testing procedure is as follows: a mixture of a certain amount of sample with a concentration of 0.003 mg/mL and water was prepared and injected into the sample tube. The specific parameters of the GPC were set as follows: flow rate of 1 mL/min, minimum pressure of 0 MPa, maximum pressure of 10 MPa, flow slope of 1.2 mL/min2, and temperature of 20 °C.
- Measurement of particle size distribution.
- Mastersizer 2000 laser particle size distributor was used for the particle size distribution test, manufactured by Malvern Instruments LTD. The particle size of polymer emulsion was measured by laser particle size analyzer and its particle size distribution curve was drawn.
2.2.3. Testing of Cement-Based Materials Properties
- Semi-adiabatic temperature rise.
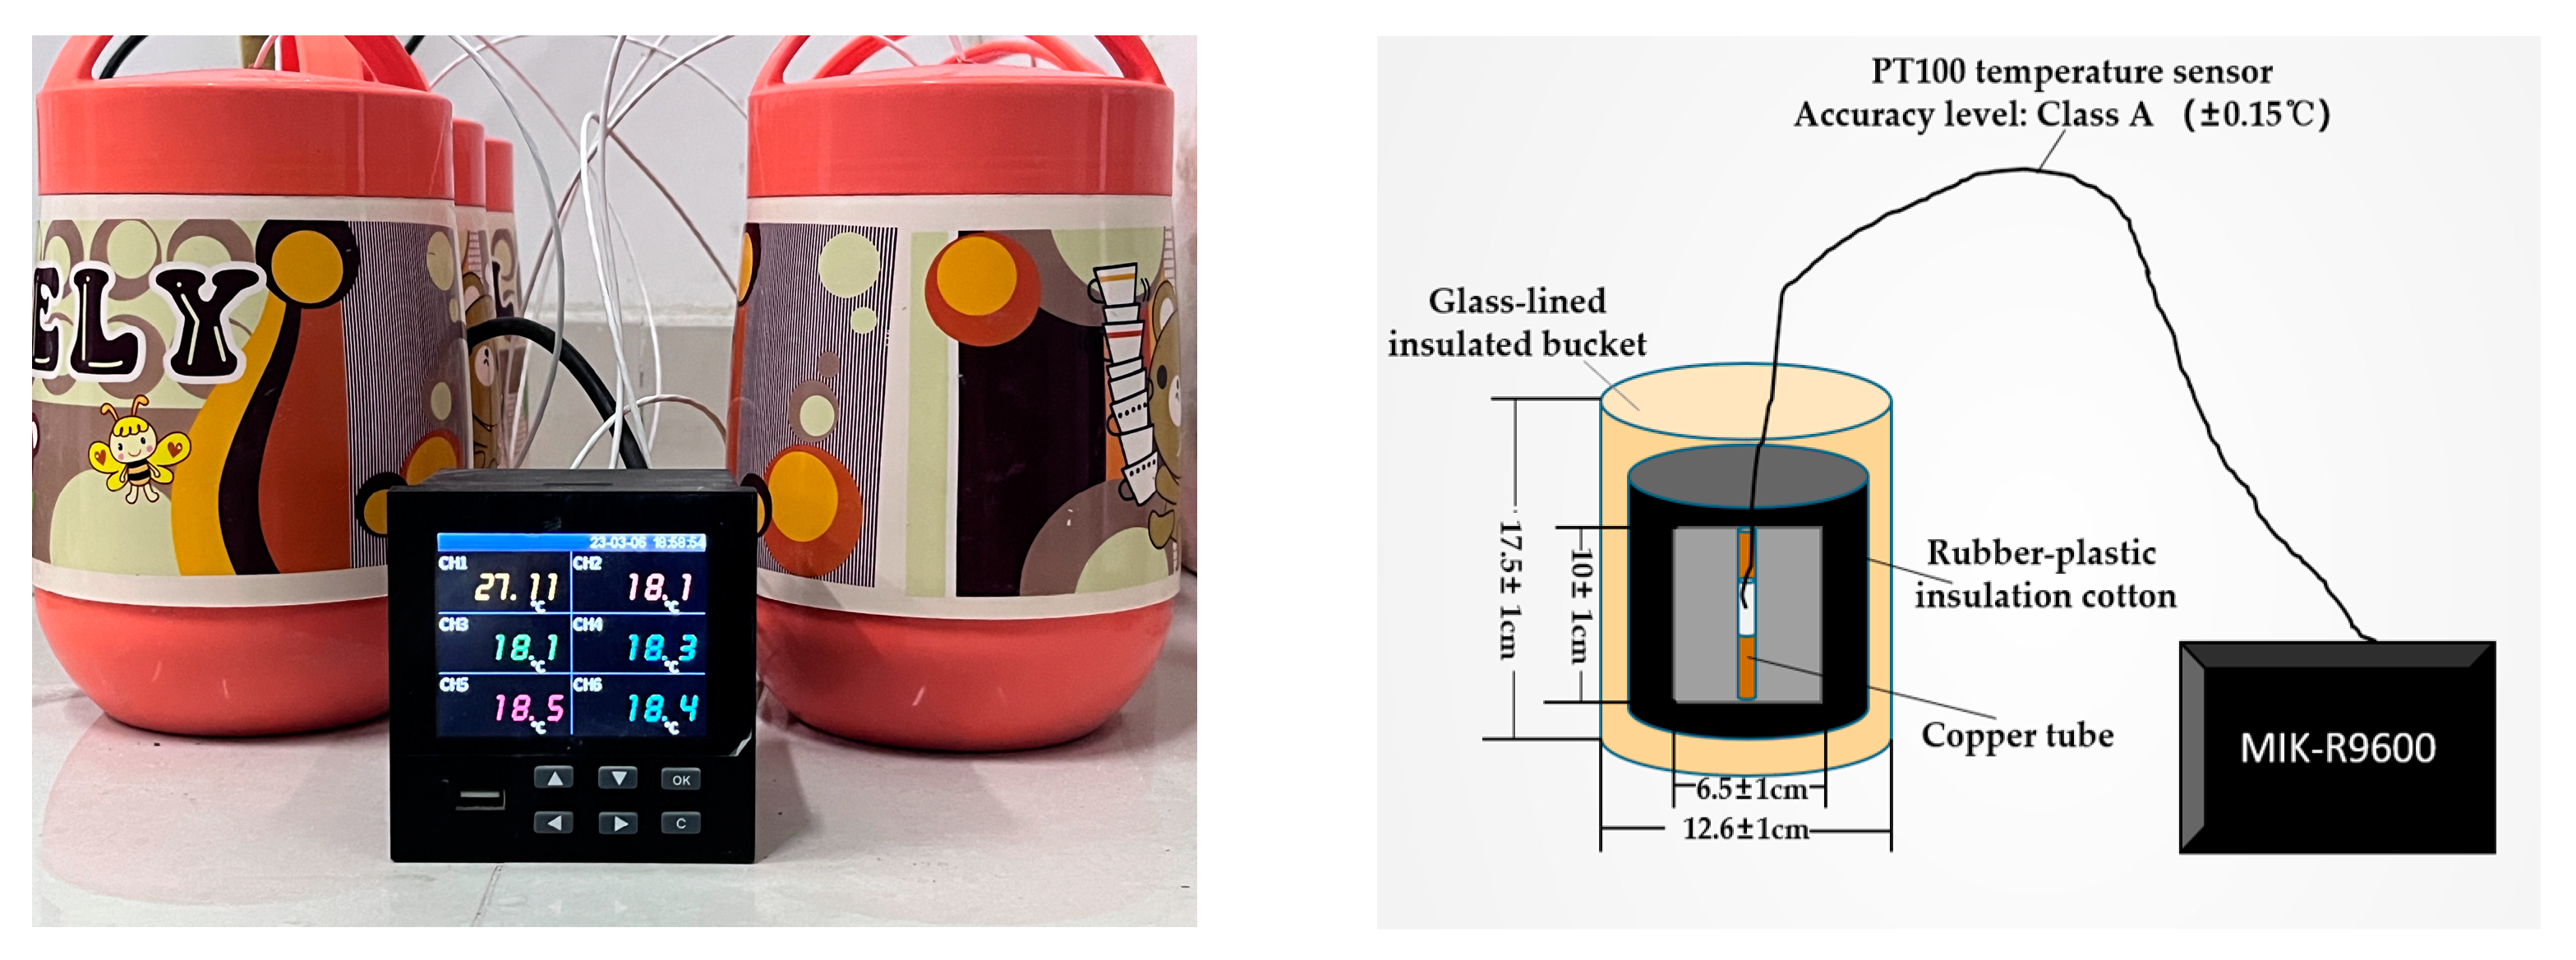
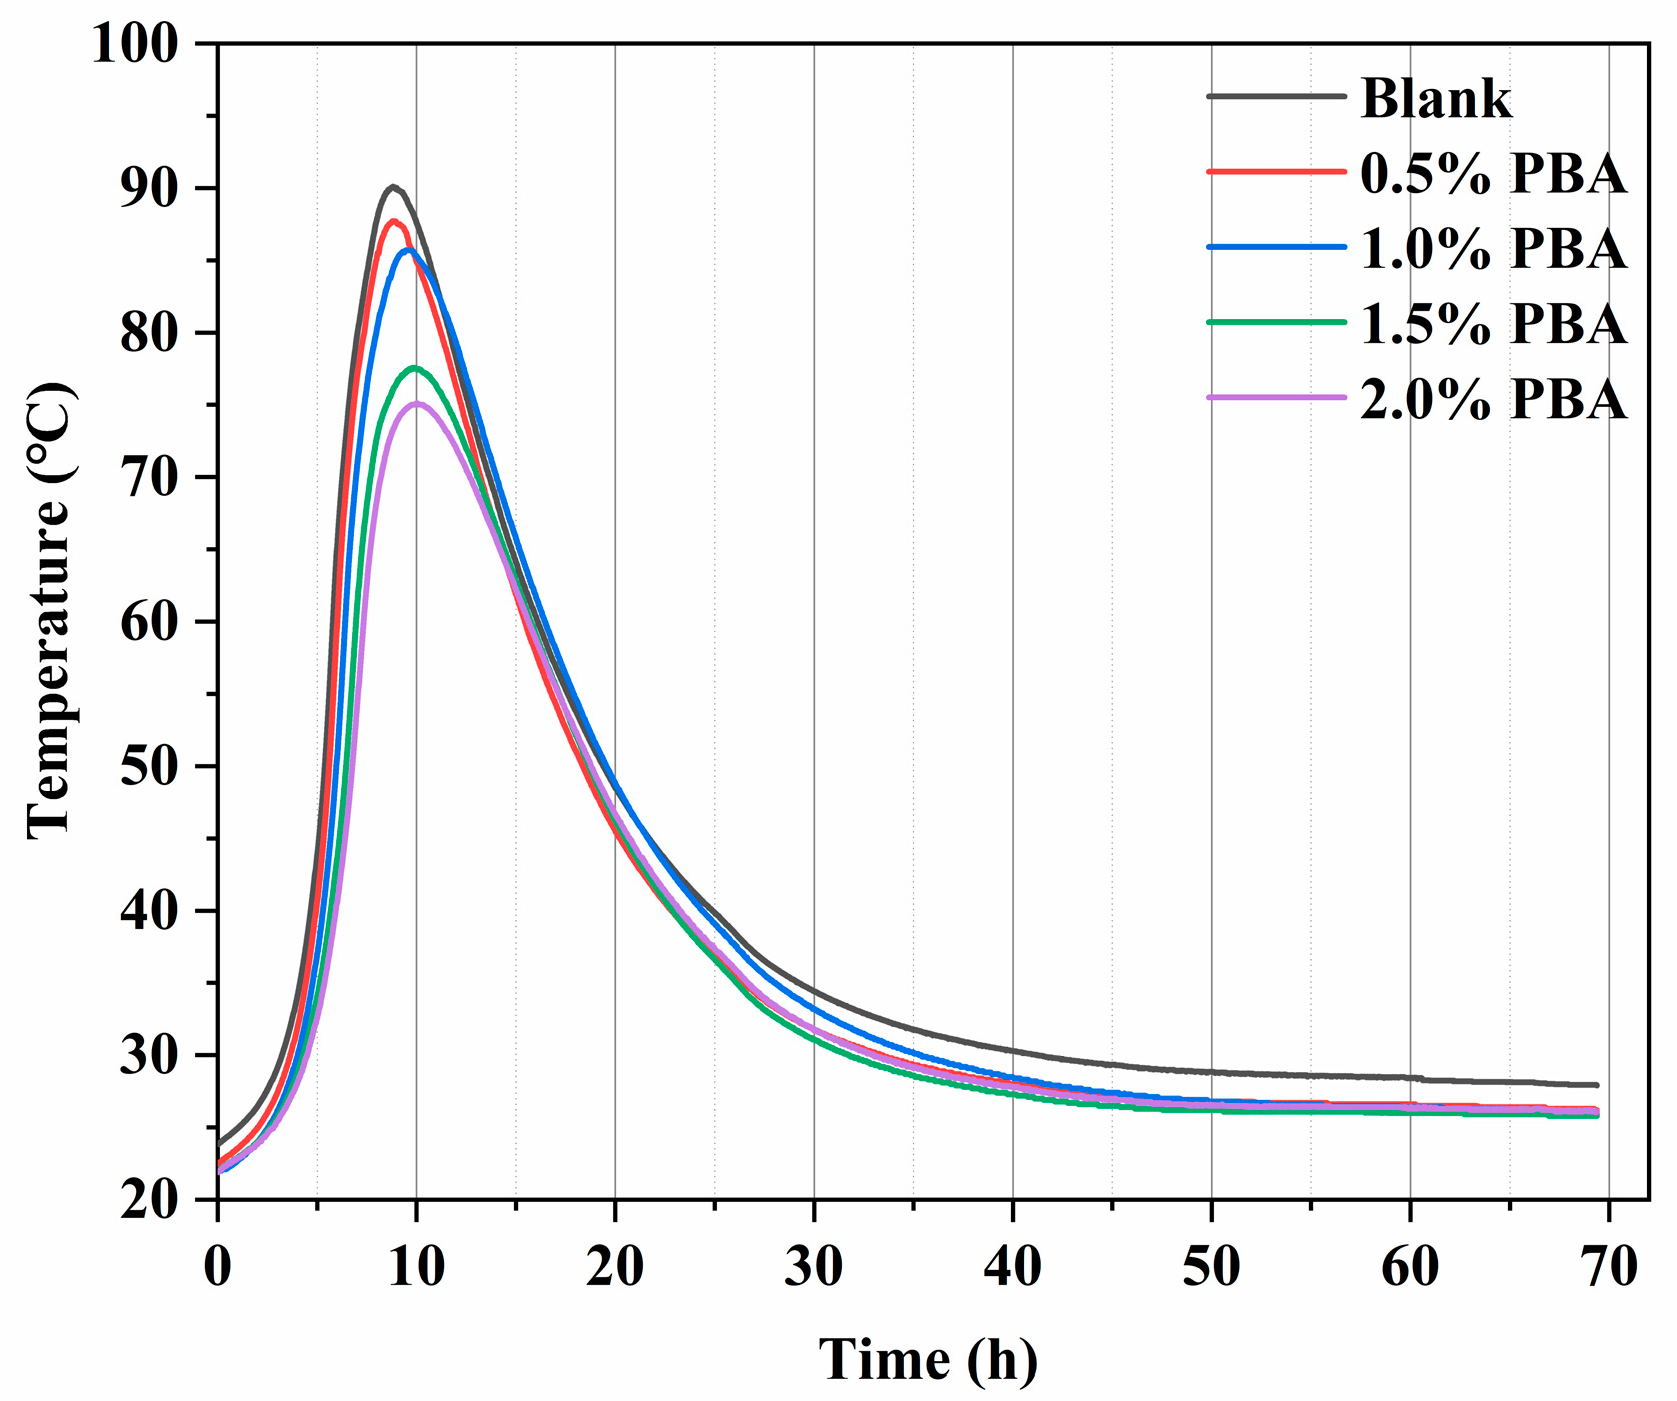
- The semi-adiabatic temperature rise test was performed using a laboratory-made, semi-adiabatic temperature rise apparatus. As shown in Figure 2, which utilizes the insulation properties of a glass thermal insulation bucket and rubber insulation to effectively reduce the convective heat loss from the surface of concrete specimens. This allows smaller laboratory specimens to achieve a temperature rise similar to that of large-volume concrete in actual engineering, and can be used to evaluate the temperature control effect of hydration control materials. The cement-based material is added in the form of emulsion; W/C is 0.4, and the water is composed of the water contained in the example together with additional tap water.
- Macroscopic performance.
- According to Chinese Standard “Testing Method for Cement Mortar Strength” (GB/T 17671-2021) [16], steel molds of 40 mm × 40 mm × 160 mm are used for molding. Before molding, the steel plates of the mold are sealed with plastic wrap to prevent the MKPC from sticking to the mold and making it difficult to demold. After the mortar is molded, the mold is demolded within 24 h and cured at a specified age in air with a temperature of 20 ± 3 °C and a relative humidity of 50%. Flexural strength and compressive strength are tested on an AEC-201 cement strength testing machine.
2.2.4. Hydration Kinetics Characterization
- Isothermal calorimetry.
- The hydration heat differences of cement pastes at different ages were measured using TAM Air eight-channel calorimeter produced by Thermometric AB in Sweden. The testing temperature was 20 °C and the water–cement ratio was 0.4.
- XRD.
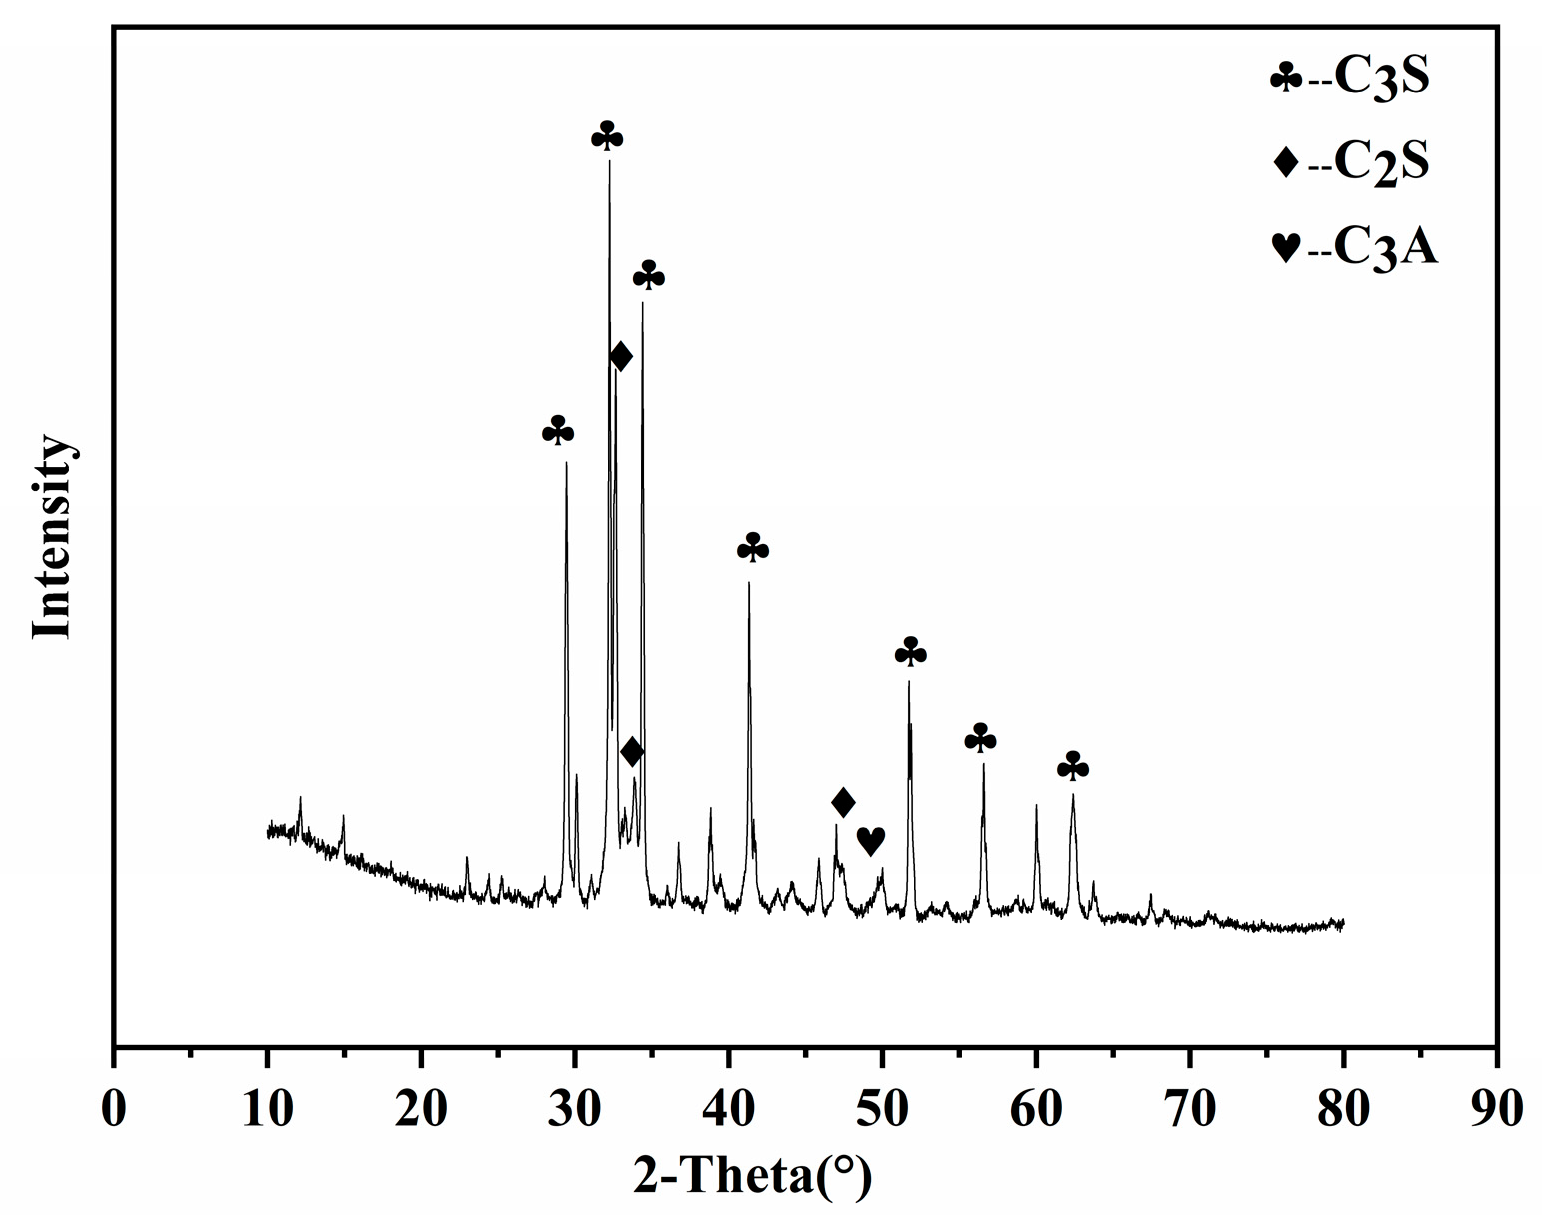
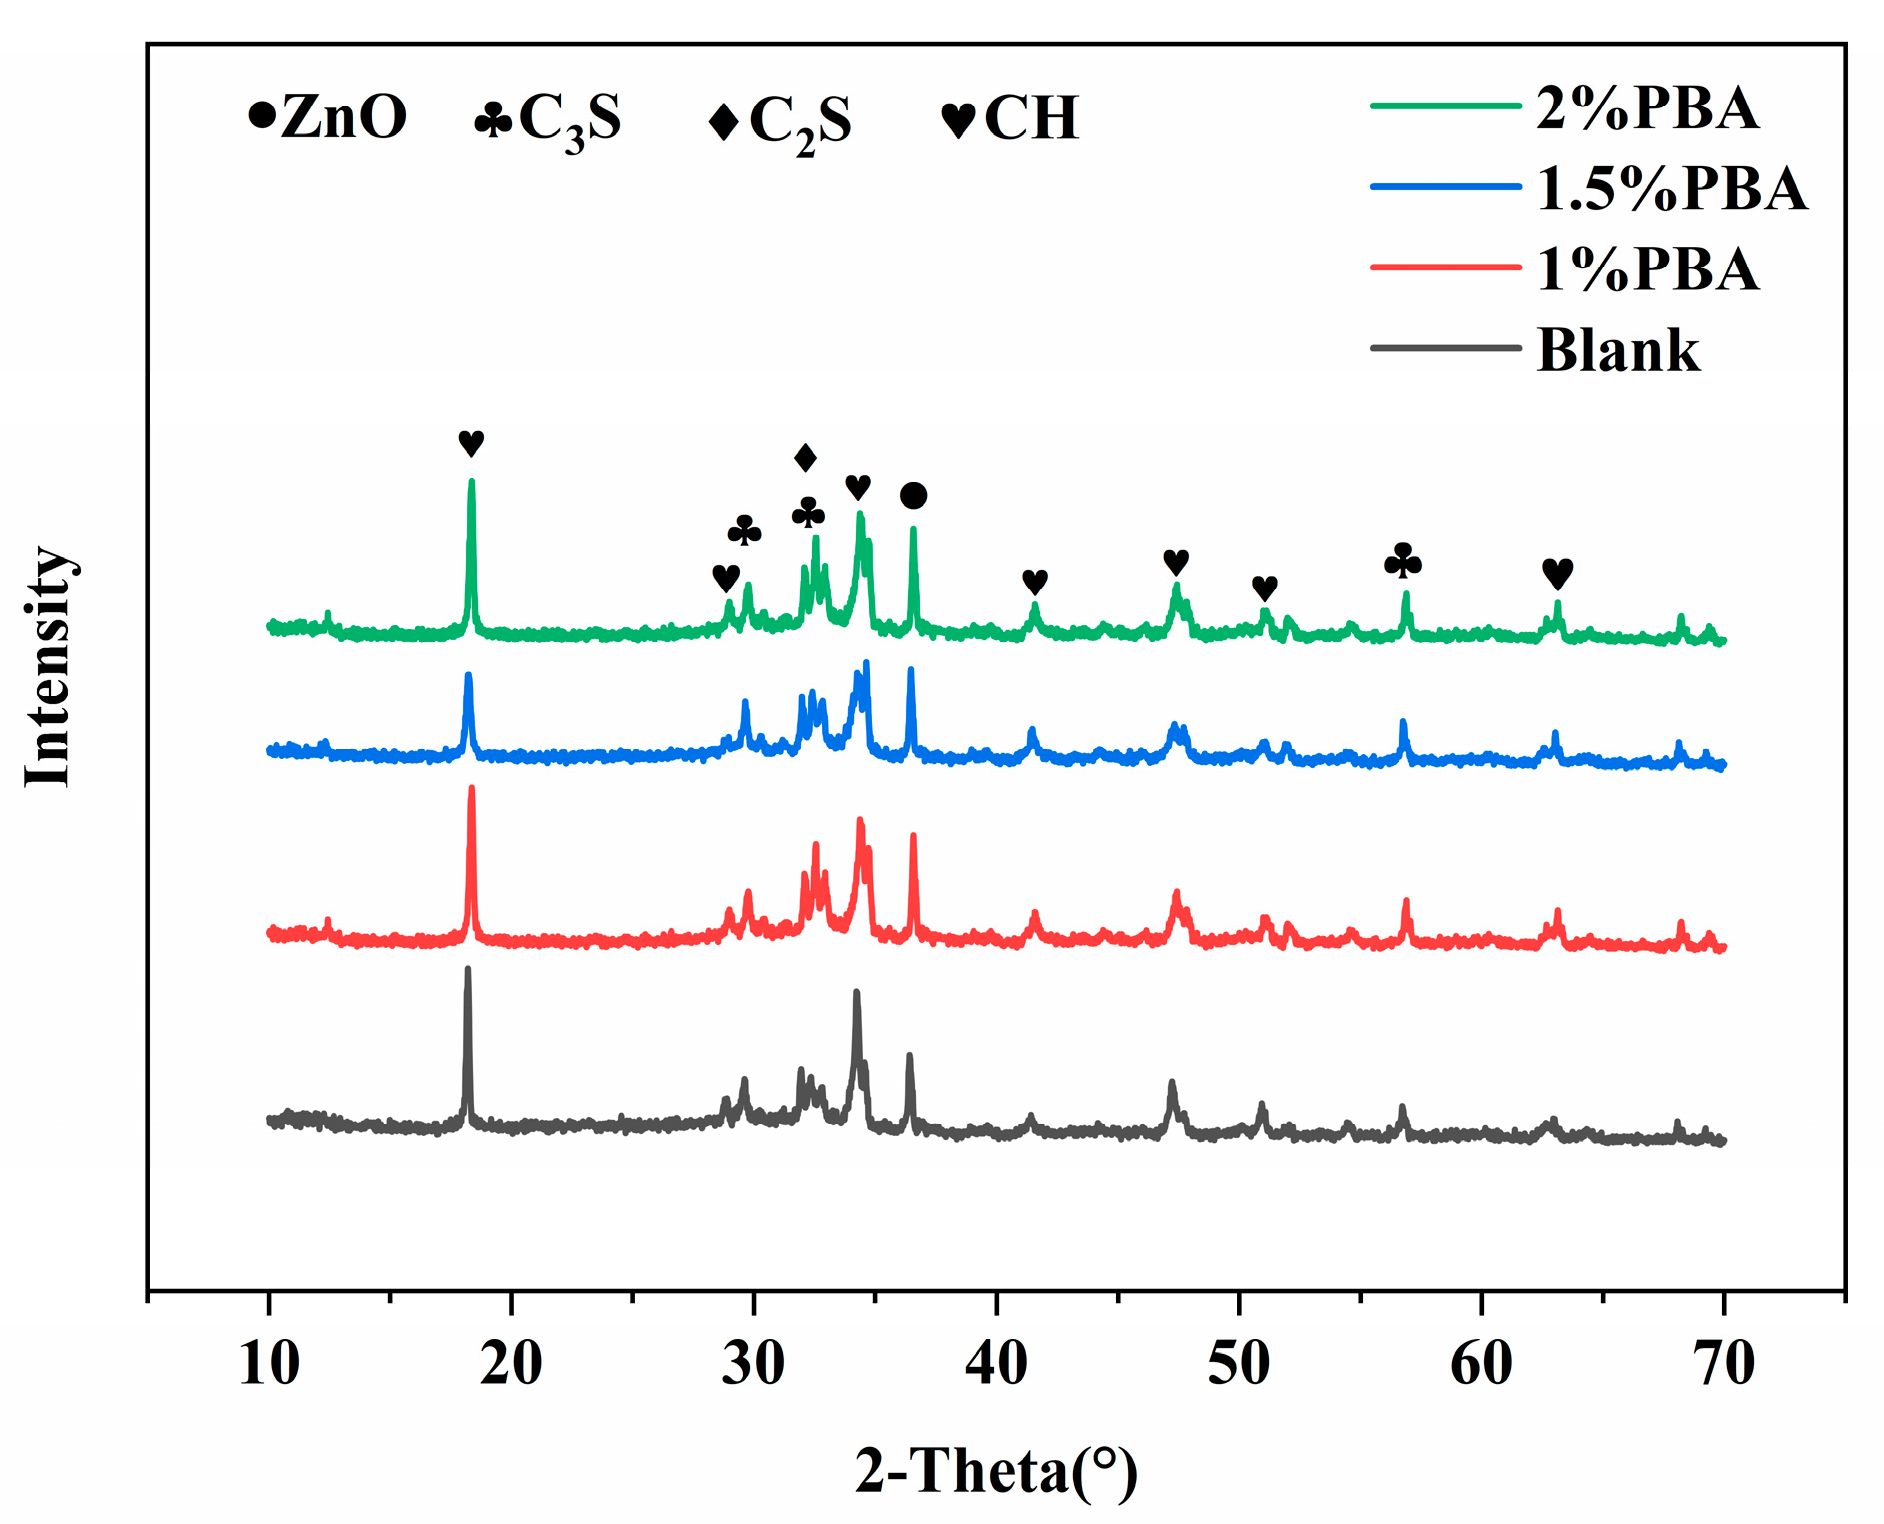
- X-ray diffraction analysis (XRD): X-ray diffraction analysis was performed using a SMART LAB X-ray diffractometer produced by RIGAKU Corporation of Japan. The powder sample diffraction method was used, and the operating conditions of the instrument were controlled to use Cu target K radiation, tube voltage of 40 kV, and tube current of 100 mA. The sample was dried at 60 °C, ground to a fine powder, and passed through an 80 μm sieve using an agate mortar. The sample was filled into a glass sample holder with a depth of 0.5 mm, and the surface of the powder was lightly pressed with a smooth glass surface before measurement using an X-ray diffractometer. The scan speed was set to 10°/min, and the scanning angle range was 10° to 70°.
- TG-DSC.
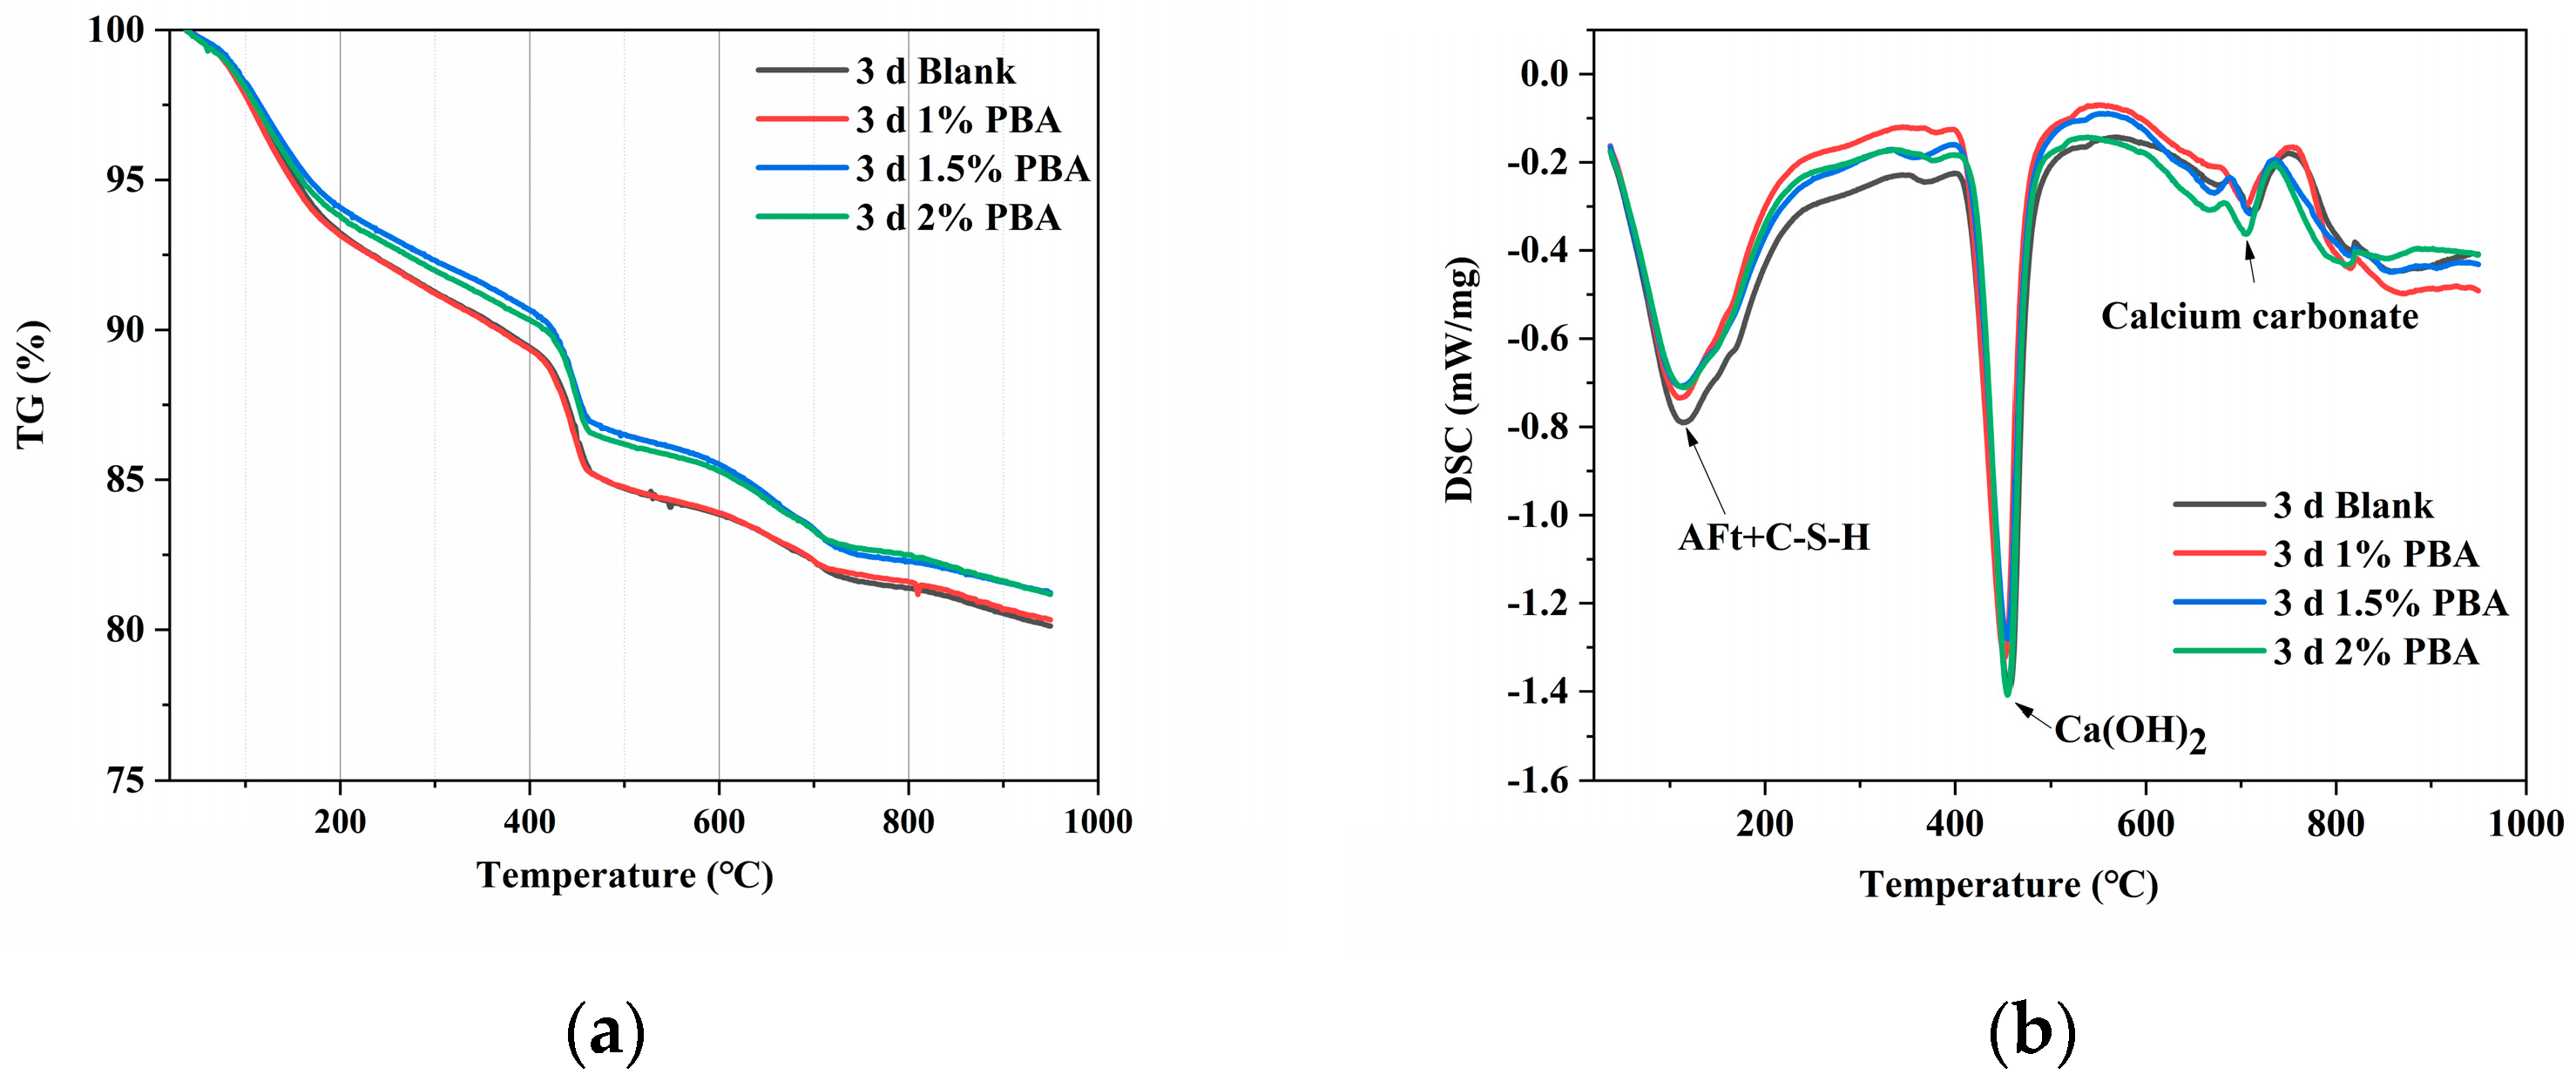
- The present study used a STA-449C simultaneous thermal analyzer produced by Netzsch GmbH (Germany) to conduct experiments on cementitious materials. Cement paste specimens cured to the specified age were cut into small pieces, soaked in ethanol for 7 days to terminate cement hydration, and then dried at 60 °C. These small pieces were ground into powder to obtain the testing samples. In the experiments, 10 mg to 15 mg of samples were taken, the temperature range was set between 20 °C and 1000 °C, the linear heating rate was 10 °C/min, and nitrogen gas was used as the environment (20 mL/min nitrogen flow). The CH content in the samples was determined by the thermal weight loss in the temperature range of 400–550 °C of the CH decomposition endothermic peak determined by DSC, and normalized to the mass percentage of the original cementitious components in the sample.
- MIP.
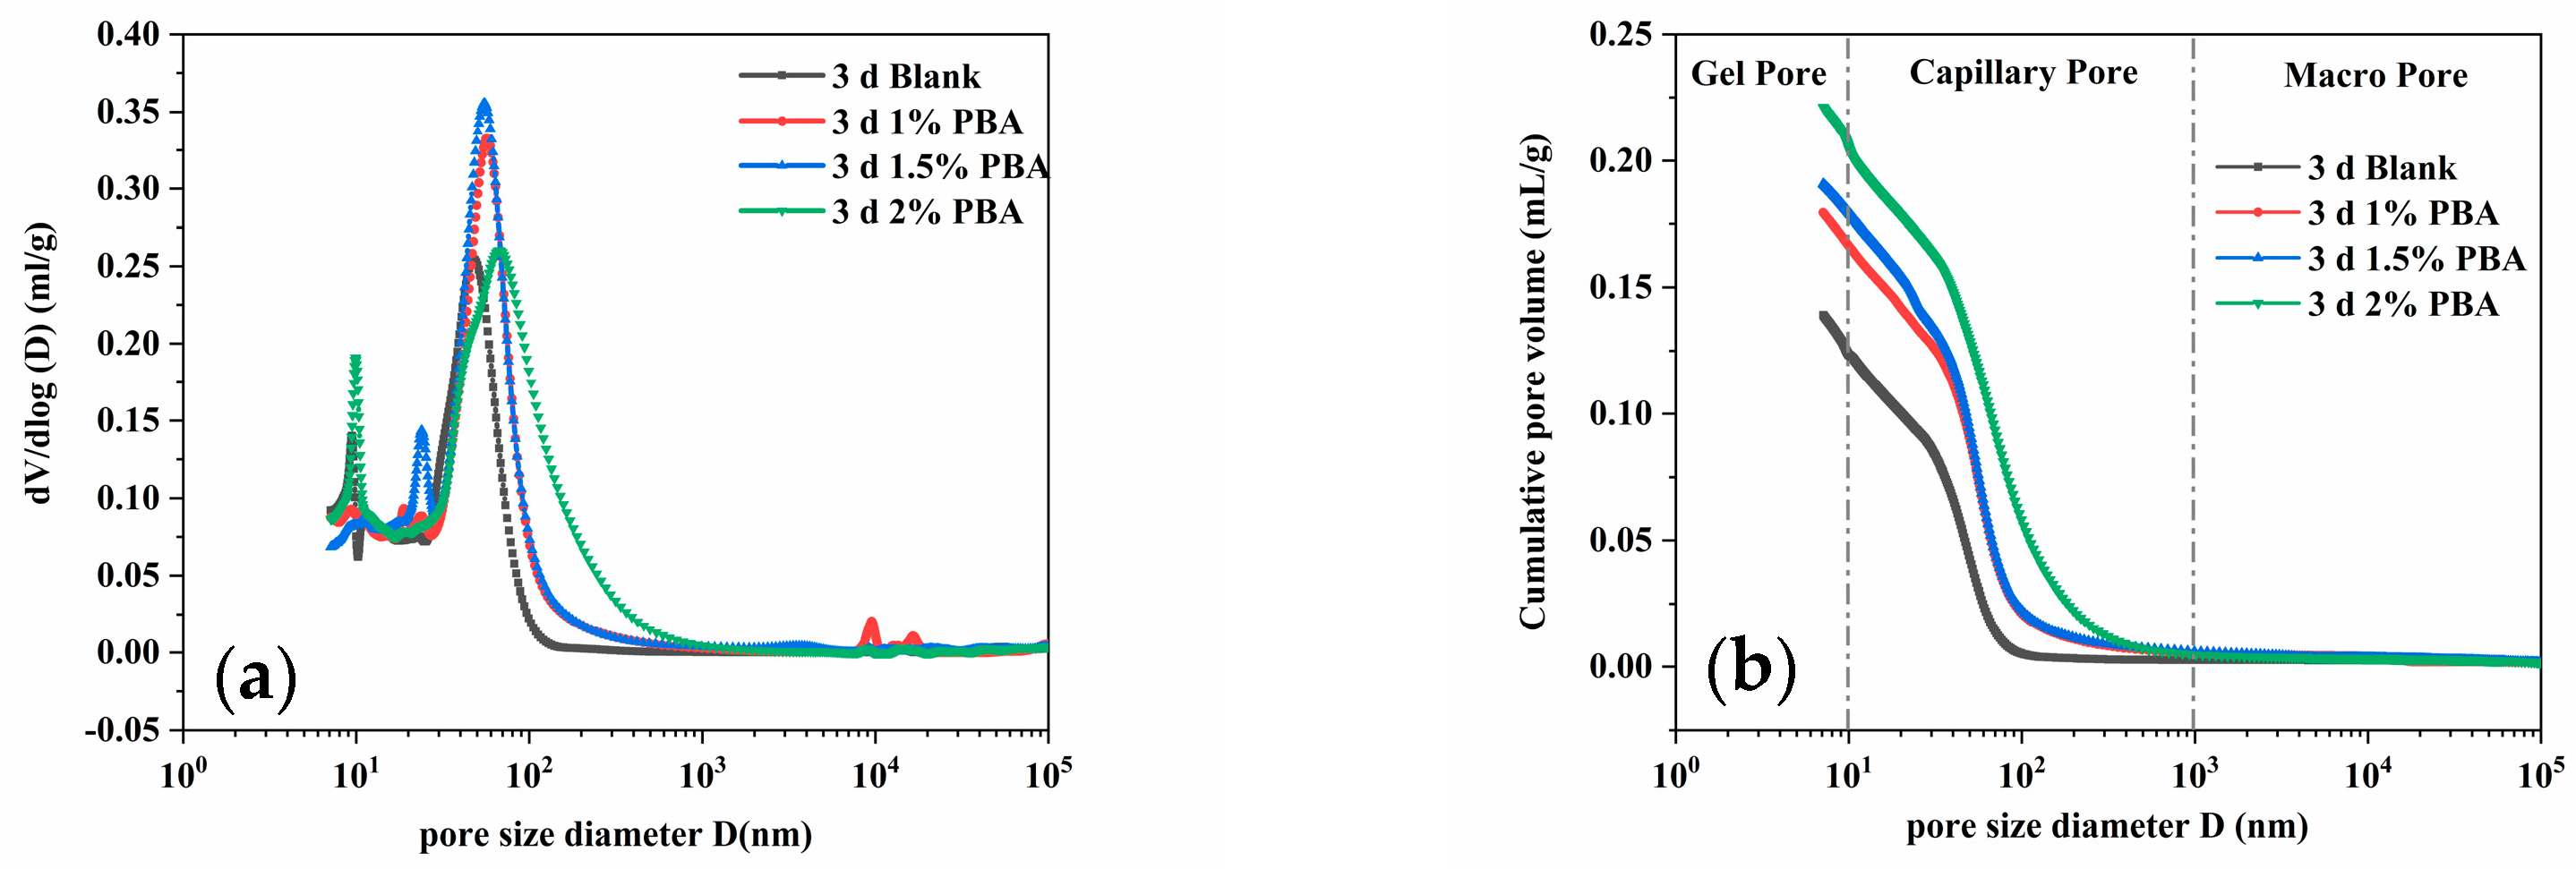
- The cement paste was taken out at a specified age of curing and immersed in anhydrous ethanol solution for 72 h to terminate the cement hydration. After drying in an oven, the broken samples were selected and particles with a diameter of 3–5 mm were chosen for mercury intrusion porosimetry (MIP) experiments. The Poremaster GT-60 instrument was used to analyze the pore structure of the cement paste through mercury intrusion testing. By collecting the amount of mercury intrusion at different pressures, the volume corresponding to different pore sizes can be obtained, and the pore size distribution can be calculated, thereby analyzing the effect of polymer emulsion on the pore structure of cement paste from a microscopic perspective.
3. Results and Discussion
3.1. Basic Information of Polymer Emulsion
3.2. Semi-Adiabatic Temperature Rise
3.3. Characterization of Cement Hydration Kinetics
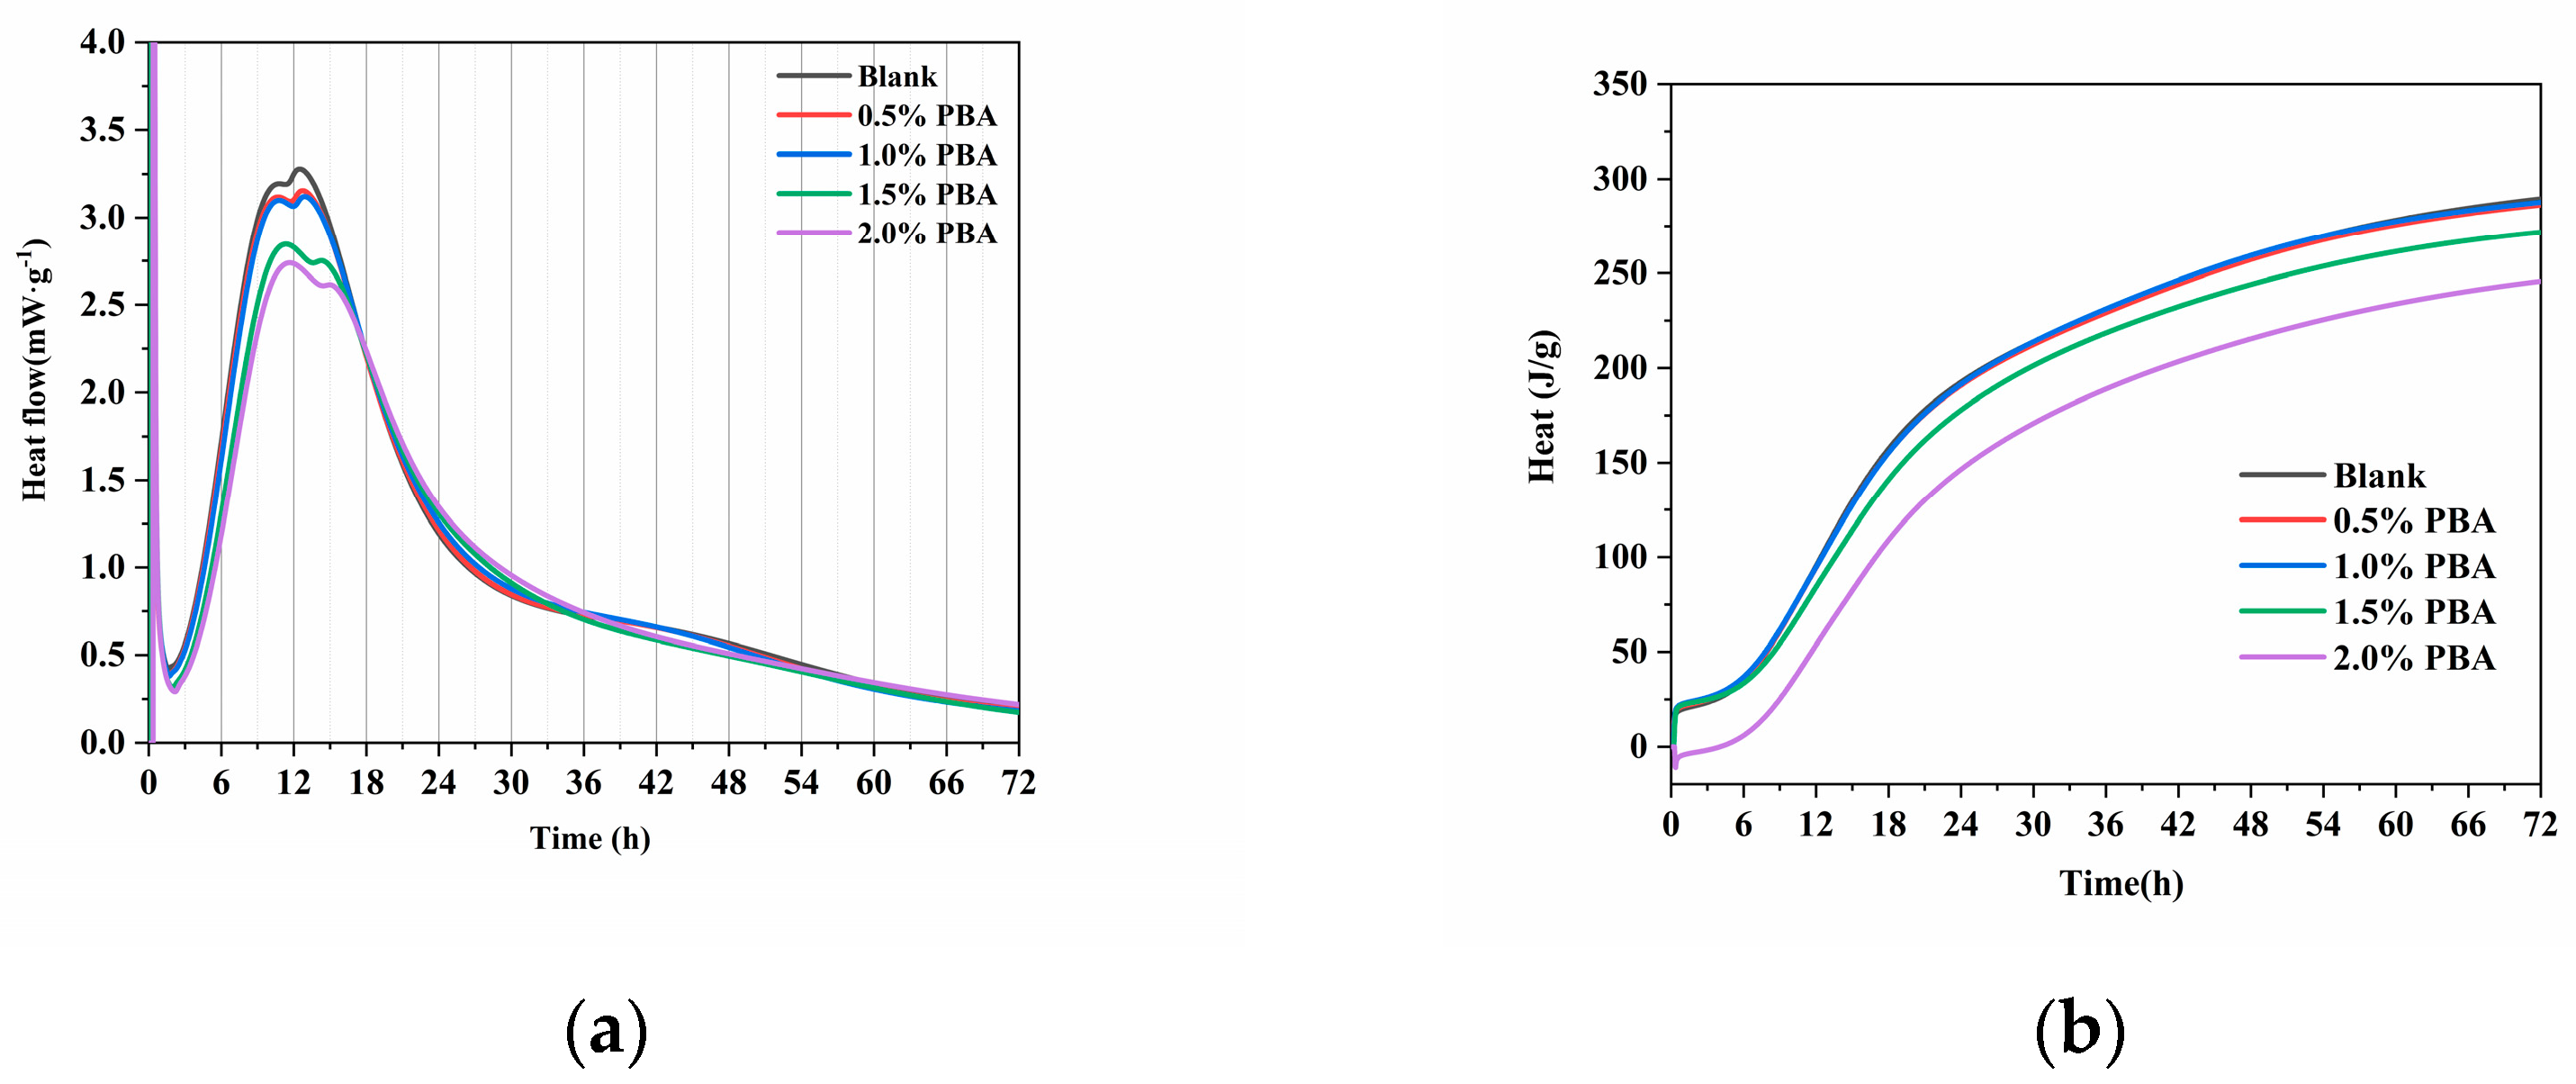
3.3.1. Isothermal Calorimetry
3.3.2. XRD
3.3.3. TG-DSC
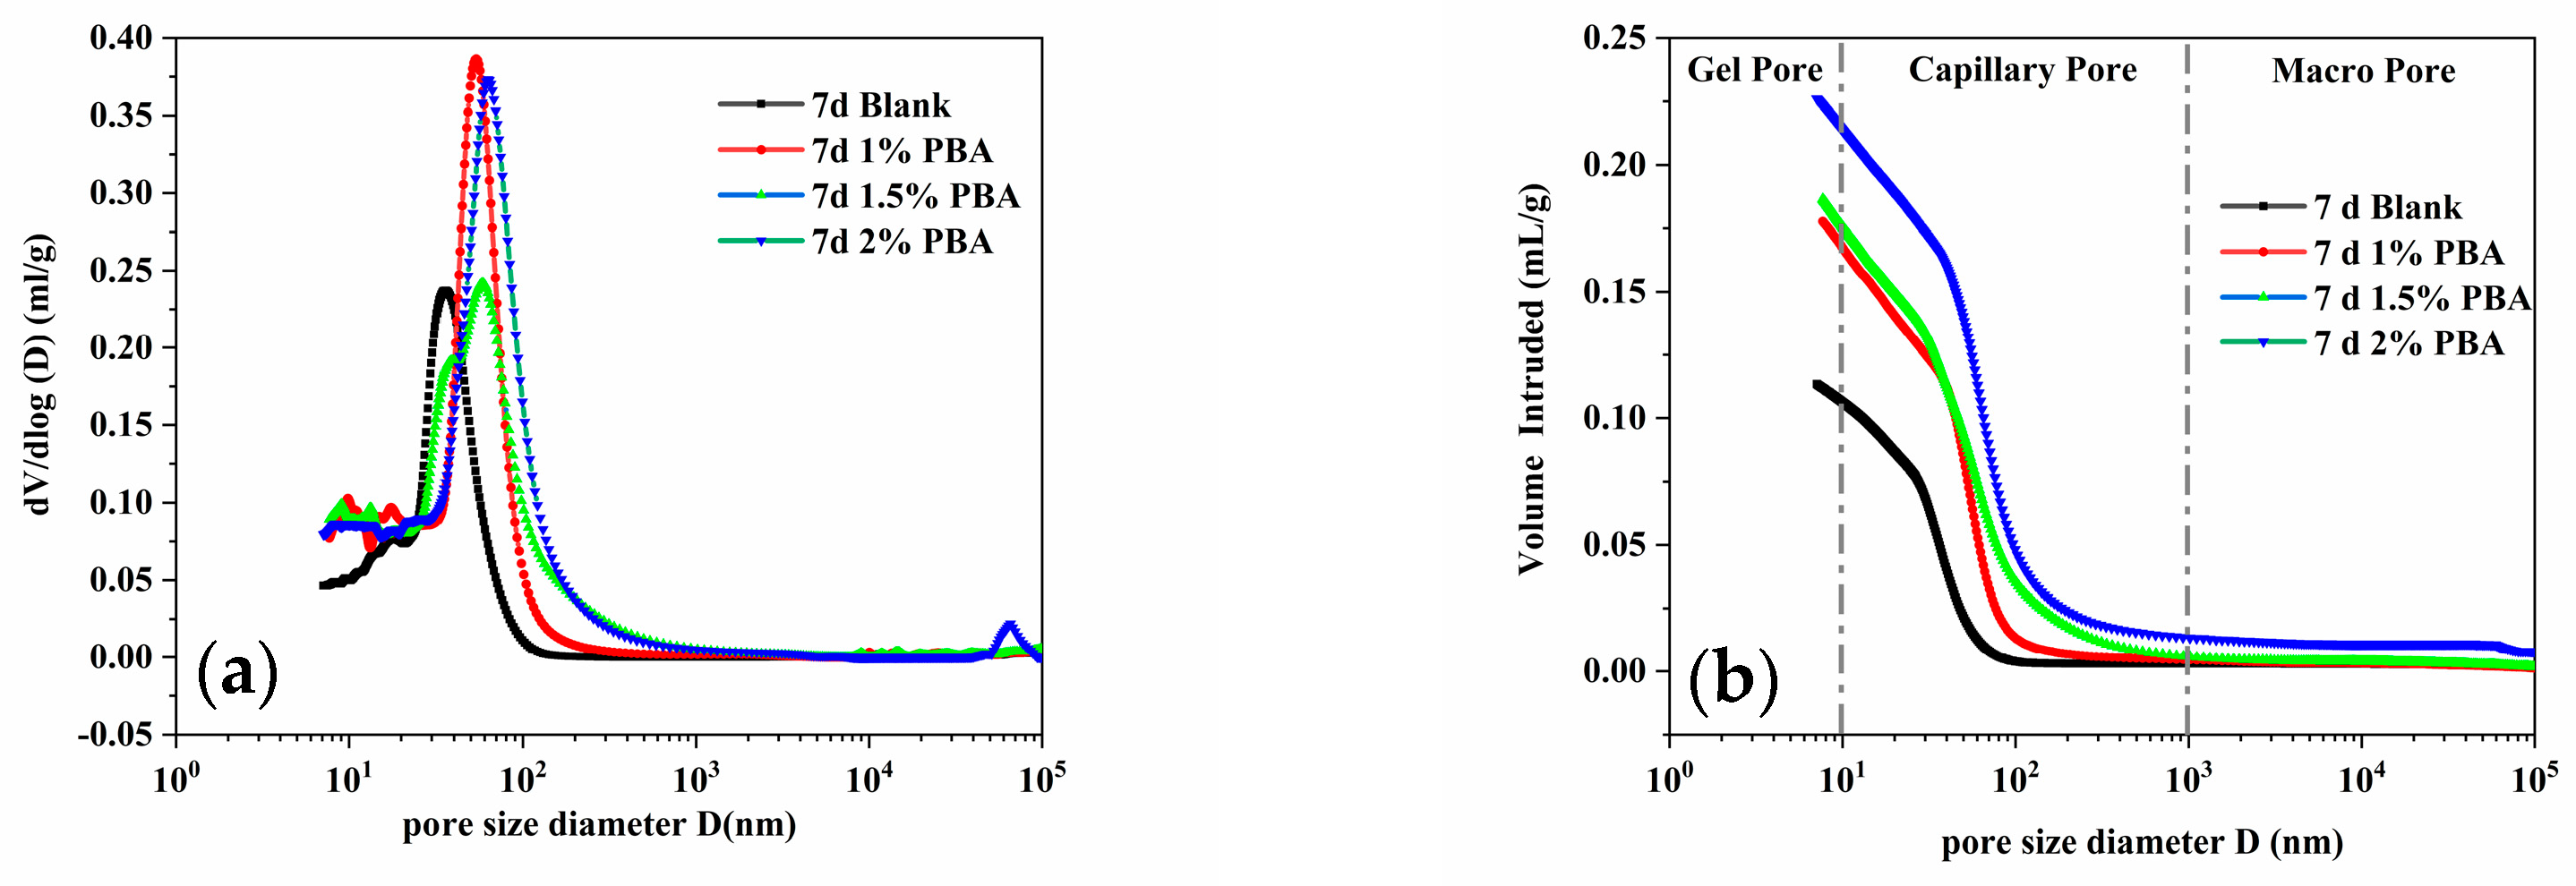
3.3.4. MIP
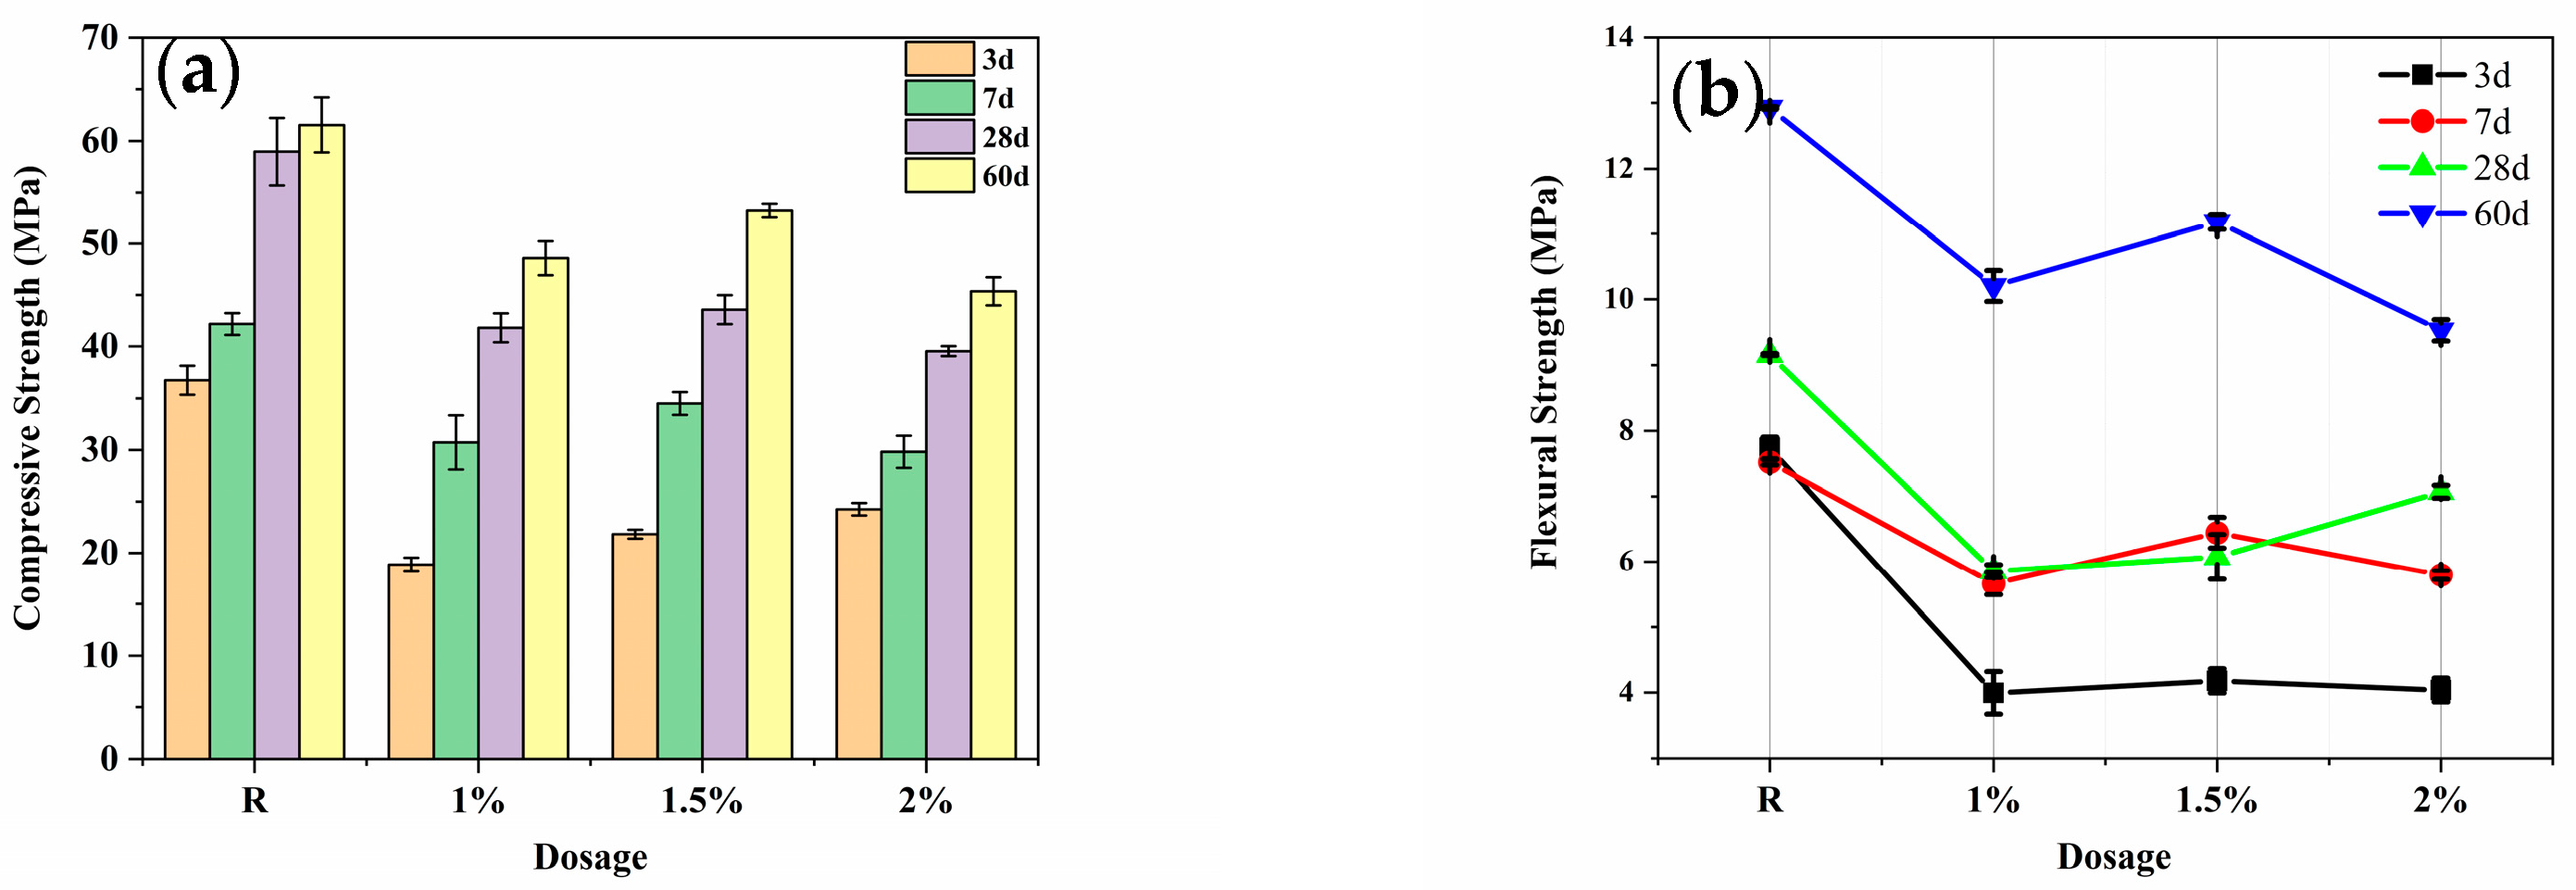
3.4. Compressive and Flexural Strength
4. Conclusions
- The results of the semi-adiabatic temperature rise experiment show that the addition of PBA can effectively control the temperature rise during cement hydration. When the dosage of PBA is 1.5%, the highest temperature rise during cement hydration can be reduced by 12.4 °C. Based on the isothermal calorimetry results, it can be concluded that the effect of PBA on the heat evolution of cement hydration is mainly reflected in slowing down the heating and cooling rates, reducing the hydration peak, and the retarding and cooling effects become stronger with the increase in the PBA content. Through the analysis of the results, the butyl acrylate copolymer emulsion prepared in this paper not only solves the dispersibility problem of the conventional starch-based hydration temperature rise inhibitor in the process of use [5], but also, compared with other emulsion admixtures [19], it can control the hydration temperature rise of cement better at a low dosage.
- Characterized by XRD and TGA, and revealing the inhibitory mechanism of PBA on cement hydration. The mass loss rates of the cement samples with a PBA emulsion at 0%, 1%, 1.5%, and 2% during the 3-day hydration process were 4.58%, 4.53%, 4.46%, and 4.15%, respectively. This demonstrates that the addition of PBA not only suppresses the early hydration of C3S and C3A, but also has a stronger inhibitory effect on the hydration of C3A. Additionally, it hinders the formation of hydration products such as CH and CaCO3.
- The addition of PBA widened the pore size distribution range of the cement specimen and increased the pore size percentage within this range. With an increasing dosage of the PBA emulsion, the total porosity of the cement samples increased by 23.23% (1%), 16.47% (1.5%), and 28.19% (2%) after 3 days, respectively. This may be due to the large molecular weight of the polymer, which leads to poor dispersion in the cement and weakens the connections between cement particles, resulting in more pores and defects. This is also one of the reasons for the decrease in the mechanical properties of the cement specimens. At a PBA content of 1.5%, the 60-day strength of the cement specimen reached the standard strength range. There is an optimal dosage range for PBA emulsion application, and the appropriate dosage range and potential side effects should be considered when using it.
Author Contributions
Funding
Institutional Review Board Statement
Informed Consent Statement
Data Availability Statement
Acknowledgments
Conflicts of Interest
References
- Xin, J.; Jiang, X.; Chen, Z.; Zuo, L.; Zhang, G.; Wang, Z.; Qi, C.; Zhang, L.; Liu, Y. Early Age Thermal Cracking Resistance of Basalt Fiber-Reinforced Concrete for Mass Concrete Structures under Restraint Condition. Structures 2022, 45, 1189–1198. [Google Scholar] [CrossRef]
- Klemczak, B.; Batog, M.; Pilch, M.; Żmij, A. Analysis of Cracking Risk in Early Age Mass Concrete with Different Aggregate Types. Procedia Eng. 2017, 193, 234–241. [Google Scholar] [CrossRef]
- Chiniforush, A.A.; Gharehchaei, M.; Nezhad, A.A.; Castel, A.; Moghaddam, F.; Keyte, L.; Hocking, D.; Foster, S. Numerical Simulation of Risk Mitigation Strategies for Early-Age Thermal Cracking and Def in Concrete. Constr. Build. Mater. 2022, 322, 126478. [Google Scholar] [CrossRef]
- Khalel, H.H.Z.; Khan, M.; Starr, A. Dynamic Response-Based Crack Resistance Analysis of Fibre Reinforced Concrete Specimens under Different Temperatures and Crack Depths. J. Build. Eng. 2023, 66, 105865. [Google Scholar] [CrossRef]
- Yan, Y.; Wang, R.; Wang, W.; Yu, C.; Liu, J. Effect of Starch-Based Admixtures on the Exothermic Process of Cement Hydration. Constr. Build. Mater. 2021, 289, 122903. [Google Scholar] [CrossRef]
- Deredas, K.; Kępczak, N.; Urbaniak, M. Influence of Doping with Styrene-Butadiene Rubber on Dynamic and Mechanical Properties of Polymer Concrete. Compos. Struct. 2021, 268, 113998. [Google Scholar] [CrossRef]
- Bahranifard, Z.; Vosoughi, A.; Tabrizi, F.F.; Shariati, K. Effects of Water-Cement Ratio and Superplasticizer Dosage on Mechanical and Microstructure Formation of Styrene-Butyl Acrylate Copolymer Concrete. Constr. Build. Mater. 2022, 318, 125889. [Google Scholar] [CrossRef]
- Pang, B.; Jin, Z.; Zhang, Y.; Xu, L.; Li, M.; Wang, C.; Zhang, Y.; Yang, Y.; Zhao, P.; Bi, J. Ultraductile Waterborne Epoxy-Concrete Composite Repair Material: Epoxy-Fiber Synergistic Effect on Flexural and Tensile Performance. Cem. Concr. Compos. 2022, 129, 104463. [Google Scholar] [CrossRef]
- Yuan, Q.; Xie, Z.; Yao, H.; Huang, T.; Fan, M. Hydration, Mechanical Properties, and Microstructural Characteristics of Cement Pastes with Different Ionic Polyacrylamides: A Comparative Study. J. Build. Eng. 2022, 56, 104763. [Google Scholar] [CrossRef]
- Lu, Z.; Kong, X.; Zhang, Q.; Cai, Y.; Zhang, Y.; Wang, Z.; Dong, B.; Xing, F. Influences of Styrene-Acrylate Latexes on Cement Hydration in Oil Well Cement System at Different Temperatures. Colloids Surf. A Physicochem. Eng. Asp. 2016, 507, 46–57. [Google Scholar] [CrossRef]
- Yan, Y.; Scrivener, K.L.; Yu, C.; Ouzia, A.; Liu, J. Effect of a novel starch-based temperature rise inhibitor on cement hydration and microstructure development: The second peak study. Cem. Concr. Res. 2021, 141, 106325. [Google Scholar] [CrossRef]
- Pourchez, J.; Govin, A.; Grosseau, P.; Guyonnet, R.; Guilhot, B.; Ruot, B. Alkaline stability of cellulose ethers and impact of their degradation products on cement hydration. Cem. Concr. Res. 2006, 36, 1252–1256. [Google Scholar] [CrossRef] [Green Version]
- Feng, Q.; Liu, X.J.; Peng, Z.G.; Zheng, Y.; Huo, J.H.; Liu, H. Preparation of low hydration heat cement slurry with micro-encapsulated thermal control material. Energy 2019, 187, 116000. [Google Scholar] [CrossRef]
- JC/T 1017-2020; Polymer Emulsions for Building Waterproofing Materials. China Building Materials Press: Beijing, China, 2021.
- GB/T 11543-2008; Surface Active Agents—The Identification of Emulsion for Moderate Tohigh Viscosity and the Evaluation Method of Emulsifying Capability. Standards Press of China: Beijing, China, 2008.
- GB/T 17671-2021; Test Method of Cement Mortar Strength(ISO Method). Standards Press of China: Beijing, China, 2021.
- Jansen, D.; Goetz-Neunhoeffer, F.; Lothenbach, B.; Neubauer, J. The Early Hydration of Ordinary Portland Cement (Opc): An Approach Comparing Measured Heat Flow with Calculated Heat Flow from Qxrd. Cem. Concr. Res. 2012, 42, 134–138. [Google Scholar] [CrossRef]
- Huo, J.; Wang, Z.; Zhang, T.; He, R.; Chen, H. Influences of Interaction Between Cement and Ionic Paraffin Emulsion on Cement Hydration. Constr. Build. Mater. 2021, 299, 123951. [Google Scholar] [CrossRef]
- Kong, X.; Emmerling, S.; Pakusch, J.; Rueckel, M.; Nieberle, J. Retardation Effect of Styrene-Acrylate Copolymer Latexes on Cement Hydration. Cem. Concr. Res. 2015, 75, 23–41. [Google Scholar] [CrossRef]
- Gonçalves, B.; Exposito, C.; Ishikawa, T.T.; Koga, G.Y. X-Ray Diffraction Study of the Early Hydration of Portland Cements Containing Calcium Carbonate by in-Situ and Ex-Situ Approaches. Constr. Build. Mater. 2023, 365, 129947. [Google Scholar] [CrossRef]
- De Oliveira, A.M.; Oliveira, A.P.; Vieira, J.D.; Junior, A.N.; Cascudo, O. Study of the Development of Hydration of Ternary Cement Pastes Using X-Ray Computed Microtomography, Xrd-Rietveld Method, Tg/Dtg, Dsc, Calorimetry and Ftir Techniques. J. Build. Eng. 2023, 64, 105616. [Google Scholar] [CrossRef]
- Cai, J.; Zhang, C.; Zeng, L.; Xu, H.; Wang, J.; Liu, K.; Cheng, X. Preparation and Action Mechanism of Temperature Control Materials for Low-Temperature Cement. Constr. Build. Mater. 2021, 312, 125364. [Google Scholar] [CrossRef]
- Xue, S.; Meng, F.; Zhang, P.; Bao, J.; Wang, J.; Zhao, K. Influence of Water Re-Curing on Microstructure of Heat-Damaged Cement Mortar Characterized by Low-Field Nmr and Mip. Constr. Build. Mater. 2020, 262, 120532. [Google Scholar] [CrossRef]
- Silva, D.A.; John, V.M.; Ribeiro, J.; Roman, H.R. Pore Size Distribution of Hydrated Cement Pastes Modified with Polymers. Cem. Concr. Res. 2001, 31, 1177–1184. [Google Scholar] [CrossRef]
- Zhang, X.; Du, M.; Fang, H.; Shi, M.; Zhang, C.; Wang, F. Polymer-Modified Cement Mortars: Their Enhanced Properties, Applications, Prospects, and Challenges. Constr. Build. Mater. 2021, 299, 124290. [Google Scholar] [CrossRef]
- Ramli, M.; Tabassi, A.A. Effects of polymer modification on the permeability of cement mortars under different curing conditions: A correlational study that includes pore distributions, water absorption and compressive strength. Constr. Build. Mater. 2012, 28, 561–570. [Google Scholar] [CrossRef]
- Shi, X.; Cheng, J.; Xu, L.; Feng, T.; Han, J.; Zhang, P.; Guo, Z. Study on the Effect of Wer and Eva on the Performance and Microstructure of Cement Mortars for a Prefabricated Residential Floor. J. Build. Eng. 2022, 49, 104050. [Google Scholar] [CrossRef]
- Aghaee, K.; Sposito, R.; Thienel, K.; Khayat, K.H. Effect of Additional Water or Superplasticizer on Key Characteristics of Cement Paste Made with Superabsorbent Polymer and Other Shrinkage Mitigating Materials. Cem. Concr. Compos. 2023, 136, 104893. [Google Scholar] [CrossRef]


| Material | CaO | SiO2 | Al2O3 | Fe2O3 | SO3 | MgO | K2O | LOI |
|---|---|---|---|---|---|---|---|---|
| cement/% | 63.66 | 20.87 | 4.42 | 2.89 | 2.10 | 0.94 | 0.51 | 3.30 |
| Name | Dispersion Phase | Organic Phase | Emulgator | Catalyzer |
|---|---|---|---|---|
| Proportion (%) | 65.2 | 32.6 | 2.0 | 0.2 |
| Sample | Appearance | pH | Solid Content (%) | Stability | Particle Size (nm) | Mw (g/mol) |
|---|---|---|---|---|---|---|
| PBA | Milky white with bluish | 11 | 50 | No delamination | 203 | 46,700 |
| Sample | Ratemax (mW g−1) | Q24 h (J g−1) | Q48 h (J g−1) | Q72 h (J g−1) |
|---|---|---|---|---|
| Blank | 3.28 | 191.28 | 257.66 | 290.11 |
| 0.5% PBA | 3.15 | 190.44 | 256.61 | 285.72 |
| 1% PBA | 3.12 | 191.06 | 258.81 | 287.71 |
| 1.5% PBA | 2.85 | 176.41 | 243.84 | 271.48 |
| 2% PBA | 2.74 | 145.10 | 215.57 | 245.41 |
| Sample | C3S | C2S | C3A | C4AF | CH |
|---|---|---|---|---|---|
| Blank | 11.86 | 12.31 | 0.54 | 6.40 | 16.85 |
| 1% PBA | 13.50 | 9.89 | 1.04 | 6.27 | 13.35 |
| 1.5% PBA | 14.65 | 13.20 | 0.97 | 8.13 | 13.38 |
| 2% PBA | 15.97 | 13.60 | 1.06 | 6.94 | 12.81 |
| Sample | 3 d Blank | 3 d 1.0% PBA | 3 d 1.5% PBA | 3 d 2.0% PBA |
|---|---|---|---|---|
| Porosity Summary (%) | 23.68 | 29.18 | 27.58 | 33.99 |
| Sample | 7 d Blank | 7 d 1.0% PBA | 7 d 1.5% PBA | 7 d 2.0% PBA |
|---|---|---|---|---|
| Porosity Summary (%) | 20.12 | 29.29 | 27.20 | 34.58 |
Disclaimer/Publisher’s Note: The statements, opinions and data contained in all publications are solely those of the individual author(s) and contributor(s) and not of MDPI and/or the editor(s). MDPI and/or the editor(s) disclaim responsibility for any injury to people or property resulting from any ideas, methods, instructions or products referred to in the content. |
© 2023 by the authors. Licensee MDPI, Basel, Switzerland. This article is an open access article distributed under the terms and conditions of the Creative Commons Attribution (CC BY) license (https://creativecommons.org/licenses/by/4.0/).
Share and Cite
Li, S.; Mao, Z.; Deng, M. Preparation of Butyl Acrylate Copolymer Emulsion and Its Regulation Effect on Cement Hydration. Materials 2023, 16, 2887. https://doi.org/10.3390/ma16072887
Li S, Mao Z, Deng M. Preparation of Butyl Acrylate Copolymer Emulsion and Its Regulation Effect on Cement Hydration. Materials. 2023; 16(7):2887. https://doi.org/10.3390/ma16072887
Chicago/Turabian StyleLi, Sifan, Zhongyang Mao, and Min Deng. 2023. "Preparation of Butyl Acrylate Copolymer Emulsion and Its Regulation Effect on Cement Hydration" Materials 16, no. 7: 2887. https://doi.org/10.3390/ma16072887