
In Situ Electrochemical Monitoring of the Crevice Corrosion Process of the 7075-T651 Aluminium Alloy in Acidic NaCl and NaNO3 Solution

Abstract
:1. Introduction
2. Materials and Methods
2.1. Materials and Solutions
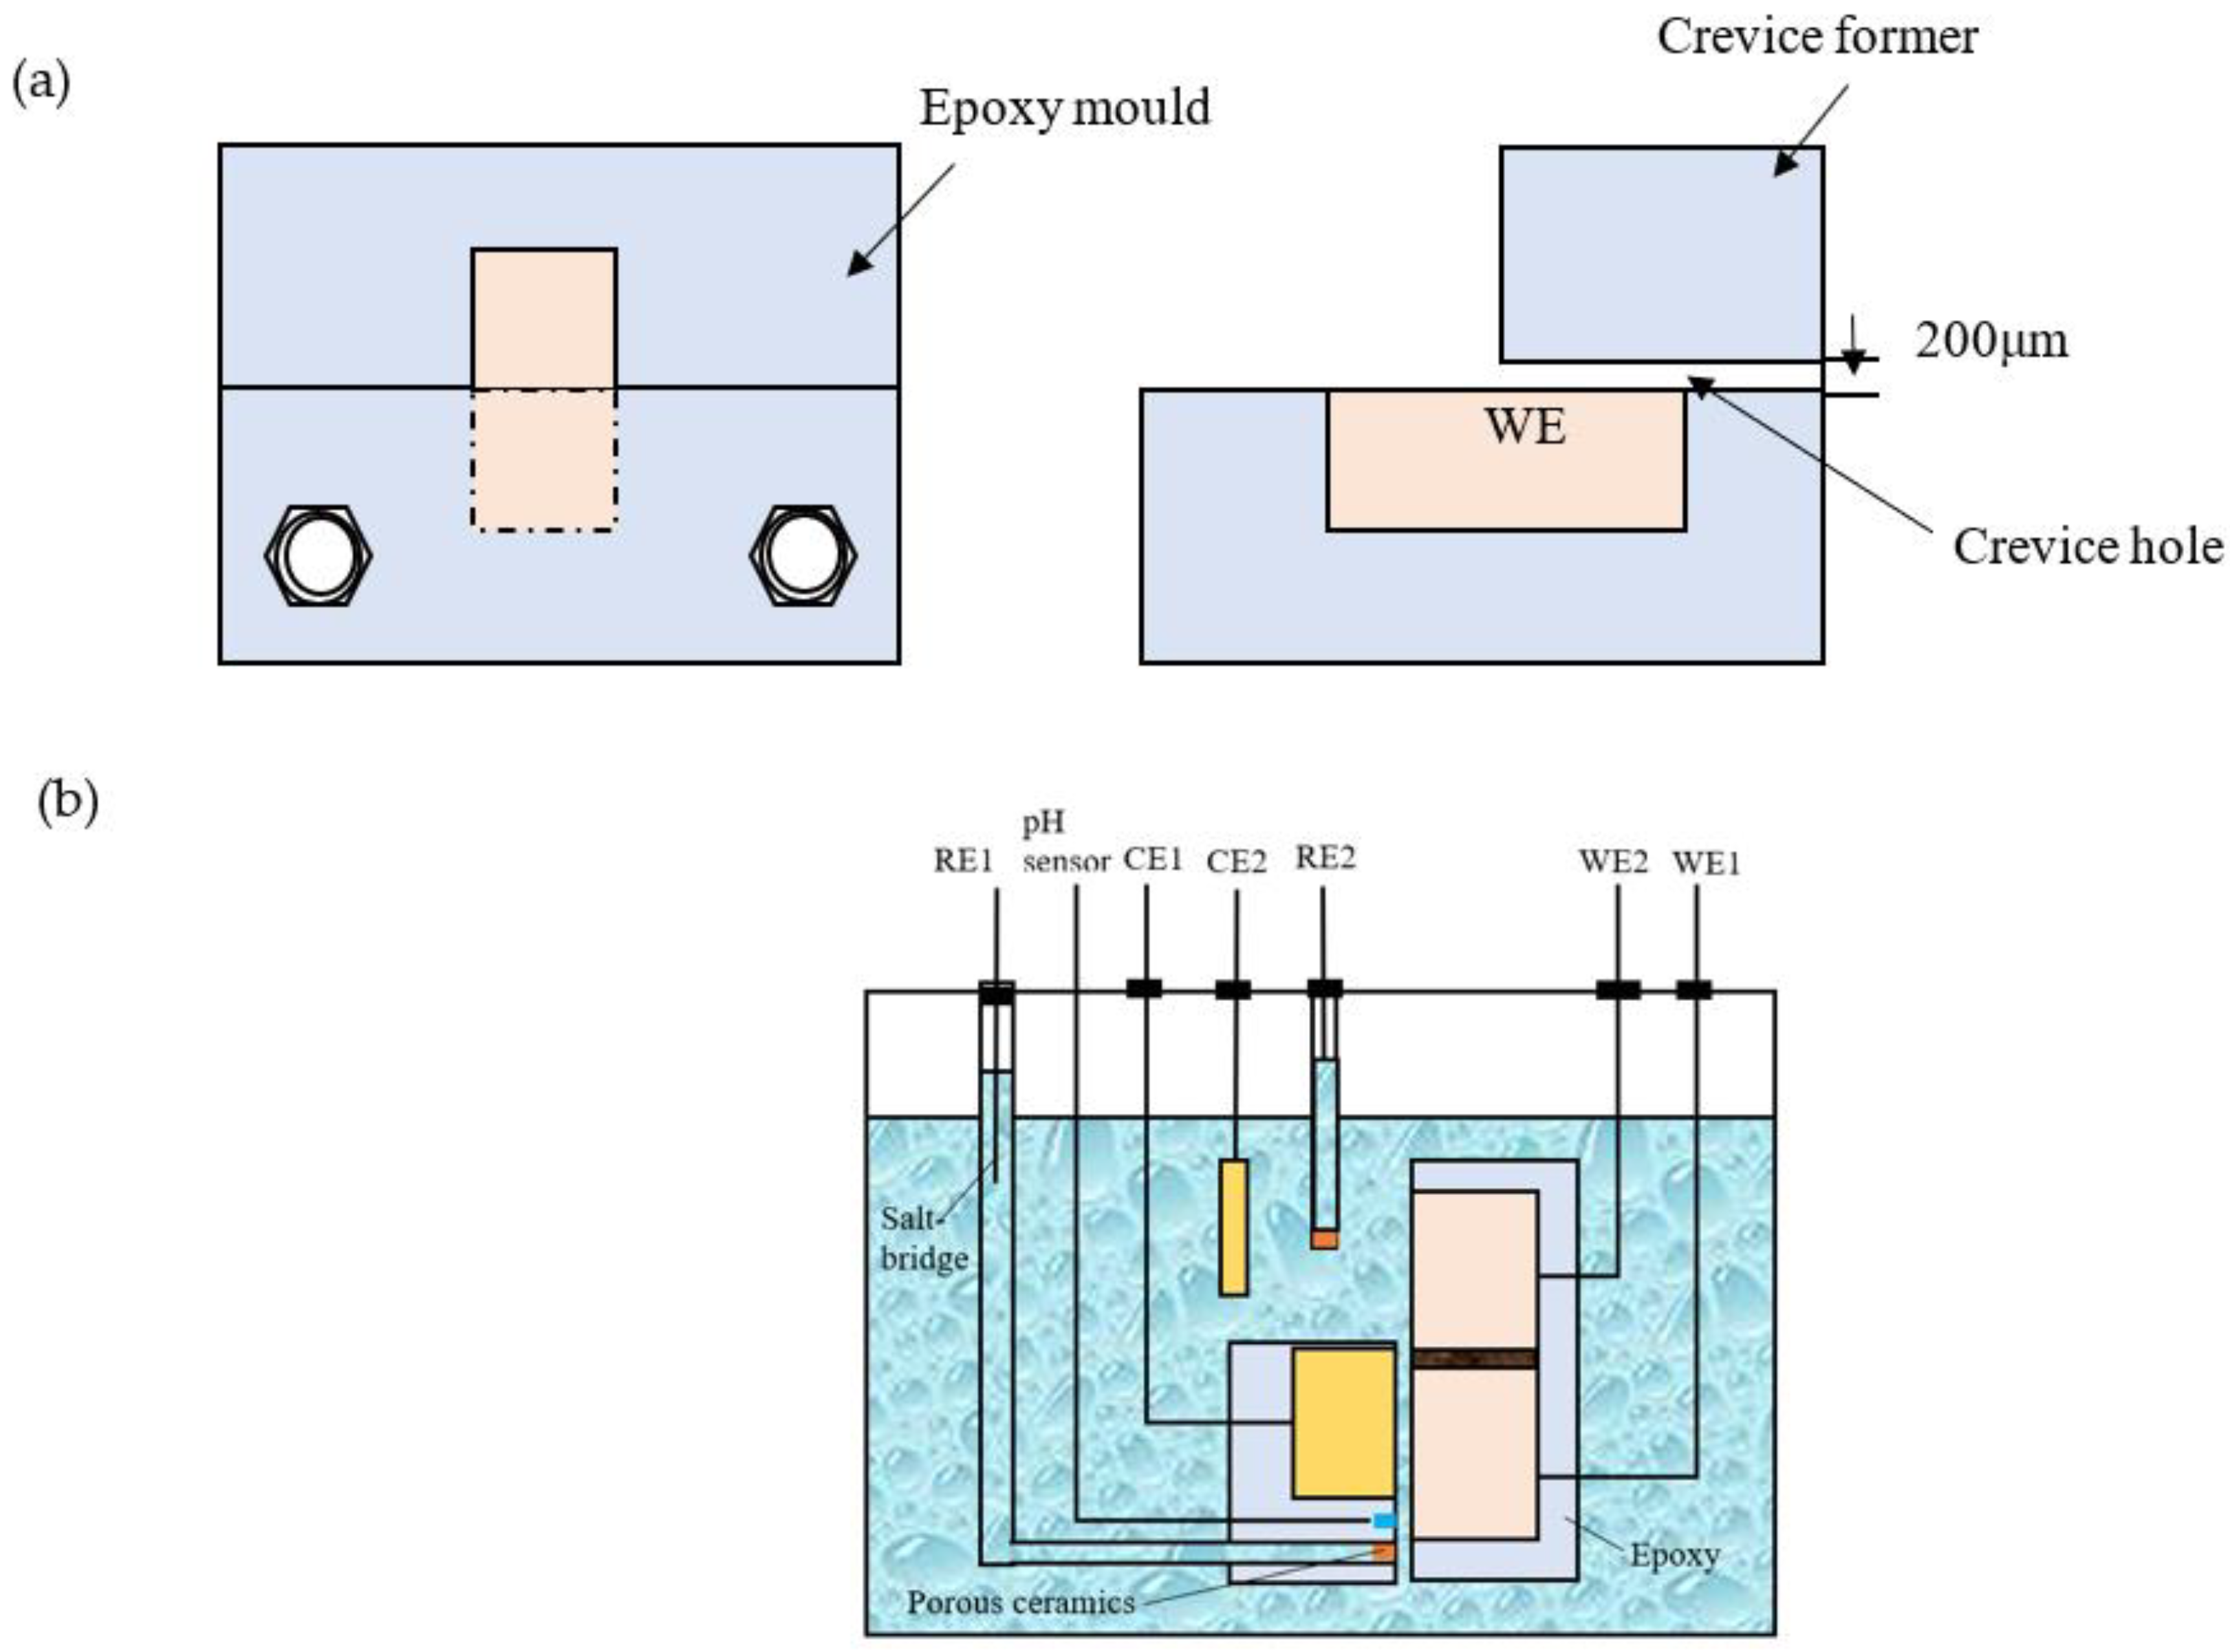
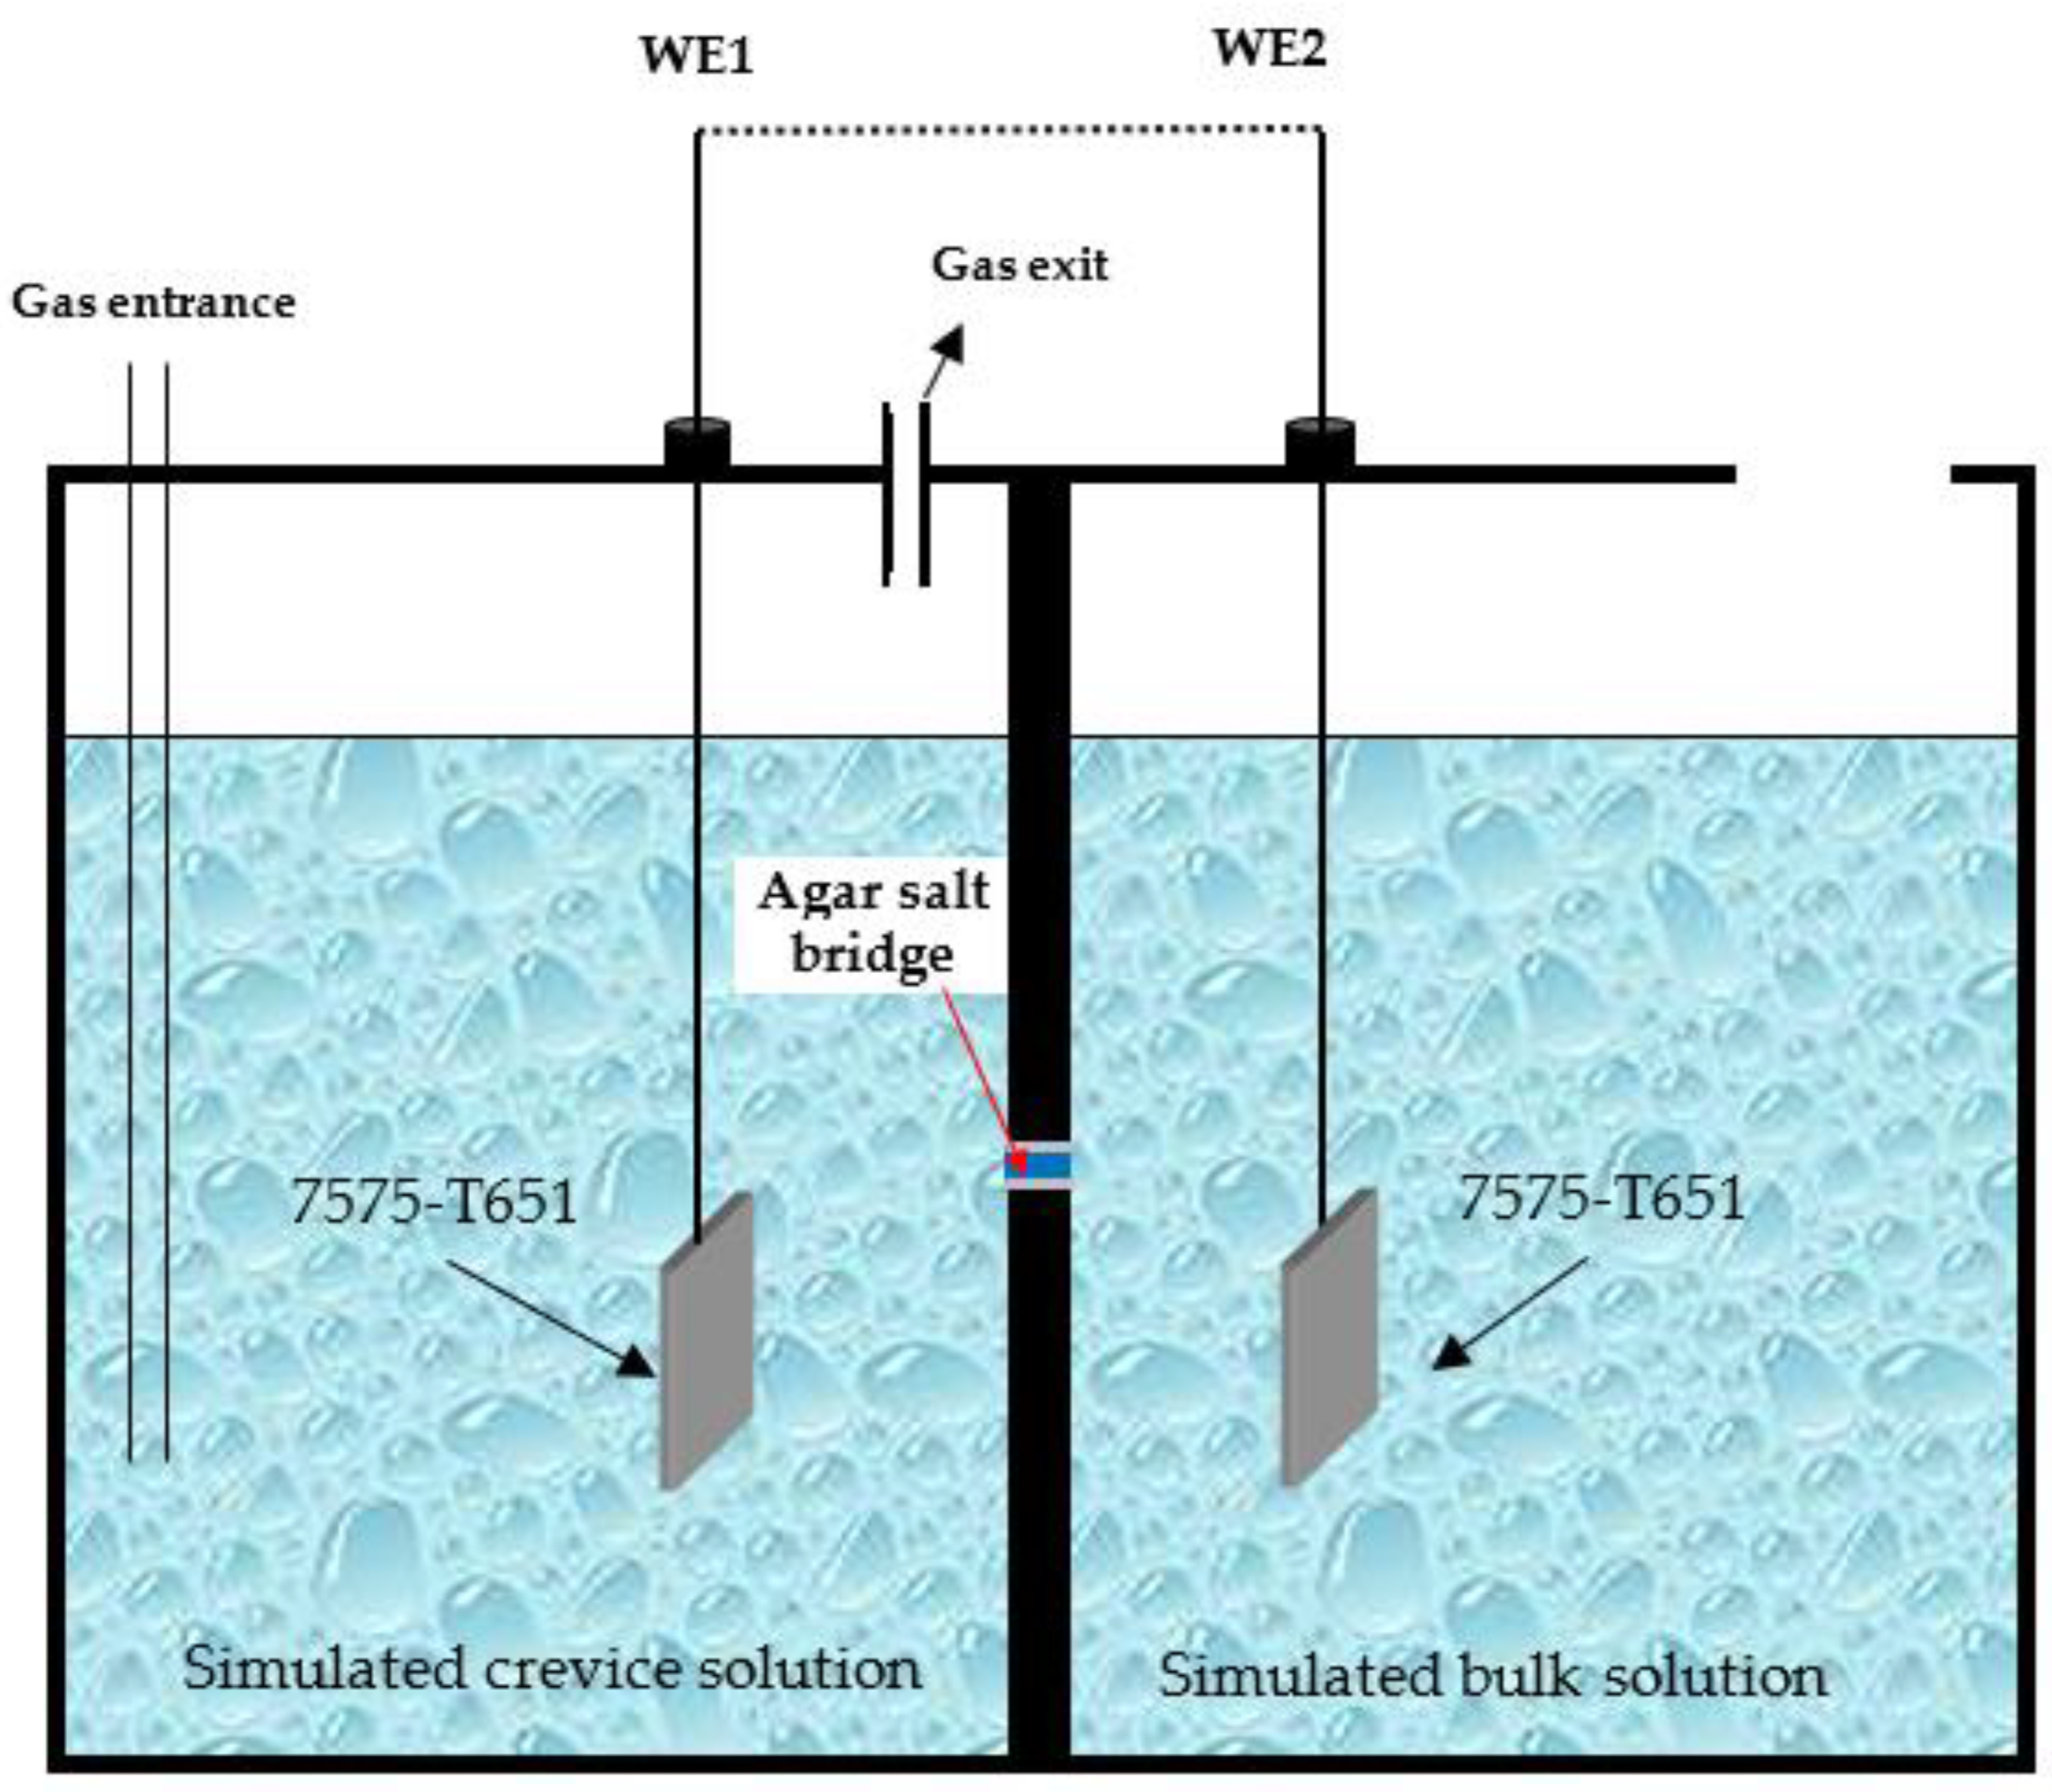
2.2. Configuration of Crevice and Experimental Device
2.3. Electrochemical Tests
2.4. Morphology Analysis
3. Results
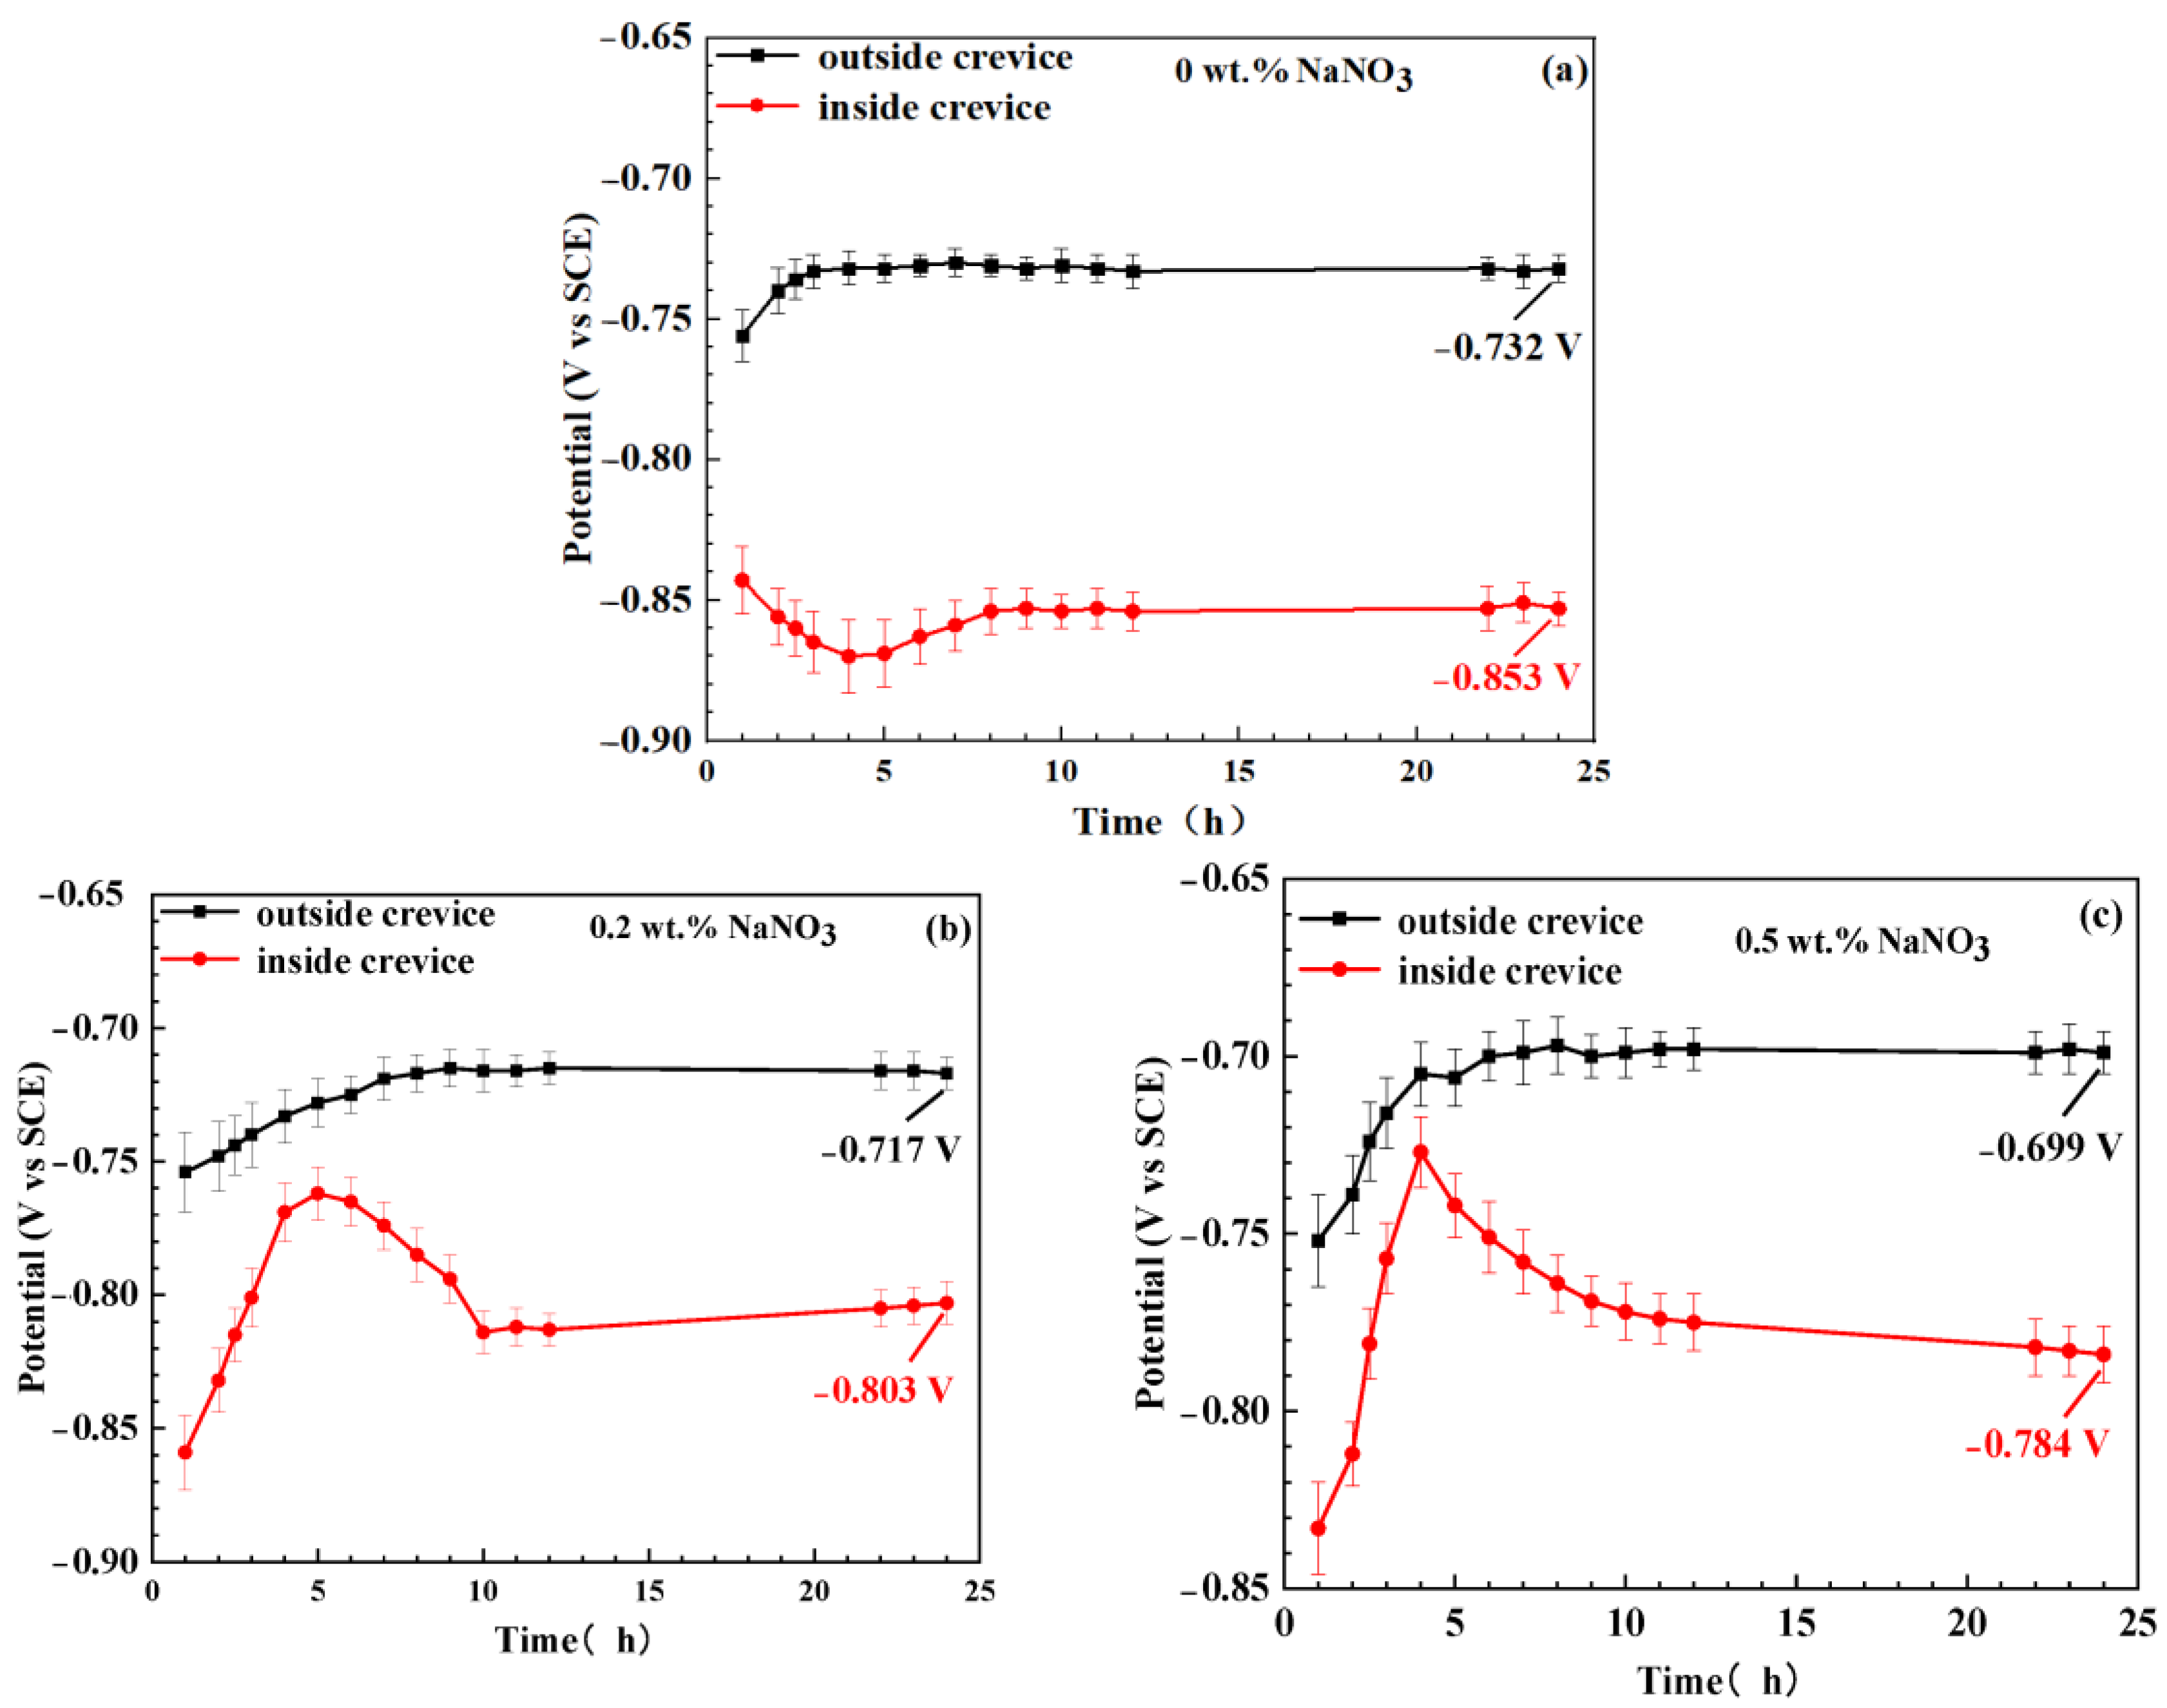
3.1. OCP Tests
3.2. Potentiodynamic Polarization Curve Tests
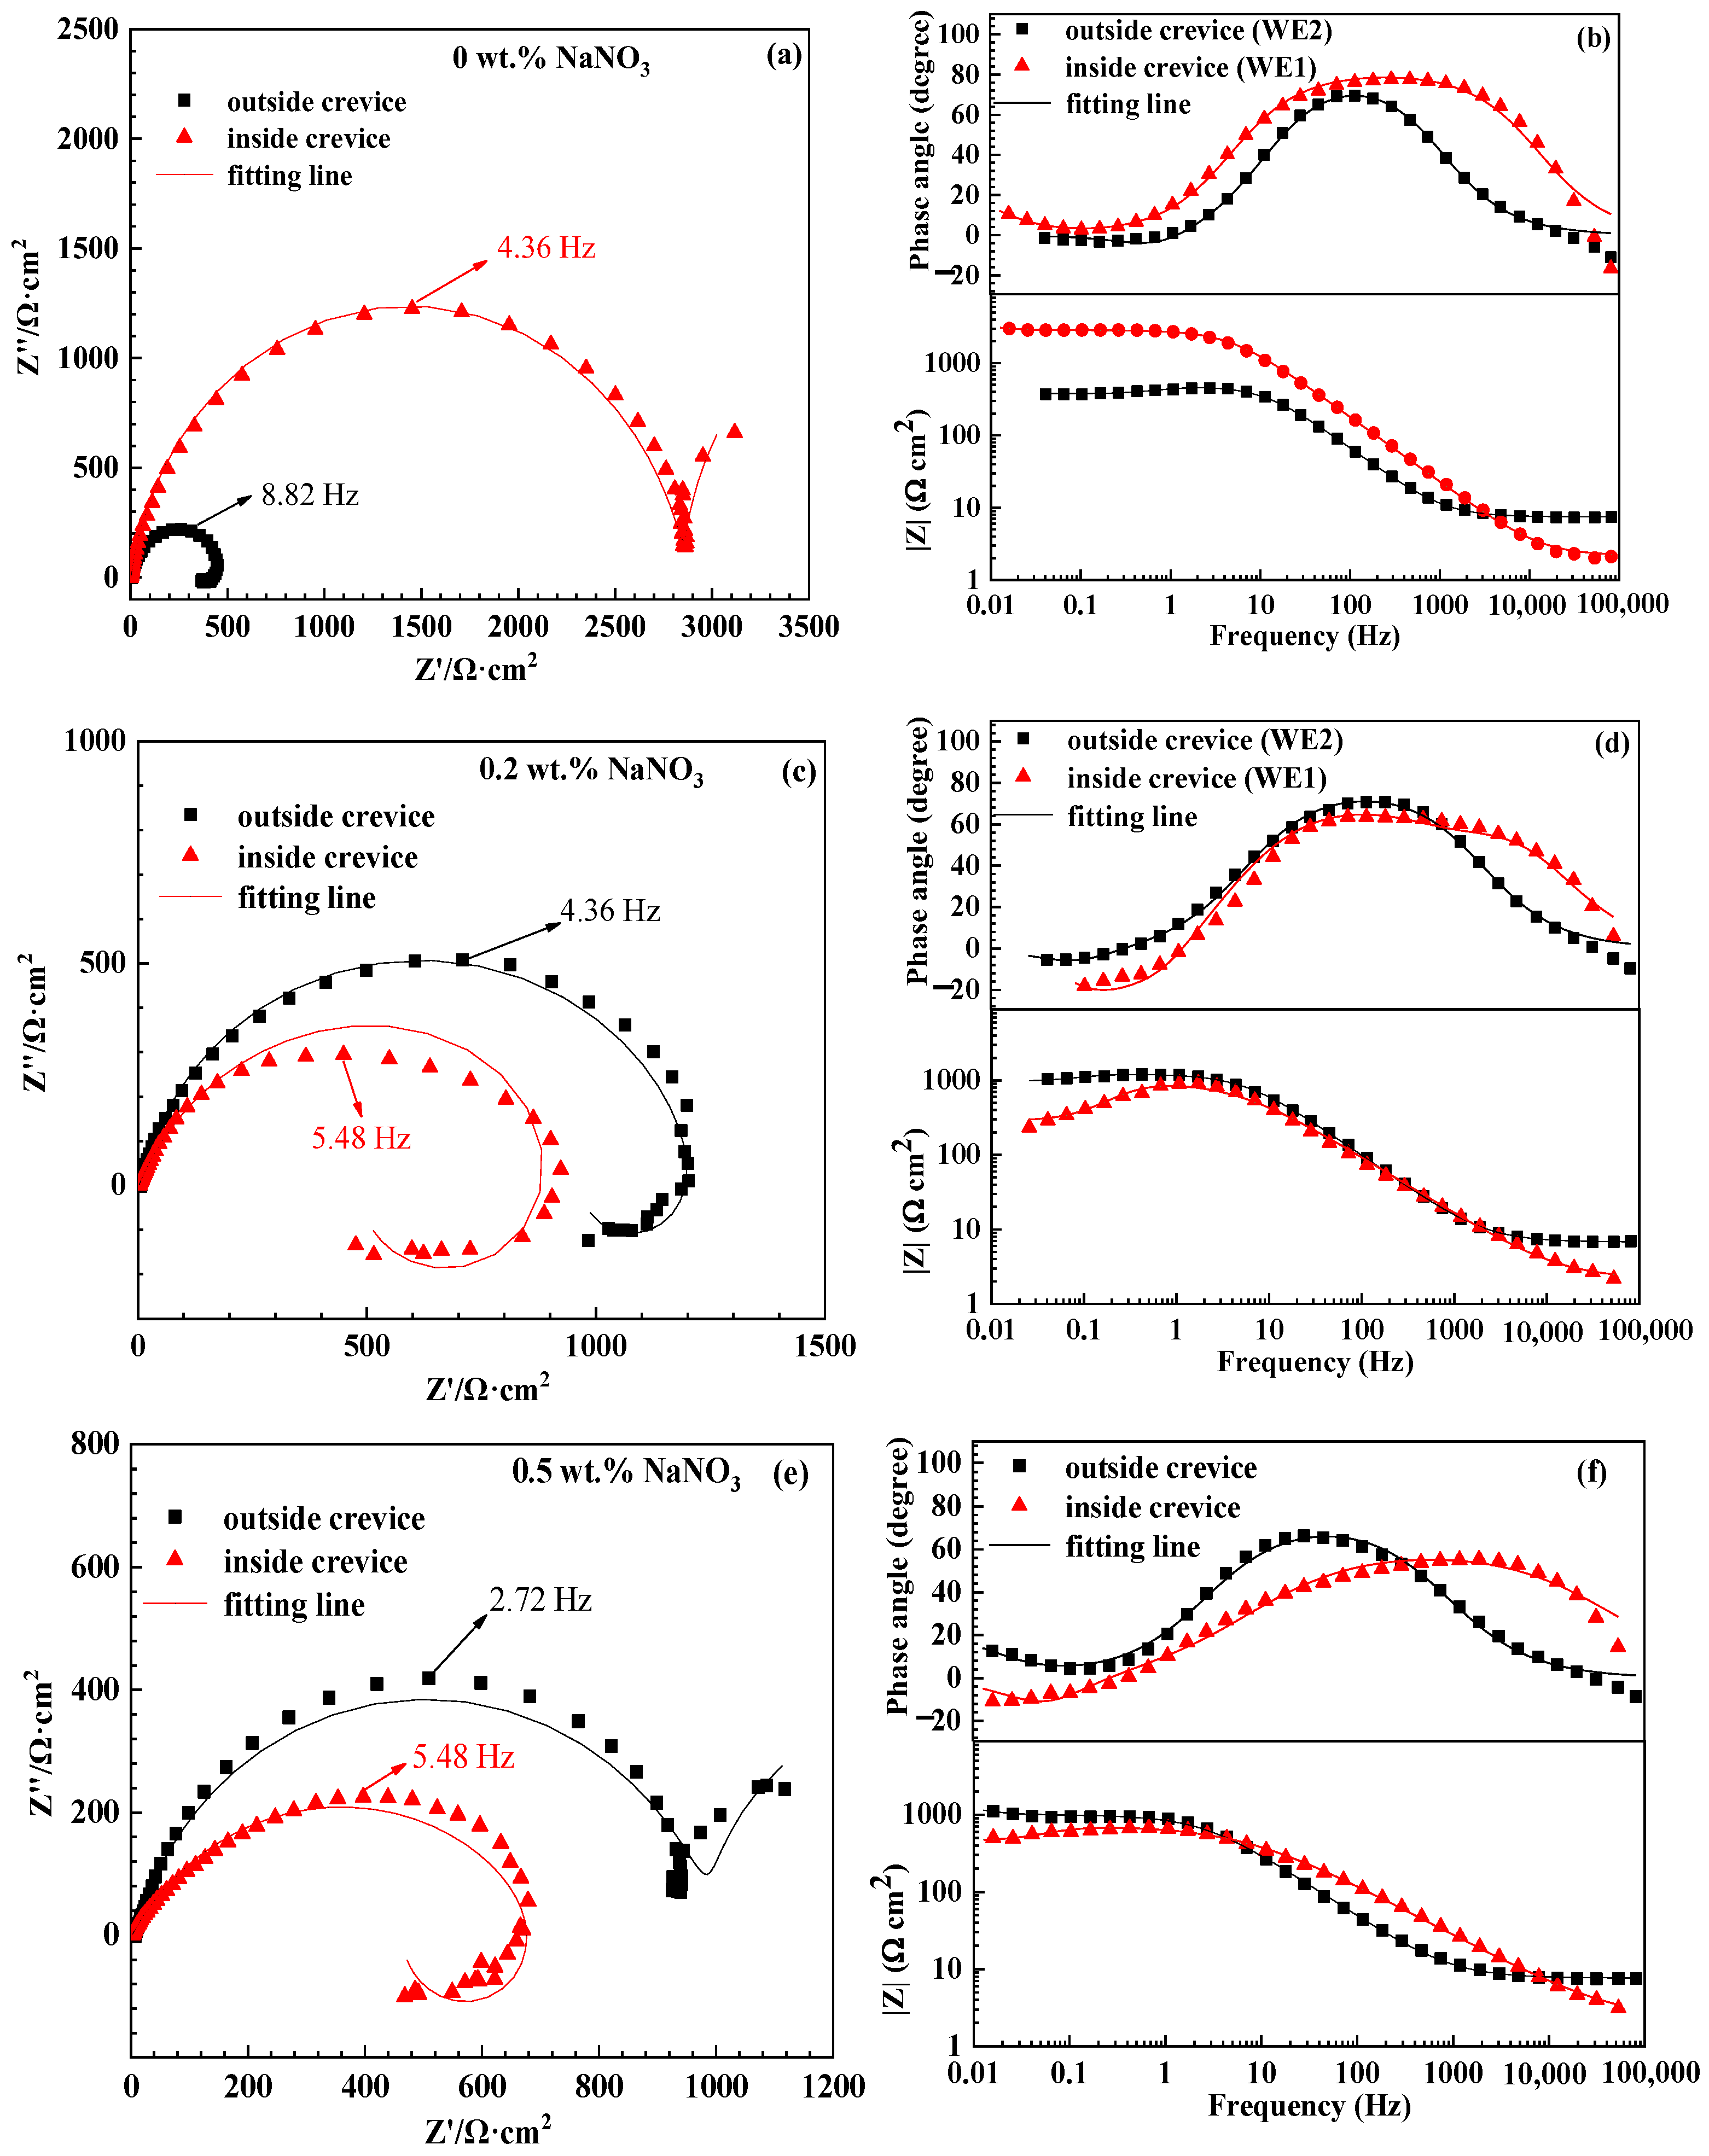
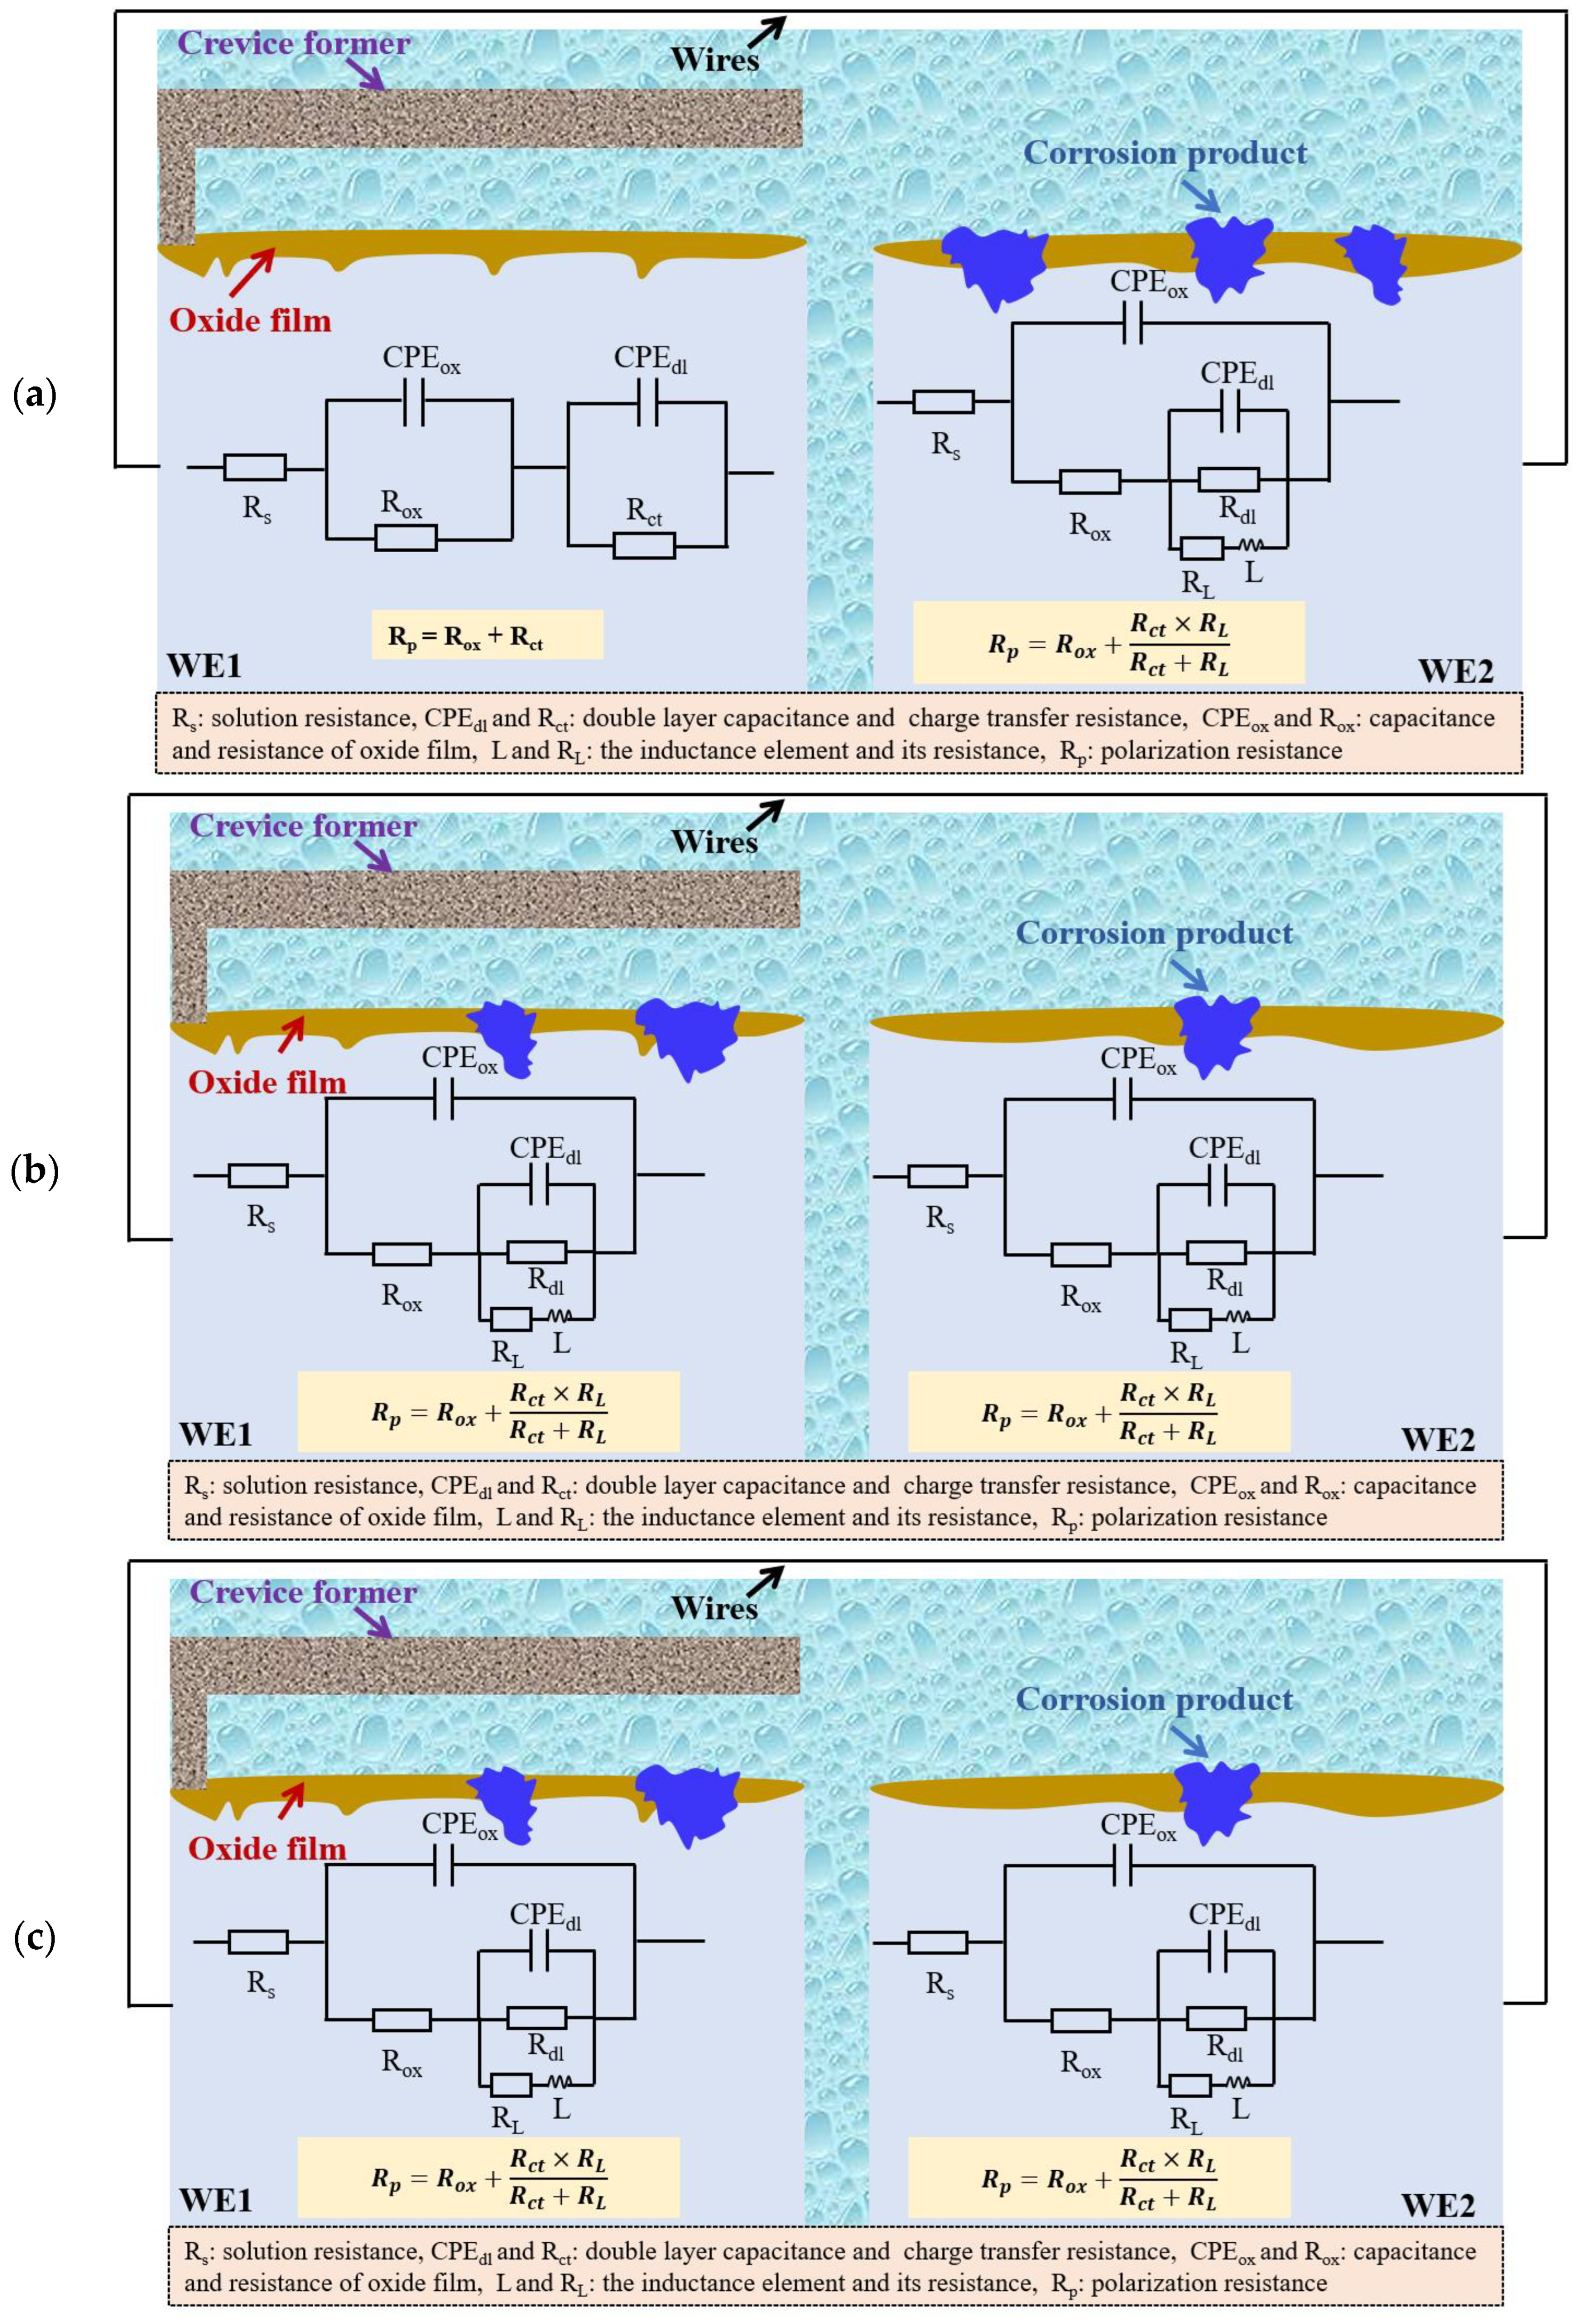
3.3. EIS Tests
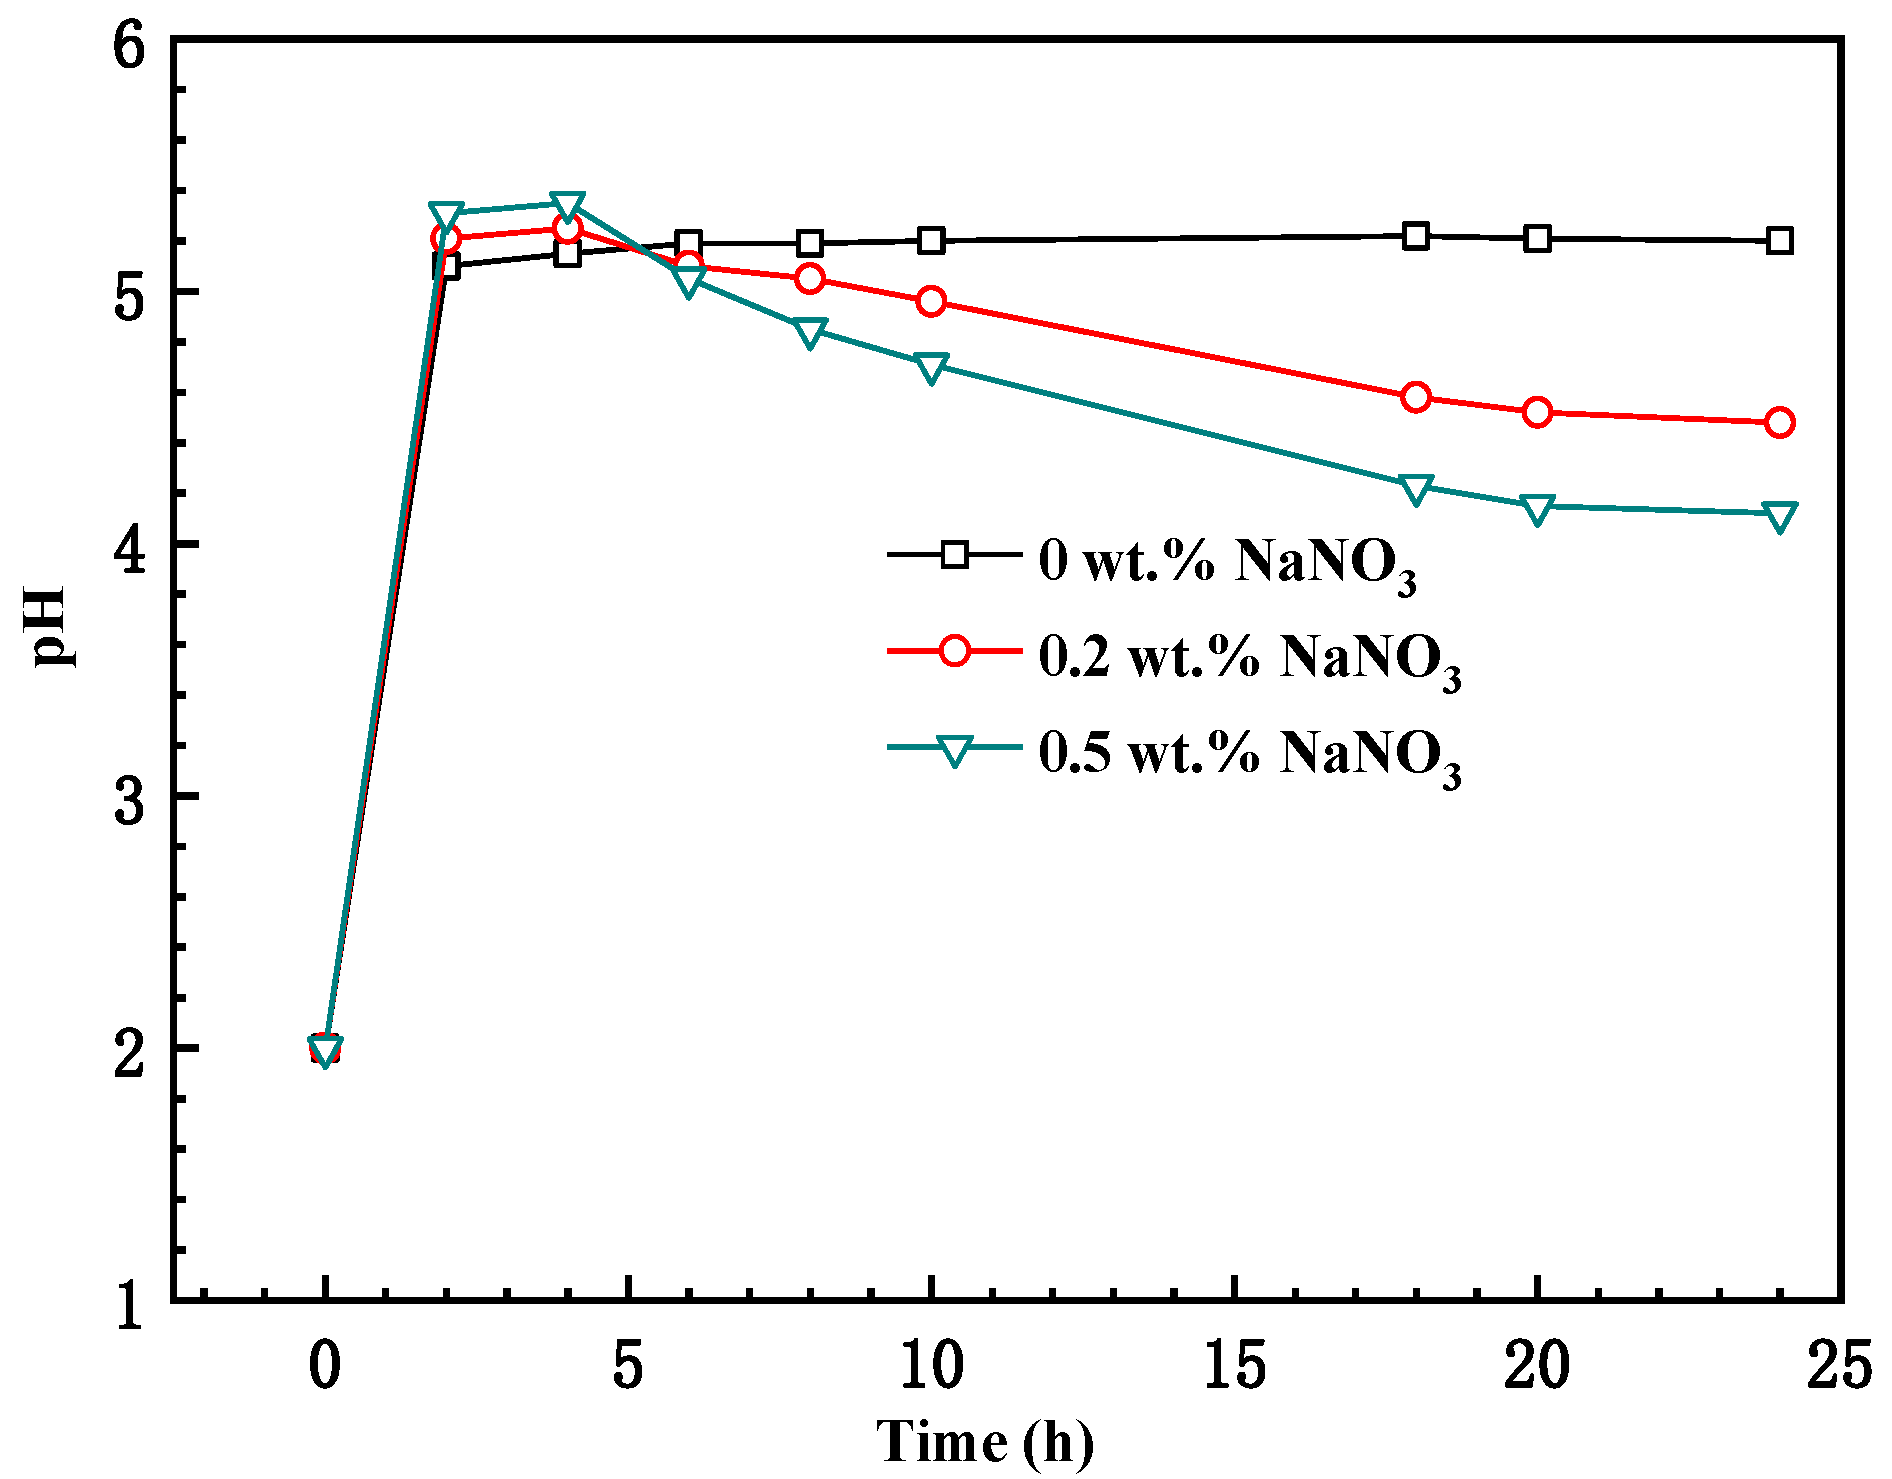
3.4. pH Concentration Measurement
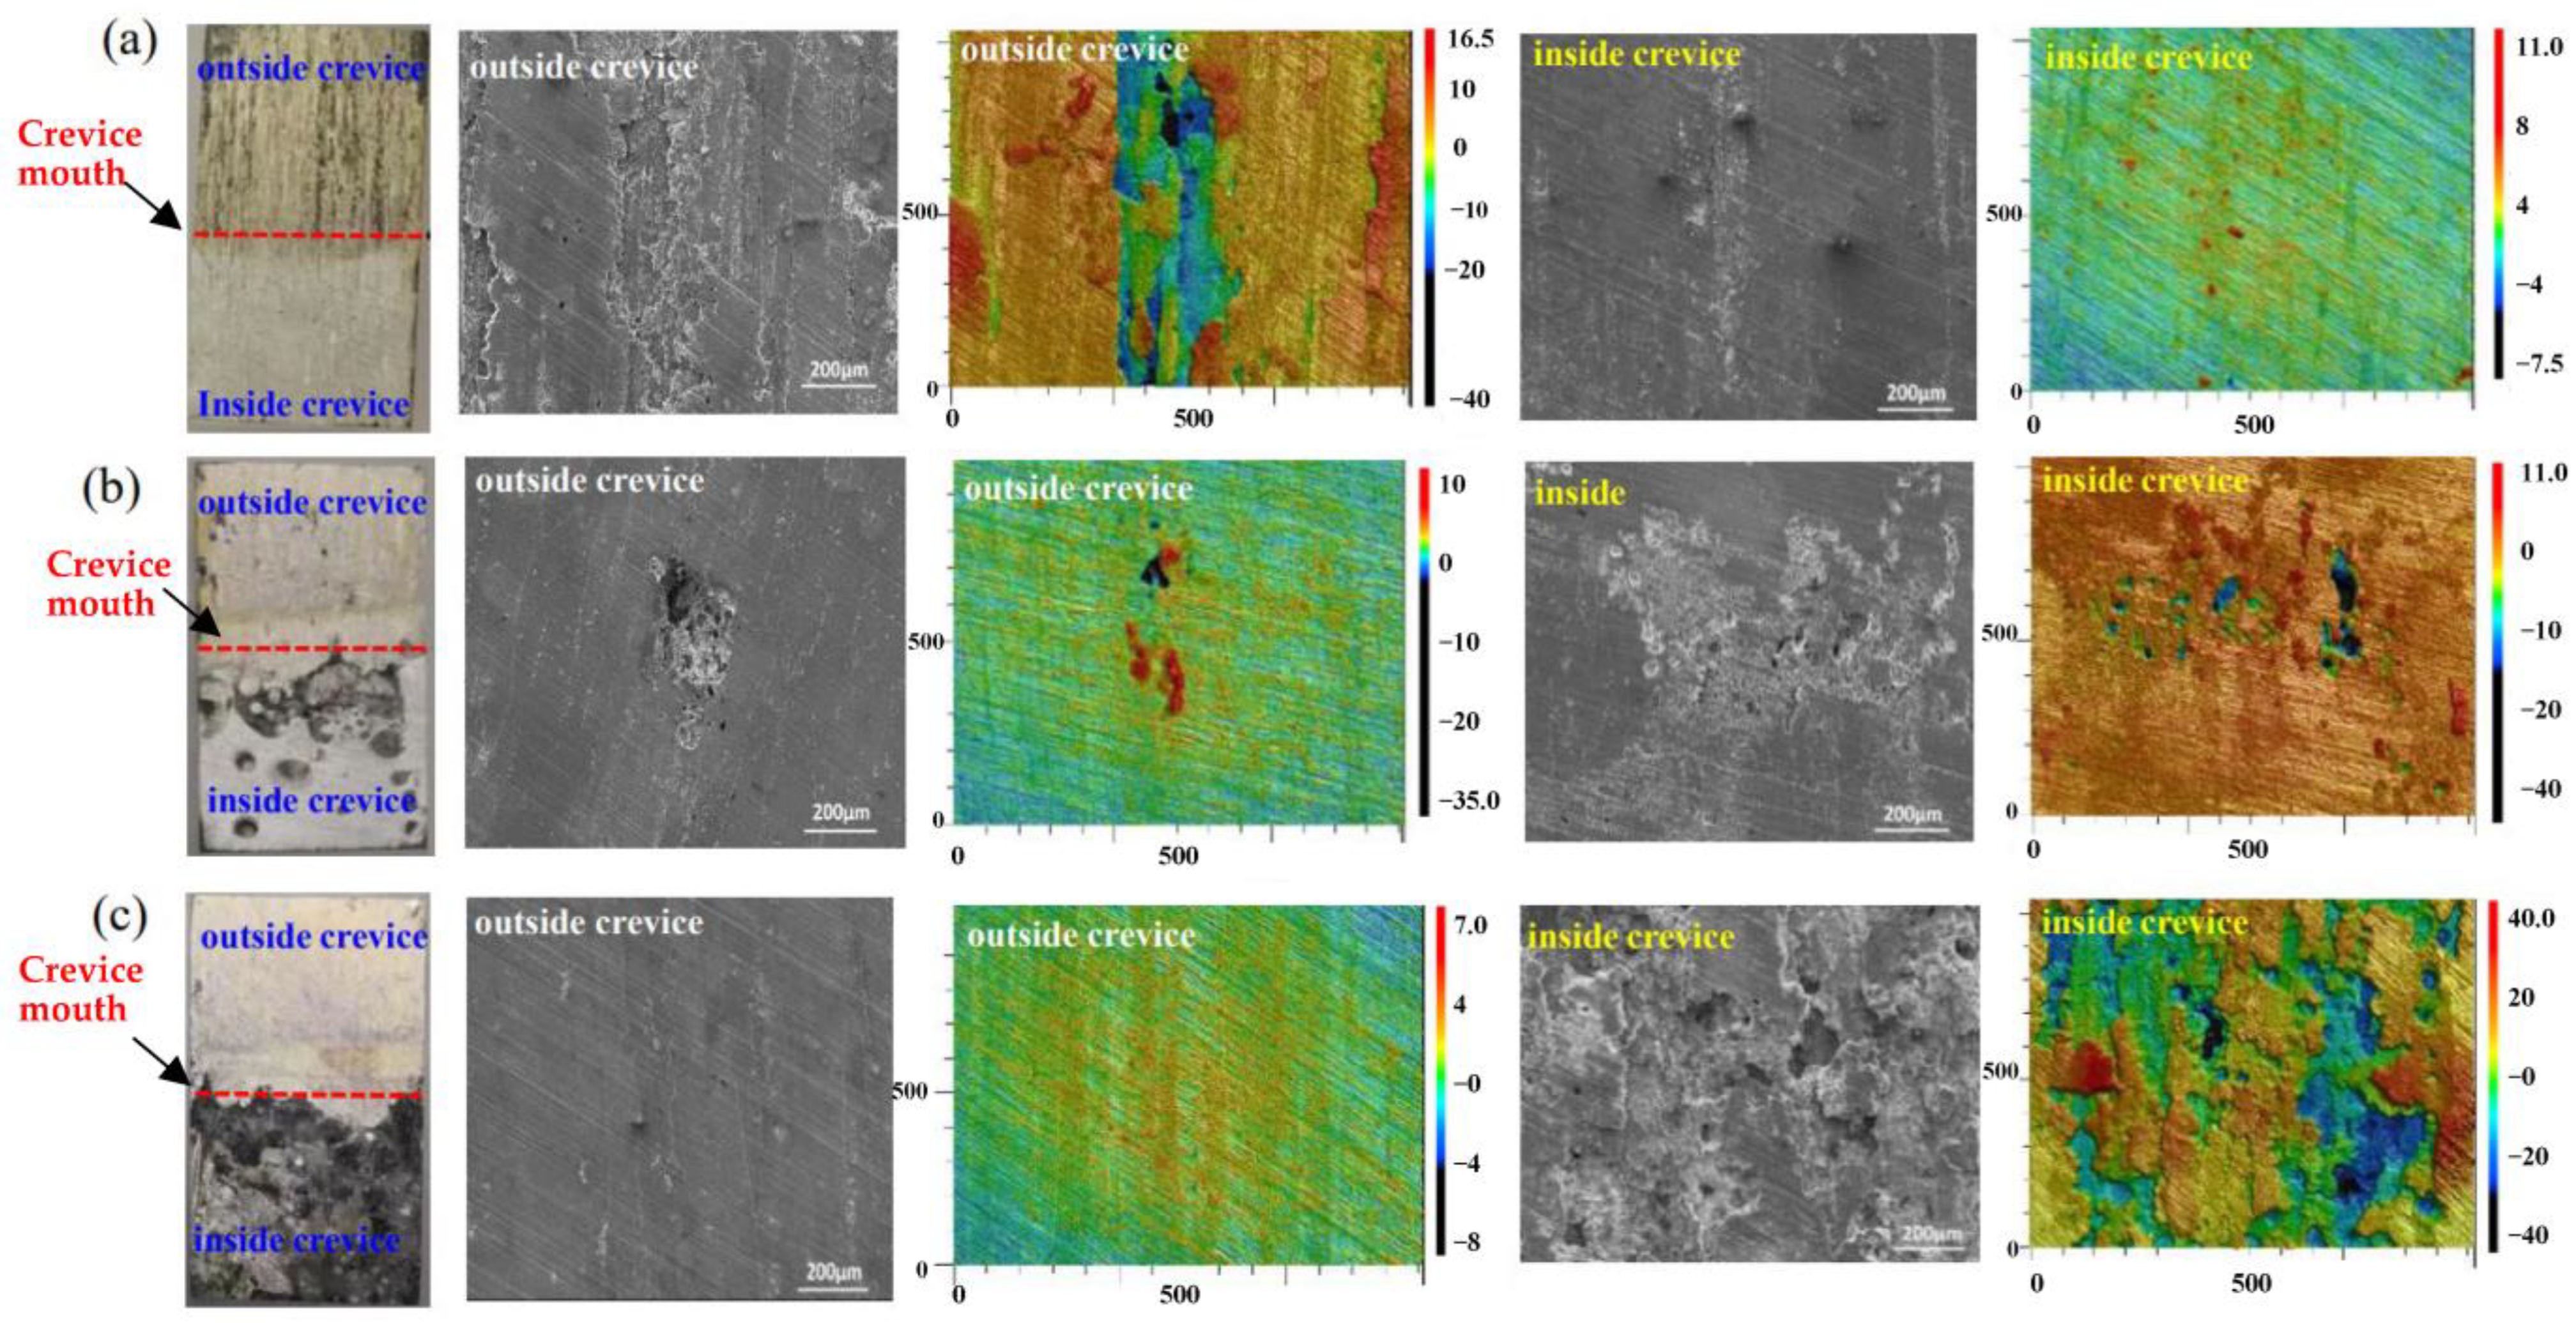
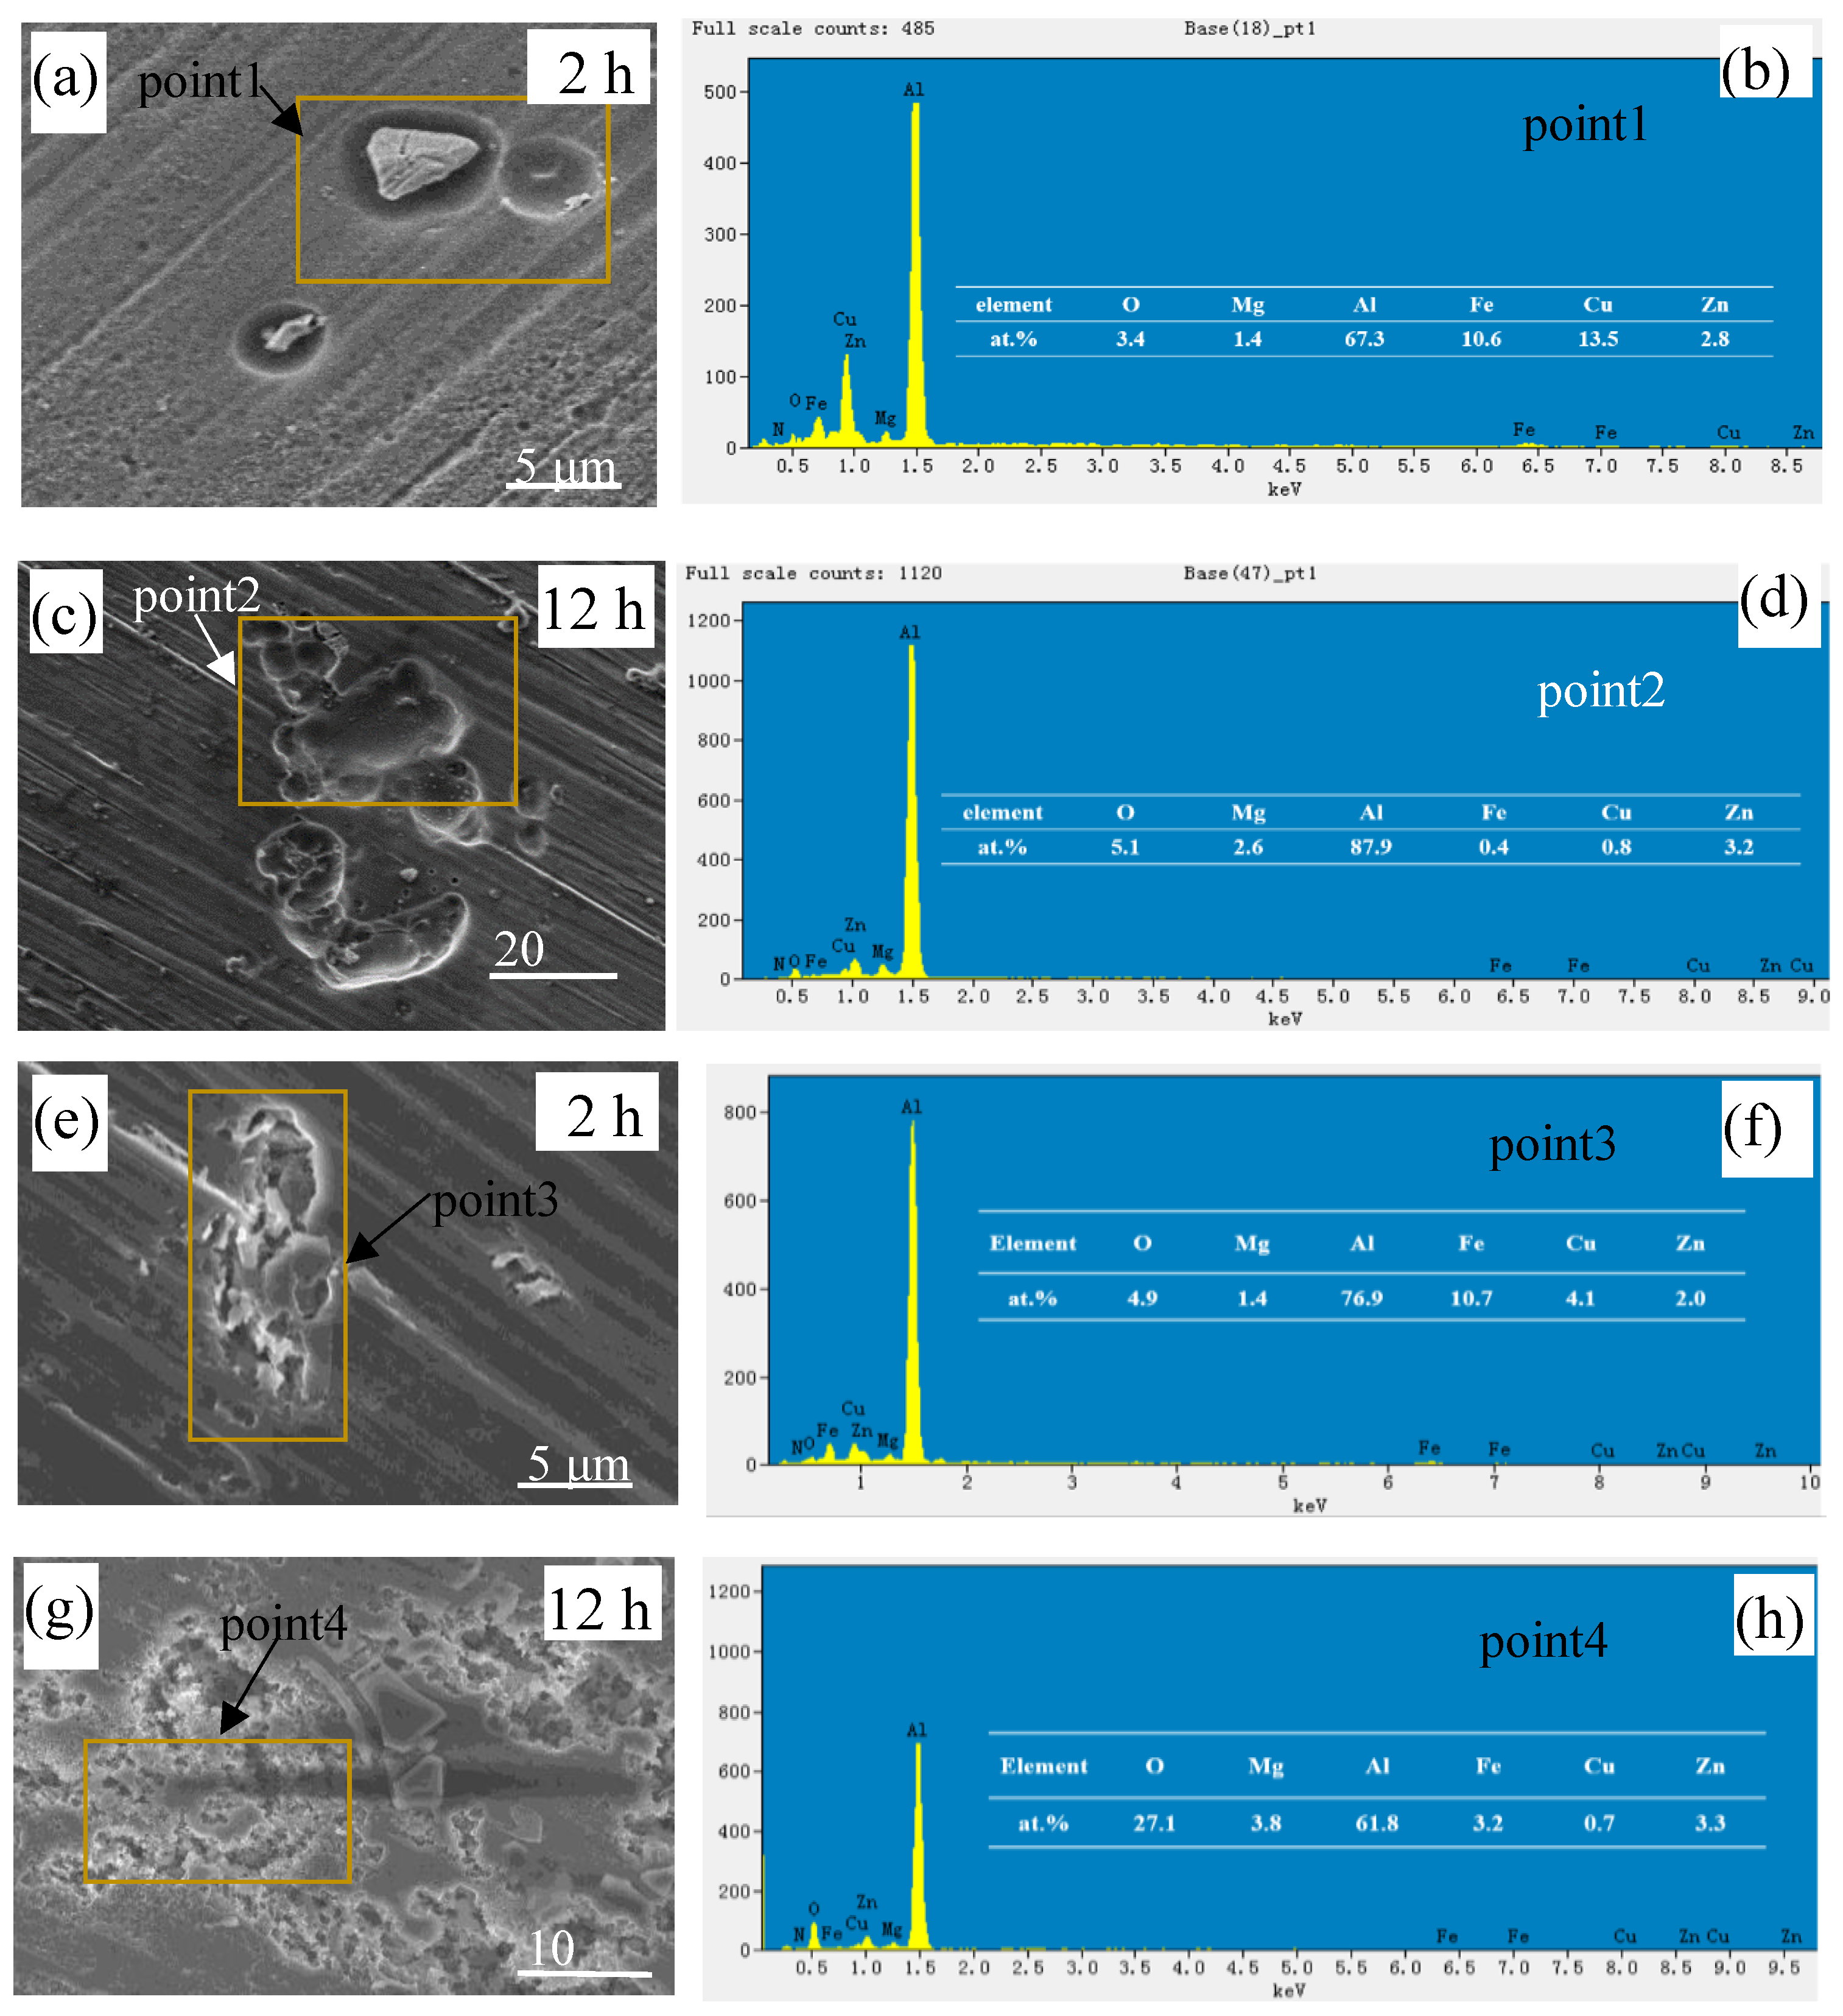
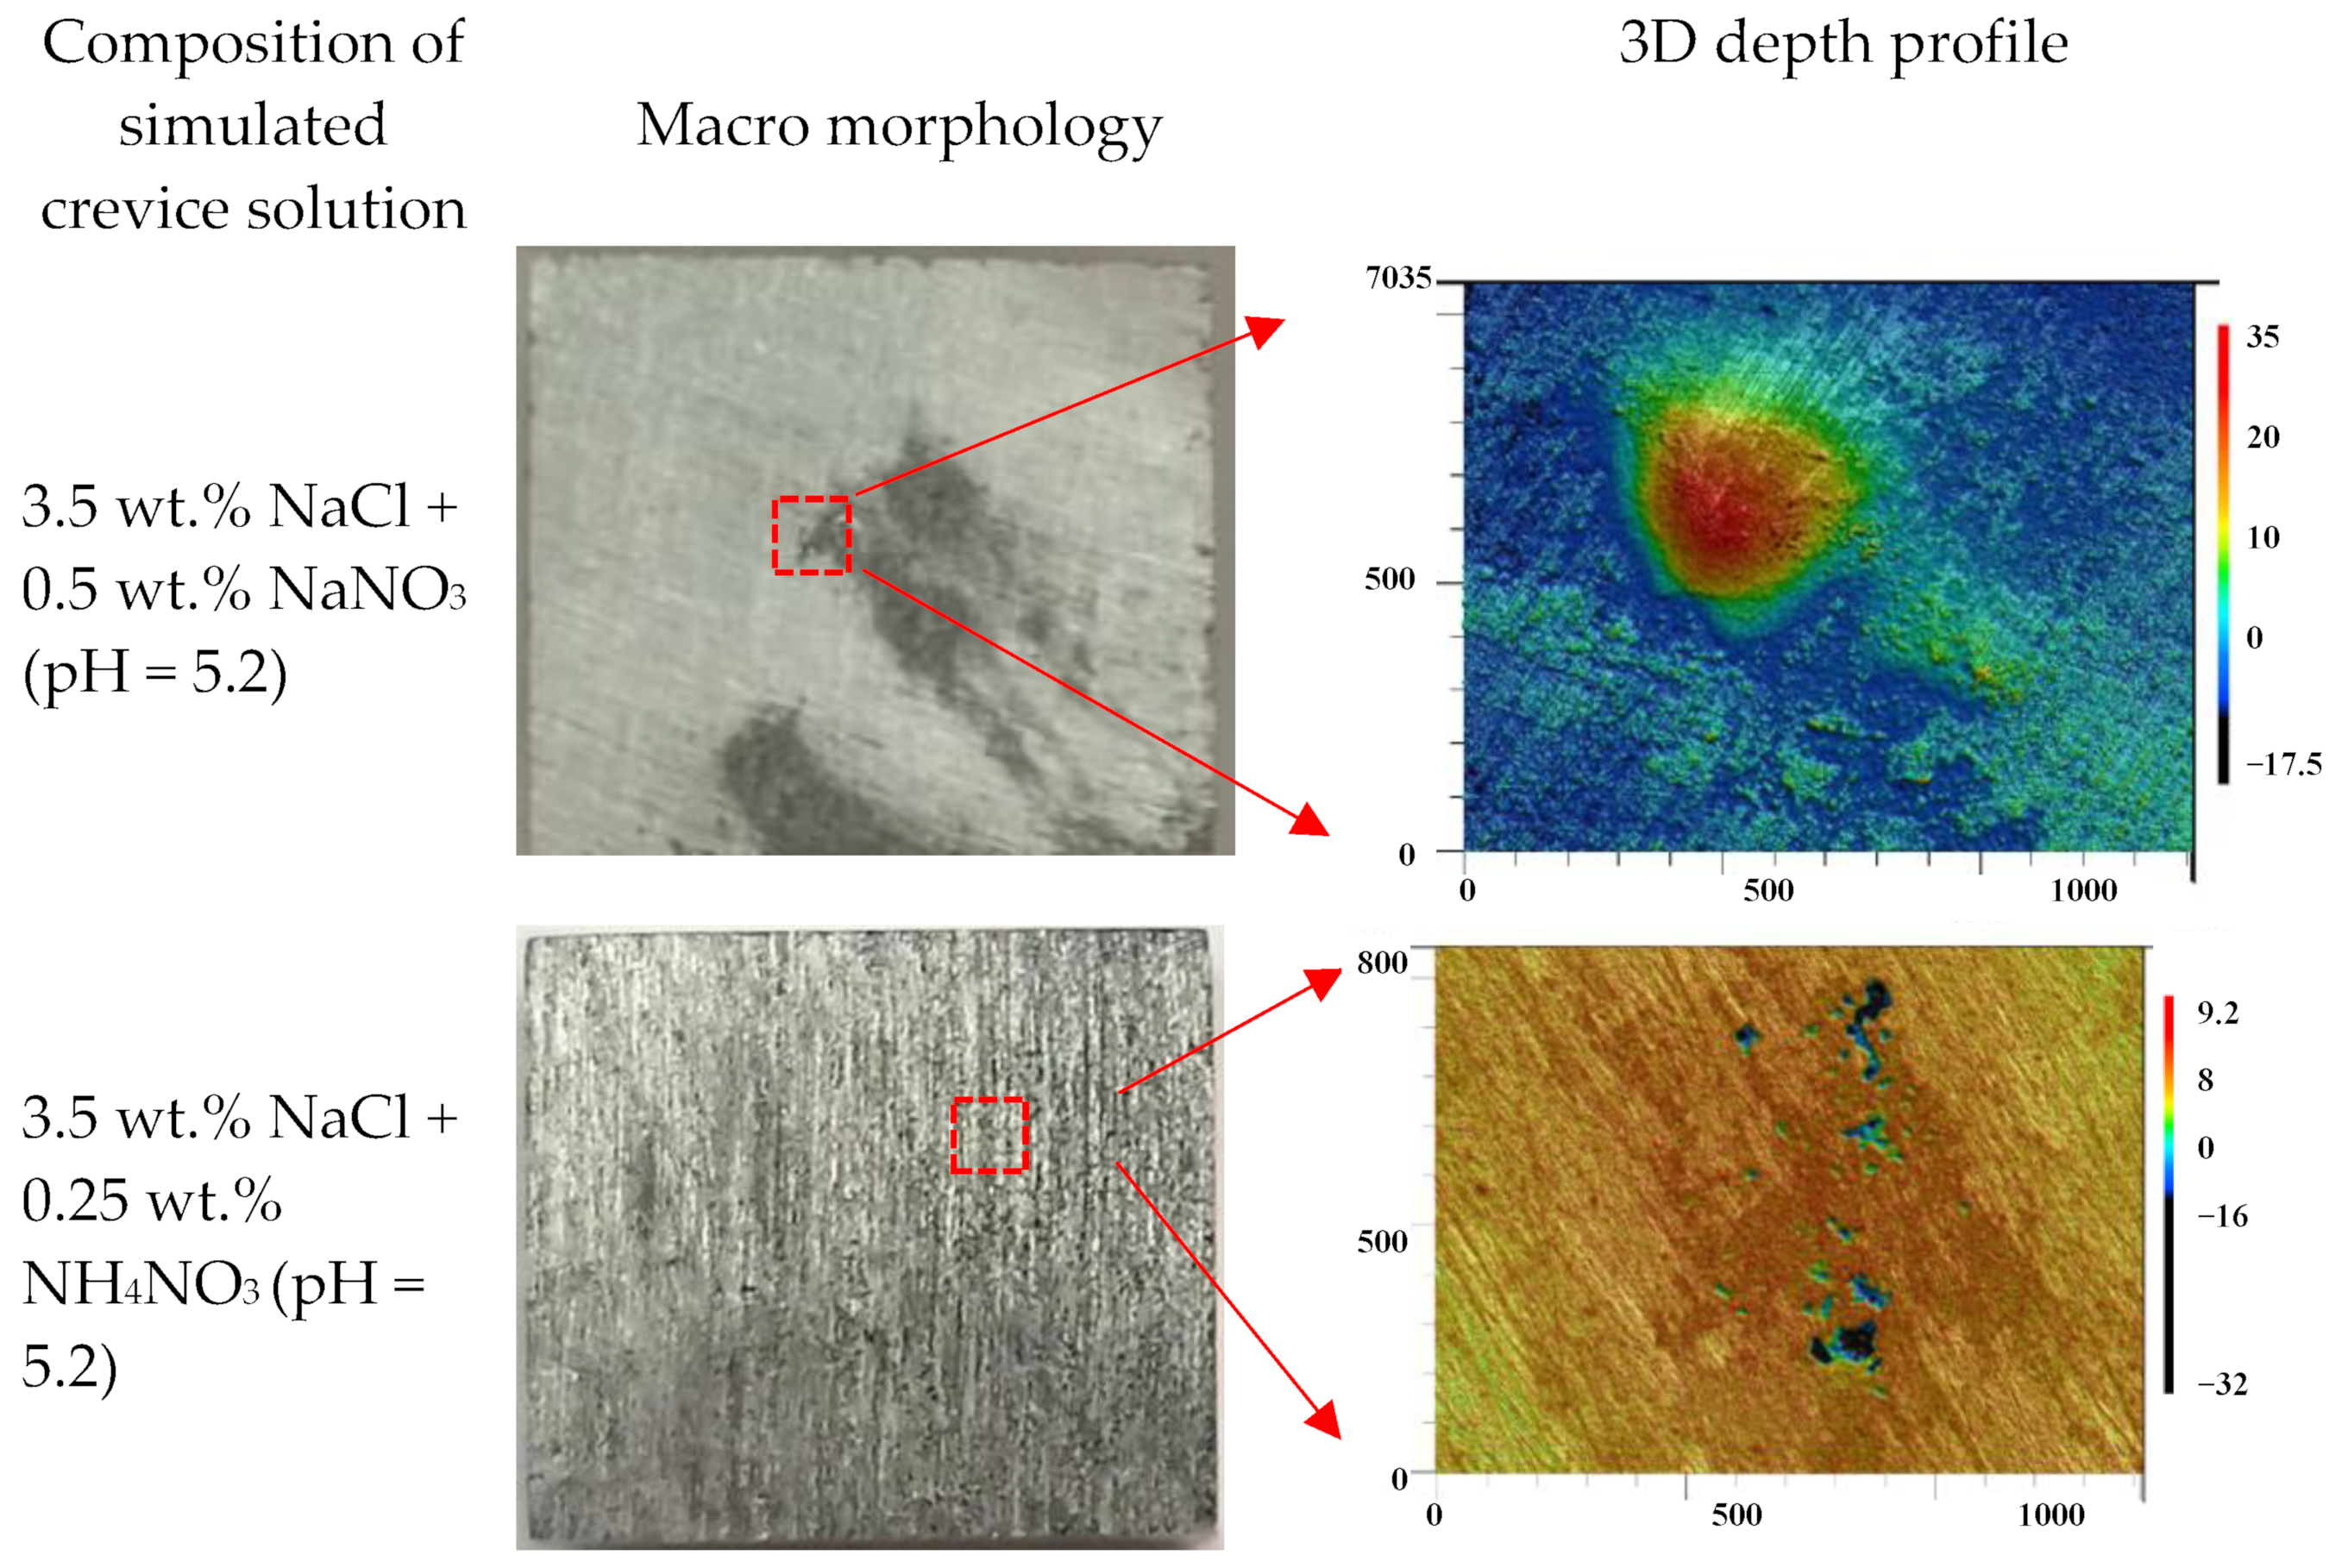
3.5. Corrosion Morphology Analysis
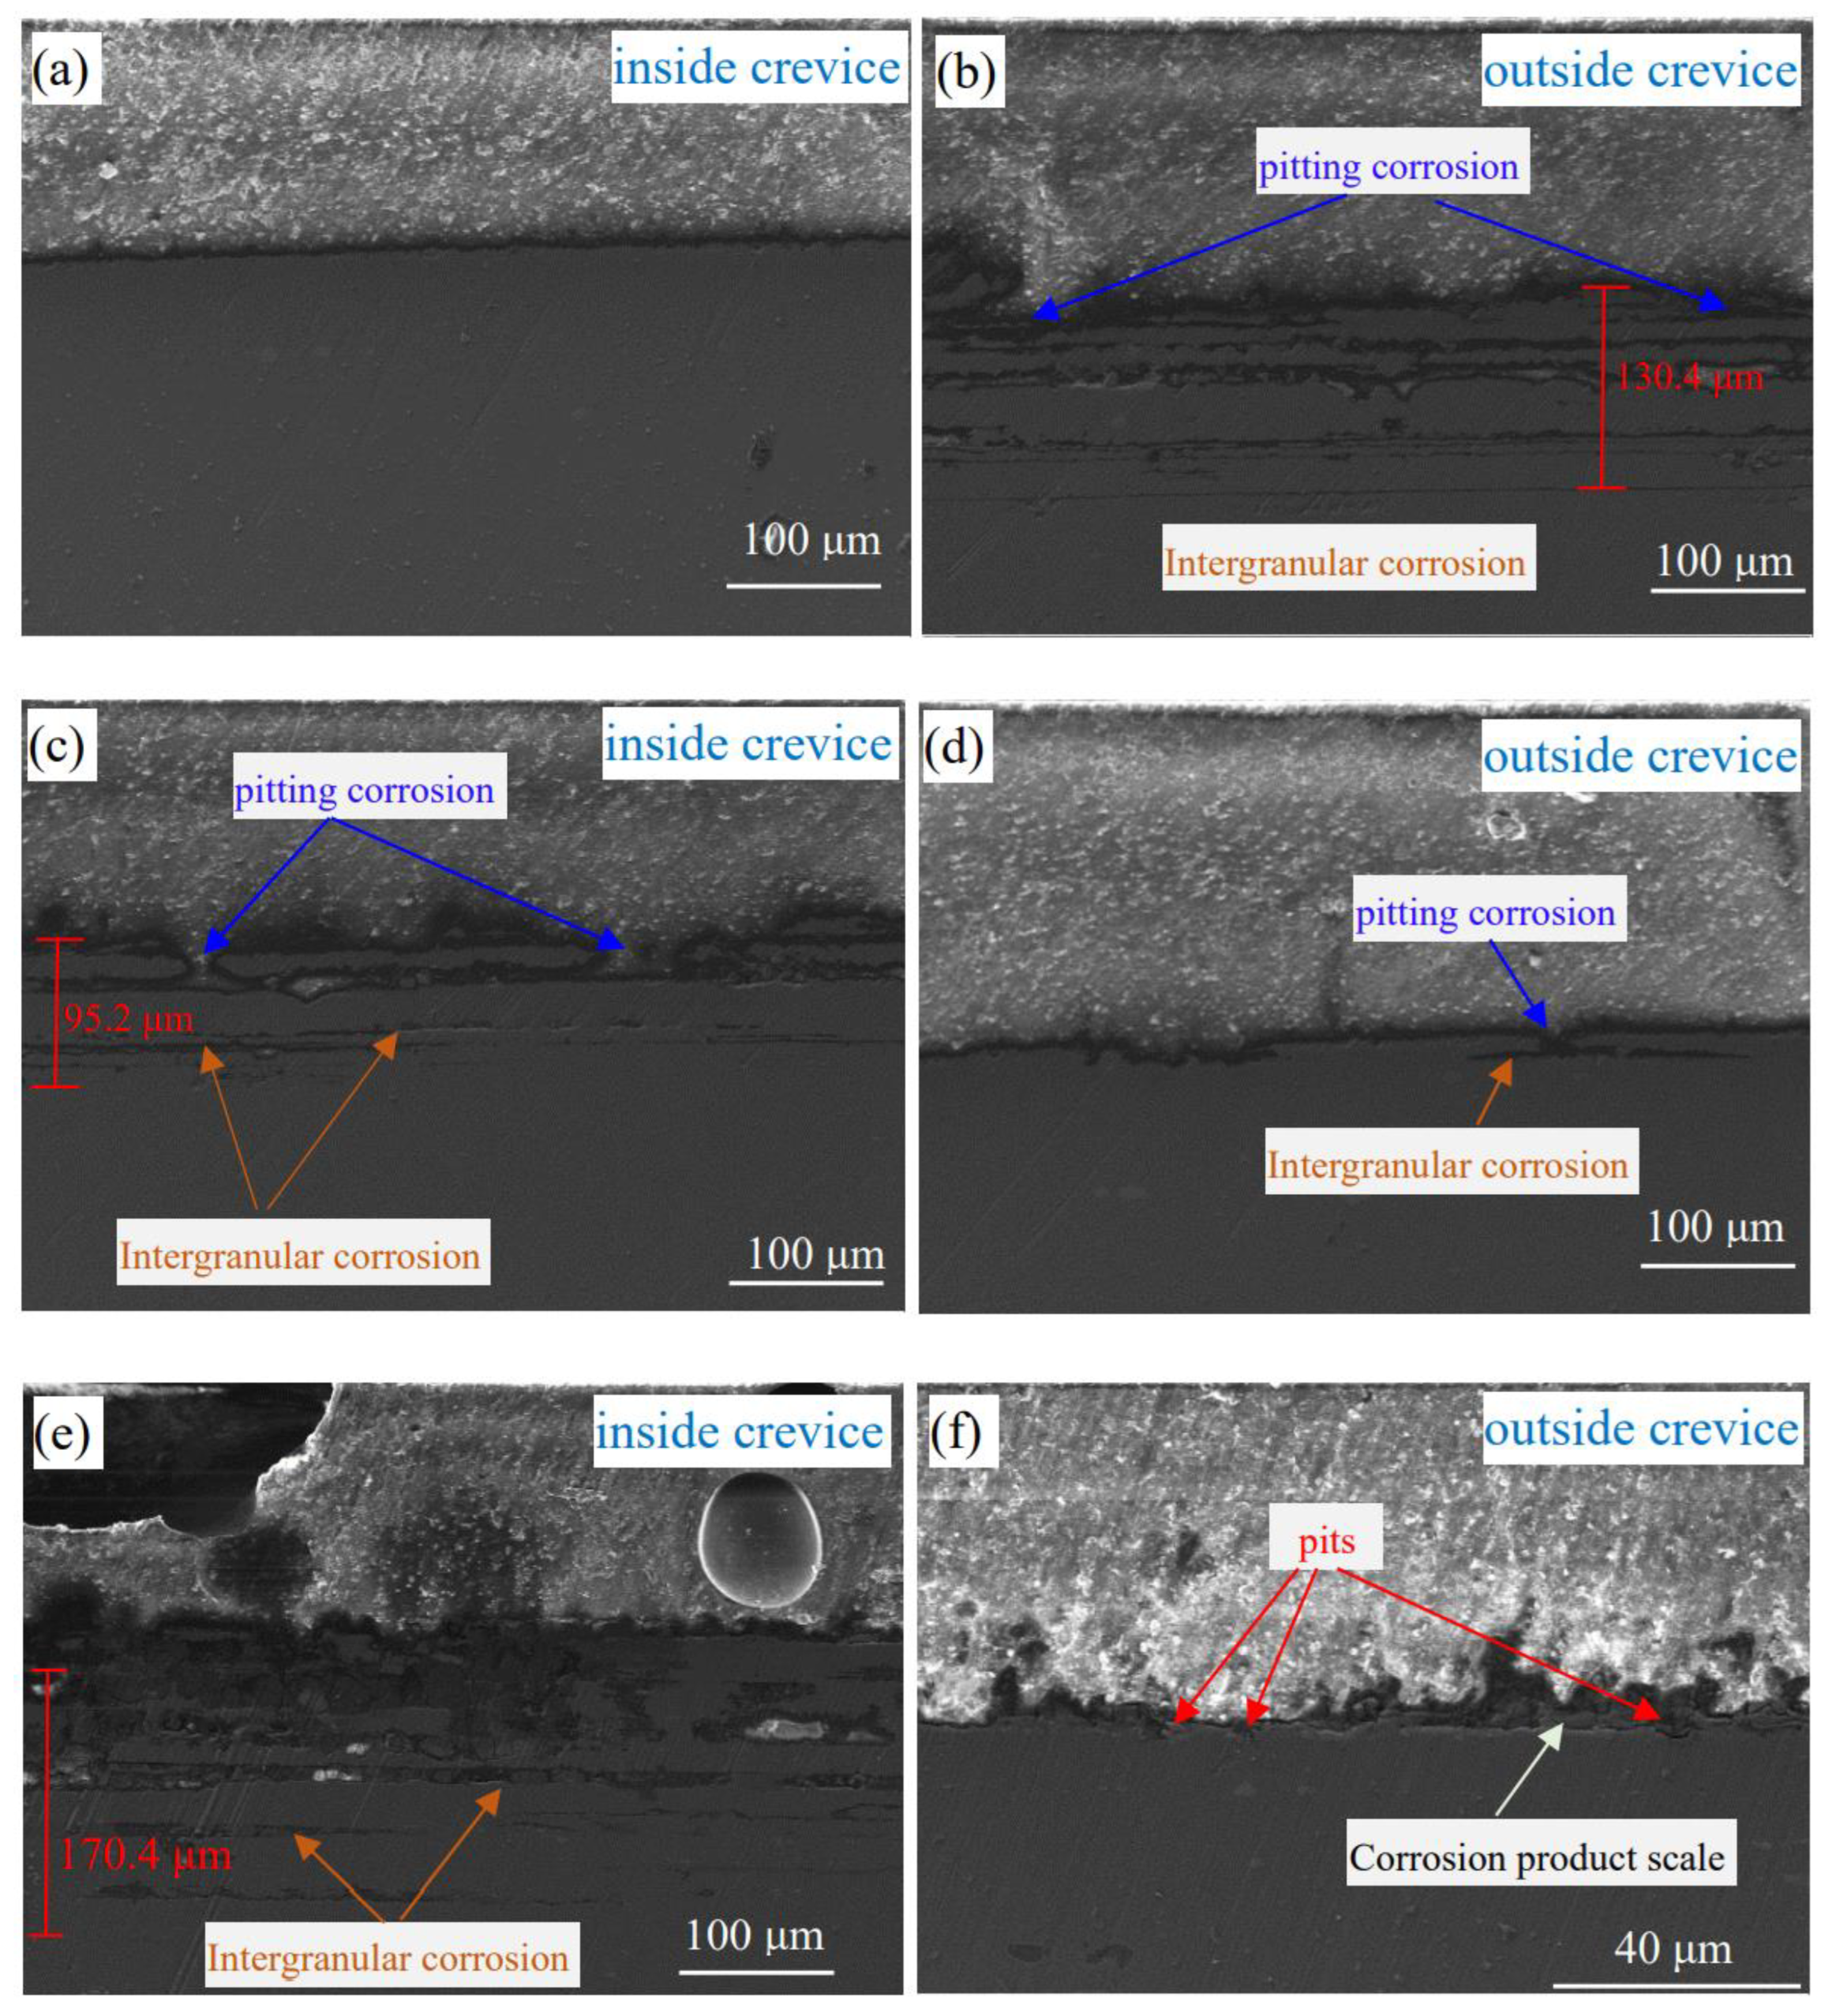
3.6. Cross-Sectional Morphology
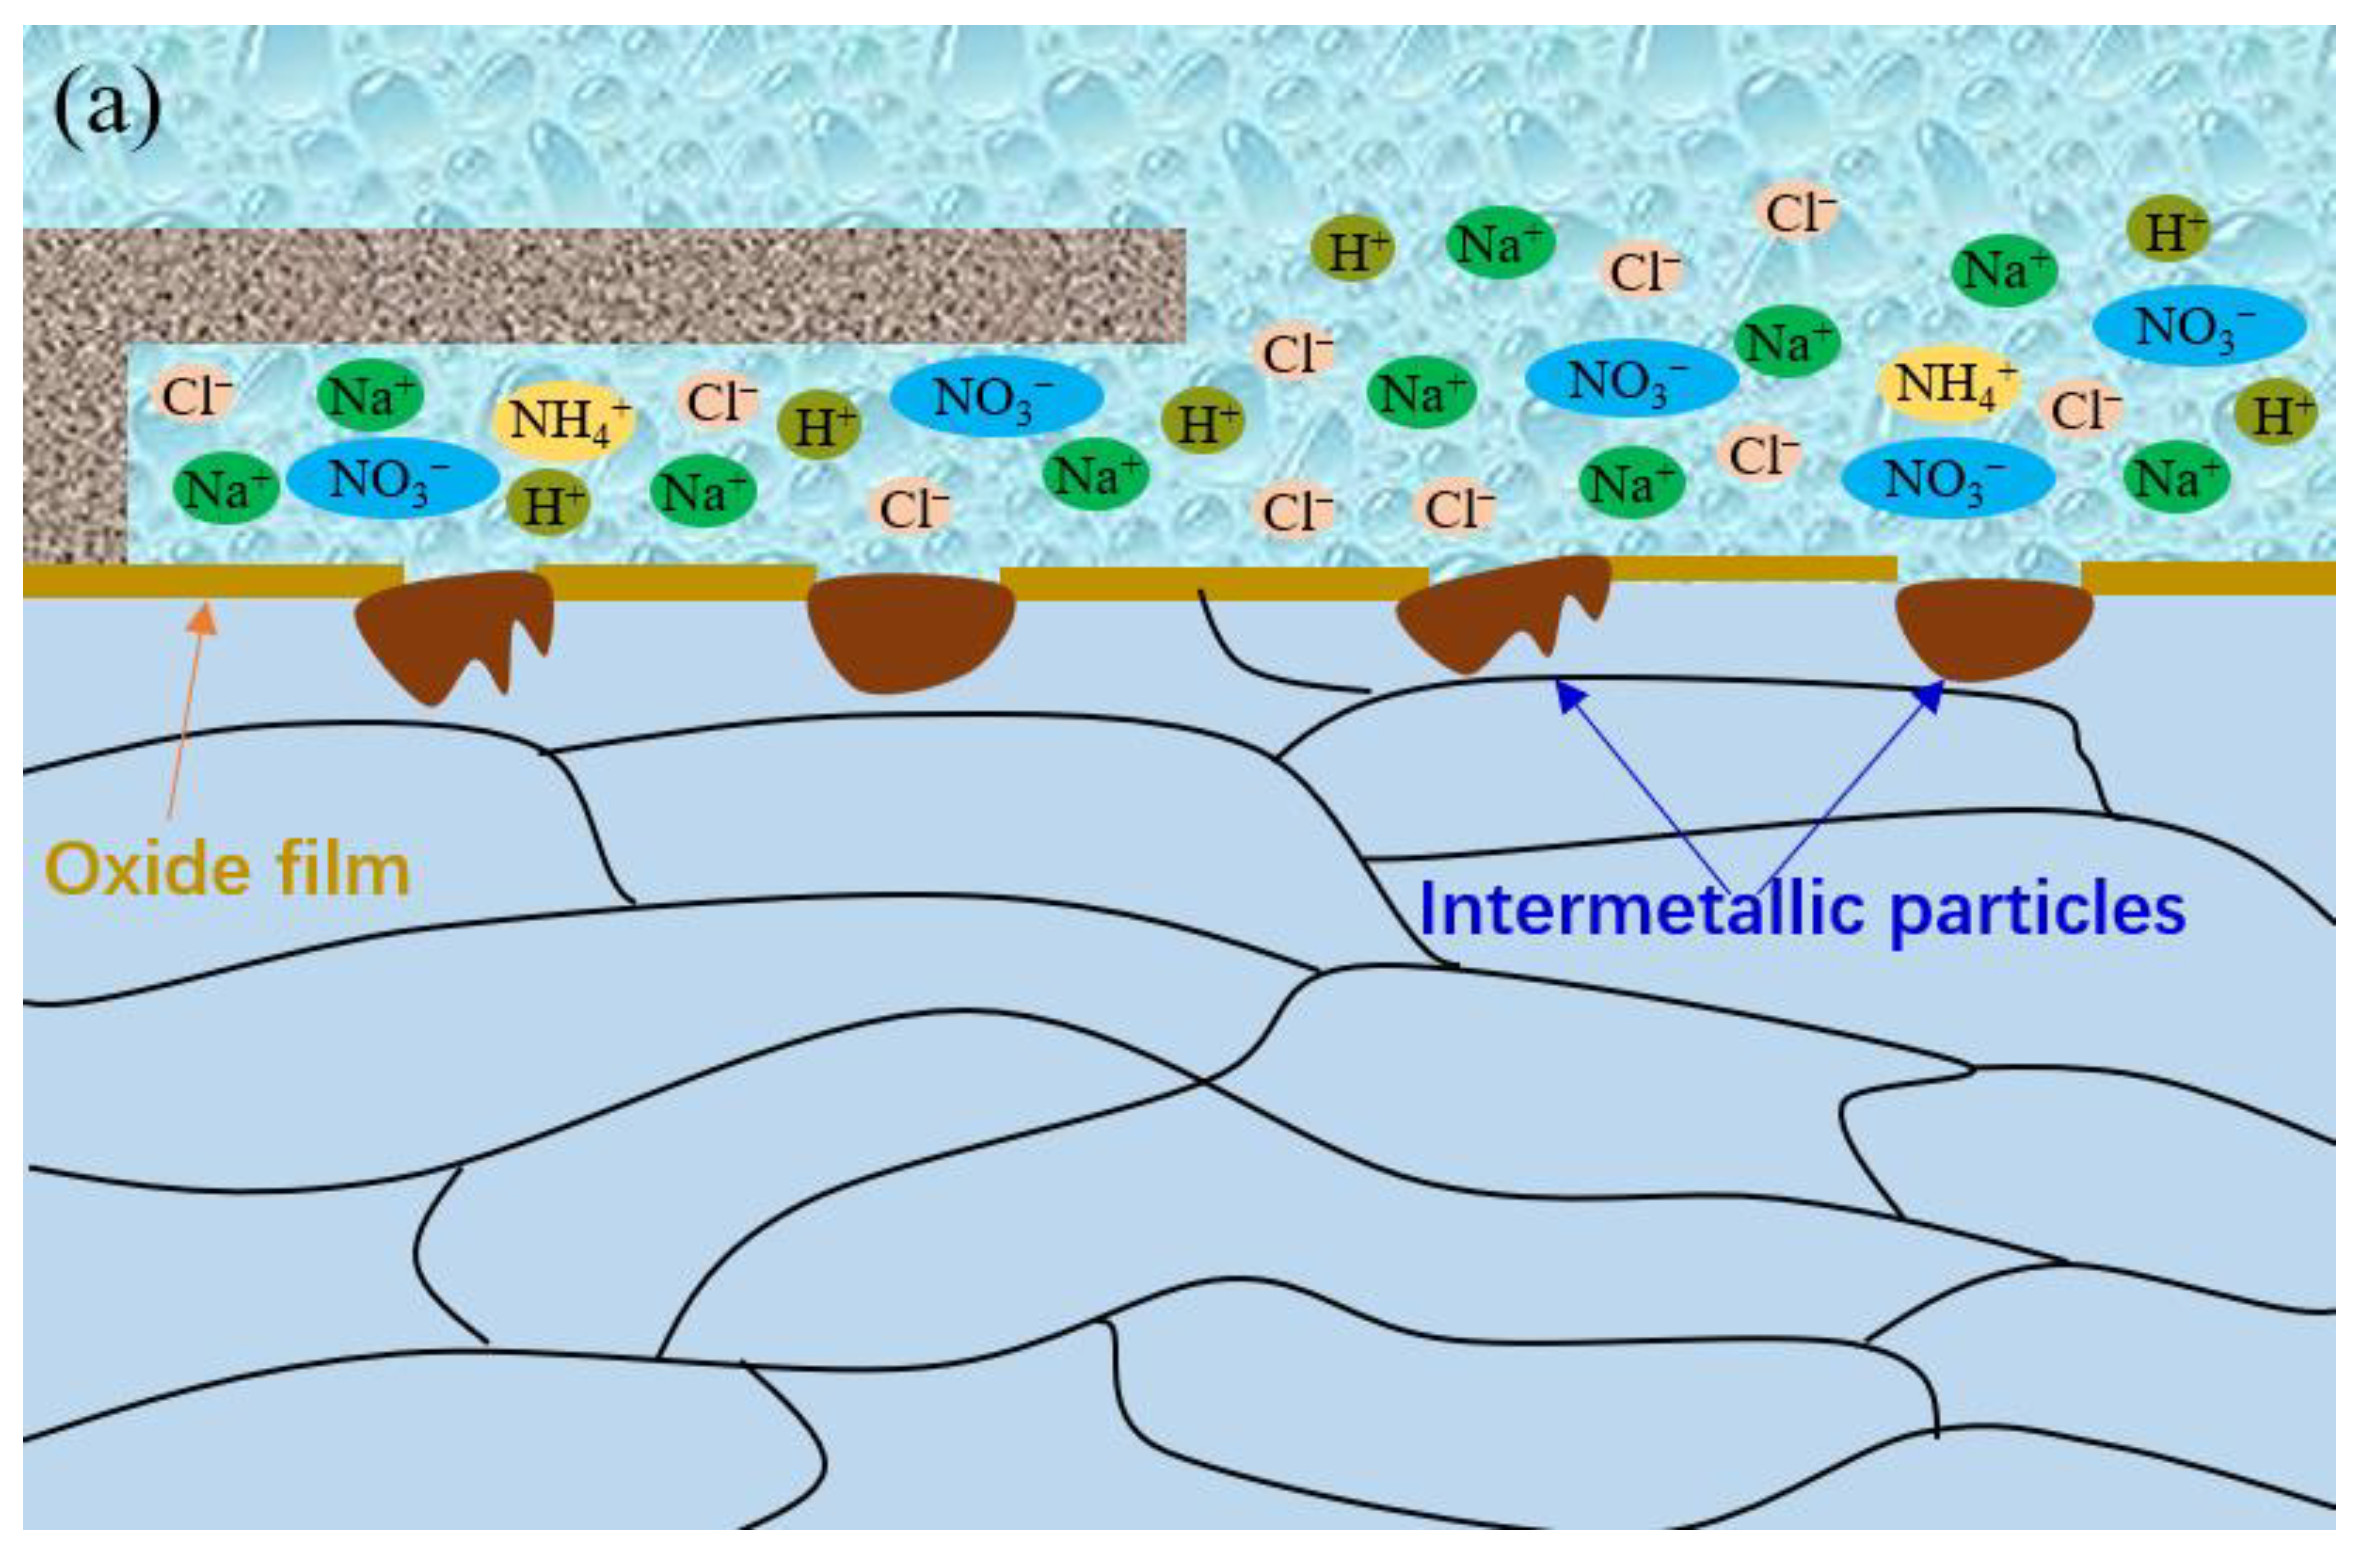
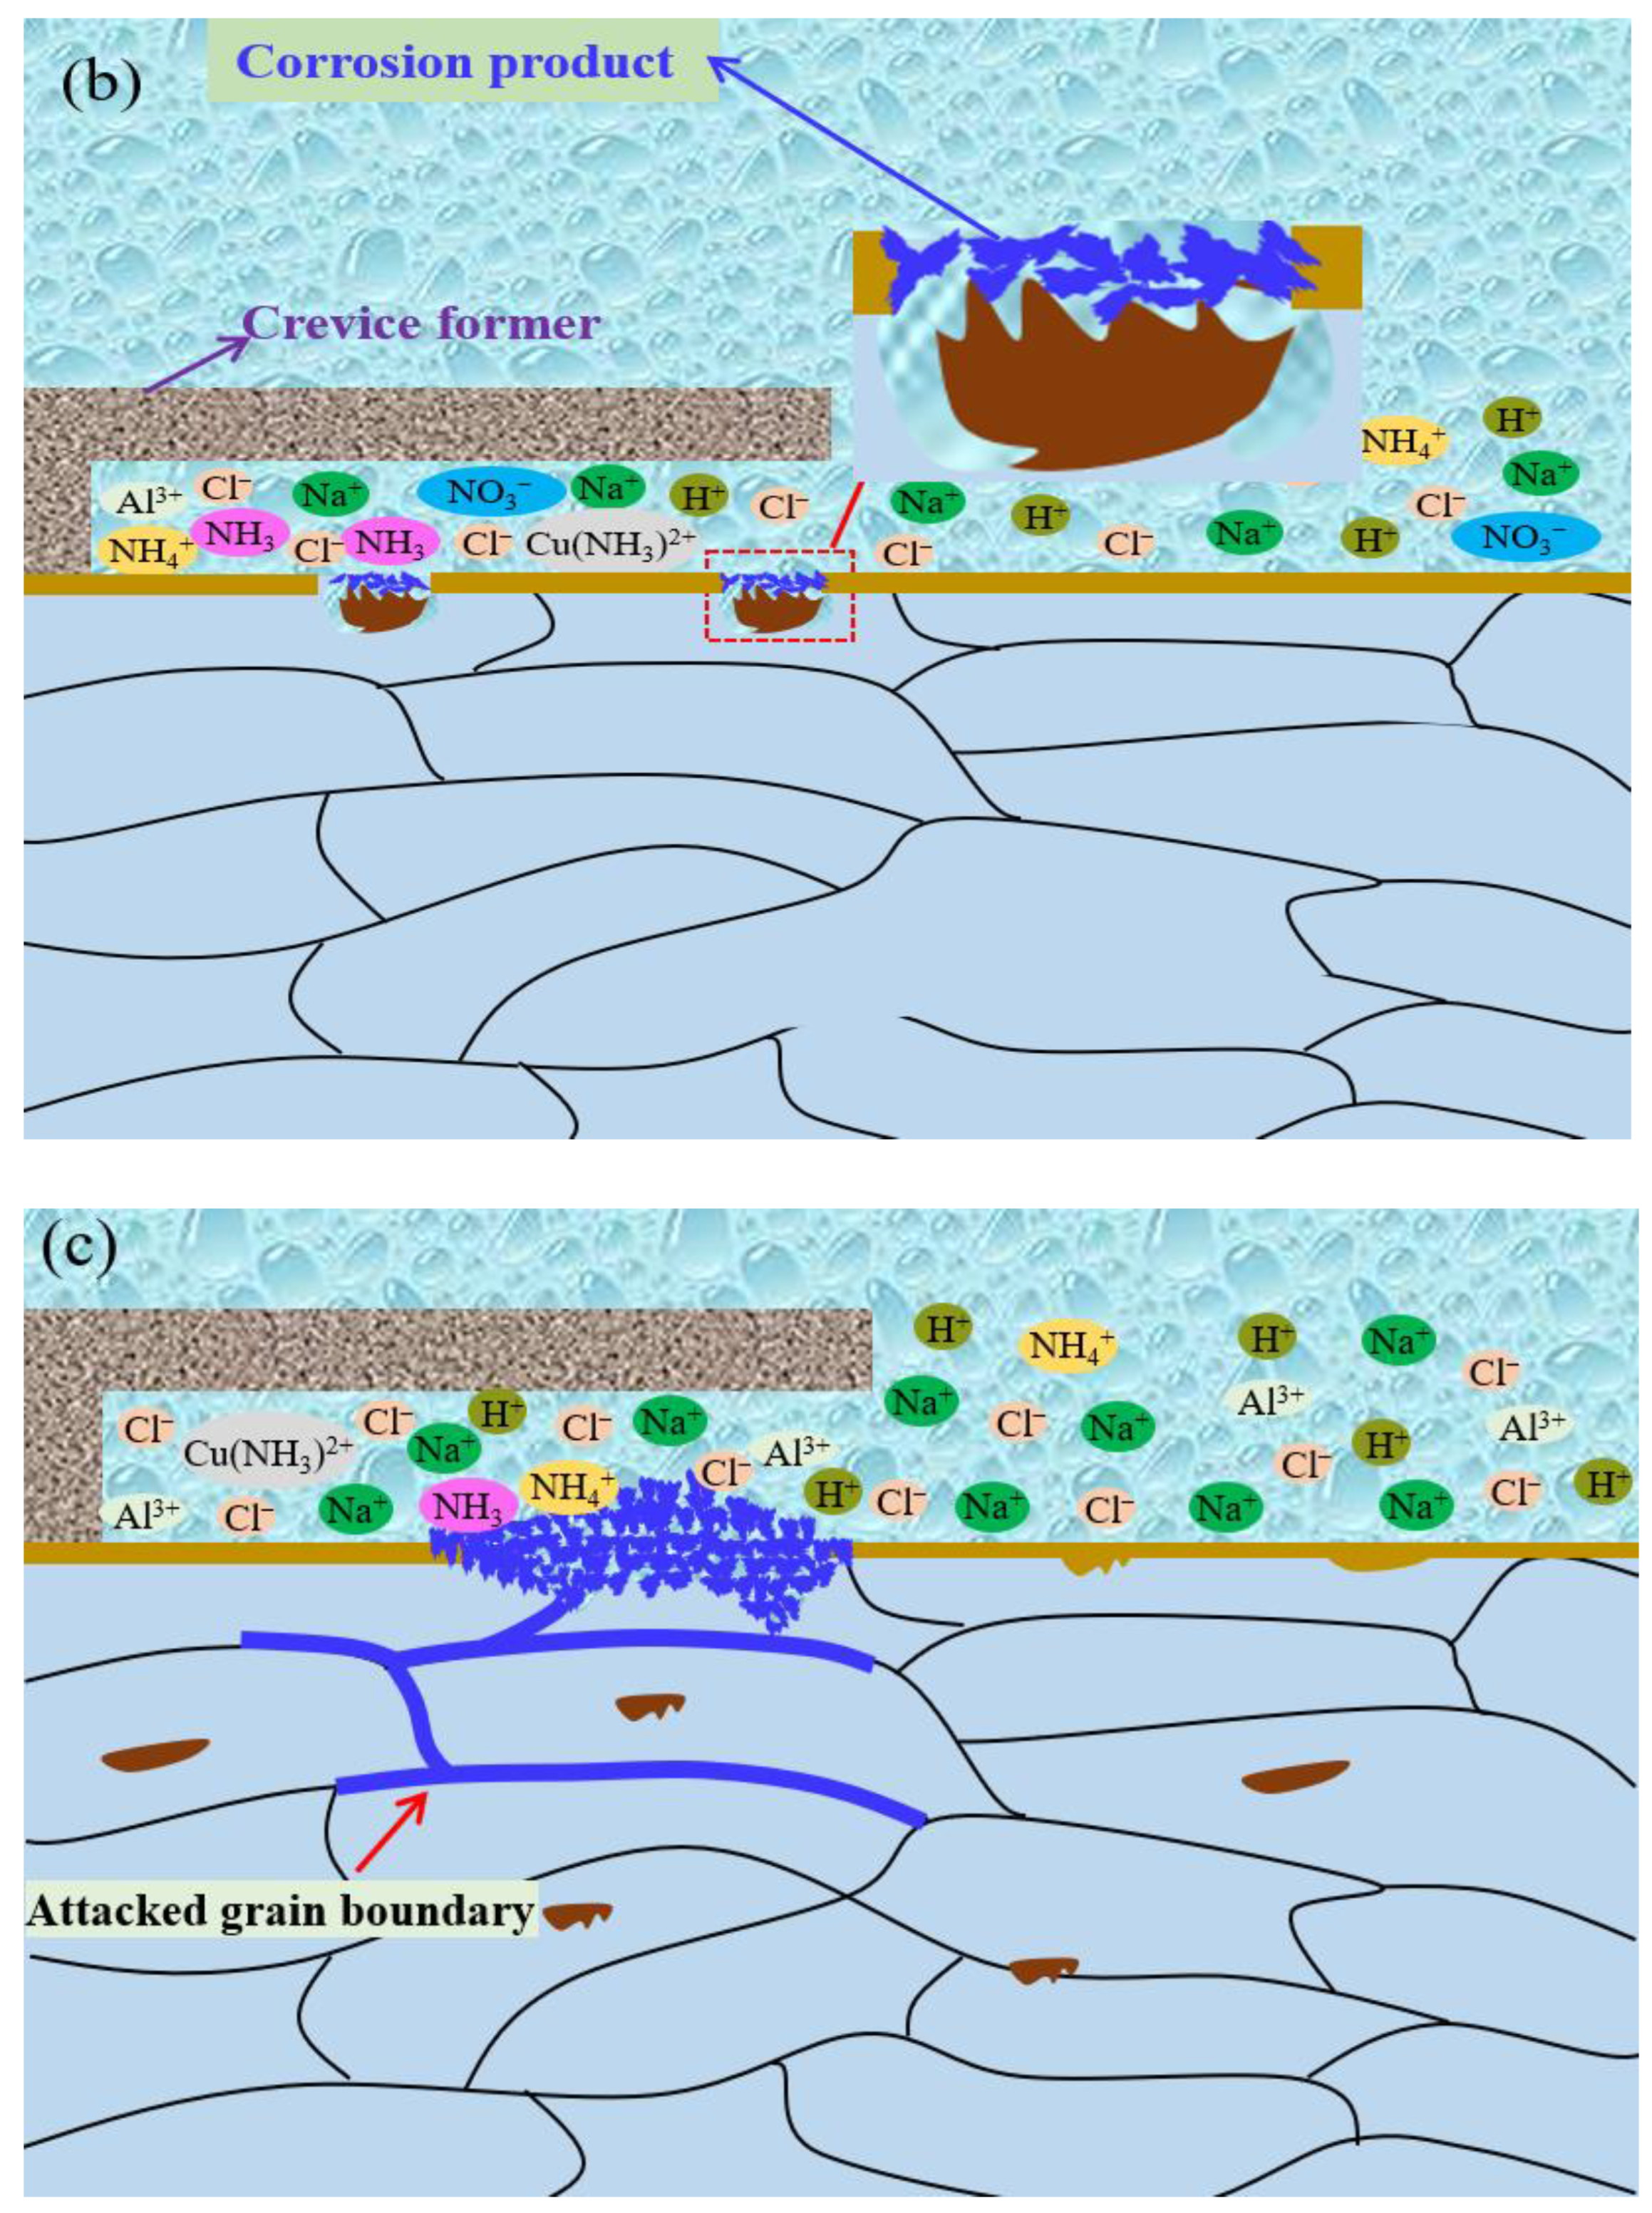
3.7. The Evolution of Localized Corrosion Inside the Crevice
4. Discussion
5. Conclusions
- NO3− plays a crucial role in the crevice corrosion of 7075-T651. Crevice corrosion occurs in acidic NaCl solution with NO3− and does not occur in acidic NaCl solution without NaNO3.
- The corrosion of the specimen inside the crevice is promoted, and the corrosion of the specimen outside the crevice is inhibited due to increased NO3− concentration.
- The secondary product, NH3, induces pitting nucleation inside the crevice and then initiates crevice corrosion due to the reduction of NO3−.
Author Contributions
Funding
Institutional Review Board Statement
Informed Consent Statement
Data Availability Statement
Acknowledgments
Conflicts of Interest
References
- Liu, X.; Li, Y.; Lei, L.; Wang, X. The effect of nitrate on the corrosion behavior of 7075-T651 aluminum alloy in the acidic NaCl solution. Mater. Corros. 2021, 72, 1478–1487. [Google Scholar] [CrossRef]
- Luo, C.; Albu, S.P.; Zhou, X.; Sun, Z.; Zhang, X.; Tang, Z.; Thompson, G.E. Continuous and discontinuous localized corrosion of a 2xxx aluminium–copper–lithium alloy in sodium chloride solution. J. Alloys Compd. 2016, 658, 61–70. [Google Scholar] [CrossRef]
- Niu, P.L.; Li, W.Y.; Li, N.; Xu, Y.X.; Chen, D.L. Exfoliation corrosion of friction stir welded dissimilar 2024-to-7075 aluminum alloys. Mater. Charact. 2019, 147, 93–100. [Google Scholar] [CrossRef]
- Ju, H.; Liu, S.; Zhang, W.; Yang, Y.; Duan, J. Investigation of pitting corrosion and hydrogen evolution of aluminum and AA2024 alloy by simultaneous electrochemical measurements and imaging. Electrochem. Commun. 2021, 132, 107135. [Google Scholar] [CrossRef]
- Li, Y.Z.; Wang, X.; Zhang, G.A. Corrosion behaviour of 13Cr stainless steel under stress and crevice in 3.5 wt.% NaCl solution. Corros. Sci. 2020, 163, 108290. [Google Scholar] [CrossRef]
- Nagarajan, S.; Rajendran, N. Crevice corrosion behaviour of superaustenitic stainless steels: Dynamic electrochemical impedance spectroscopy and atomic force microscopy studies. Corros. Sci. 2009, 51, 217–224. [Google Scholar] [CrossRef]
- Nishimoto, M.; Ogawa, J.; Muto, I.; Sugawara, Y.; Hara, N. Simultaneous visualization of pH and Cl− distributions inside the crevice of stainless steel. Corros. Sci. 2016, 106, 298–302. [Google Scholar] [CrossRef] [Green Version]
- Zhu, L.Y.; Cui, Z.Y.; Cui, H.Z.; Wang, X.; Li, Y.Z. The effect of applied stress on the crevice corrosion of 304 stainless steel in 3.5 wt% NaCl solution. Corros. Sci. 2022, 196, 110039. [Google Scholar] [CrossRef]
- Li, Y.; Mu, J.; Cui, Z.; Wang, X. The crevice corrosion behavior of N80 carbon steel in acidic NaCl solution: The effect of O2. Mater. Corros. 2022, 73, 281–290. [Google Scholar] [CrossRef]
- Zhang, X.; Wang, S.; Wang, X.; Cui, Z.; Cui, H.; Li, Y. The stress corrosion cracking behavior of N80 carbon steel under a crevice in an acidic solution containing different concentrations of NaCl. Corros. Sci. 2023, 216, 111068. [Google Scholar] [CrossRef]
- Mu, J.; Li, Y.Z.; Wang, X. Crevice corrosion behavior of X70 steel in NaCl solution with different pH. Corros. Sci. 2021, 182, 109310. [Google Scholar] [CrossRef]
- Kadri, Y.; Srasra, E.; Bekri-Abbes, I.; Herrasti, P. Facile and eco-friendly synthesis of polyaniline/ZnO composites for corrosion protection of AA-2024 aluminium alloy. J. Electroanal. Chem. 2021, 893, 115335. [Google Scholar] [CrossRef]
- Na, K.-H.; Pyun, S.-I. Effect of sulphate and molybdate ions on pitting corrosion of aluminium by using electrochemical noise analysis. J. Electroanal. Chem. 2006, 596, 7–12. [Google Scholar] [CrossRef]
- Udunwa, D.I.; Onukwuli, O.D.; Anadebe, V.C. Synthesis and evaluation of 1-butyl-3-methylimidazolium chloride based ionic liquid for acid corrosion inhibition of aluminum alloy: Empirical, DFT/MD-simulation and RSM modeling. J. Mol. Liq. 2022, 364, 120019. [Google Scholar] [CrossRef]
- Li, S.; Church, B.C. Effects of sulfate and nitrate anions on aluminum corrosion in slightly alkaline solution. Appl. Surf. Sci. 2018, 440, 861–872. [Google Scholar] [CrossRef]
- Carneiro, J.; Tedim, J.; Fernandes, S.C.M.; Freire, C.S.R.; Silvestre, A.J.D.; Gandini, A.; Ferreira, M.G.S.; Zheludkevich, M.L. Chitosan-based self-healing protective coatings doped with cerium nitrate for corrosion protection of aluminum alloy 2024. Prog. Org. Coat. 2012, 75, 8–13. [Google Scholar] [CrossRef]
- Gao, M.H.; Zhang, S.D.; Yang, B.J.; Qiu, S.; Wang, H.W.; Wang, J.Q. Prominent inhibition efficiency of sodium nitrate to corrosion of Al-based amorphous alloy. Appl. Surf. Sci. 2020, 530, 147211. [Google Scholar] [CrossRef]
- Balaskas, A.C.; Curioni, M.; Thompson, G.E. Evaluation of Inhibitor Performance by Electrochemical Methods: Comparative Study of Nitrate Salts on AA 2024-T3. J. Electrochem. Soc. 2014, 161, C389–C394. [Google Scholar] [CrossRef]
- Blanc, C.; Gastaud, S.p.; Mankowski, G. Mechanistic Studies of the Corrosion of 2024 Aluminum Alloy in Nitrate Solutions. J. Electrochem. Soc. 2003, 150, B396. [Google Scholar] [CrossRef]
- Zhu, Z.; Liu, X.; Ye, Z.; Zhang, J.; Cao, F.; Zhang, J. A fabrication of iridium oxide film pH micro-sensor on Pt ultramicroelectrode and its application on in-situ pH distribution of 316L stainless steel corrosion at open circuit potential. Sens. Actuators B Chem. 2018, 255, 1974–1982. [Google Scholar] [CrossRef]
- Liu, B.; Zhang, X.; Zhou, X.; Hashimoto, T.; Wang, J. The corrosion behaviour of machined AA7150-T651 aluminium alloy. Corros. Sci. 2017, 126, 265–271. [Google Scholar] [CrossRef]
- Huang, J.-l.; Li, J.-f.; Liu, D.-y.; Zhang, R.-f.; Chen, Y.-l.; Zhang, X.-h.; Ma, P.-c.; Gupta, R.K.; Birbilis, N. Correlation of intergranular corrosion behaviour with microstructure in Al-Cu-Li alloy. Corros. Sci. 2018, 139, 215–226. [Google Scholar] [CrossRef]
- Meng, K.; Guo, K.; Yu, Q.; Miao, D.; Yao, C.; Wang, Q.; Wang, T. Effect of annealing temperature on the microstructure and corrosion behavior of Ti-6Al-3Nb-2Zr-1Mo alloy in hydrochloric acid solution. Corros. Sci. 2021, 183, 109320. [Google Scholar] [CrossRef]
- Wang, L.; Liang, J.; Li, H.; Cheng, L.; Cui, Z. Quantitative study of the corrosion evolution and stress corrosion cracking of high strength aluminum alloys in solution and thin electrolyte layer containing Cl. Corros. Sci. 2021, 178, 109076. [Google Scholar] [CrossRef]
- Moreto, J.A.; Marino, C.E.B.; Bose Filho, W.W.; Rocha, L.A.; Fernandes, J.C.S. SVET, SKP and EIS study of the corrosion behaviour of high strength Al and Al–Li alloys used in aircraft fabrication. Corros. Sci. 2014, 84, 30–41. [Google Scholar] [CrossRef]
- McIntyre, J.F.; Dow, T.S. Intergranular Corrosion Behavior of Aluminum Alloys Exposed to Artificial Seawater in the Presence of Nitrate Anion. Corrosion 1992, 48, 309–319. [Google Scholar] [CrossRef]
- Svenningsen, G.; Larsen, M.H.; Nordlien, J.H.; Nisancioglu, K. Effect of thermomechanical history on intergranular corrosion of extruded AlMgSi(Cu) model alloy. Corros. Sci. 2006, 48, 3969–3987. [Google Scholar] [CrossRef]
- Svenningsen, G.; Lein, J.E.; Bjørgum, A.; Nordlien, J.H.; Yu, Y.; Nisancioglu, K. Effect of low copper content and heat treatment on intergranular corrosion of model AlMgSi alloys. Corros. Sci. 2006, 48, 226–242. [Google Scholar] [CrossRef]
- Lacroix, L.c.; Ressier, L.; Blanc, C.; Mankowski, G. Combination of AFM, SKPFM, and SIMS to Study the Corrosion Behavior of S-phase particles in AA2024-T351. J. Electrochem. Soc. 2008, 155, C131. [Google Scholar] [CrossRef]


| CNaNO3 (wt.%) | Rs (Ω cm2) | CPEox (Ω−1 cm−2 s−n1) | n1 | Rox (Ω cm2) | CPEct (Ω−1 cm−2 s−n2) | n2 | Rct (Ω cm2) | L (H/cm2) | RL (Ω cm2) | Rp (Ω cm2) | |
|---|---|---|---|---|---|---|---|---|---|---|---|
| 0 | Out | 7.51 | 2.84 × 10⁻⁵ | 1 | 32.58 | 3.44 × 10⁻⁵ | 0.84 | 436.3 | 637.8 | 1570 | 374 |
| In | 1.77 | 1.75 × 10⁻⁵ | 0.89 | 2889 | 0.0189 | 1 | 3226 | 6115 | |||
| 0.2 | Out | 6.88 | 4.32 × 10⁻⁵ | 0.96 | 964 | 5.80 × 10⁻⁵ | 0.88 | 255 | 445 | 1025 | 1168 |
| In | 2.13 | 2.81 × 10⁻⁵ | 0.85 | 926 | 8.05 × 10⁻⁵ | 0.78 | 11.43 | 264.5 | 858 | 937.07 | |
| 0.5 | Out | 7.62 | 9.51 × 10⁻⁵ | 0.84 | 990.3 | 0.039 | 1 | 706.5 | 1696.8 | ||
| In | 2.35 | 4.95 × 10⁻⁵ | 0.75 | 677.2 | 2.02 × 10⁻⁵ | 0.86 | 36.61 | 233.2 | 337.6 | 710.00 | |
Disclaimer/Publisher’s Note: The statements, opinions and data contained in all publications are solely those of the individual author(s) and contributor(s) and not of MDPI and/or the editor(s). MDPI and/or the editor(s) disclaim responsibility for any injury to people or property resulting from any ideas, methods, instructions or products referred to in the content. |
© 2023 by the authors. Licensee MDPI, Basel, Switzerland. This article is an open access article distributed under the terms and conditions of the Creative Commons Attribution (CC BY) license (https://creativecommons.org/licenses/by/4.0/).
Share and Cite
Wang, S.; Cao, Y.; Liu, X.; Cai, G. In Situ Electrochemical Monitoring of the Crevice Corrosion Process of the 7075-T651 Aluminium Alloy in Acidic NaCl and NaNO3 Solution. Materials 2023, 16, 2812. https://doi.org/10.3390/ma16072812
Wang S, Cao Y, Liu X, Cai G. In Situ Electrochemical Monitoring of the Crevice Corrosion Process of the 7075-T651 Aluminium Alloy in Acidic NaCl and NaNO3 Solution. Materials. 2023; 16(7):2812. https://doi.org/10.3390/ma16072812
Chicago/Turabian StyleWang, Shengjie, Yamin Cao, Xiaohang Liu, and Guangyi Cai. 2023. "In Situ Electrochemical Monitoring of the Crevice Corrosion Process of the 7075-T651 Aluminium Alloy in Acidic NaCl and NaNO3 Solution" Materials 16, no. 7: 2812. https://doi.org/10.3390/ma16072812