
Physicochemical Properties and Application of Silica-Doped Biochar Composites as Efficient Sorbents of Copper from Tap Water
 , , , and
Abstract
:1. Introduction
2. Materials and Methods
2.1. Synthesis and Characterization of SiO2—Biochar Adsorbents
2.2. Testing Adsorption Properties
2.3. Analytical Methods
2.4. Theoretical Background
3. Results and Discussion
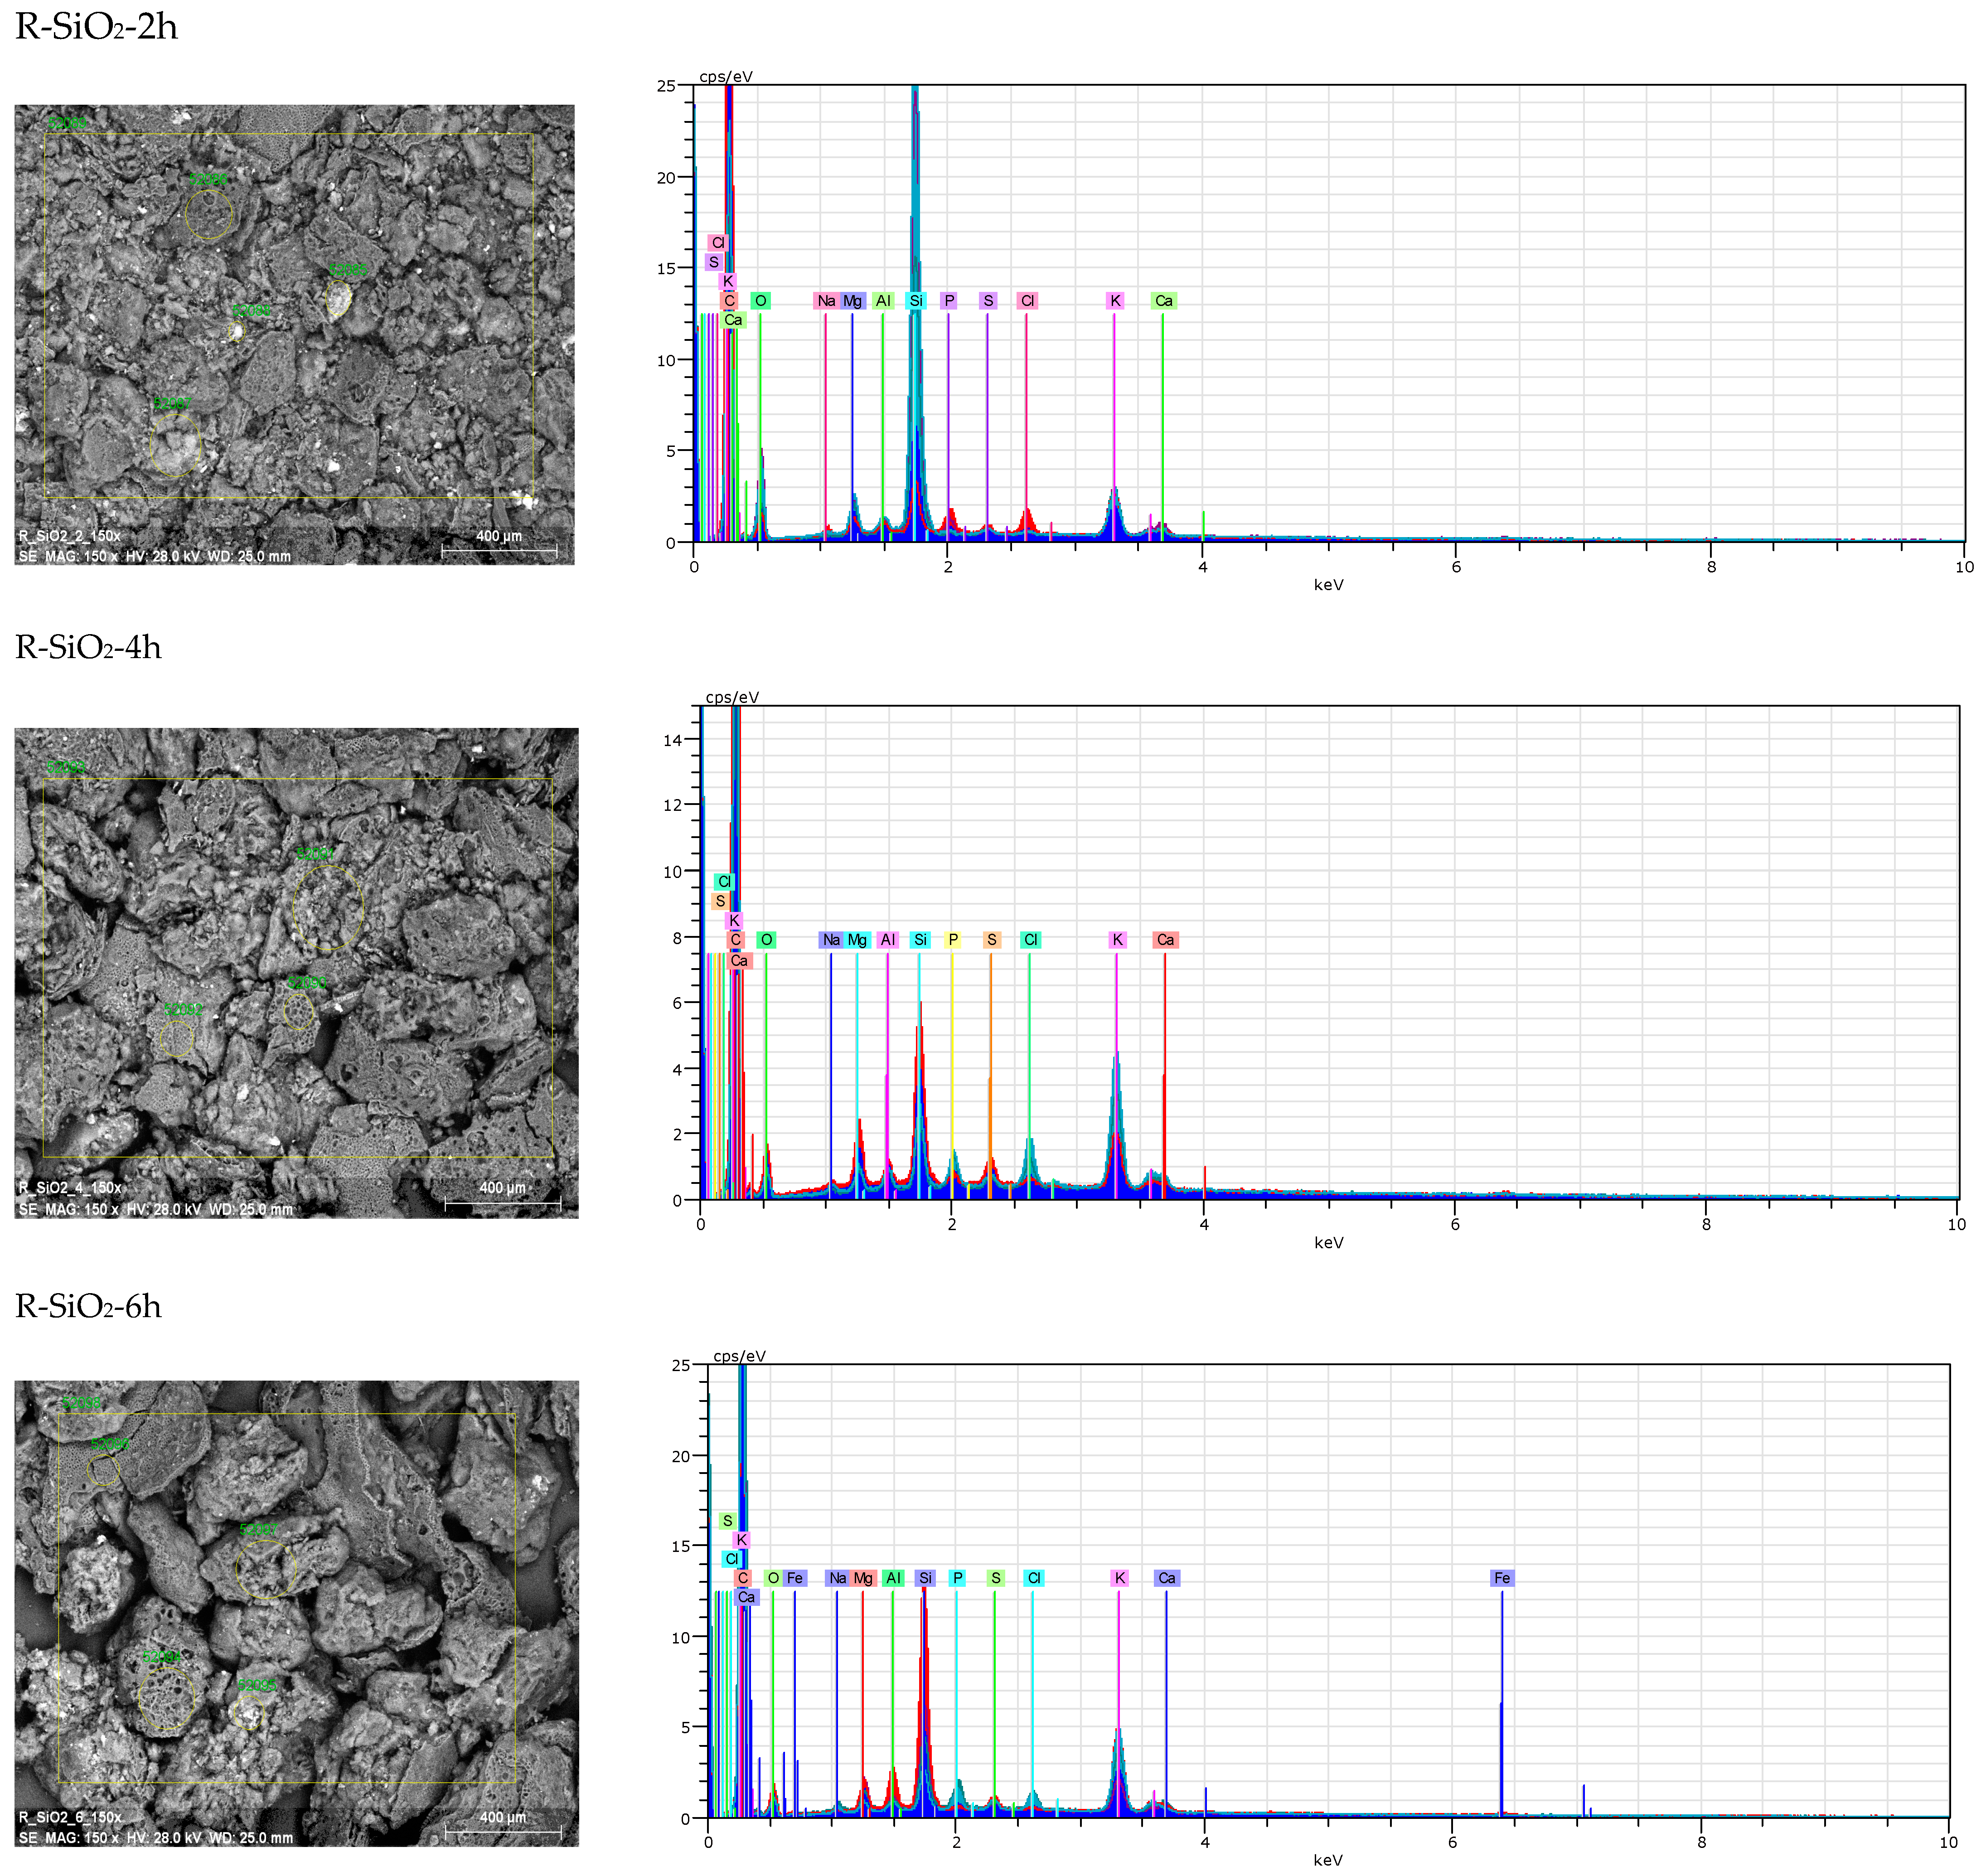
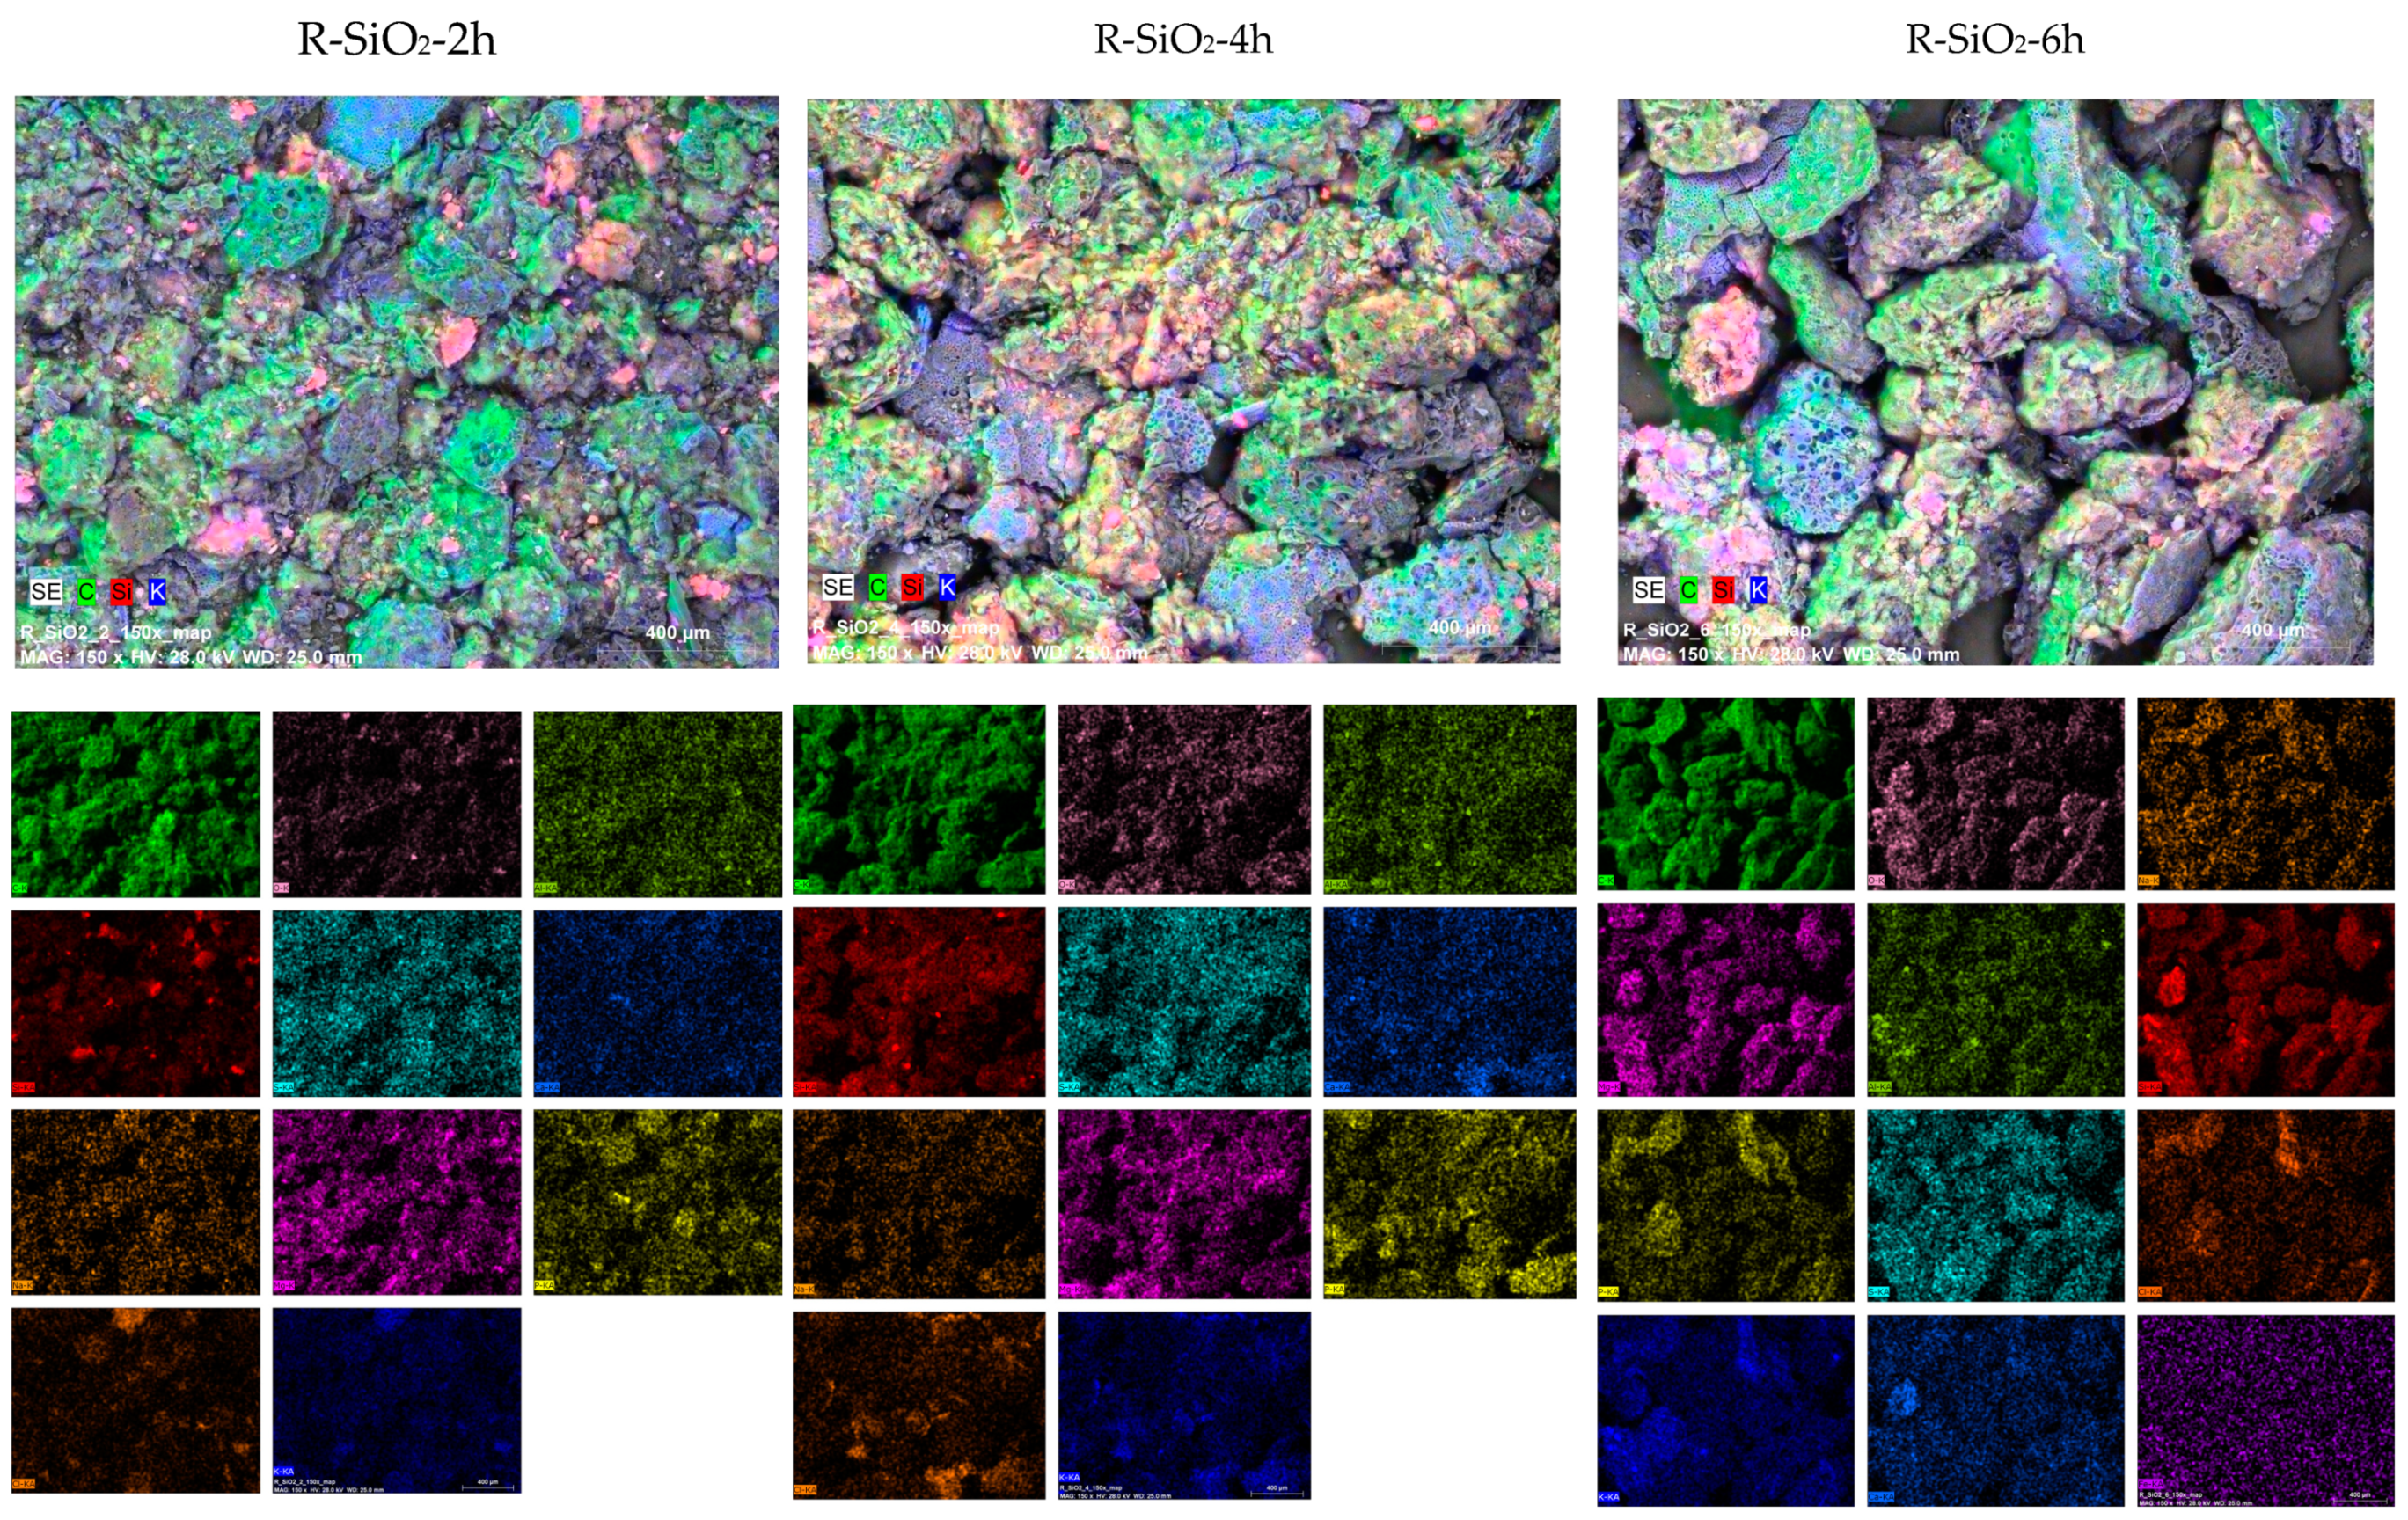
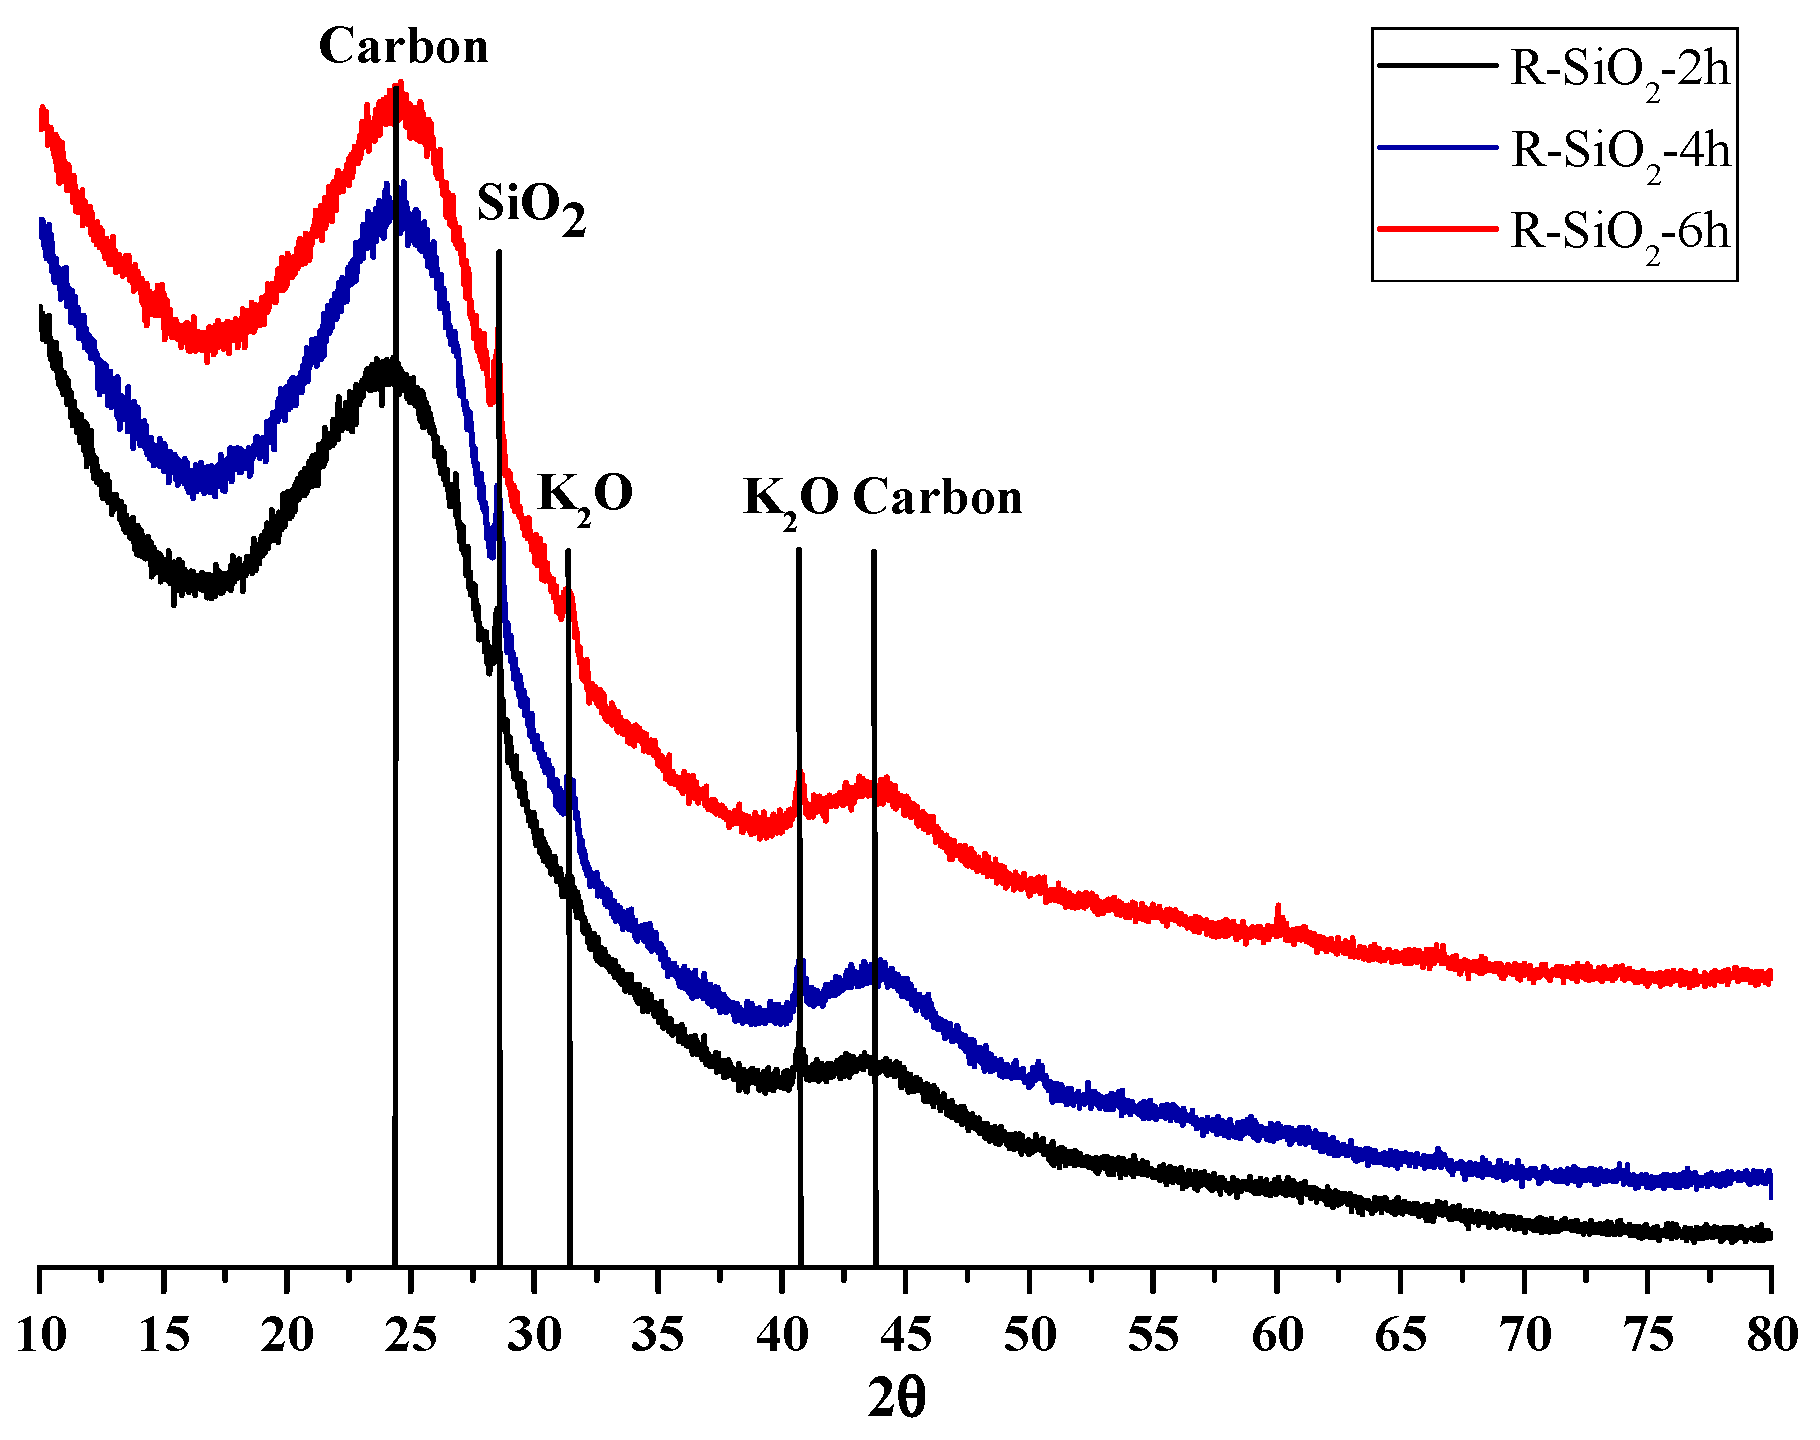
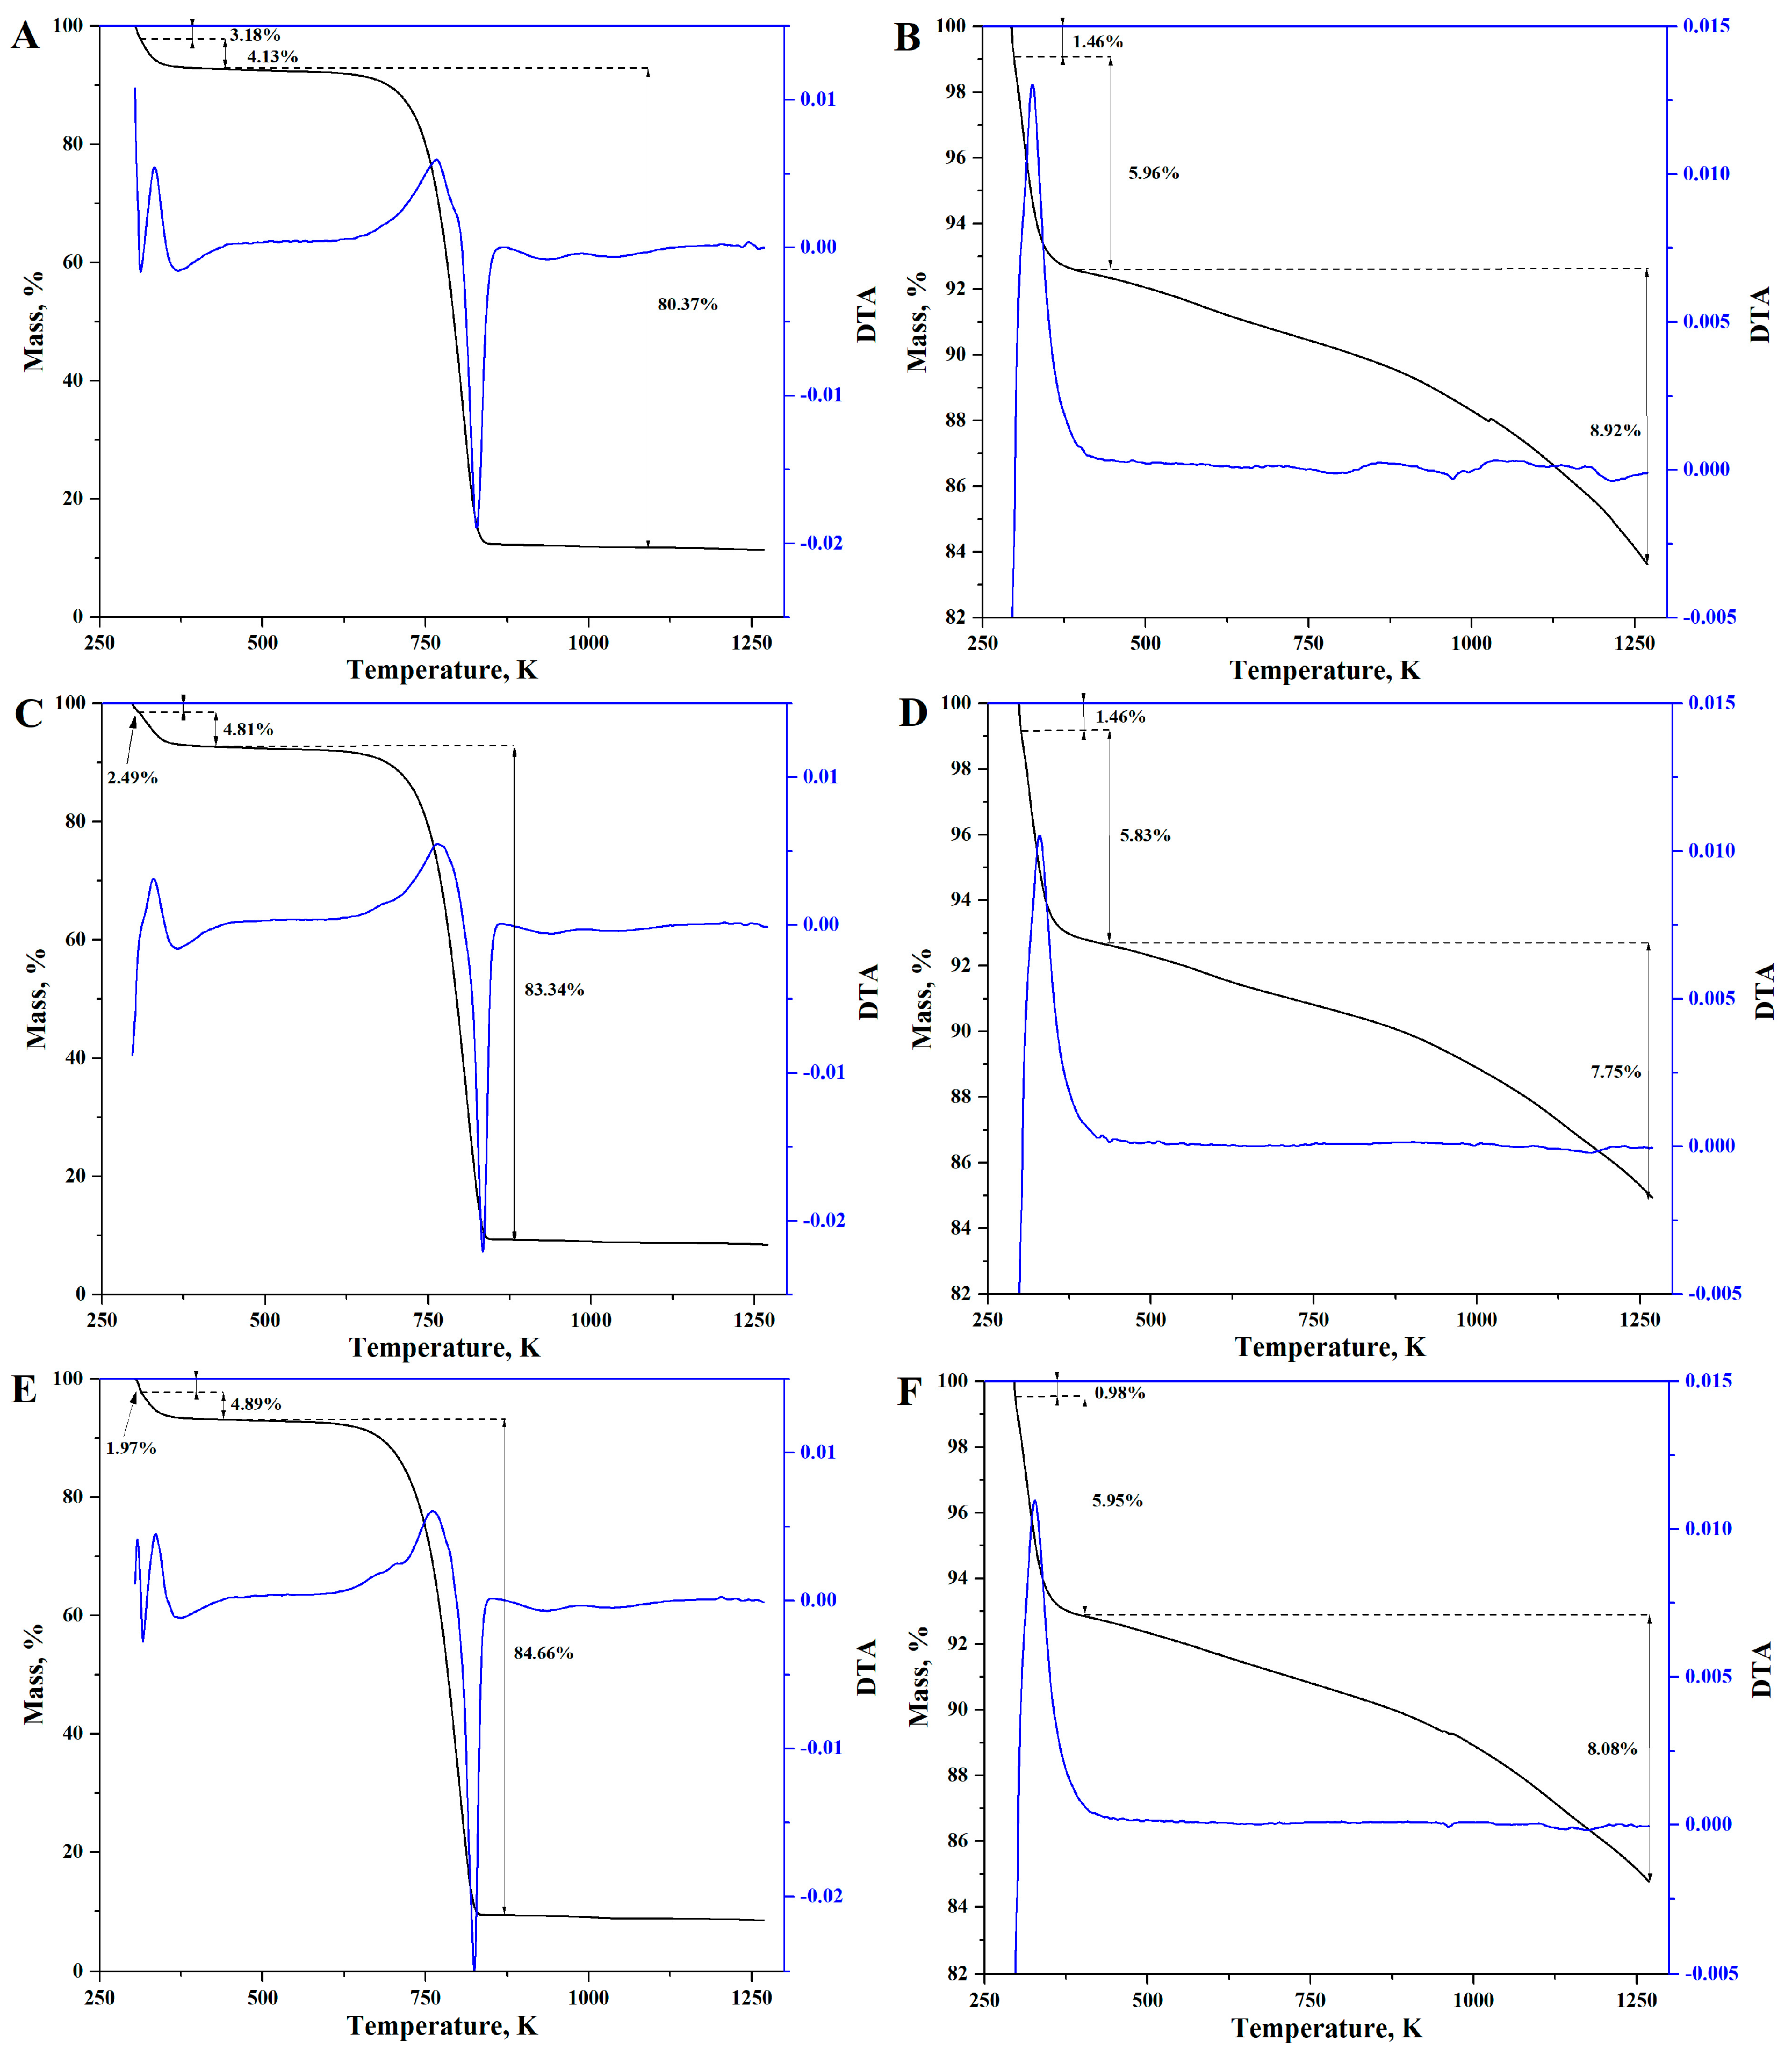
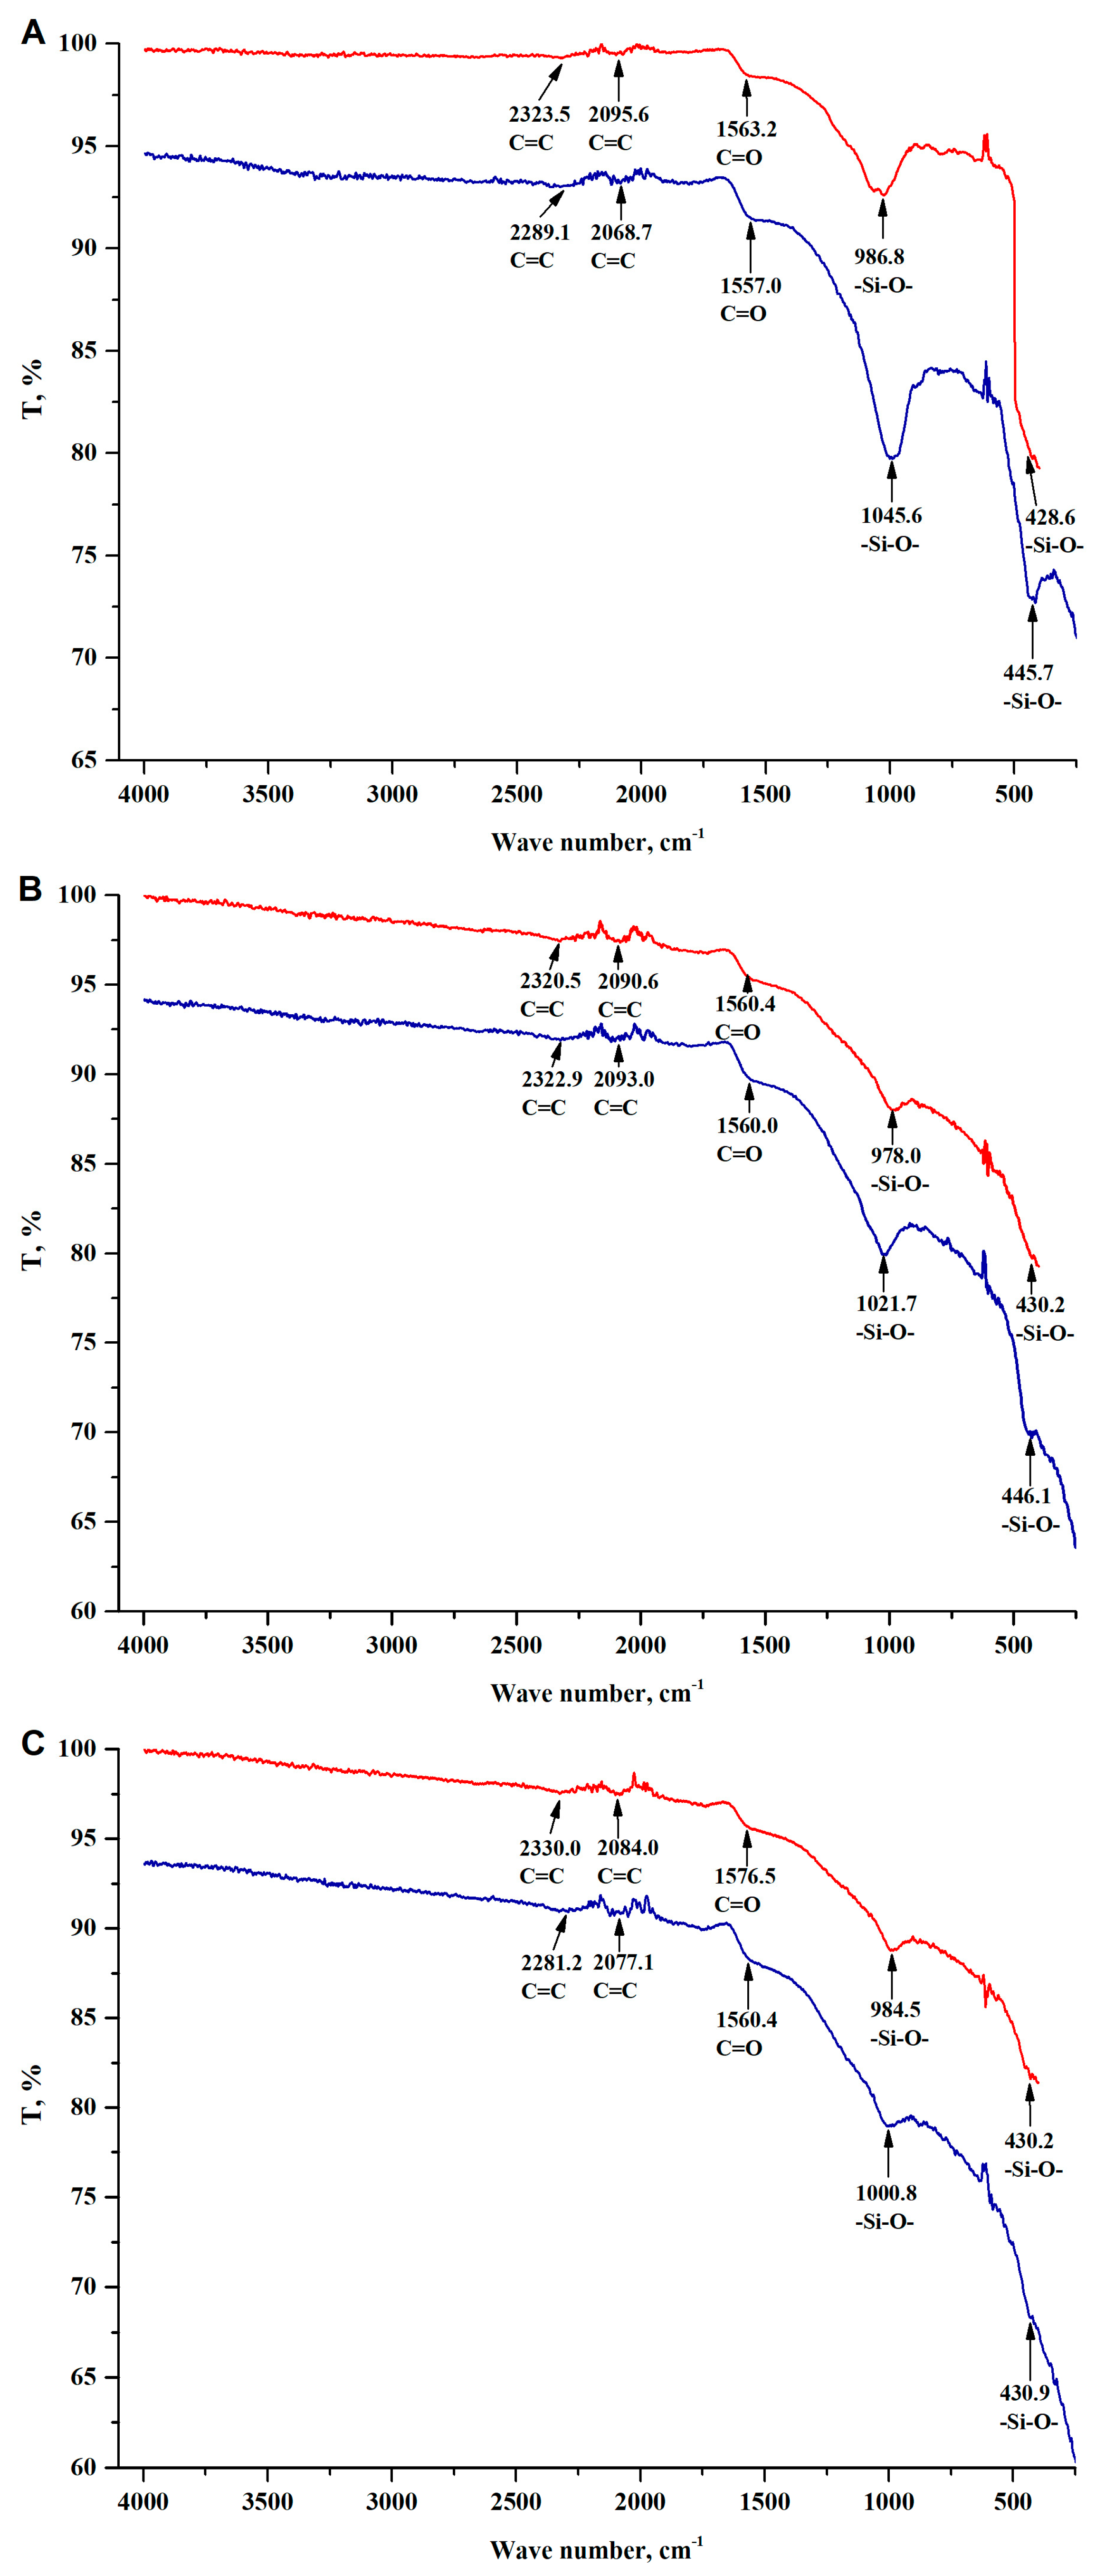
3.1. Adsorbent Characterization
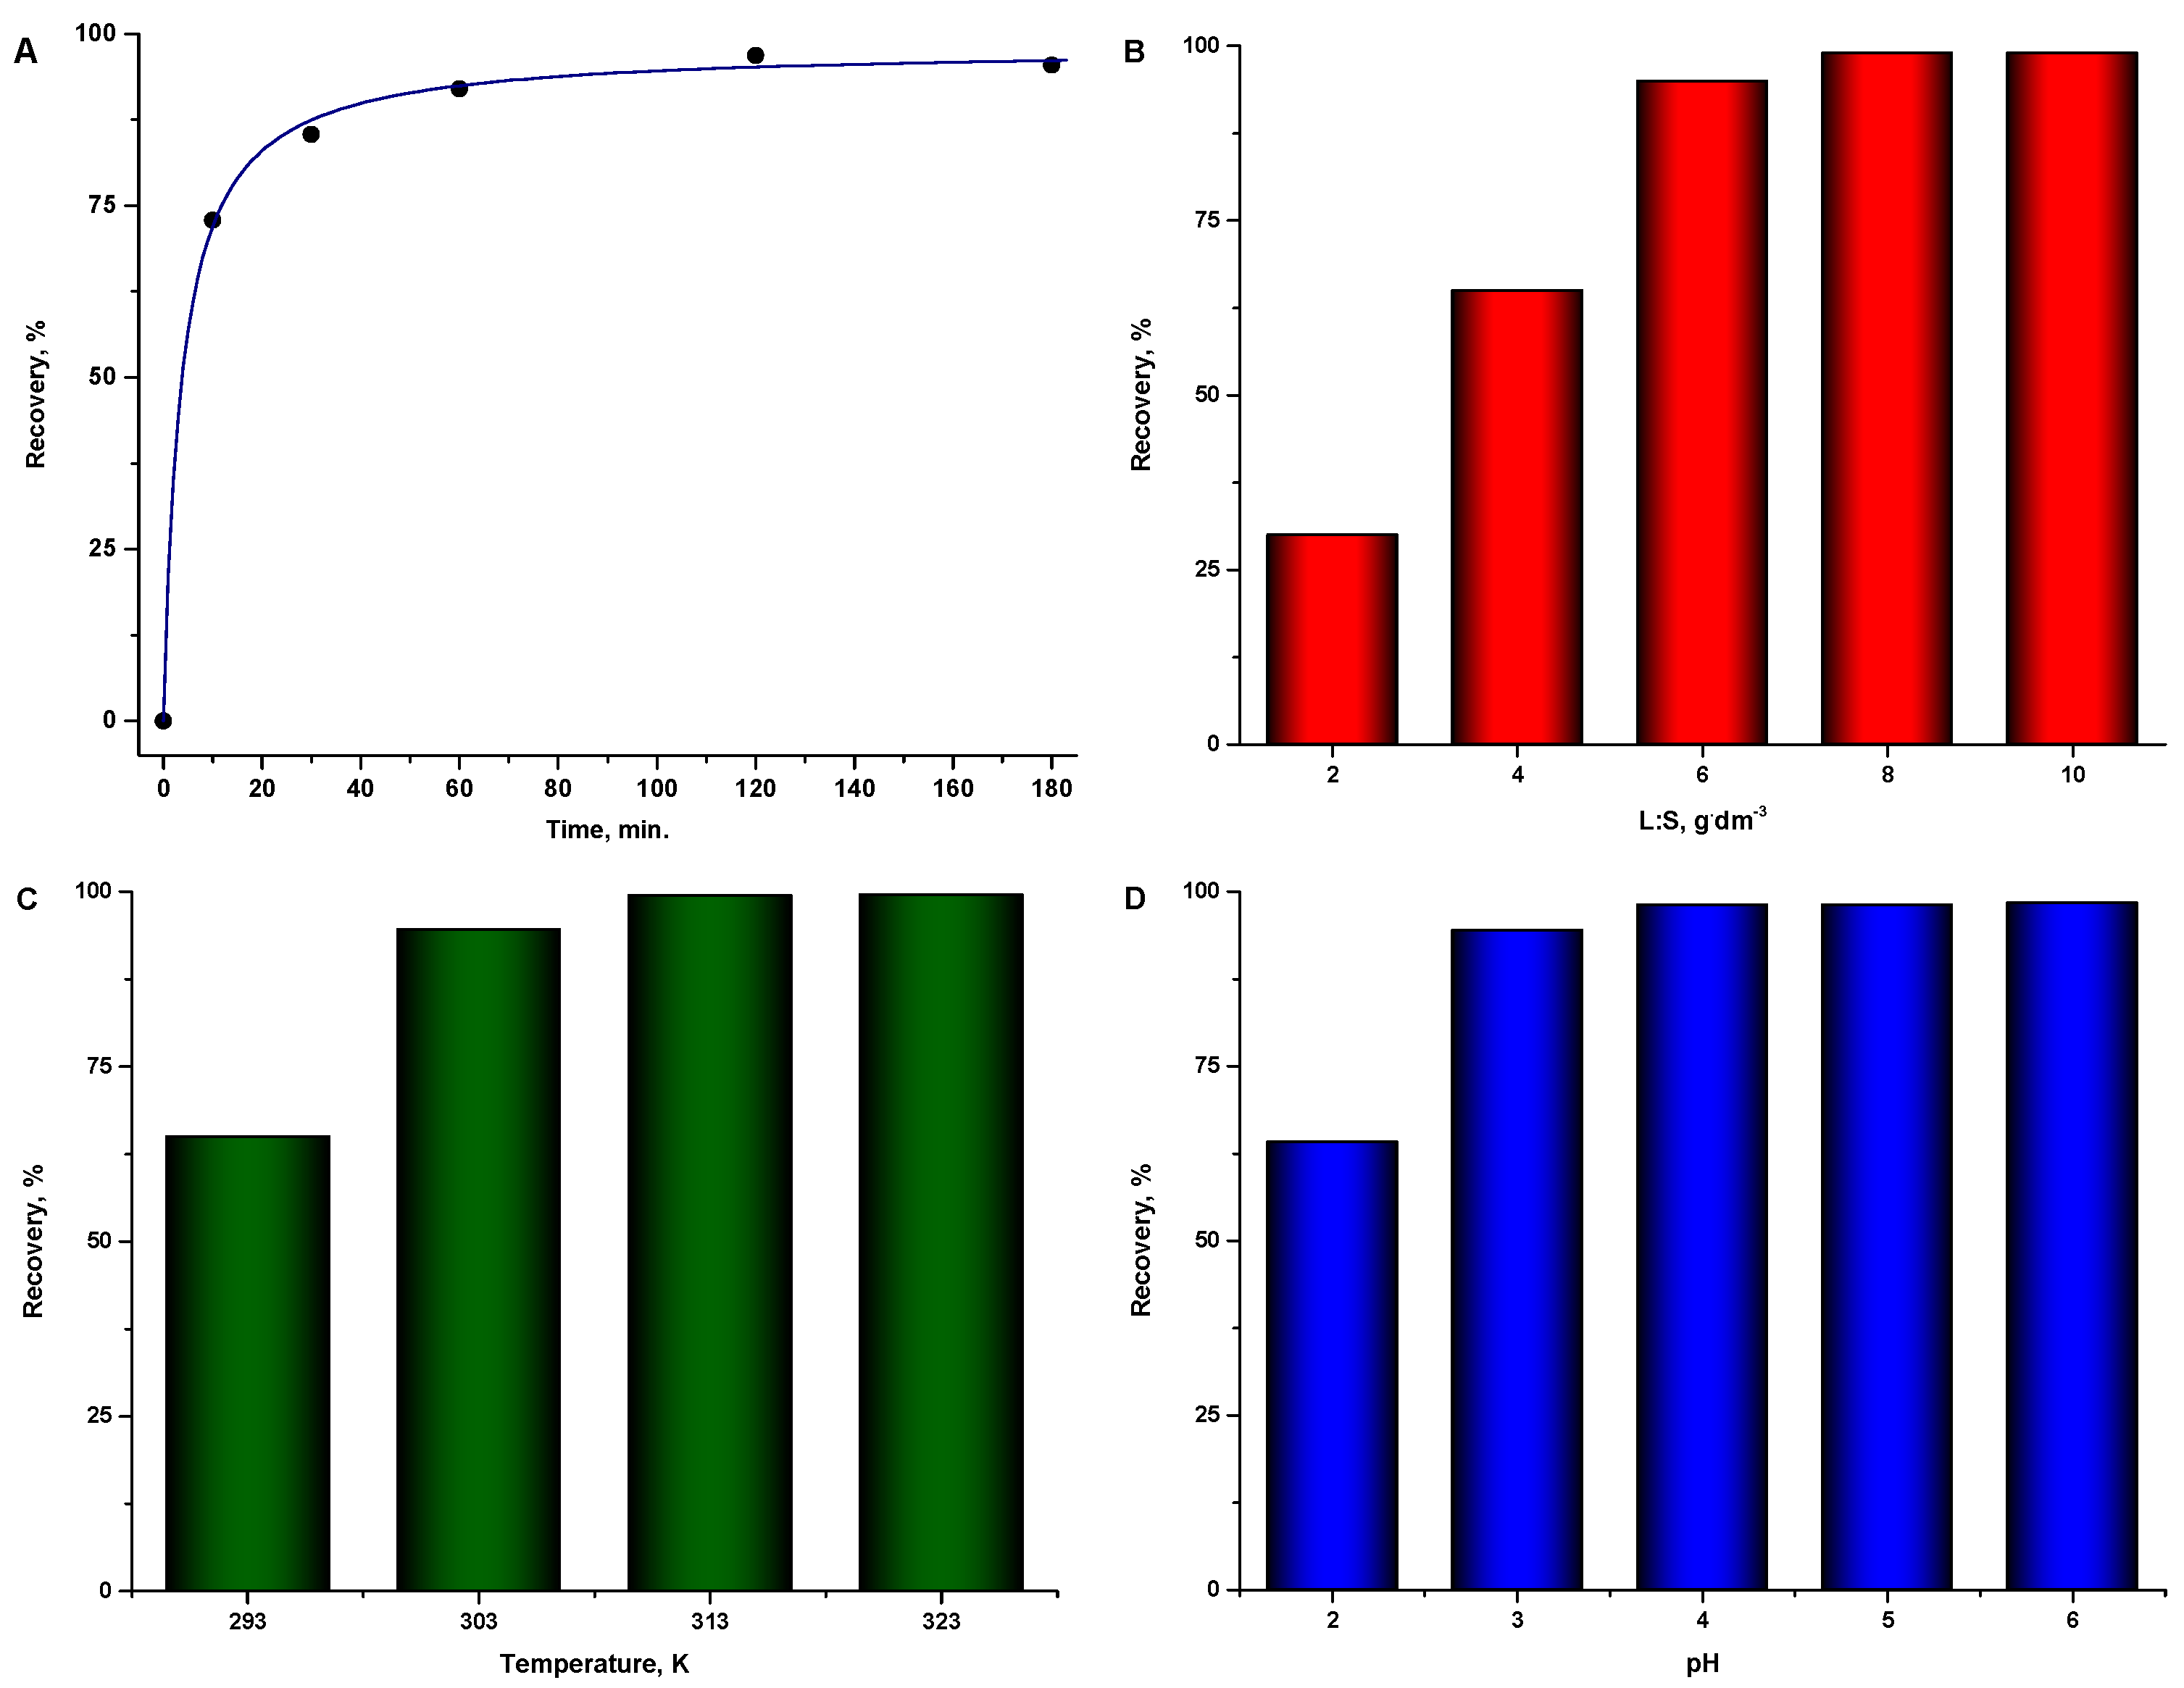
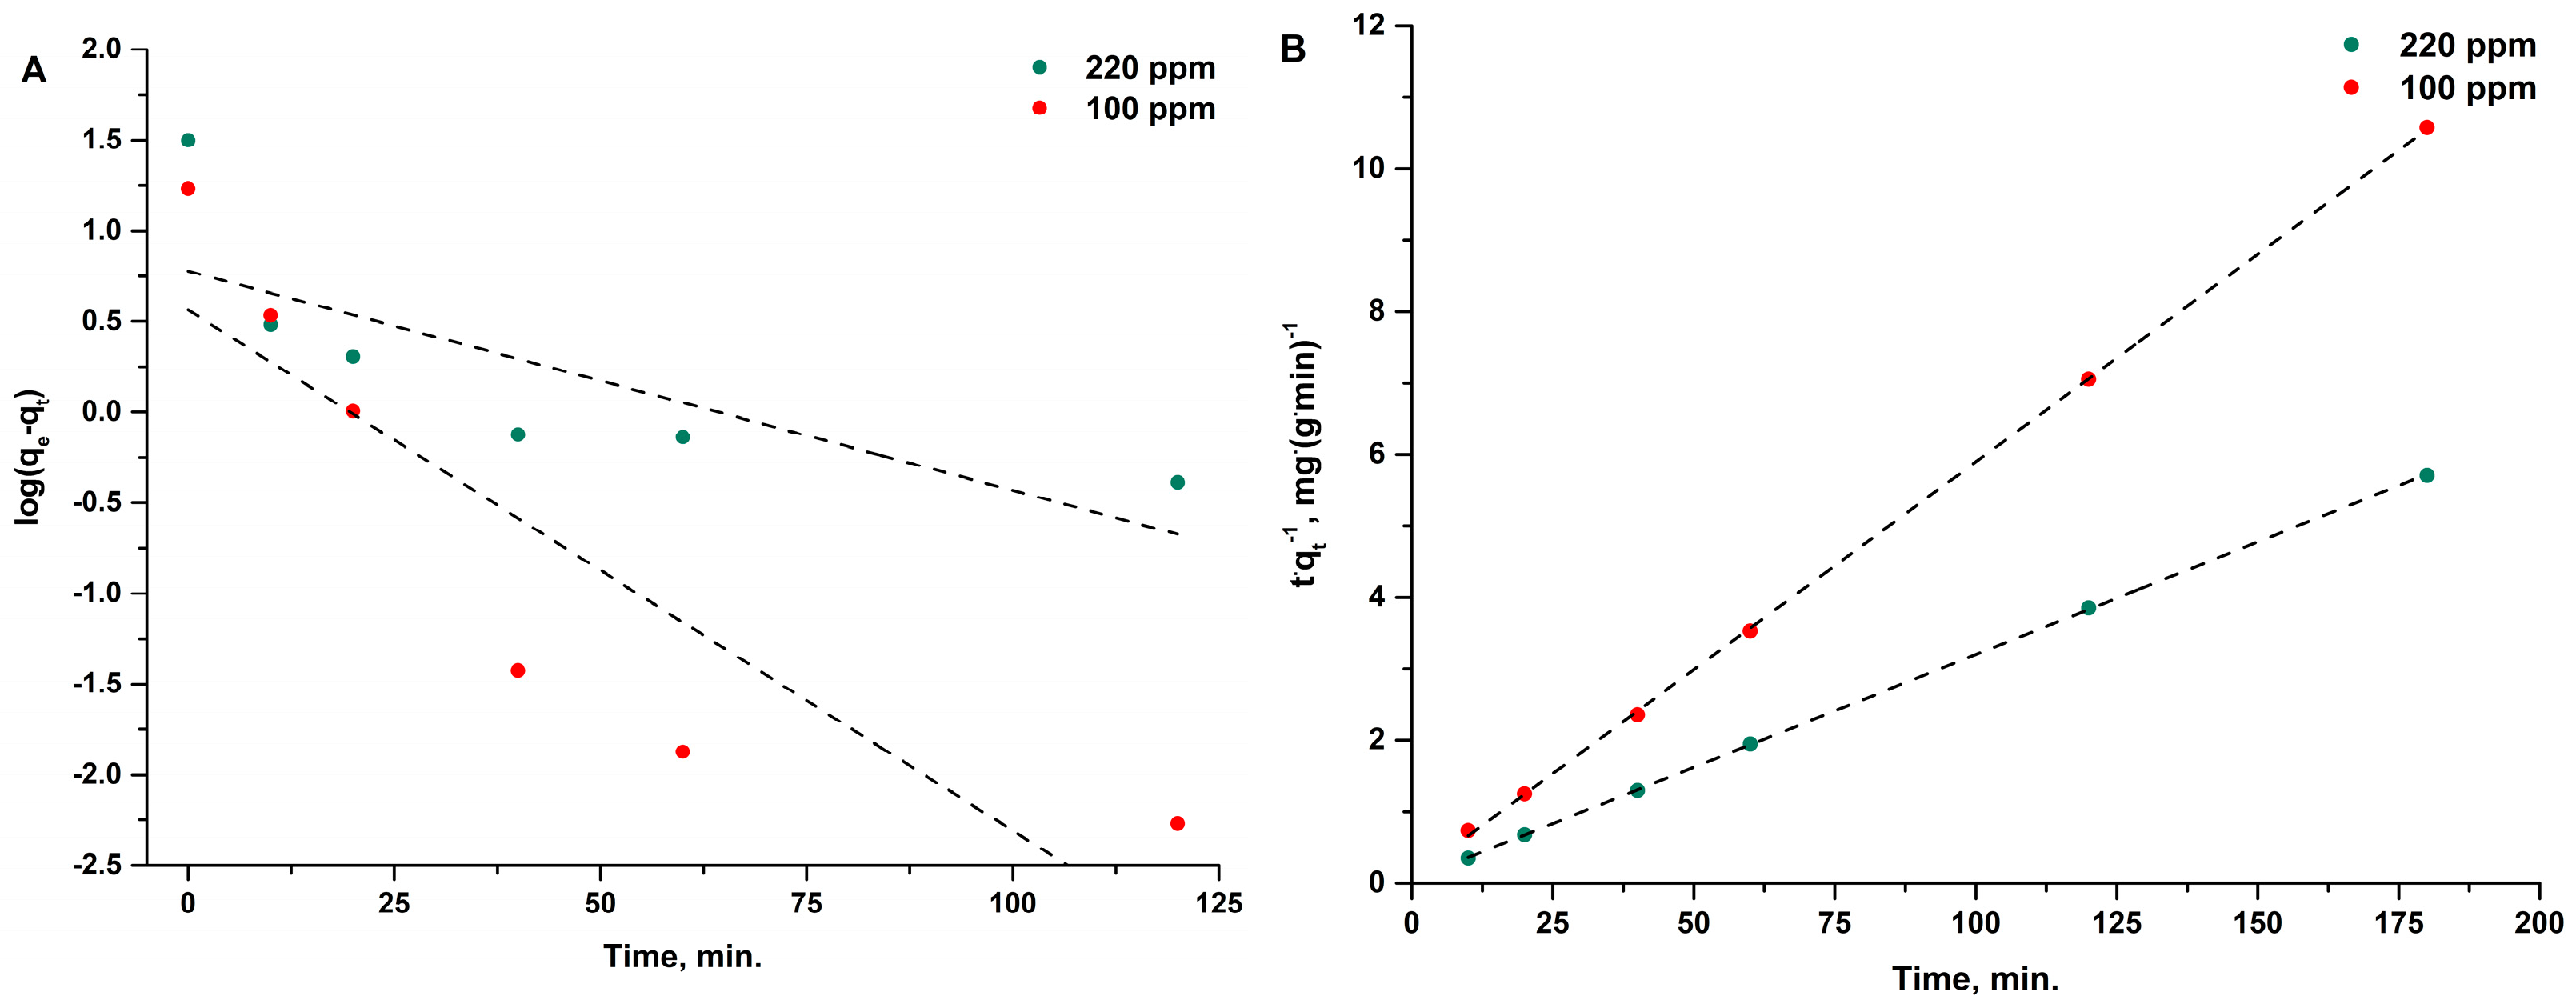
3.2. Sorption Properties of R-SiO2-2h towards Copper(II) Ions
4. Conclusions
Author Contributions
Funding
Institutional Review Board Statement
Informed Consent Statement
Data Availability Statement
Conflicts of Interest
References
- Sabzehmeidani, M.M.; Mahnaee, S.; Ghaedi, M.; Heidari, H.; Roy, V.A.L. Carbon based materials: A review of adsorbents for inorganic and organic compounds. Mater. Adv. 2021, 2, 598–627. [Google Scholar] [CrossRef]
- Mood, S.H.; Pelaez-Samaniego, M.R.; Garcia-Perez, M. Perspectives of Engineered Biochar for Environmental Applications: A Review. Energy Fuels 2022, 36, 7940–7986. [Google Scholar] [CrossRef]
- Chen, D.; Li, Y.; Bao, M.; Hou, Y.; Jin, J.; Yin, Z.; Wang, Z. Magnet-Responsive Silica Microrods as Solid Stabilizer and Adsorbent for Simultaneous Removal of Coexisting Contaminants in Water. ACS Sustain. Chem. Eng. 2019, 7, 13786–13795. [Google Scholar] [CrossRef]
- Ece, M.S.; Kutluayc, S.; Şahin, O.; Sabit Horoz, S. Development of Novel Fe3O4/AC-SiO2-1,4-DAAQ Magnetic Nanoparticles with Outstanding VOC Removal Capacity: Characterization, Optimization, Reusability, Kinetics, and Equilibrium Studies. Ind. Eng. Chem. Res. 2020, 59, 21106–21123. [Google Scholar] [CrossRef]
- Singh, P.; Sarswatc, A.; Pittman, C.U.; Mlsna, T.; Mohan, D. Sustainable Low-Concentration Arsenite [As(III)] Removal in Single and Multicomponent Systems Using Hybrid Iron Oxide−Biochar Nanocomposite Adsorbents: A Mechanistic Study. ACS Omega 2020, 5, 2575–2593. [Google Scholar] [CrossRef]
- Lu, L.; Shan, R.; Shi, Y.; Wang, S.; Yuan, H. A novel TiO2/biochar composite catalysts for photocatalytic degradation of methyl orange. Chemosphere 2019, 222, 391–398. [Google Scholar] [CrossRef] [PubMed]
- Chandra, S.; Jagdale, P.; Medha, I.; Kumar Tiwari, A.K.; Bartoli, M.; De Nino, A.; Olivito, F. Biochar-Supported TiO2-Based Nanocomposites for the Photocatalytic Degradation of Sulfamethoxazole in Water—A Review. Toxics 2021, 9, 313. [Google Scholar] [CrossRef]
- Mazurek, K.; Drużyński, S.; Kiełkowska, U.; Bielicka, A.; Gluzińska, J. Application of sulphate and magnesium enriched waste rapeseed cake biochar for recovery of Cu(II) and Zn(II) from industrial wastewater generated in sulphuric acid plants. Hydrometallurgy 2023, 216, 106014. [Google Scholar] [CrossRef]
- Liu, X.; Shen, F.; Qi, X. Adsorption recovery of phosphate from aqueous solution by CaO-biochar composites prepared from eggshell and rice straw. Sci. Total Environ. 2019, 666, 694–702. [Google Scholar] [CrossRef]
- Li, J.; Xiong, Z.; Duan, F. Interaction investigation of three forest waste biochars and CaO in the process of Ca-L/CARBONOx. Fuel 2023, 337, 126841. [Google Scholar] [CrossRef]
- Zhou, Q.; Jiang, X.; Li, X.; Jia, C.Q.; Jiang, W. Preparation of high-yield N-doped biochar from nitrogen-containing phosphate and its effective adsorption for toluene. RSC Adv. 2018, 8, 30171–30179. [Google Scholar] [CrossRef] [PubMed] [Green Version]
- Arif, M. Extraction of iron (III) ions by core-shell microgel for in situ formation of iron nanoparticles to reduce harmful pollutants from water. J. Environ. Chem. Eng. 2023, 11, 109270. [Google Scholar] [CrossRef]
- Arif, M.; Shahid, M.; Irfan, A.; Nisar, J.; Wang, X.; Batool, N.; Ali, M.; Farooqi, Z.H.; Robina Begum, R. Extraction of copper ions from aqueous medium by microgel particles for in-situ fabrication of copper nanoparticles to degrade toxic dyes. Z. Für Phys. Chem. 2022, 236, 0038. [Google Scholar] [CrossRef]
- Ajmal, M.; Siddiq, M.; Aktasc, N.; Sahiner, N. Magnetic Co–Fe bimetallic nanoparticle containing modifiable microgels for the removal of heavy metal ions, organic dyes and herbicides from aqueous media. RSC Adv. 2015, 5, 43873. [Google Scholar] [CrossRef]
- Jjagwe, J.; Olupot, P.W.; Menya, E.; Kalibbala, H.M. Synthesis and application of granular activated carbon from biomass waste materials for water treatment: A review. J. Bioresour. Bioprod. 2021, 6, 292–322. [Google Scholar] [CrossRef]
- Obey, G.; Adelaide, M.; Ramaraj, R. Biochar derived from non-customized matamba fruit shell as an adsorbent for wastewater treatment. J. Bioresour. Bioprod. 2022, 7, 109–115. [Google Scholar] [CrossRef]
- Alsamadany, H.; Alharby, H.F.; Al-Zahrani, H.S.; Alzahrani, Y.M.; Abbas, A.A.A.G.; Farooq, M.A. Silicon-nanoparticles dopped biochar is more efective than biochar for mitigation of arsenic and salinity stress in Quinoa: Insight to human health risk assessment. Front. Plant Sci. 2022, 13, 989504. [Google Scholar] [CrossRef]
- Nguyen, M.N. Potential use of silica-rich biochar for the formulation of adaptively controlled release fertilizers: A mini review. J. Clean. Prod. 2021, 307, 127188. [Google Scholar] [CrossRef]
- Chakraborty, V.; Pas, D. Synthesis of nano-silica-coated biochar from thermal conversion of sawdust and its application for Cr removal: Kinetic modelling using linear and nonlinear method and modelling using artificial neural network analysis. Biomass Convers. Biorefinery 2020, 13, 821–831. [Google Scholar] [CrossRef]
- Liu, L.; Yang, X.; Ahmad, S.; Li, X.; Ri, C.; Tang, J.; Ellam, R.M.; Song, Z. Silicon (Si) modification of biochars from different Si-bearing precursors improves cadmium remediation. Chem. Eng. J. 2023, 457, 141194. [Google Scholar] [CrossRef]
- World Health Organization. Evaluation of Certain Food Additives and Contaminants; Technical Report Series 683; World Health Organization: Geneva, Switzerlad, 1982; ISBN 9789241209953. [Google Scholar]
- Fewtrell, L.; Kay, D.; MacGill, S. A review of the science behind drinking water standards for copper. Int. J. Environ. Health Res. 2010, 11, 161–167. [Google Scholar] [CrossRef]
- Manne, R.; Kumaradoss, M.M.R.M.; Iska, R.S.R.; Devarajan, A.; Mekala, N. Water quality and risk assessment of copper content in drinking water stored in copper container. Appl. Water Sci. 2022, 12, 27. [Google Scholar] [CrossRef]
- Harvey, P.J.; Handley, H.K.; Taylor, M.P. Widespread copper and lead contamination of household drinking water, New South Wales, Australia. Environ. Res. 2016, 151, 275–285. [Google Scholar] [CrossRef] [PubMed]
- Xiang, Y.; Ding, S.; Chen, X.; Cao, C.; Sun, J.; Xu, L.; Liu, G. Recovery of gold from waste solutions using a new RFB resin. Hydrometallurgy 2020, 198, 105516. [Google Scholar] [CrossRef]
- Wołowicz, A.; Hubicki, Z. Removal of vanadium by ion exchange resins from model and real solutions from spent V2O5 catalyst. Hydrometallurgy 2022, 211, 105871. [Google Scholar] [CrossRef]
- Lingamdinne, L.P.; Koduru, J.R.; Roh, H.; Choi, Y.; Chang, Y.; Yang, J. Adsorption removal of Co(II) from waste-water using graphene oxide. Hydrometallurgy 2016, 165, 90–96. [Google Scholar] [CrossRef]
- Mazurek, K.; Drużyński, S.; Kiełkowska, U.; Szłyk, E. New Separation Material Obtained from Waste Rapeseed Cake for Copper(II) and Zinc(II) Removal fromthe Industrial Wastewater. Materials 2021, 14, 2566. [Google Scholar] [CrossRef] [PubMed]
- Mohan, D.; Abhishek, K.; Sarswat, A.; Patel, M.; Singh, P.; Pittman, C.U. Biochar production and applications in soil fertility and carbon sequestration—A sustainable solution to crop-residue burning in India. RSC Adv. 2018, 8, 508–520. [Google Scholar] [CrossRef] [Green Version]
- Freitas, A.M.; Nair, V.D.; Harris, W.G. Biochar as Influenced by Feedstock Variability: Implications and Opportunities for Phosphorus Management. Front. Sustain. Food Syst. 2020, 4, 510982. [Google Scholar] [CrossRef]
- Husin, H.; Asnawi, T.M.; Firdaus, A.; Husaini, H.; Ibrahim, I.; Hasfita, F. Solid Catalyst Nanoparticles derived from Oil-Palm Empty Fruit Bunches (OP-EFB) as a Renewable Catalyst for Biodiesel Production. Mater. Sci. Eng. 2018, 358, 012008. [Google Scholar] [CrossRef]
- Hossain, N.; Nizamuddin, S.; Griffin, G.; Selvakannan, P.; Mubarak, N.M.; Mahlia, T.M.I. Synthesis and characterization of rice husk biochar via hydrothermal carbonization for wastewater treatment and biofuel production. Sci. Rep. 2020, 10, 18851. [Google Scholar] [CrossRef] [PubMed]
- Sumon Reza, M.S.; Afroze, S.; Muhammad, S.A.; Bakar Saidur, R.; Aslfattahi, N.; Taweekun, J.; Azad, A.K. Biochar characterization of invasive Pennisetum purpureum grass: Effect of pyrolysis temperature. Biochar 2020, 2, 239–251. [Google Scholar] [CrossRef]
- Putra, W.P.; Kamari, A.; Yusoff AN, M.; Ishak, C.F.; Mohamed, A.; Hashim, N.; IIsa, I.M. Biosorption of Cu(II), Pb(II) and Zn(II) ions from aqueous solutions using selected waste materials: Adsorption and characterisation studies. J. Encapsulation Adsorpt. Sci. 2014, 4, 25–35. [Google Scholar] [CrossRef] [Green Version]
- Sabela, M.I.; Kunene, K.; Kanchi, S.; Xhakaza, N.M.; Bathinapatla, A.; Mdluli, P.; Sharma, D.; Bisetty, K. Removal of copper (II) from wastewater using green vegetable waste derived activated carbon: An approach to equilibrium and kinetic study. Arab. J. Chem. 2019, 12, 4331–4339. [Google Scholar] [CrossRef] [Green Version]
- Niu, Y.; Yu, W.; Qin, Z.; Nie, X.; Yang, S.; Wan, Q. Adsorption characteristics of copper ion on nanoporous silica. Acta Geochim. 2019, 38, 517–529. [Google Scholar] [CrossRef]
- Vengris, T.; Binkiene, R.; Sveikauskaite, A. Nickel, copper, and zinc removal from wastewater by a modified clay sorbent. Appl. Clay Sci. 2001, 18, 183–190. [Google Scholar] [CrossRef]
- Wei, J.; Chen, S.; Li, Y.; He, Z.; Geng, L.; Liao, L. Aqueous Cu(II) ion adsorption by amino-functionalized mesoporous silica KIT-6. RSC Adv. 2020, 10, 20504. [Google Scholar] [CrossRef]
- Nasernejad, B.; Zadeh, T.E.; Pour, B.B.; Bygi, M.E.; Zamani, A. Camparison for biosorption modeling of heavy metals (Cr(III), Cu(II), Zn(II)) adsorption from wastewater by carrot residues. Process Biochem. 2005, 40, 1319–1322. [Google Scholar] [CrossRef]
- Cibati, A.; Foereid, B.; Bissessur, A.; Hapca, S. Assessment of Miscanthus giganteus derived biochar as copper and zinc adsorbent: Study of the effect of pyrolysis temperature, pH and hydrogen peroxide modification. J. Clean. Prod. 2017, 162, 1285–1296. [Google Scholar] [CrossRef] [Green Version]
- Putz, A.; Ivankov, O.I.; Kuklin, A.I.; Ryukhtin, V.; Ianăsi, C.; Ciopec, M.; Negrea, A.; Trif, L.; Horváth, Z.; Almásy, L. Ordered mesoporous silica prepared in different solvent conditions: Application for Cu(II) and Pb(II) adsorption. Gels 2022, 8, 443. [Google Scholar] [CrossRef]
- Jiang, S.; Huang, L.; Nguyen, T.; Ok, Y.S.; Rudolph, V.; Yang, H.; Zhang, D. Copper and zinc adsorption by softwood and hardwood biochars under elevated sulphate-induced salinity and acidic pH conditions. Chemosphere 2016, 142, 64–71. [Google Scholar] [CrossRef] [PubMed]


| Sorbent | Ash, % | SiO2, % | C, % | H, % | N, % | Bulk Density, g·dm−3 |
|---|---|---|---|---|---|---|
| R-SiO2-2h | 11.70 | 2.87 | 72.58 | 2.56 | 4.47 | 223.0 |
| R-SiO2-4h | 8.68 | 2.29 | 76.70 | 2.37 | 4.47 | 209.7 |
| R-SiO2-6h | 8.47 | 1.62 | 76.87 | 2.18 | 4.44 | 198.1 |
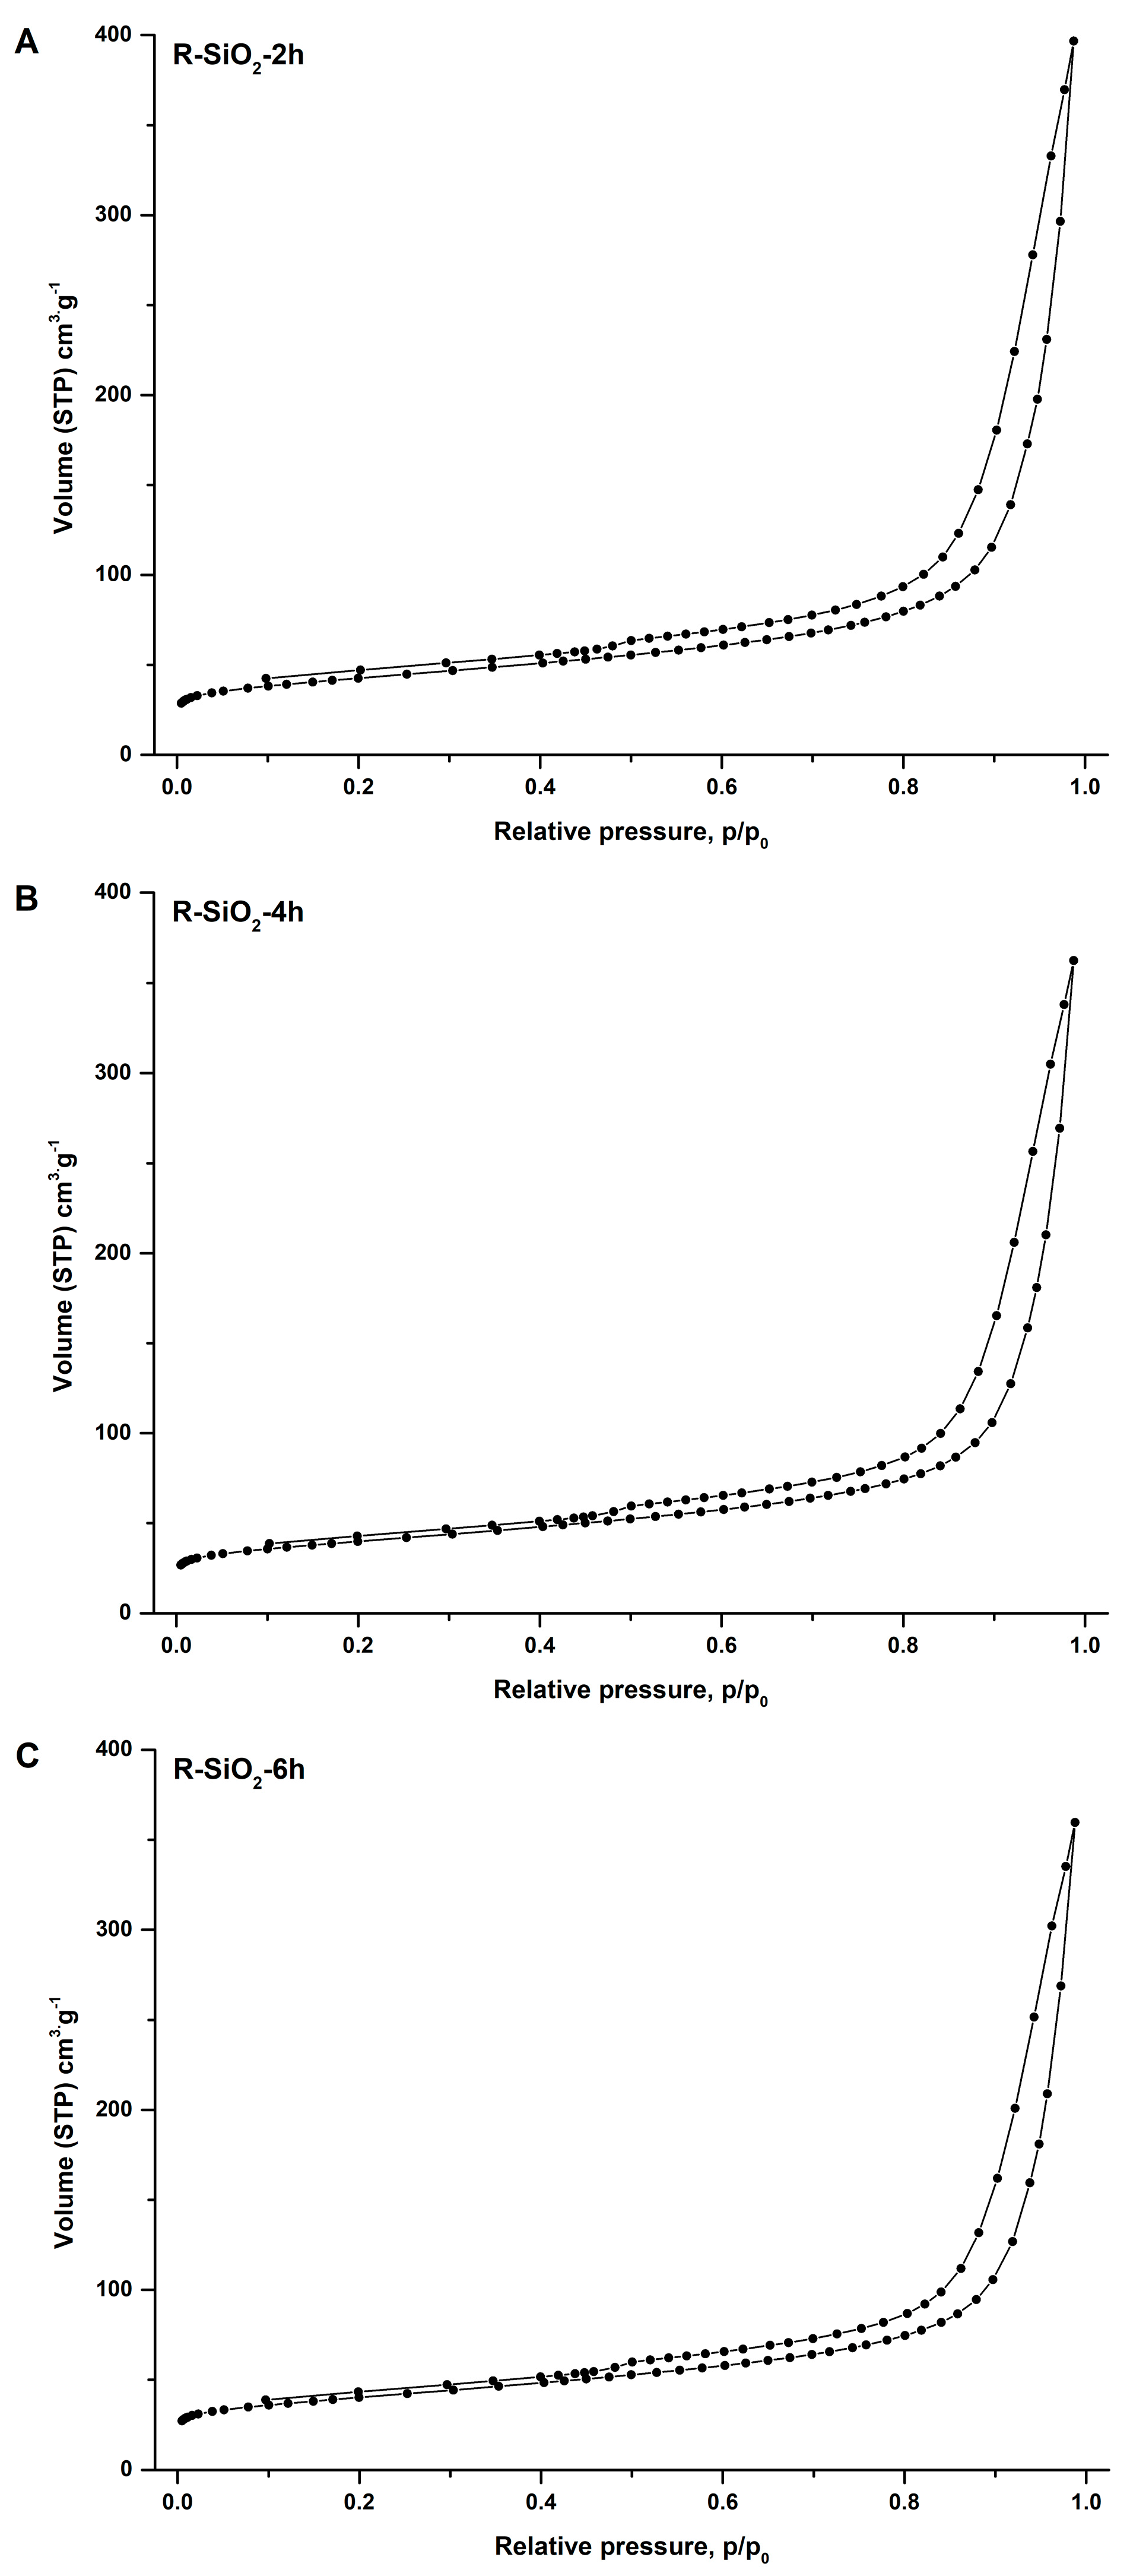
| Sample | Surface Area ABET m2·g−1 | Pore Volume cm3·g−1 | Pore Width nm |
|---|---|---|---|
| R-SiO2-2h | 150.05 | 0.502 | 13.38 |
| R-SiO2-4h | 140.38 | 0.462 | 13.35 |
| R-SiO2-6h | 141.59 | 0.457 | 13.41 |
| Parameter | Copper(II) Ions Concentration (mg·dm−3) | ||||
|---|---|---|---|---|---|
| First-Order | Second-Order | ||||
| Symbol | Unit | 100 | 220 | 100 | 220 |
| qe, exp. | mg·g−1 | 17.02 | 31.54 | 17.02 | 31.54 |
| k1/k2 | 1·min−1 or g·mg−1·min−1 | 0.0287 | 0.0121 | 0.0414 | 0.0220 |
| R2 | - | 0.7918 | 0.6130 | 0.9999 | 0.9999 |
| qe, calc. | mg·g−1 | 3.66 | 5.99 | 17.20 | 31.69 |
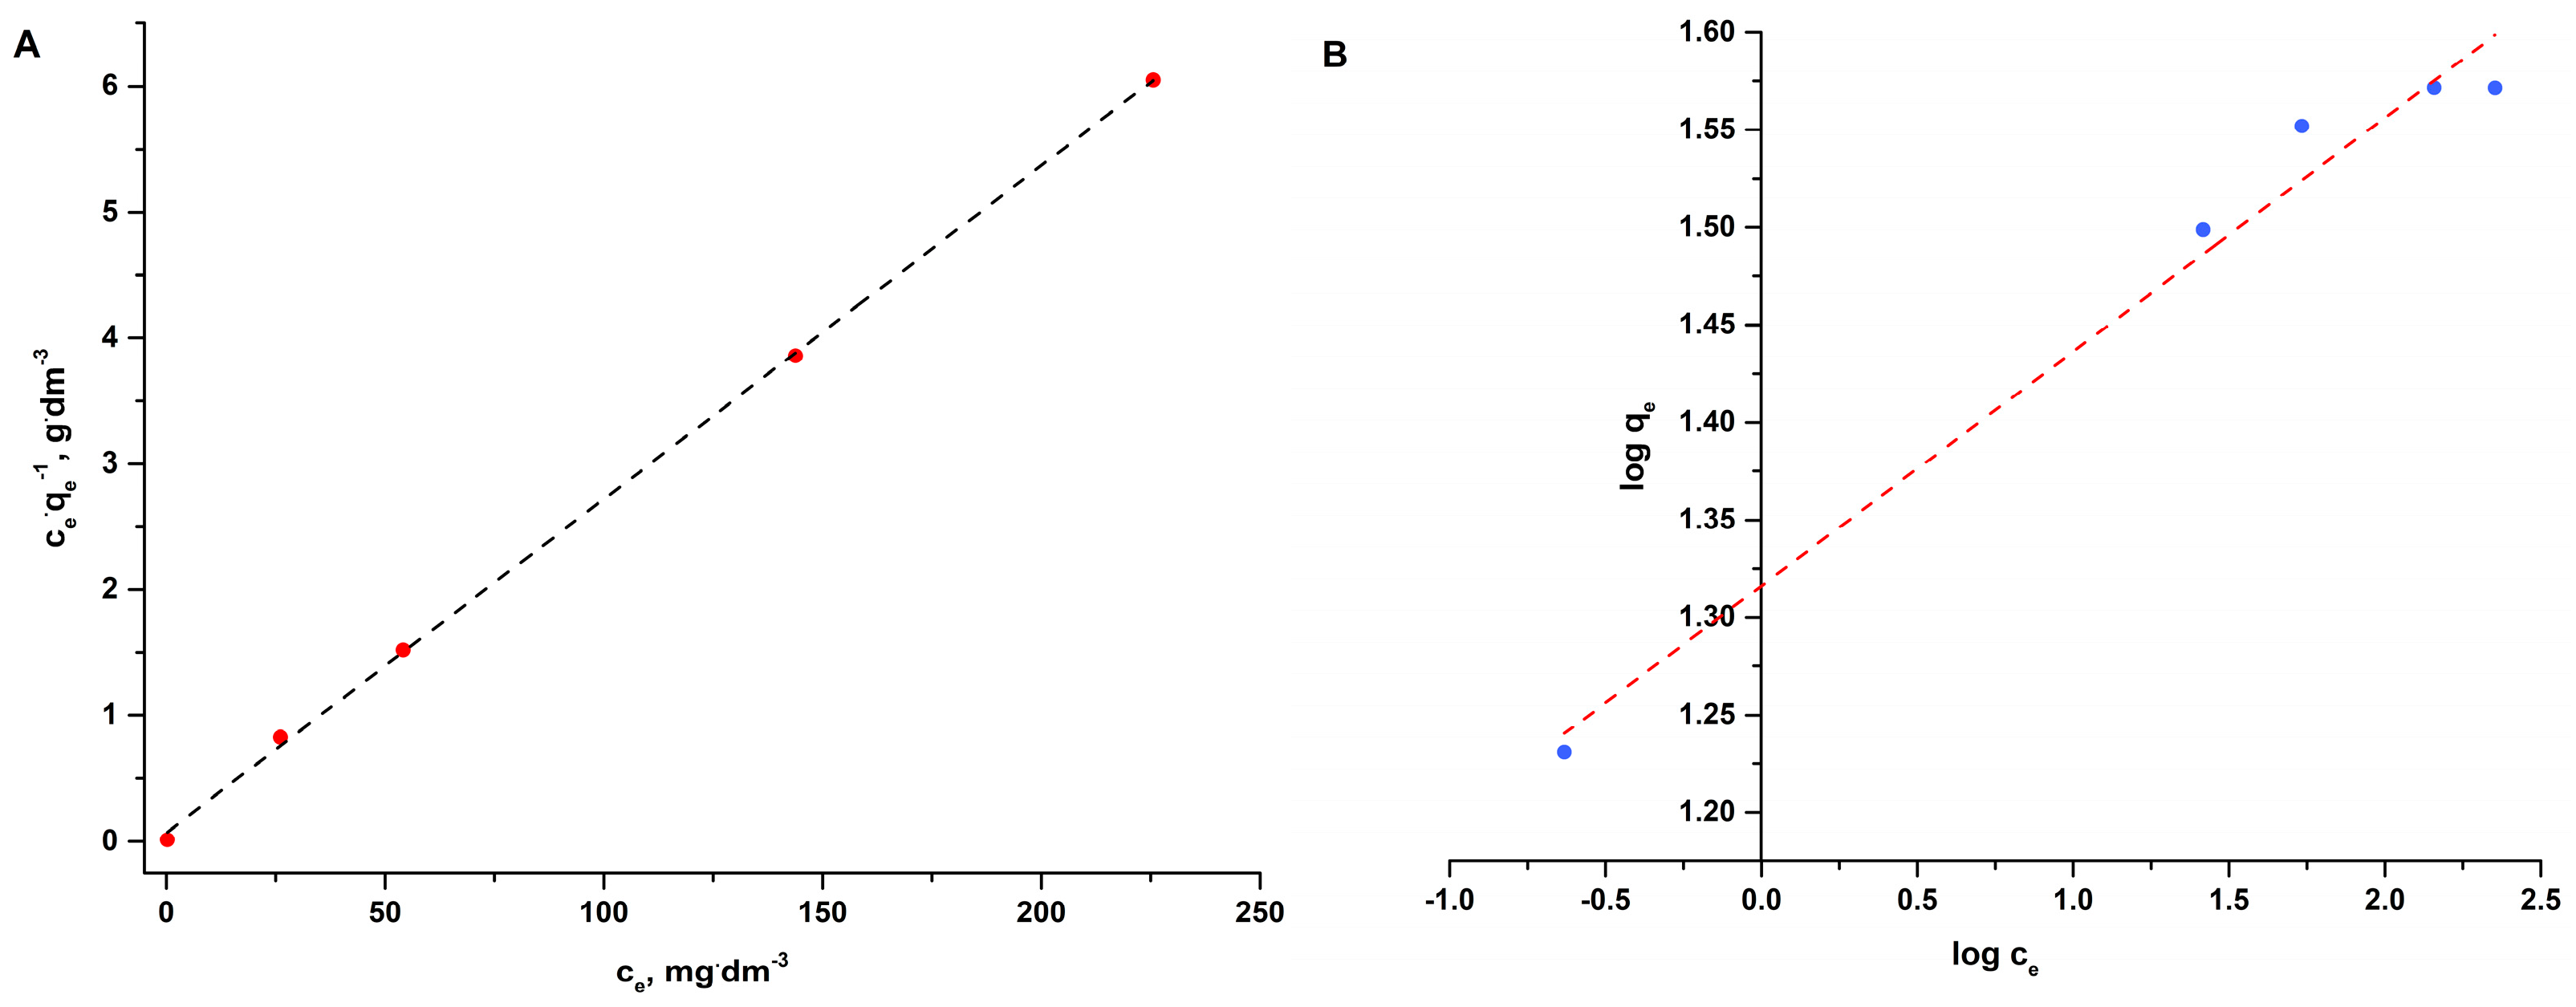
| Sample | Freundlich | Langmuir | ||||
|---|---|---|---|---|---|---|
| R2 | KF (mg·g−1) | n | R2 | qm (mg·g−1) | K (dm3·mg−1) | |
| R-SiO2-2h | 0.9791 | 20.71 | 8.33 | 0.9996 | 37.74 | 0.3816 |
| Unmodified biochar | 0.8735 | 12.33 | 0.233 | 0.9766 | 6.89 | 1.4761 |
| MCM-41 SiO2 [36] | 0.9735 | 0.1088 | 2.17 | 0.9674 | 0.40 | 0.2955 |
| Adsorbent | qm, mg·g−1 | References |
|---|---|---|
| HCl-treated clay | 83.3 | [37] |
| Green vegetable biochar | 75.0 | [35] |
| R-SiO2-2h | 37.74 | This work |
| Mesoporous silica KIT-6 | 36.43 | [38] |
| Carrot pulp | 32.74 | [39] |
| Biochar | 15.7 | [40] |
| Mesoporous silica MCM-41 | 9.7 | [41] |
| Hardwood biochar | 4.39 | [42] |
Disclaimer/Publisher’s Note: The statements, opinions and data contained in all publications are solely those of the individual author(s) and contributor(s) and not of MDPI and/or the editor(s). MDPI and/or the editor(s) disclaim responsibility for any injury to people or property resulting from any ideas, methods, instructions or products referred to in the content. |
© 2023 by the authors. Licensee MDPI, Basel, Switzerland. This article is an open access article distributed under the terms and conditions of the Creative Commons Attribution (CC BY) license (https://creativecommons.org/licenses/by/4.0/).
Share and Cite
Drużyński, S.; Mazurek, K.; Kiełkowska, U.; Wróbel-Kaszanek, A.; Igliński, B. Physicochemical Properties and Application of Silica-Doped Biochar Composites as Efficient Sorbents of Copper from Tap Water. Materials 2023, 16, 2794. https://doi.org/10.3390/ma16072794
Drużyński S, Mazurek K, Kiełkowska U, Wróbel-Kaszanek A, Igliński B. Physicochemical Properties and Application of Silica-Doped Biochar Composites as Efficient Sorbents of Copper from Tap Water. Materials. 2023; 16(7):2794. https://doi.org/10.3390/ma16072794
Chicago/Turabian StyleDrużyński, Sebastian, Krzysztof Mazurek, Urszula Kiełkowska, Adriana Wróbel-Kaszanek, and Bartłomiej Igliński. 2023. "Physicochemical Properties and Application of Silica-Doped Biochar Composites as Efficient Sorbents of Copper from Tap Water" Materials 16, no. 7: 2794. https://doi.org/10.3390/ma16072794