
The Effect of Initial Texture on the Plastic Deformation of Gradient Aluminum


Abstract
:1. Introduction
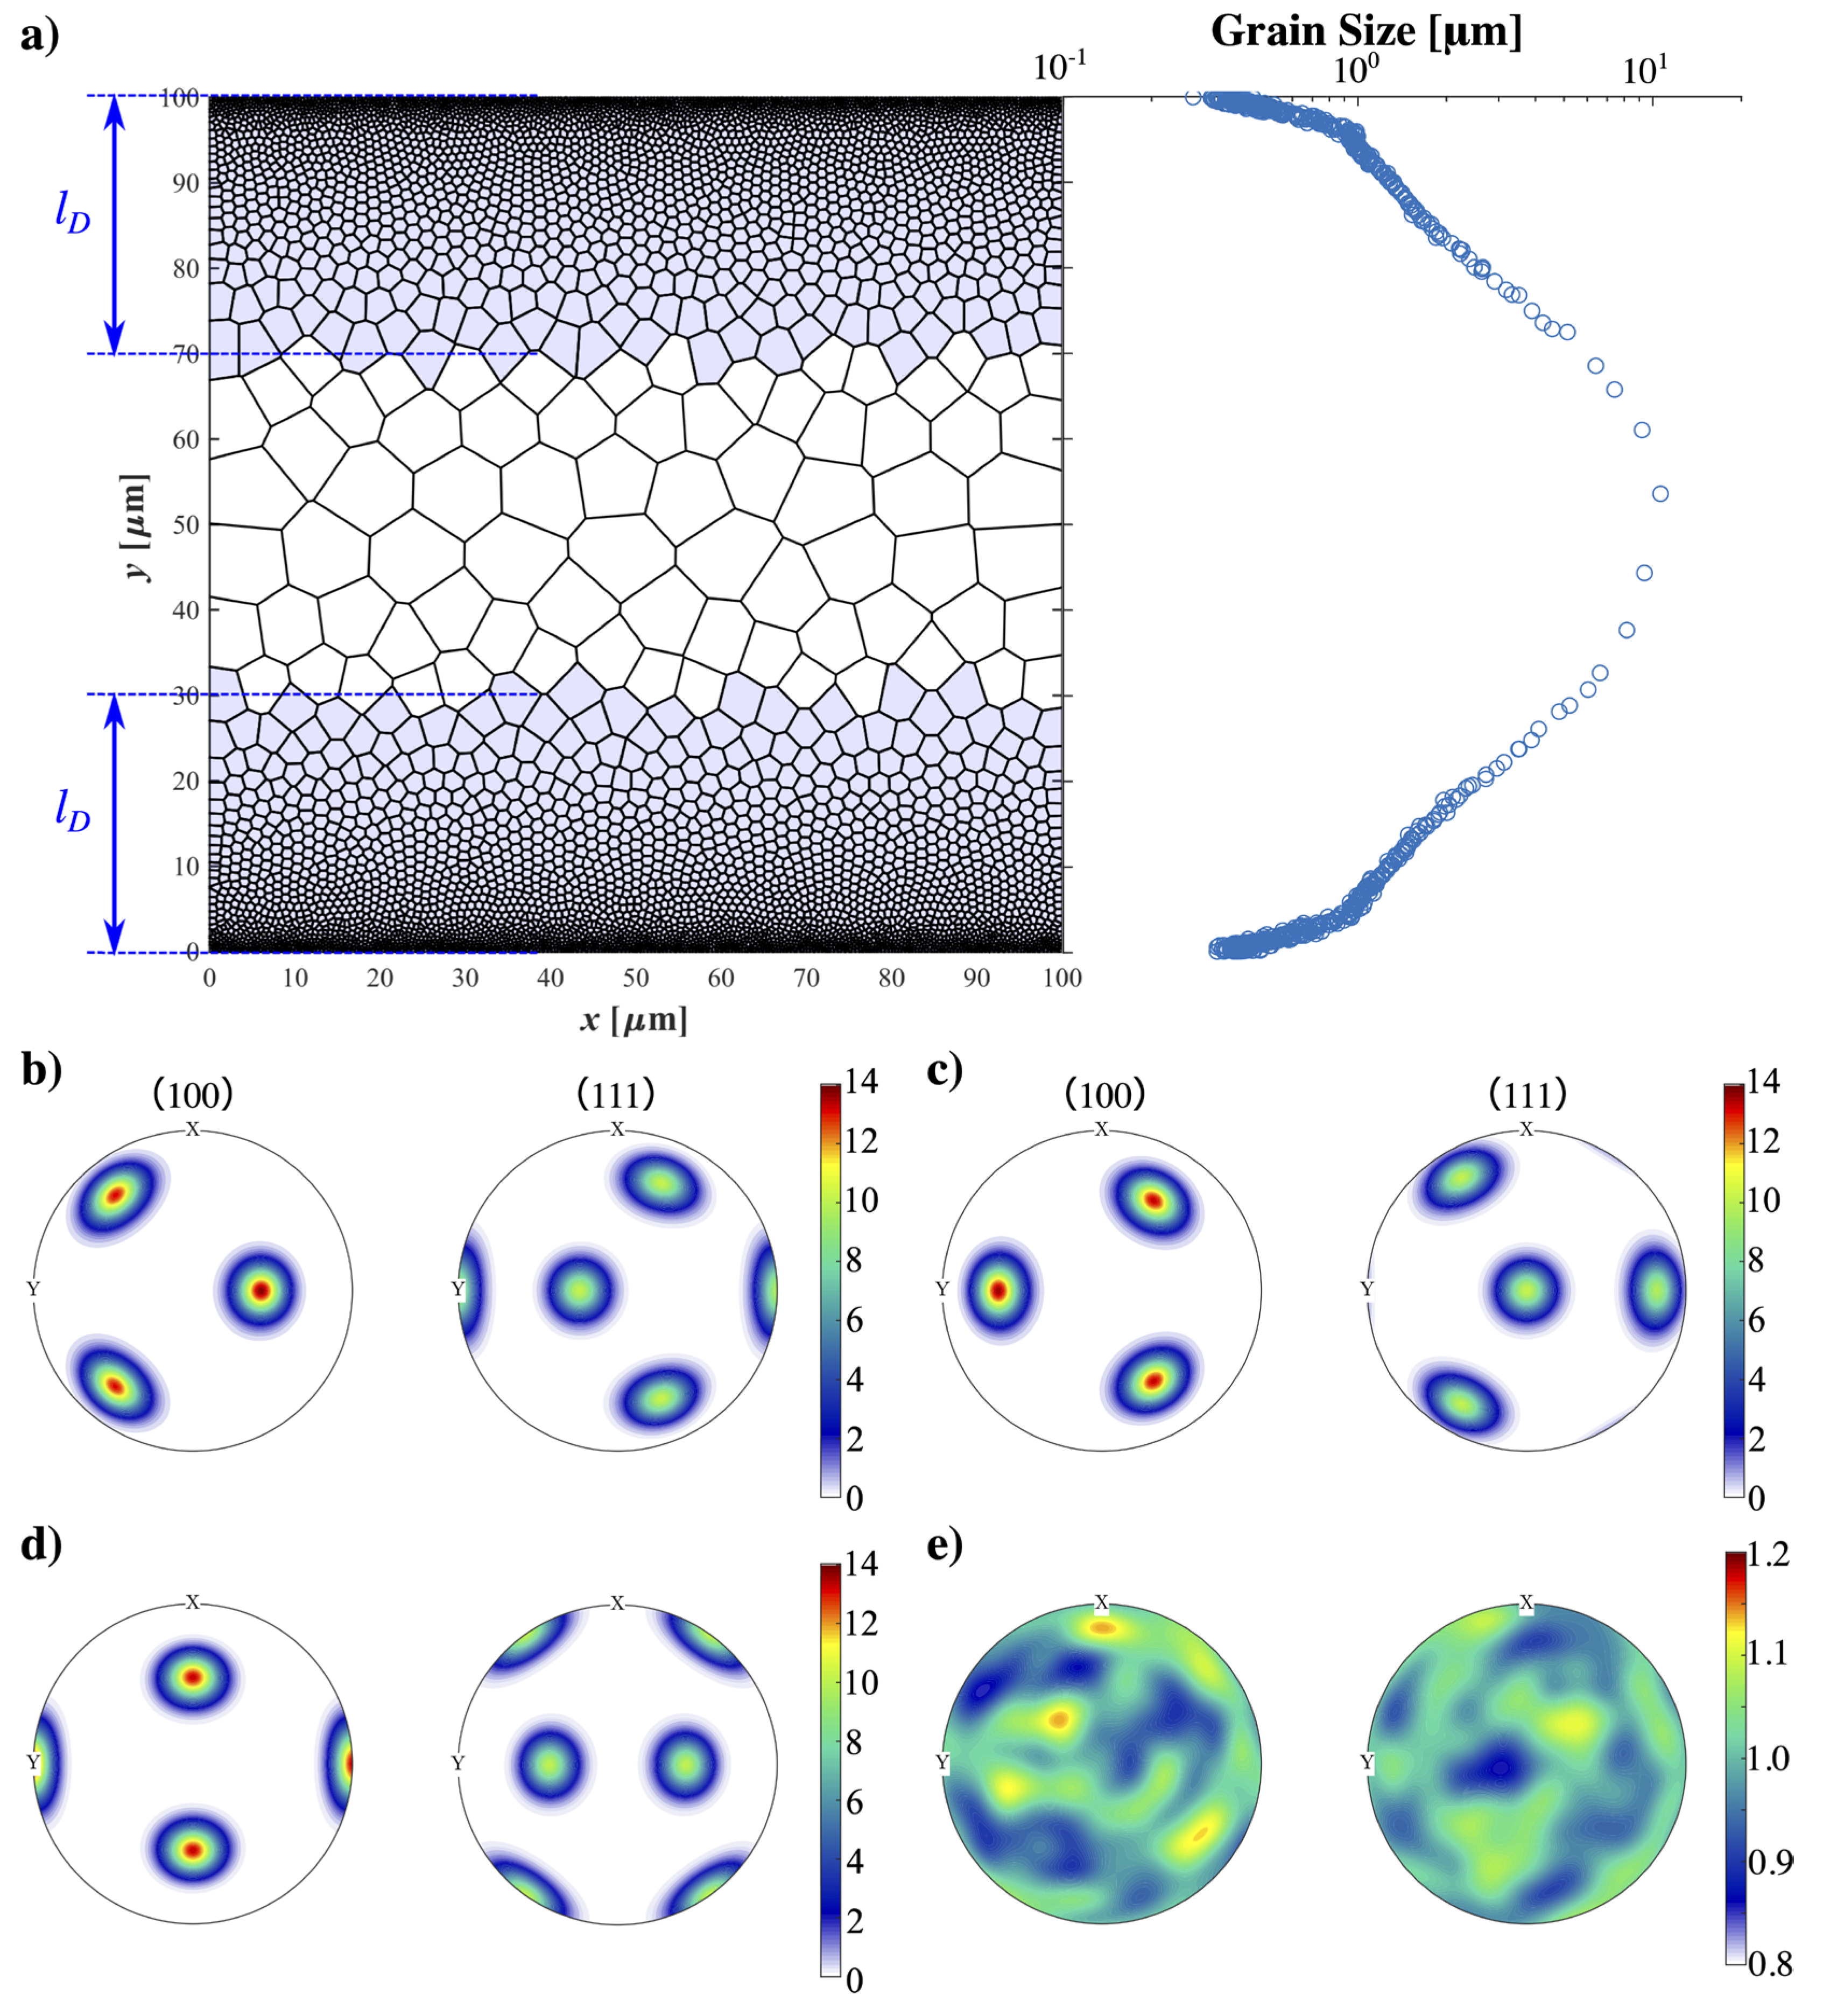
2. Materials and Methods
2.1. CDD-VPSC Model
2.2. Implementation of the Model
2.3. Materials
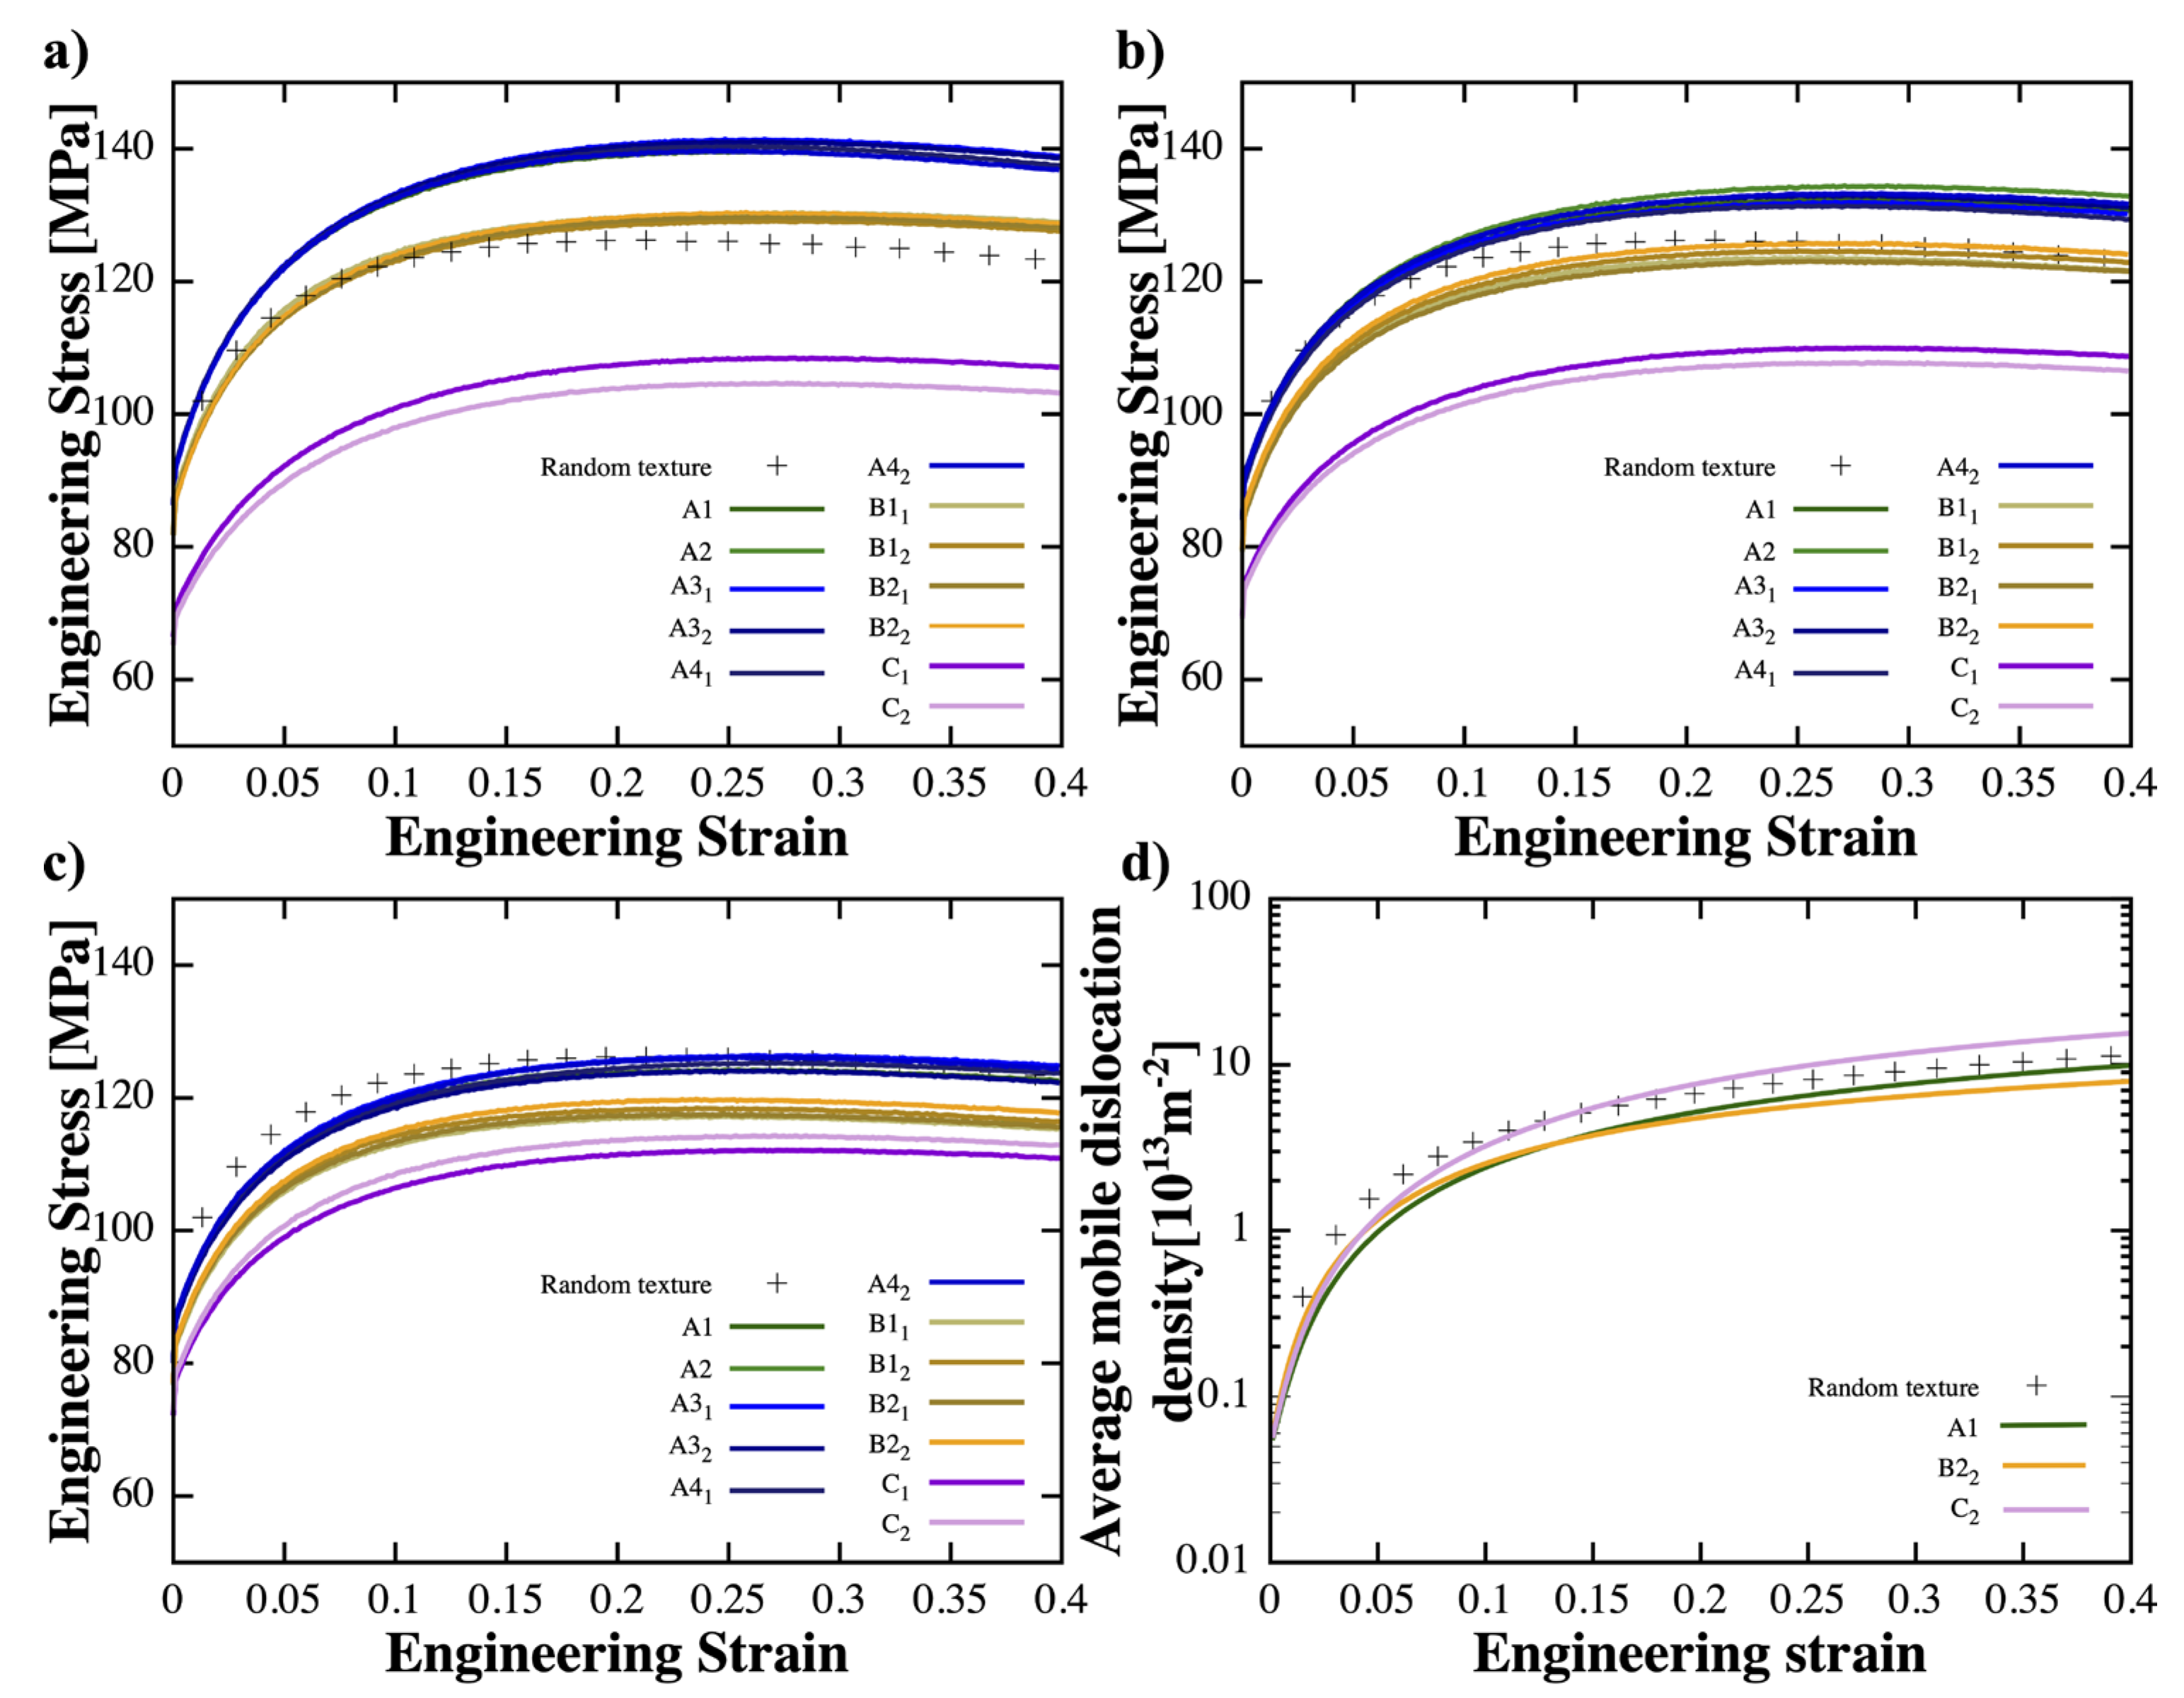
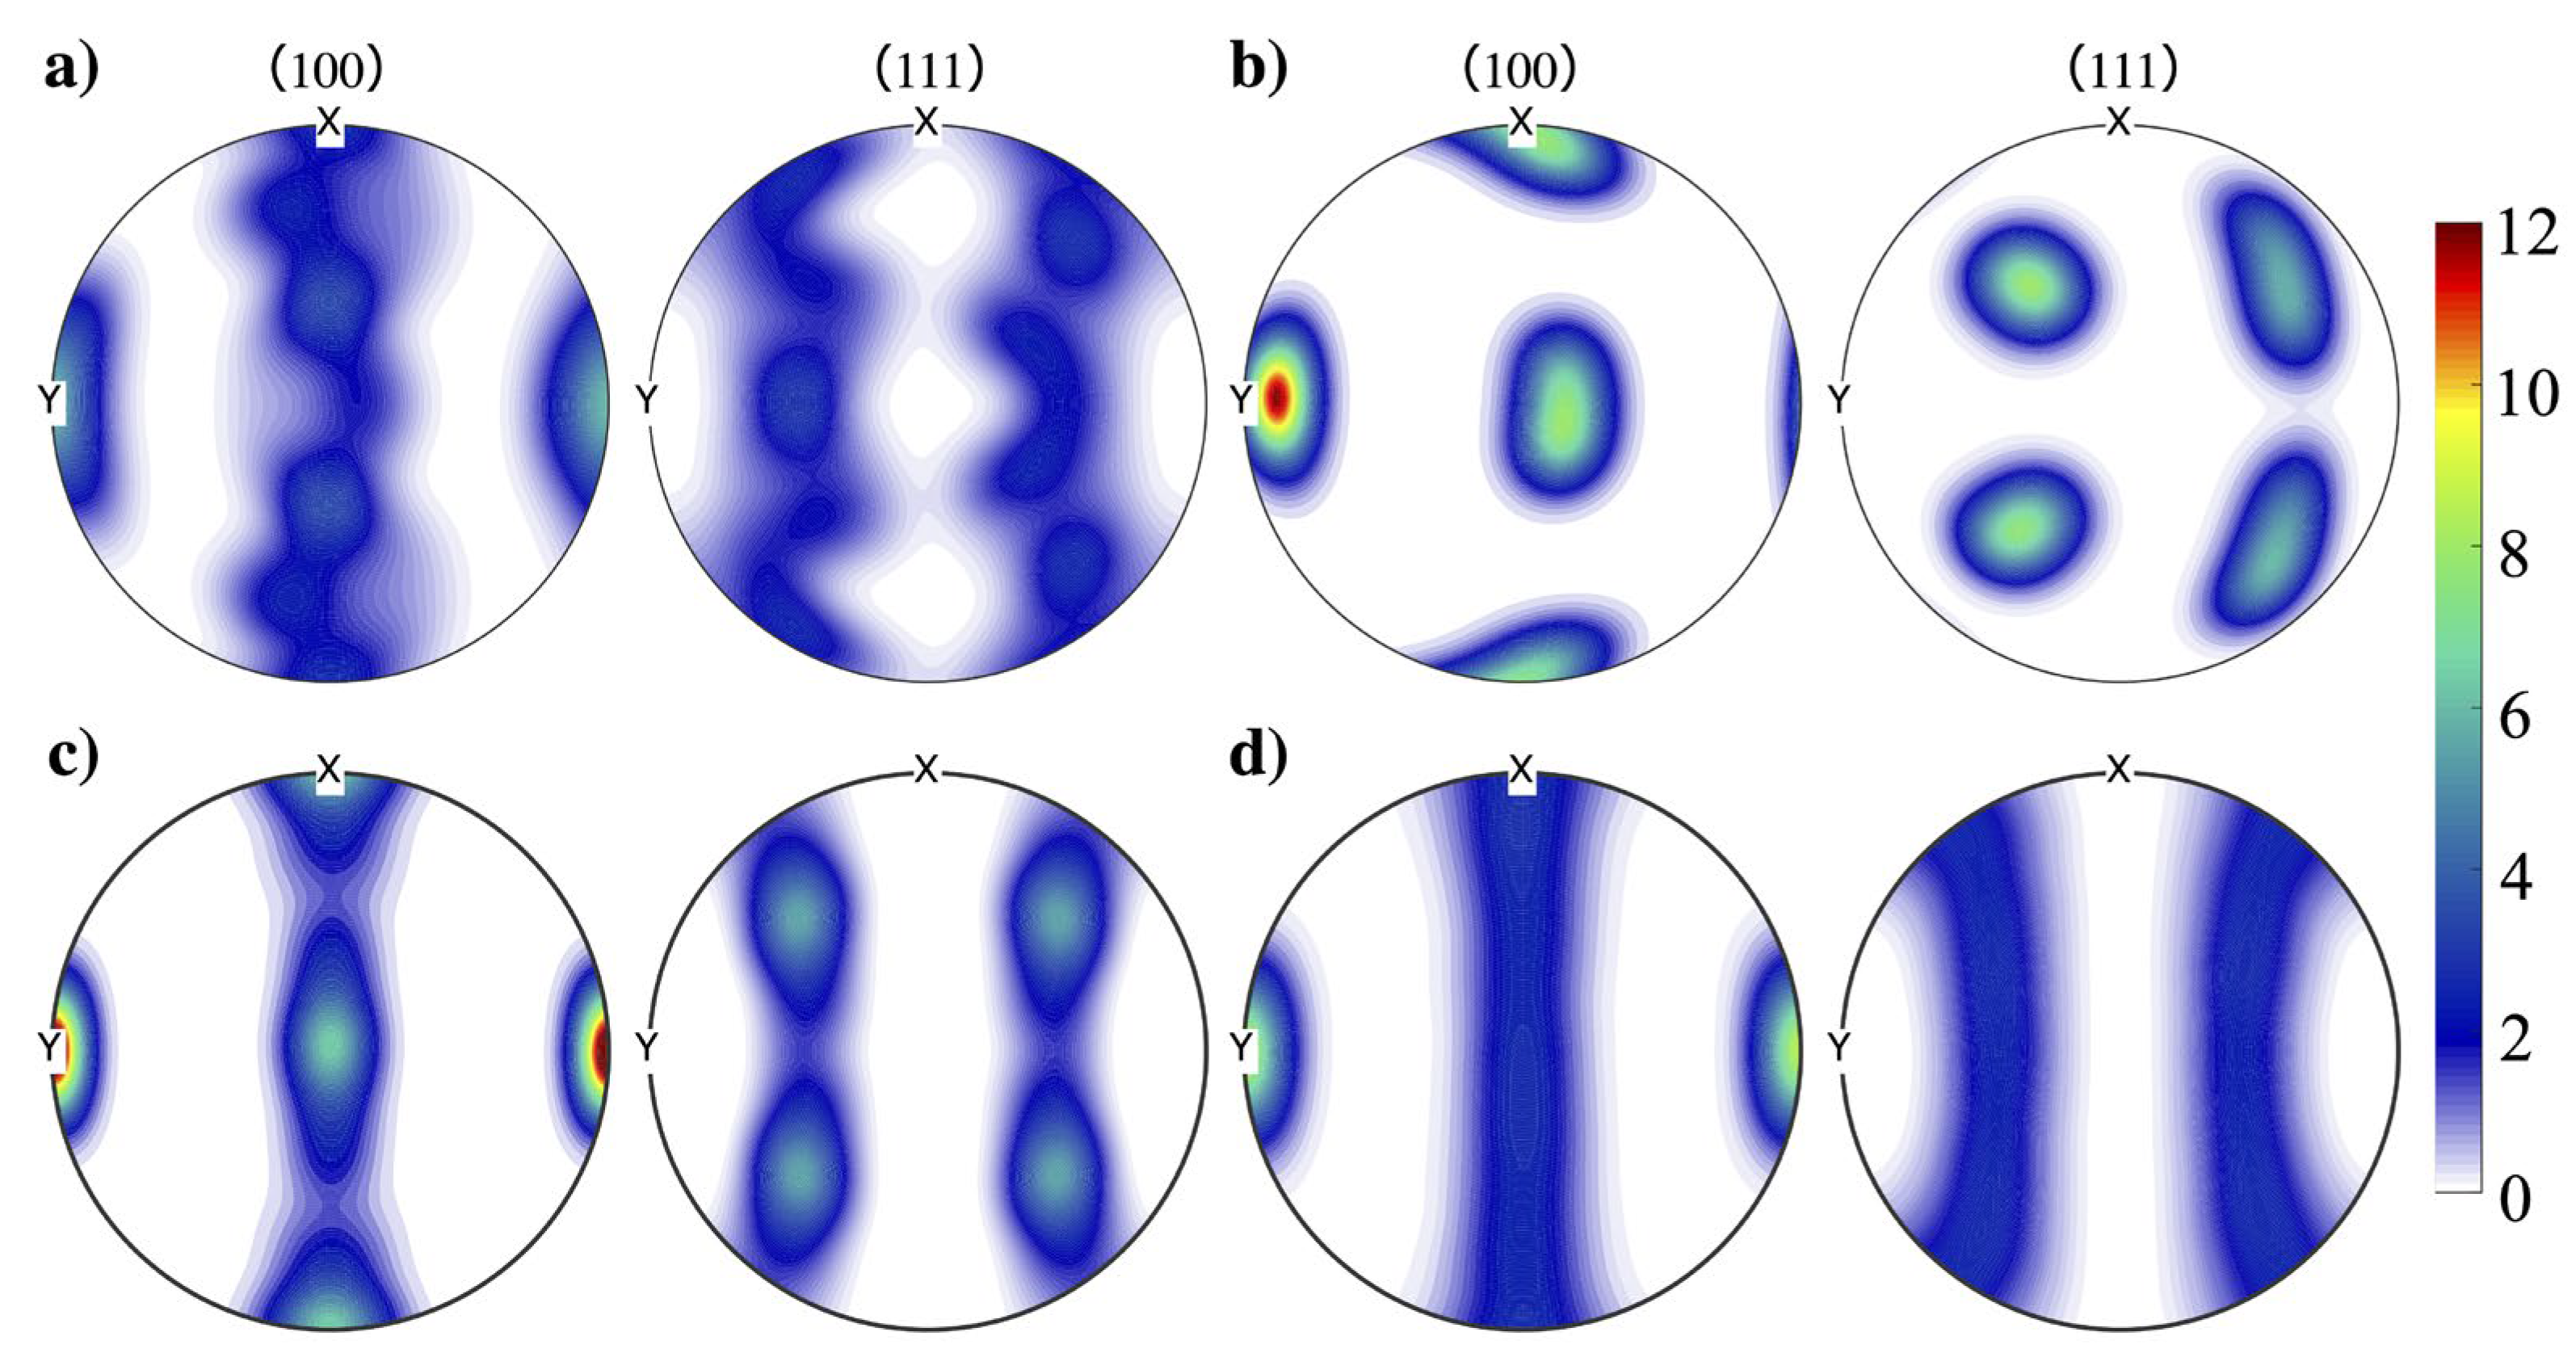
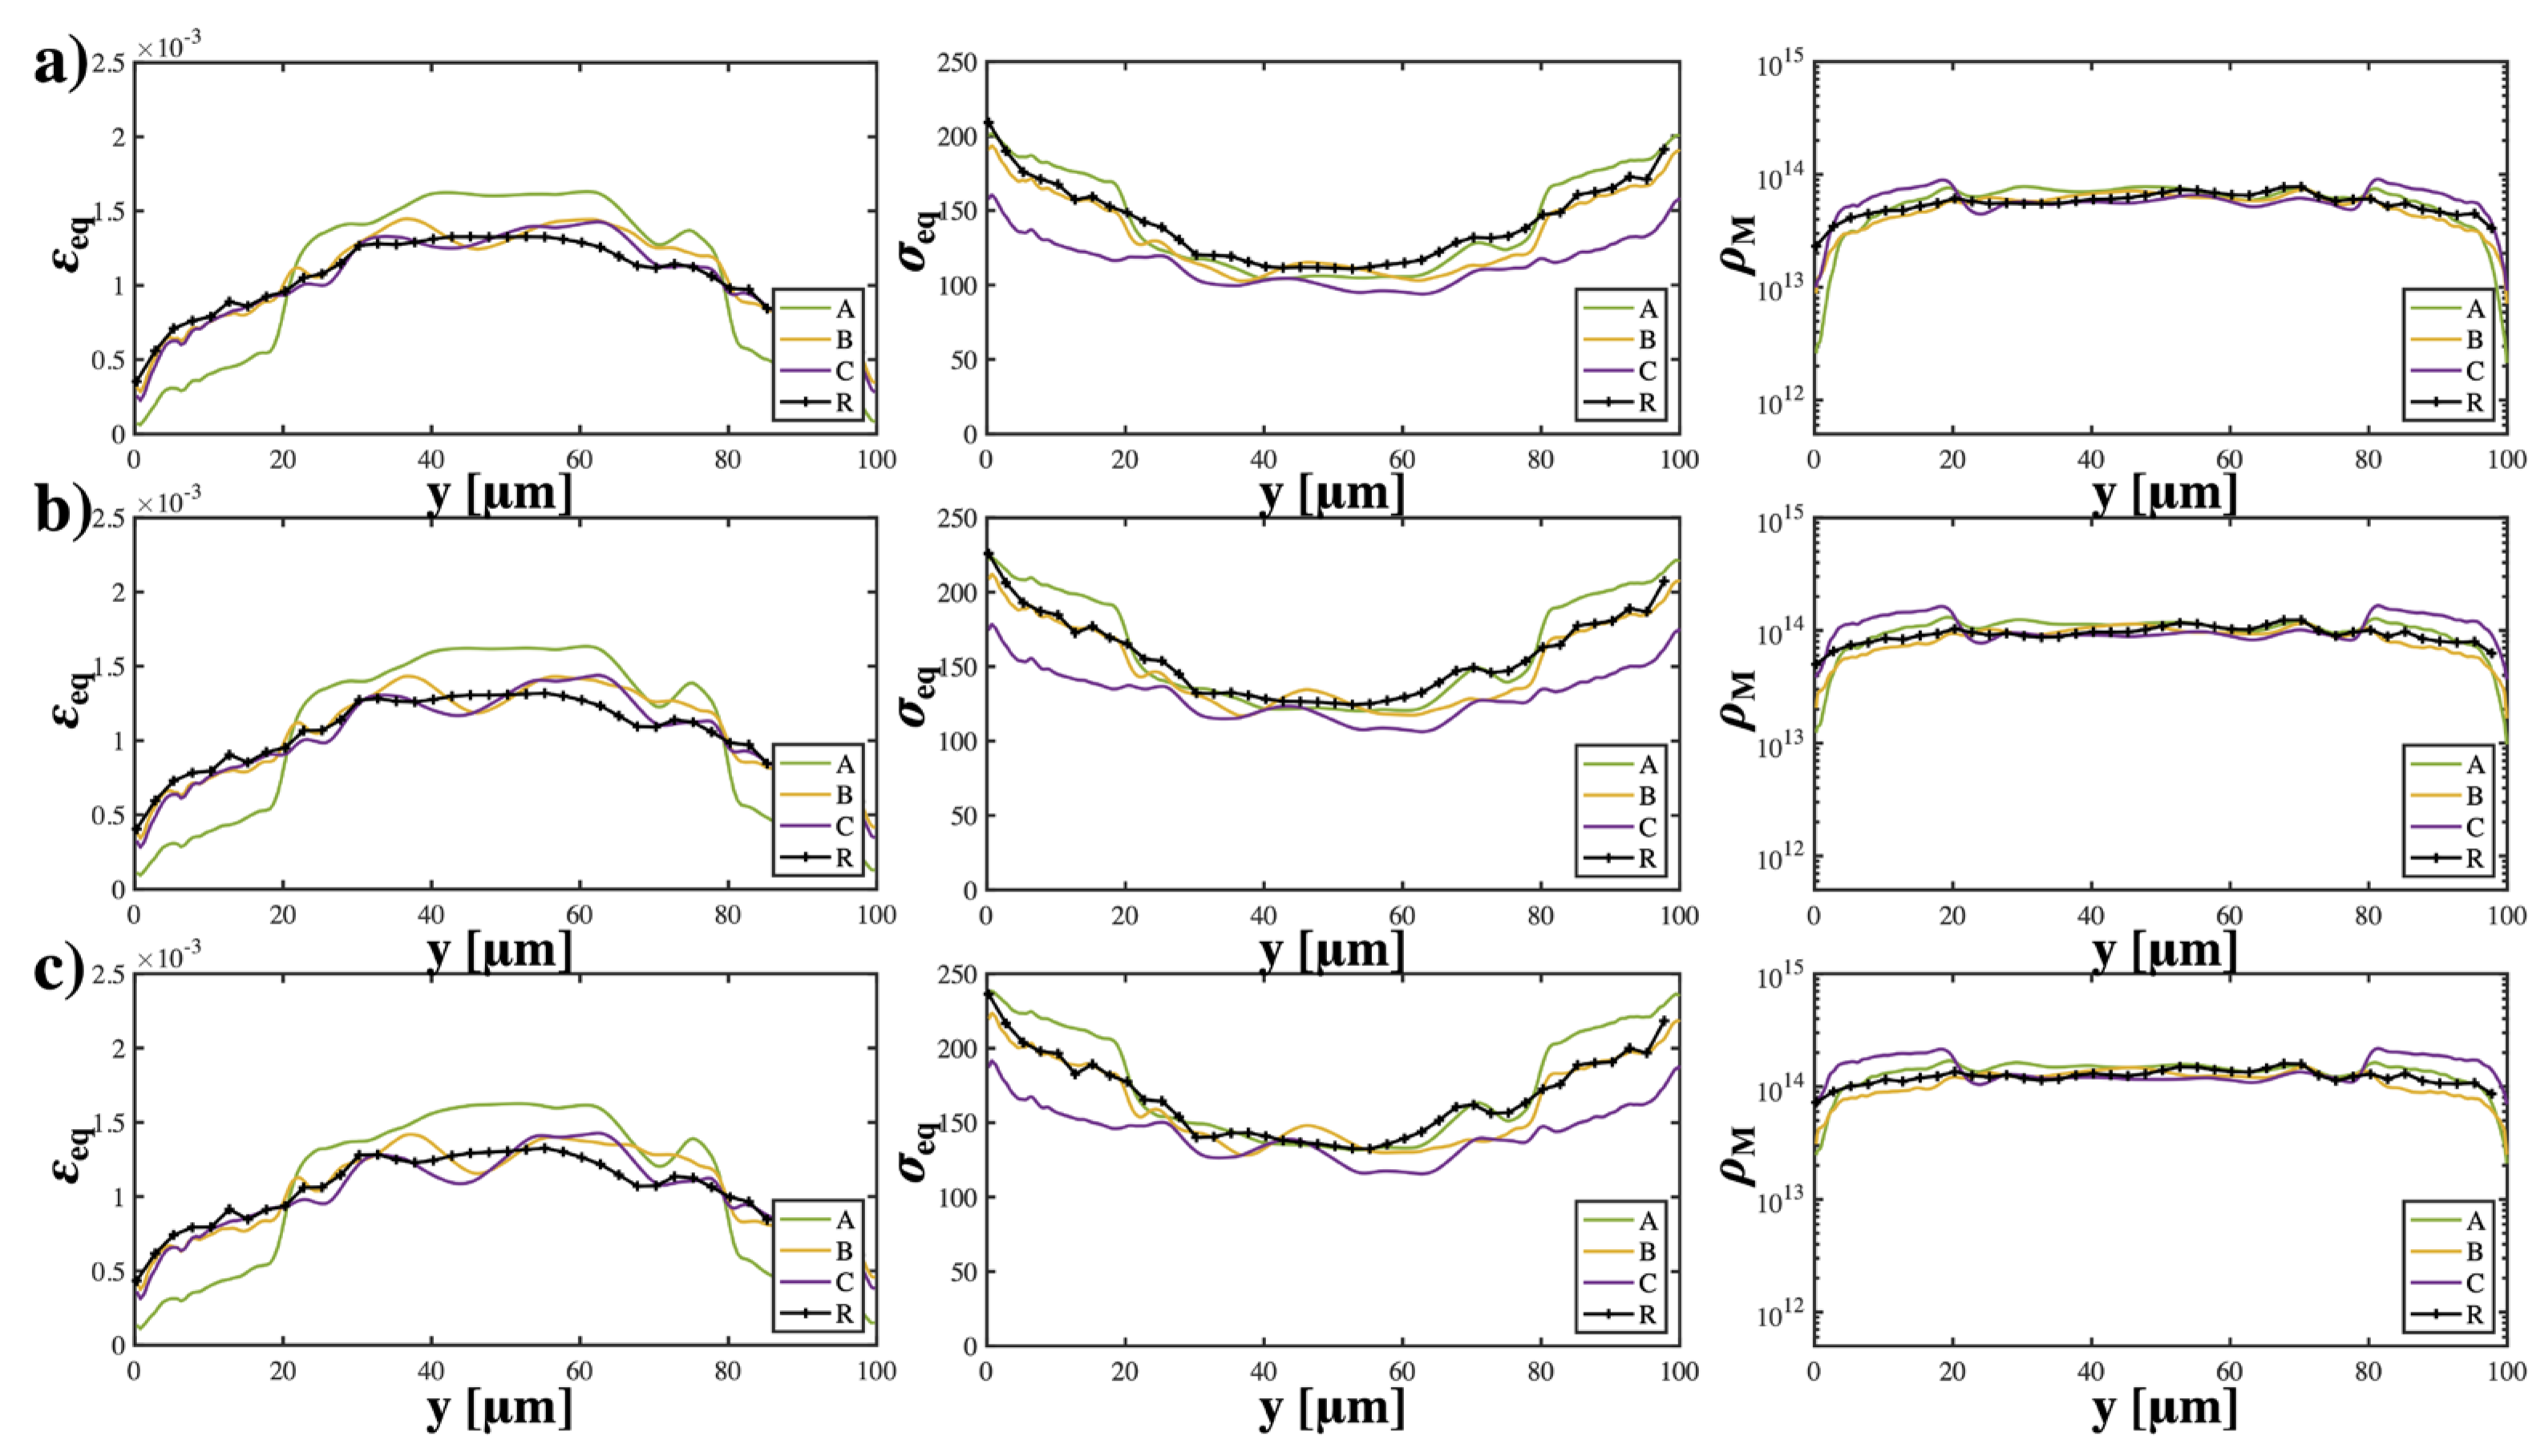
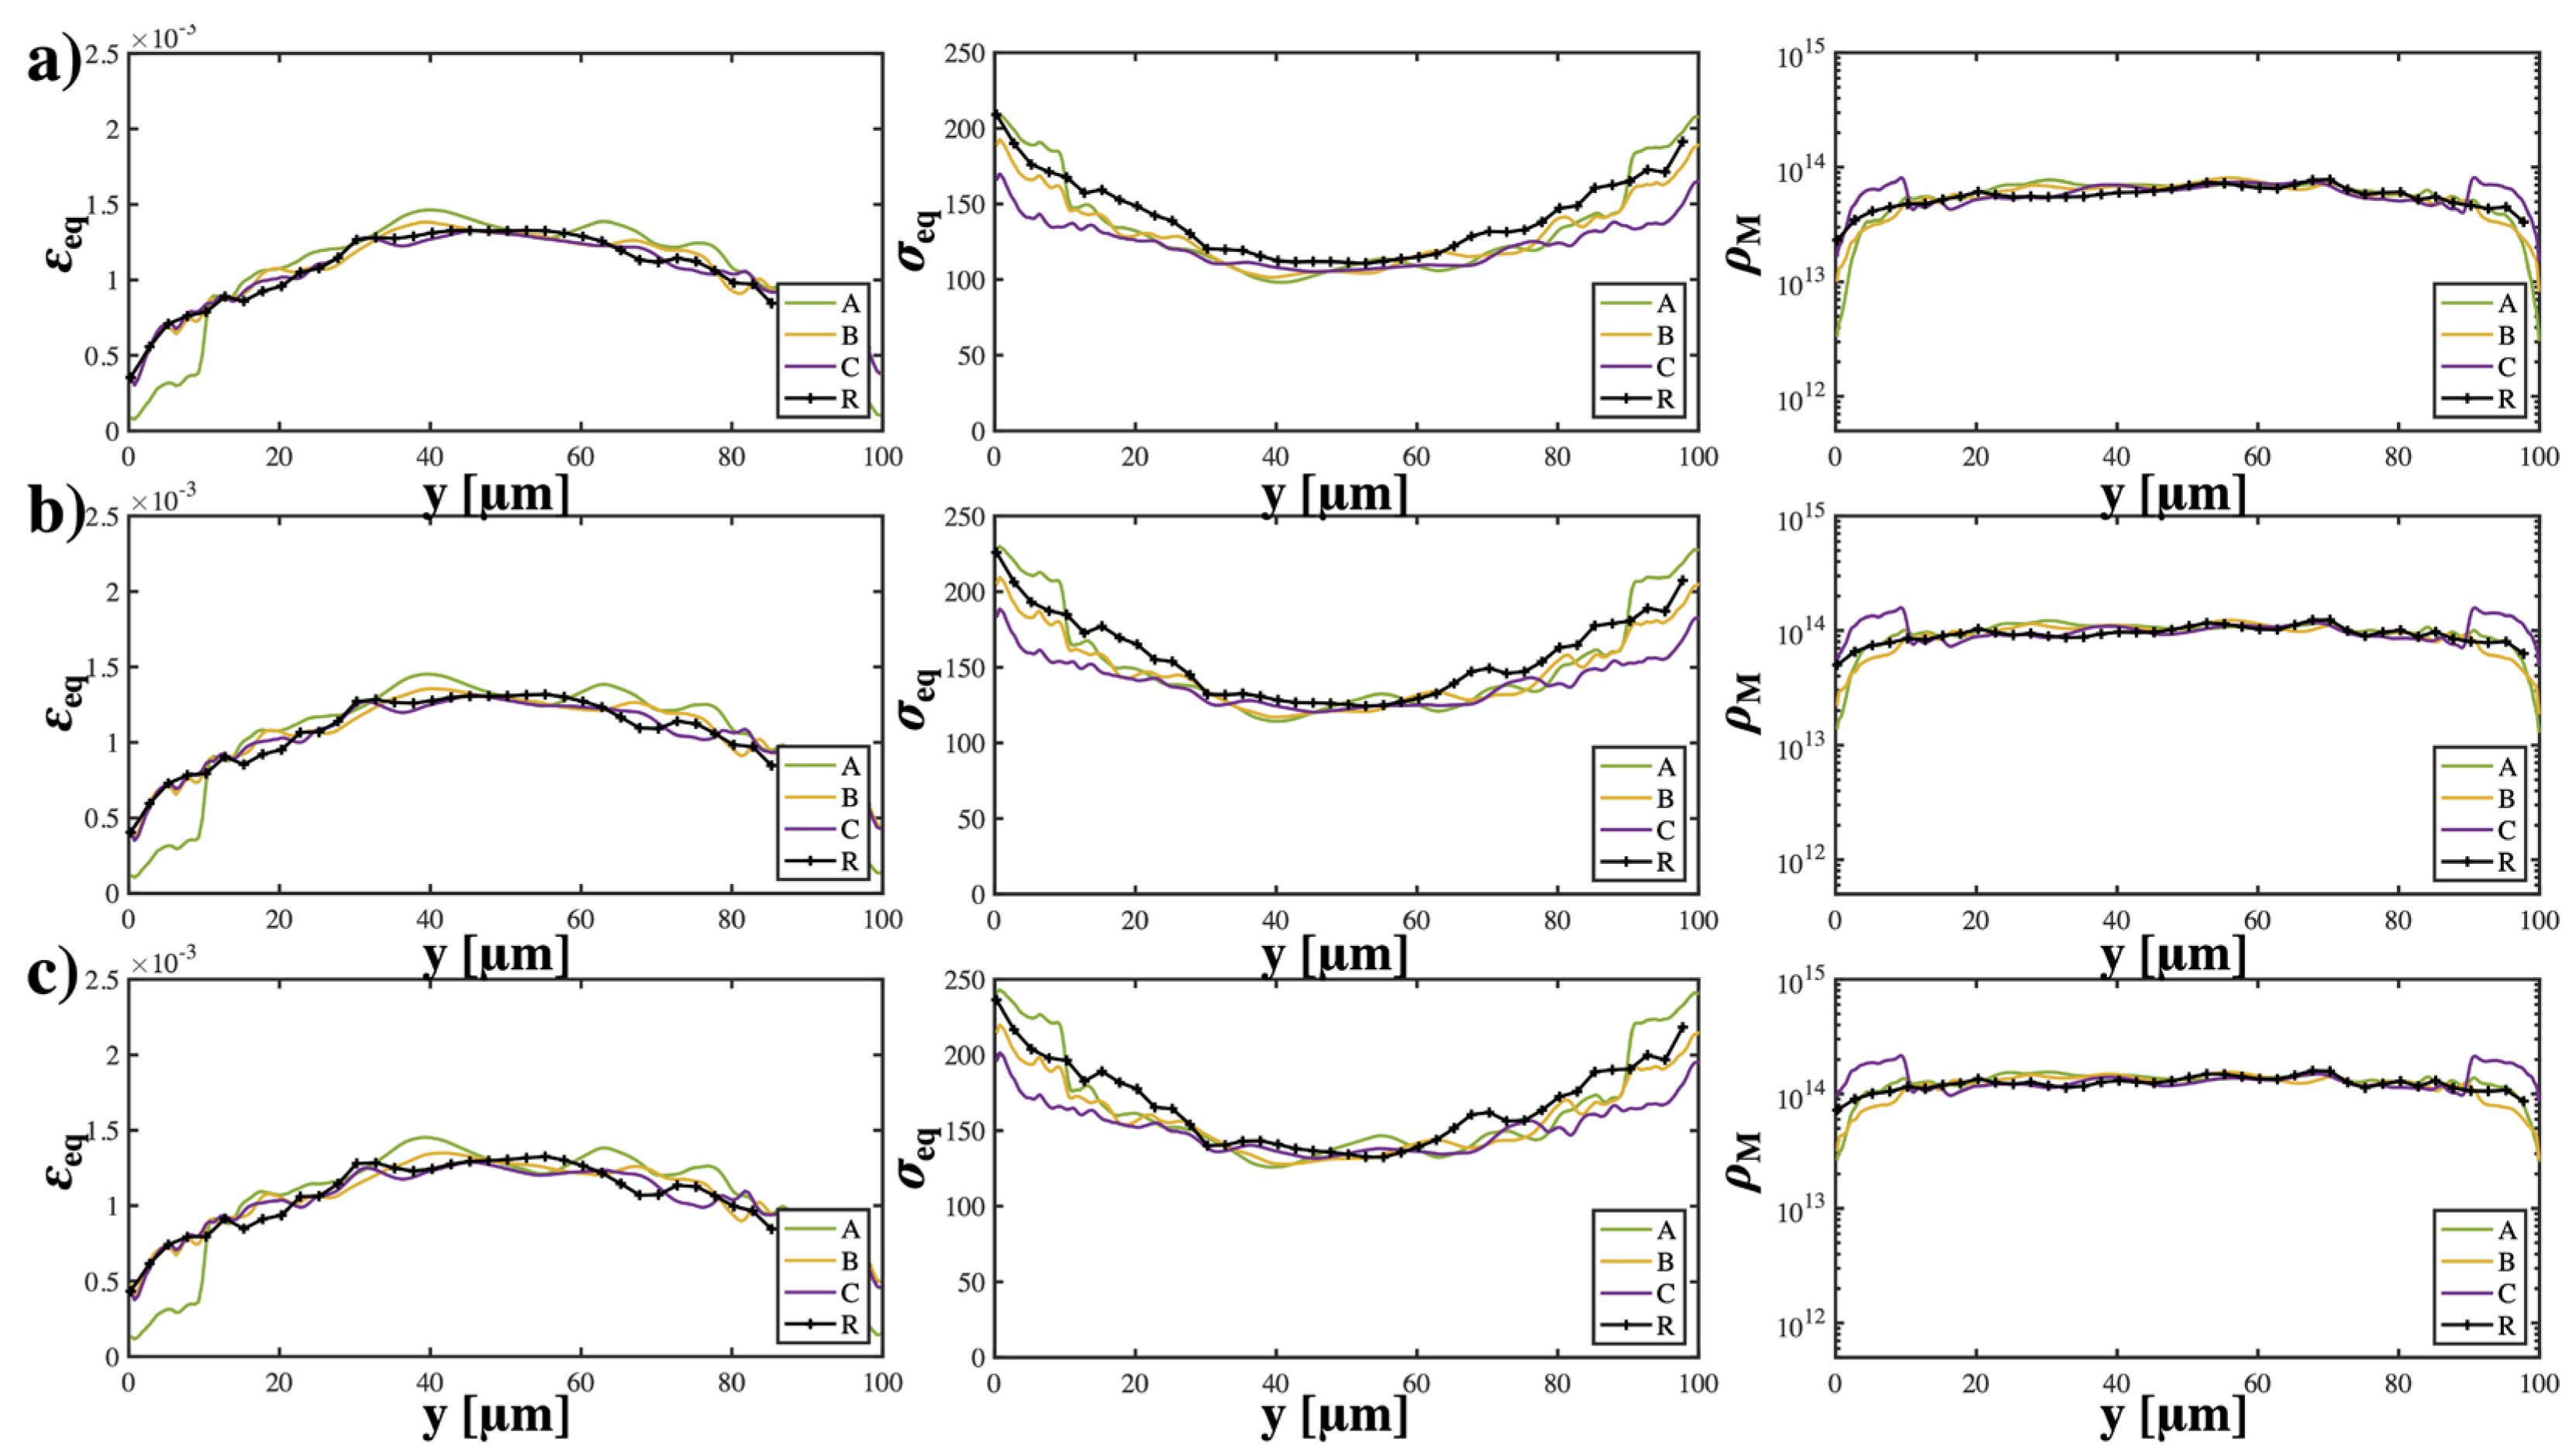
3. Results
4. Discussion
5. Conclusions
Author Contributions
Funding
Institutional Review Board Statement
Informed Consent Statement
Data Availability Statement
Conflicts of Interest
Appendix A
Appendix B


Appendix C

| Slip System | A3 | B1 | C |
|---|---|---|---|
| [110]1) | −0.27 | 0 | 0 |
| [011]1) | 0 | 0 | 0.41 |
| 1) | −0.27 | 0 | −0.41 |
| [110]) | −0.27 | 0.47 | 0 |
| [011]) | 0 | −0.15 | −0.41 |
| [101]) | 0 | 0.11 | −0.41 |
| ) | 0 | 0.37 | 0 |
| [011]) | 0 | −0.21 | −0.41 |
| [101]) | 0 | 0.15 | −0.41 |
| 0 | 0.11 | 0 | |
| −0.27 | 0.15 | 0.41 | |
| 0.27 | 0.26 | −0.41 |
References
- Ma, E.; Zhu, T. Towards strength–ductility synergy through the design of heterogeneous nanostructures in metals. Mater. Today 2017, 20, 323–331. [Google Scholar] [CrossRef]
- Lu, K. Gradient nanostructured materials. Jinshu Xuebao Acta Metall. Sin. 2015, 51, 1–10. [Google Scholar] [CrossRef]
- Zhu, Y.; Wu, X. Perspective on hetero-deformation induced (HDI) hardening and back stress. Mater. Res. Lett. 2019, 7, 393–398. [Google Scholar] [CrossRef] [Green Version]
- Fang, T.H.; Li, W.L.; Tao, N.R.; Lu, K. Revealing extraordinary intrinsic tensile plasticity in gradient nano-grained copper. Science 2011, 331, 1587–1590. [Google Scholar] [CrossRef] [PubMed] [Green Version]
- Wei, Y.; Li, Y.; Zhu, L.; Liu, Y.; Lei, X.; Wang, G.; Wu, Y.; Mi, Z.; Liu, J.; Wang, H.; et al. Evading the strength-ductility trade-off dilemma in steel through gradient hierarchical nanotwins. Nat. Commun. 2014, 5, 3580. [Google Scholar] [CrossRef] [PubMed] [Green Version]
- Wu, X.L.; Jiang, P.; Chen, L.; Zhang, J.F.; Yuan, F.P.; Zhu, Y.T. Synergetic strengthening by gradient structure. Mater. Res. Lett. 2014, 2, 185–191. [Google Scholar] [CrossRef]
- Moering, J.; Ma, X.; Malkin, J.; Yang, M.; Zhu, Y.; Mathaudhu, S. Synergetic strengthening far beyond rule of mixtures in gradient structured aluminum rod. Scr. Mater. 2016, 122, 106–109. [Google Scholar] [CrossRef] [Green Version]
- Huang, H.W.; Wang, Z.B.; Lu, J.; Lu, K. Fatigue behaviors of AISI 316L stainless steel with a gradient nanostructured surface layer. Acta Mater. 2015, 87, 150–160. [Google Scholar] [CrossRef]
- Lei, Y.; Xu, J.; Wang, Z. Controllable martensite transformation and strain-controlled fatigue behavior of a gradient nanostructured austenite stainless steel. Nanomaterials 2021, 11, 1870. [Google Scholar] [CrossRef] [PubMed]
- Li, W.L.; Tao, N.R.; Lu, K. Fabrication of a gradient nano-micro-structured surface layer on bulk copper by means of a surface mechanical grinding treatment. Scr. Mater. 2008, 59, 546–549. [Google Scholar] [CrossRef]
- Xu, W.; Liu, X.C.; Lu, K. Strain-induced microstructure refinement in pure Al below 100 nm in size. Acta Mater. 2018, 152, 138–147. [Google Scholar] [CrossRef]
- Kang, J.Y.; Kim, J.G.; Park, H.W.; Kim, H.S. Multiscale architectured materials with composition and grain size gradients manufactured using high-pressure torsion. Sci. Rep. 2016, 6, 26590. [Google Scholar] [CrossRef] [PubMed] [Green Version]
- Suwas, S.; Mondal, S. Texture evolution in severe plastic deformation processes. Mater. Trans. 2019, 60, 1457–1471. [Google Scholar] [CrossRef] [Green Version]
- Kobaissy, A.A.H.; Ayoub, G.; Nasim, W.; Malik, J.; Karaman, I.; Shehadeh, M. Modeling of the ECAP Induced Strain Hardening Behavior in FCC Metals. Metall. Mater. Trans. A Phys. Metall. Mater. Sci. 2020, 51, 5453–5474. [Google Scholar] [CrossRef]
- Moering, J.; Ma, X.; Chen, G.; Miao, P.; Li, G.; Qian, G.; Mathaudhu, S.; Zhu, Y. The role of shear strain on texture and microstructural gradients in low carbon steel processed by Surface Mechanical Attrition Treatment. Scr. Mater. 2015, 108, 100–103. [Google Scholar] [CrossRef] [Green Version]
- Chen, X.; Zhang, B.; Zou, Q.; Huang, G.; Liu, S.; Zhang, J.; Tang, A.; Jiang, B.; Pan, F. Design of pure aluminum laminates with heterostructures for extraordinary strength-ductility synergy. J. Mater. Sci. Technol. 2022, 100, 193–205. [Google Scholar] [CrossRef]
- Wang, X.; Xiao, Z.; Meng, X.P.; Yi, Y.H.; Chen, L. Microstructure and properties evolution of Cu-Ti-Cr-Mg alloy during equal channel angular pressing at room temperature and cryogenic temperature. J. Alloys Compd. 2022, 927, 166940. [Google Scholar] [CrossRef]
- Li, R.; Xiao, Z.; Li, Z.; Meng, X.; Wang, X. Work Hardening Behavior and Microstructure Evolution of a Cu-Ti-Cr-Mg Alloy during Room Temperature and Cryogenic Rolling. Materials 2023, 16, 424. [Google Scholar] [CrossRef] [PubMed]
- Tang, W.; Li, D.; Huang, S.; Zhang, S.; Peng, Y. Simulation of texture evolution in magnesium alloy: Comparisons of different polycrystal plasticity modeling approaches. Comput. Struct. 2014, 143, 1–8. [Google Scholar] [CrossRef]
- Liang, Y.; He, Q.; Jiang, S.; Zhao, C. Investigation on Texture Evolution Mechanism of NiTiFe Shape Memory Alloy Under Plane Strain Compression. Met. Mater. Int. 2021, 27, 4047–4058. [Google Scholar] [CrossRef]
- Liu, L.Y.; Yang, Q.S.; Liu, X.; Nian, X.C. Crystal cracking of grain-gradient aluminum by a combined CPFEM-CZM method. Eng. Fract. Mech. 2021, 242, 107507. [Google Scholar] [CrossRef]
- Lebensohn, R.A.; Tomé, C.N. A self-consistent anisotropic approach for the simulation of plastic deformation and texture development of polycrystals: Application to zirconium alloys. Acta Metall. Mater. 1993, 41, 2611–2624. [Google Scholar] [CrossRef]
- Lyu, H.; Ruimi, A. Understanding the Plastic Deformation of Gradient Interstitial Free (IF) Steel under Uniaxial Loading Using a Dislocation-Based Multiscale Approach. Crystals 2022, 12, 889. [Google Scholar] [CrossRef]
- Kermanshahimonfared, N.; Askari, H.; Mastorakos, I. Plastic Behavior of Aluminum and Dislocation Patterning Based on Continuum Dislocation Dynamic (CDD). Metall. Mater. Trans. A Phys. Metall. Mater. Sci. 2020, 51, 400–409. [Google Scholar] [CrossRef]
- Zecevic, M.; Knezevic, M. A dislocation density based elasto-plastic self-consistent model for the prediction of cyclic deformation: Application to AA6022-T4. Int. J. Plast. 2015, 72, 200–217. [Google Scholar] [CrossRef] [Green Version]
- Hou, Y.N.; Yang, K.M.; Song, J.; Wang, H.; Liu, Y.; Fan, T.X. A crystal plasticity model for metal matrix composites considering thermal mismatch stress induced dislocations and twins. Sci. Rep. 2021, 11, 16053. [Google Scholar] [CrossRef]
- Nye, J.F. Some geometrical relations in dislocated crystals. Acta Metall. 1953, 1, 153–162. [Google Scholar] [CrossRef]
- Ashby, M.F. The deformation of plastically non-homogeneous materials. Philos. Mag. 1969, 21, 37–41. [Google Scholar] [CrossRef]
- Li, J.; Weng, G.J.; Chen, S.; Wu, X. On strain hardening mechanism in gradient nanostructures. Int. J. Plast. 2017, 88, 89–107. [Google Scholar] [CrossRef] [Green Version]
- Cheng, Z.; Bu, L.; Zhang, Y.; Wu, H.A.; Zhu, T.; Lu, L. Characterization of gradient plastic deformation in gradient nanotwinned Cu. Acta Mater. 2023, 246, 118673. [Google Scholar] [CrossRef]
- Foley, D.L.; Latypov, M.I.; Zhao, X.; Hestroffer, J.; Beyerlein, I.J.; Lamberson, L.E.; Taheri, M.L. Geometrically necessary dislocation density evolution as a function of microstructure and strain rate. Mater. Sci. Eng. A 2022, 831, 142224. [Google Scholar] [CrossRef]
- Hirth, J.P. Dislocation pileups in the presence of stress gradients. Philos. Mag. 2006, 86, 3959–3963. [Google Scholar] [CrossRef]
- Liu, D.; He, Y.; Zhang, B.; Shen, L. A continuum theory of stress gradient plasticity based on the dislocation pile-up model. Acta Mater. 2014, 80, 350–364. [Google Scholar] [CrossRef]
- Taheri-Nassaj, N.; Zbib, H.M. On dislocation pileups and stress-gradient dependent plastic flow. Int. J. Plast. 2015, 74, 1–16. [Google Scholar] [CrossRef]
- Paul, S.; Freed, A.D. A constitutive model for elastic–plastic materials using scalar conjugate stress/strain base pairs. J. Mech. Phys. Solids 2021, 155, 104535. [Google Scholar] [CrossRef]
- Lyu, H.; Hamid, M.; Ruimi, A.; Zbib, H.M. Stress/strain gradient plasticity model for size effects in heterogeneous nano-microstructures. Int. J. Plast. 2017, 97, 46–63. [Google Scholar] [CrossRef]
- Lyu, H.; Zhang, Y.; Li, H. The Effect of Grain Size Gradient on Plastic Deformation of Gradient Aluminum. Metall. Mater. Trans. A Phys. Metall. Mater. Sci. 2022, 53, 3428–3440. [Google Scholar] [CrossRef]
- Bailey, J.E.; Hirsch, P.B. The dislocation distribution, flow stress, and stored energy in cold-worked polycrystalline silver. Philos. Mag. 1960, 5, 485–497. [Google Scholar] [CrossRef]
- Ohashi, T. Numerical modelling of plastic multislip in metal crystals of F.C.C. type. Philos. Mag. A 1994, 70, 793–803. [Google Scholar] [CrossRef]
- Li, D.; Zbib, H.; Sun, X.; Khaleel, M. Predicting plastic flow and irradiation hardening of iron single crystal with mechanism-based continuum dislocation dynamics. Int. J. Plast. 2014, 52, 3–17. [Google Scholar] [CrossRef]
- Lyu, H.; Ruimi, A.; Field, D.P.; Zbib, H.M. Plasticity in Materials with Heterogeneous Microstructures. Metall. Mater. Trans. A Phys. Metall. Mater. Sci. 2016, 47, 6608–6620. [Google Scholar] [CrossRef]
- Eshelby, J.D. The determination of the elastic field of an ellipsoidal inclusion, and related problems. Proc. R. Soc. Lond. Ser. A Math. Phys. Sci. 1957, 241, 376–396. [Google Scholar] [CrossRef]
- Tóth, L.S.; Neale, K.W.; Jonas, J.J. Stress response and persistence characteristics of the ideal orientations of shear textures. Acta Metall. 1989, 37, 2197–2210. [Google Scholar] [CrossRef]
- Lyu, H.; Taheri-Nassaj, N.; Zbib, H.M. A multiscale gradient-dependent plasticity model for size effects. Philos. Mag. 2016, 96, 1883–1908. [Google Scholar] [CrossRef]
- Kuang, J.; Zhao, X.; Du, X.; Zhang, J.; Liu, G.; Sun, J.; Xu, G.; Wang, Z. Ductilizing Al-Mn strips via gradient texture. Mater. Res. Lett. 2023, 11, 430–438. [Google Scholar] [CrossRef]
- Hamid, M.; Lyu, H.; Schuessler, B.J.; Wo, P.C.; Zbib, H.M. Modeling and characterization of grain boundaries and slip transmission in dislocation density-based crystal plasticity. Crystals 2017, 7, 152. [Google Scholar] [CrossRef] [Green Version]
- Shi, J.; Zikry, M.A. Modeling of grain boundary transmission, emission, absorption and overall crystalline behavior in ω1, ω3, and ω17b bicrystals. J. Mater. Res. 2011, 26, 1676–1687. [Google Scholar] [CrossRef]
- Bachmann, F.; Hielscher, R.; Schaeben, H. Texture analysis with MTEX- Free and open source software toolbox. Solid State Phenom. 2010, 160, 63–68. [Google Scholar] [CrossRef] [Green Version]


| Shear Texture | {hkl}<uvw> | |||
|---|---|---|---|---|
| A1 | <110> | 0 | 35.26 | 45 |
| A2 | <> | 180 | 35.26 | 45 |
| A3 | <112> | 35.37 | 45 | 0 |
| 125.37 | 90 | 0 | ||
| A4 | <112> | 144.74 | 45 | 0 |
| 54.74 | 90 | 45 | ||
| B1 | <110> | 0 | 54.74 | 45 |
| 120 | 54.47 | 45 | ||
| B2 | <> | 60 | 54.74 | 45 |
| 180 | 54.74 | 45 | ||
| C | <110> | 90 | 45 | 0 |
| 0 | 90 | 45 | ||
| Symbol | Aluminum (Unit) |
|---|---|
| c* (Bailey–Hirsch hardening coefficient) | 0.35 |
| (internal friction) | 4.5 MPa |
| (elasticity constant) | 108.6 GPa |
| (elasticity constant) | 61.3 GPa |
| (elasticity constant) | 112 GPa |
| (shear modulus) | 28.5 GPa |
| (Hall–Petch constant) | 0.047 MPa/mm−1/2 |
| (reference strain rate) | m/s |
| (strain rate sensitivity) | 0.05 |
| (magnitude of Burgers vector) | 2.86 Å |
| (critical radius for annihilation coefficient) | 15 |
| 0.0325, 2.0, 0.002, 0.002, 0.001, 0.002, 0.1 | |
| (average mobile and immobile dislocation density) | , |
Disclaimer/Publisher’s Note: The statements, opinions and data contained in all publications are solely those of the individual author(s) and contributor(s) and not of MDPI and/or the editor(s). MDPI and/or the editor(s) disclaim responsibility for any injury to people or property resulting from any ideas, methods, instructions or products referred to in the content. |
© 2023 by the authors. Licensee MDPI, Basel, Switzerland. This article is an open access article distributed under the terms and conditions of the Creative Commons Attribution (CC BY) license (https://creativecommons.org/licenses/by/4.0/).
Share and Cite
Lyu, H.; Zhang, Y.; Bao, Y.; Zhang, J. The Effect of Initial Texture on the Plastic Deformation of Gradient Aluminum. Materials 2023, 16, 2603. https://doi.org/10.3390/ma16072603
Lyu H, Zhang Y, Bao Y, Zhang J. The Effect of Initial Texture on the Plastic Deformation of Gradient Aluminum. Materials. 2023; 16(7):2603. https://doi.org/10.3390/ma16072603
Chicago/Turabian StyleLyu, Hao, Yaxin Zhang, Yuan Bao, and Jiahui Zhang. 2023. "The Effect of Initial Texture on the Plastic Deformation of Gradient Aluminum" Materials 16, no. 7: 2603. https://doi.org/10.3390/ma16072603