Article

Structural and Thermoelectric Properties of Gd2−2xSr1+2xMn2O7 Double-Layered Manganites

1
School of Resources, Environment and Materials, Guangxi University, Nanning 530004, China
2
State Key Laboratory of Featured Metal Materials and Life-Cycle Safety for Composite Structures, Nanning 530004, China
*
Author to whom correspondence should be addressed.
Materials 2023, 16(7), 2548; https://doi.org/10.3390/ma16072548
Submission received: 5 March 2023 / Revised: 16 March 2023 / Accepted: 20 March 2023 / Published: 23 March 2023

Abstract

:
Double-layered manganites are natural superlattices with low thermal conductivity, which is of importance for potential thermoelectric applications. The Gd2−2xSr1+2xMn2O7 (x = 0.5; 0.625; 0.75) were prepared by the solid-state reaction method. All the samples crystallize in the tetragonal I4/mmm Sr3Ti2O7 type structure. The unit cell volume and the distortion in the MnO6 octahedra increase with increasing Gd content. Their thermoelectric properties were investigated between 300 and 1200 K. All exhibit an n-type semiconducting behavior. The electrical conductivity (σ) increases while the absolute value of the Seebeck coefficient (|S|) decreases with increasing Gd content. Simultaneous increases in σ and |S| with increasing temperature are observed at temperatures approximately higher than 600 K, and the power factor reaches a maximum value of 18.36 μW/(m K²) for x = 0.75 at 1200 K. The thermal conductivity (κ) is lower than 2 W/(m K) over the temperature range of 300–1000 K for all the samples and a maximum dimensionless figure of merit ZT of 0.01 is obtained for x = 0.75 at 1000 K.

1. Introduction

Since the report of the layered NaCo2O4 showing good thermoelectric (TE) performance with a large Seebeck coefficient of 100 μV/K at 300 K [1], there has been increasing interest in exploring new oxide TE materials in the last two decades because of their high chemical and thermal stability at high temperature, low toxicity, and relatively low-cost starting materials [2,3]. TE materials enable the direct conversion of thermal into electricity and are useful for manufacturing TE devices for power generation from waste heat. The efficiency of a TE material is mainly determined by the dimensionless figure of merit ZT, which is a product of the TE figure of merit Z and the absolute temperature T, given by ZT = S2σT/κ, where S, σ, κ, and T are the Seebeck coefficient, electrical conductivity, thermal conductivity, and absolute temperature, respectively. A good TE material requires large S, high σ, and low κ. As these three parameters are strongly coupled, depending on the carrier concentration and electronic structure, and there is a trade-off between S and σ, it is difficult to enhance them simultaneously. The power factor PF, defined as S2σ, is related to the electrical properties of a material. Whilst the performance of most TE oxides is limited by their low ZT values due to low PF and high κ, several layer-structured oxides show outstanding TE properties, such as p-type layered cobaltites Ca3Co4O9 and BiCuSeO, and n-type perovskite oxides CaMnO3 manganates and SrTiO3 titanates [2,3,4]. Methods to enhance ZT mostly include doping, carrier engineering, defect chemistry engineering, nanostructuring/nanocomposites, band engineering, etc., aiming to improve PF and reduce κ [2,3,5,6,7].
The Ruddlesden–Popper (RP) compounds with a general formula Am+1BmO3m+1 (A = rare earth (RE) and/or alkaline earth elements and B = transition metals) or AO(ABO3)m have a natural superlattice structure consisting of an alternate stacking of multiple (m) perovskite structure BO2 layers and a single rock-salt A2O2 layer along the c axis direction [8]. The double-layered oxides A3B2O7 belong to the m = 2 member and the perovskites ABO3 correspond to the m = ∞ member of the RP family. The layered structure of the RP compounds would enhance the phonon scattering at the interfaces between the A2O2 layer and perovskite layer and consequently reduce κ, which is of great importance for TE materials. Investigation on thermal conductivity in the thin films of the m = 1–5 and 10 members of the (SrTiO3)mSrO RP superlattices showed that the m = 2 member had the lowest κ in this RP homologous series [9]. Significant reduction of κ values was observed in the layered (Sr1−xREx)m+1TimO3m+1 (m = 1, 2) [10] and La2−2xCa1+2xMn2O7 (0.75 ≤ x ≤ 1.0) [11] due to the intrinsic superlattice structure as compared to their perovskite phases. It is desired for a TE material that good electron transport properties PF would be kept while κ is reduced. The structure of the RP oxides allows compositional tailoring, and the TE properties of n-type CaMnO3 and SrTiO3 can be improved by substitution at either the A or B sites. It has been found that RE element doping at Ca sites of CaMnO3 is an effective way to increase σ while keeping a moderate absolute S [6,12]. Studies of the effects of various RE3+ ions doping at Sr sites of (Sr0.95RE0.05)3Ti2O7 oxides on their TE properties indicated that the maximum ZT was obtained in Gd-doped (Sr0.95Gd0.05)3Ti2O7 mainly owing to its lower κ [13] or enhanced S [14].
The double-layered manganites RE2−2xSr1+2xMn2O7 are of significant interest due to the effect of colossal magnetoresistance (CMR) and intensive studies have been focused on their magnetic and magneto-transport properties [15,16,17,18,19,20,21]. However, works on the high-temperature TE properties of RE2−2xSr1+2xMn2O7 to take advantage of their intrinsic superlattice structures are very scarce. During the course of our systematic research on the phase diagram of the Gd–Sr–Co/Mn–O systems [22,23], a Gd2−2xSr1+2xMn2O7 solid solution was found. Our magnetic measurements of the Gd2−2xSr1+2xMn2O7 samples in the temperature range of 2–350 K under an applied magnetic field of 0.02 T show two ferromagnetic transitions, which is in analogy to the temperature-dependent magnetizations of La1.2Sr1.8Mn2O7 [24] and La1.4Sr1.6Mn2O7 [25]. In this paper, we report the structural and TE properties of double-layered manganites Gd2−2xSr1+2xMn2O7 (x = 0.5, 0.625, 0.75). Investigation on their TE properties revealed an n-type semiconducting behavior and a κ of lower than 2 W/(m K) over the temperature range of 300–1000 K. σ increases while the absolute value of S decreases with increasing Gd content.

2. Materials and Methods

Polycrystalline samples of Gd2−2xSr1+2xMn2O7 (x = 0.5, 0.625, 0.75) were prepared by the conventional solid-state reaction method in air. Gd2O3 (99.95%, Sinopharm, Beijing, China), SrCO3 (≥99.0%, Sinopharm, Beijing, China), and MnCO3 (99.95%, Aladdin, Shanghai, China) were used as starting materials. Gd2O3 and SrCO3 were dried at 773 K for 24 h, and MnCO3 at 373 K for 24 h prior to use. Stoichiometric amounts of the preheated powders were thoroughly mixed and ball-milled in anhydrous ethanol medium for 10 h in the agate grinding jars using a planetary ball mill (QM−3SP4, Nanjing, China). The resultant powders were calcined at 1123 K for 24 h in a muffle furnace. Subsequently, the calcined powders were reground, pressed into pellets with diameters of 15 mm and a thickness of ~4 mm or pressed into 20 mm long rectangular samples with widths of 4 mm and a thickness of ~3 mm, and sintered at 1673 K for 120 h.
Powder X-ray diffraction (XRD) data were collected on an x-ray diffractometer (Rigaku D/Max 2500V, Tokyo, Japan) using Cu radiation over the angular range of 10° to 110° 2θ, with a step size of 0.02°. The XRD data were analyzed with the Rietveld method using the Fullprof program [26]. The microstructure of the sintered samples was examined by a field emission scanning electron microscope (FE-SEM, Hitachi SU8020, Tokyo, Japan) using the secondary electron (SE) mode. The chemical compositions of the samples were determined by the equipped energy-dispersive X-ray spectrometer (EDS, Oxford X-MAX80, Oxford, UK). Specimens for the measurements of σ and S were prepared by grinding and polishing the sintered rectangular samples into a typical dimension of 3.9 mm × 2.0 mm × 19.0 mm. All the surfaces of the specimens were carefully polished with SiC emery papers before measurement to ensure parallel ends. The temperature dependences of σ and S were measured on a multifunctional thermoelectric materials measurement system (Advance Riko ZEM-3M10, Yokohama, Japan) in the temperature range of 300–1200 K in a helium atmosphere. The specimen was placed vertically between the upper and lower Pt block electrodes in the infrared heating furnace, and two probes of the thermocouple were adjusted to attach to the longitudinal side of the specimen. V-I plot measurement was carried out to check whether the specimen was well contacted with the probes before the simultaneous measurements of σ and S. The thermal conductivity κ was calculated using the relationship κ = DCpd, where D is the thermal diffusivity, CP is the specific heat capacity and d is the bulk density. D was measured using the laser flash method (NETZSCH LFA 457, Selb, Germany) on disc specimens with diameters of 12.7 mm and a typical thickness of 1.5 mm. CP was measured using differential scanning calorimetry (NETZSCH STA 449 F3, Selb, Germany) under an argon atmosphere up to 1000 K. The bulk density d of the sintered discs was determined by Archimedes’ method (Shimadzu AUW220D, Kyoto, Japan).

3. Results and Discussion

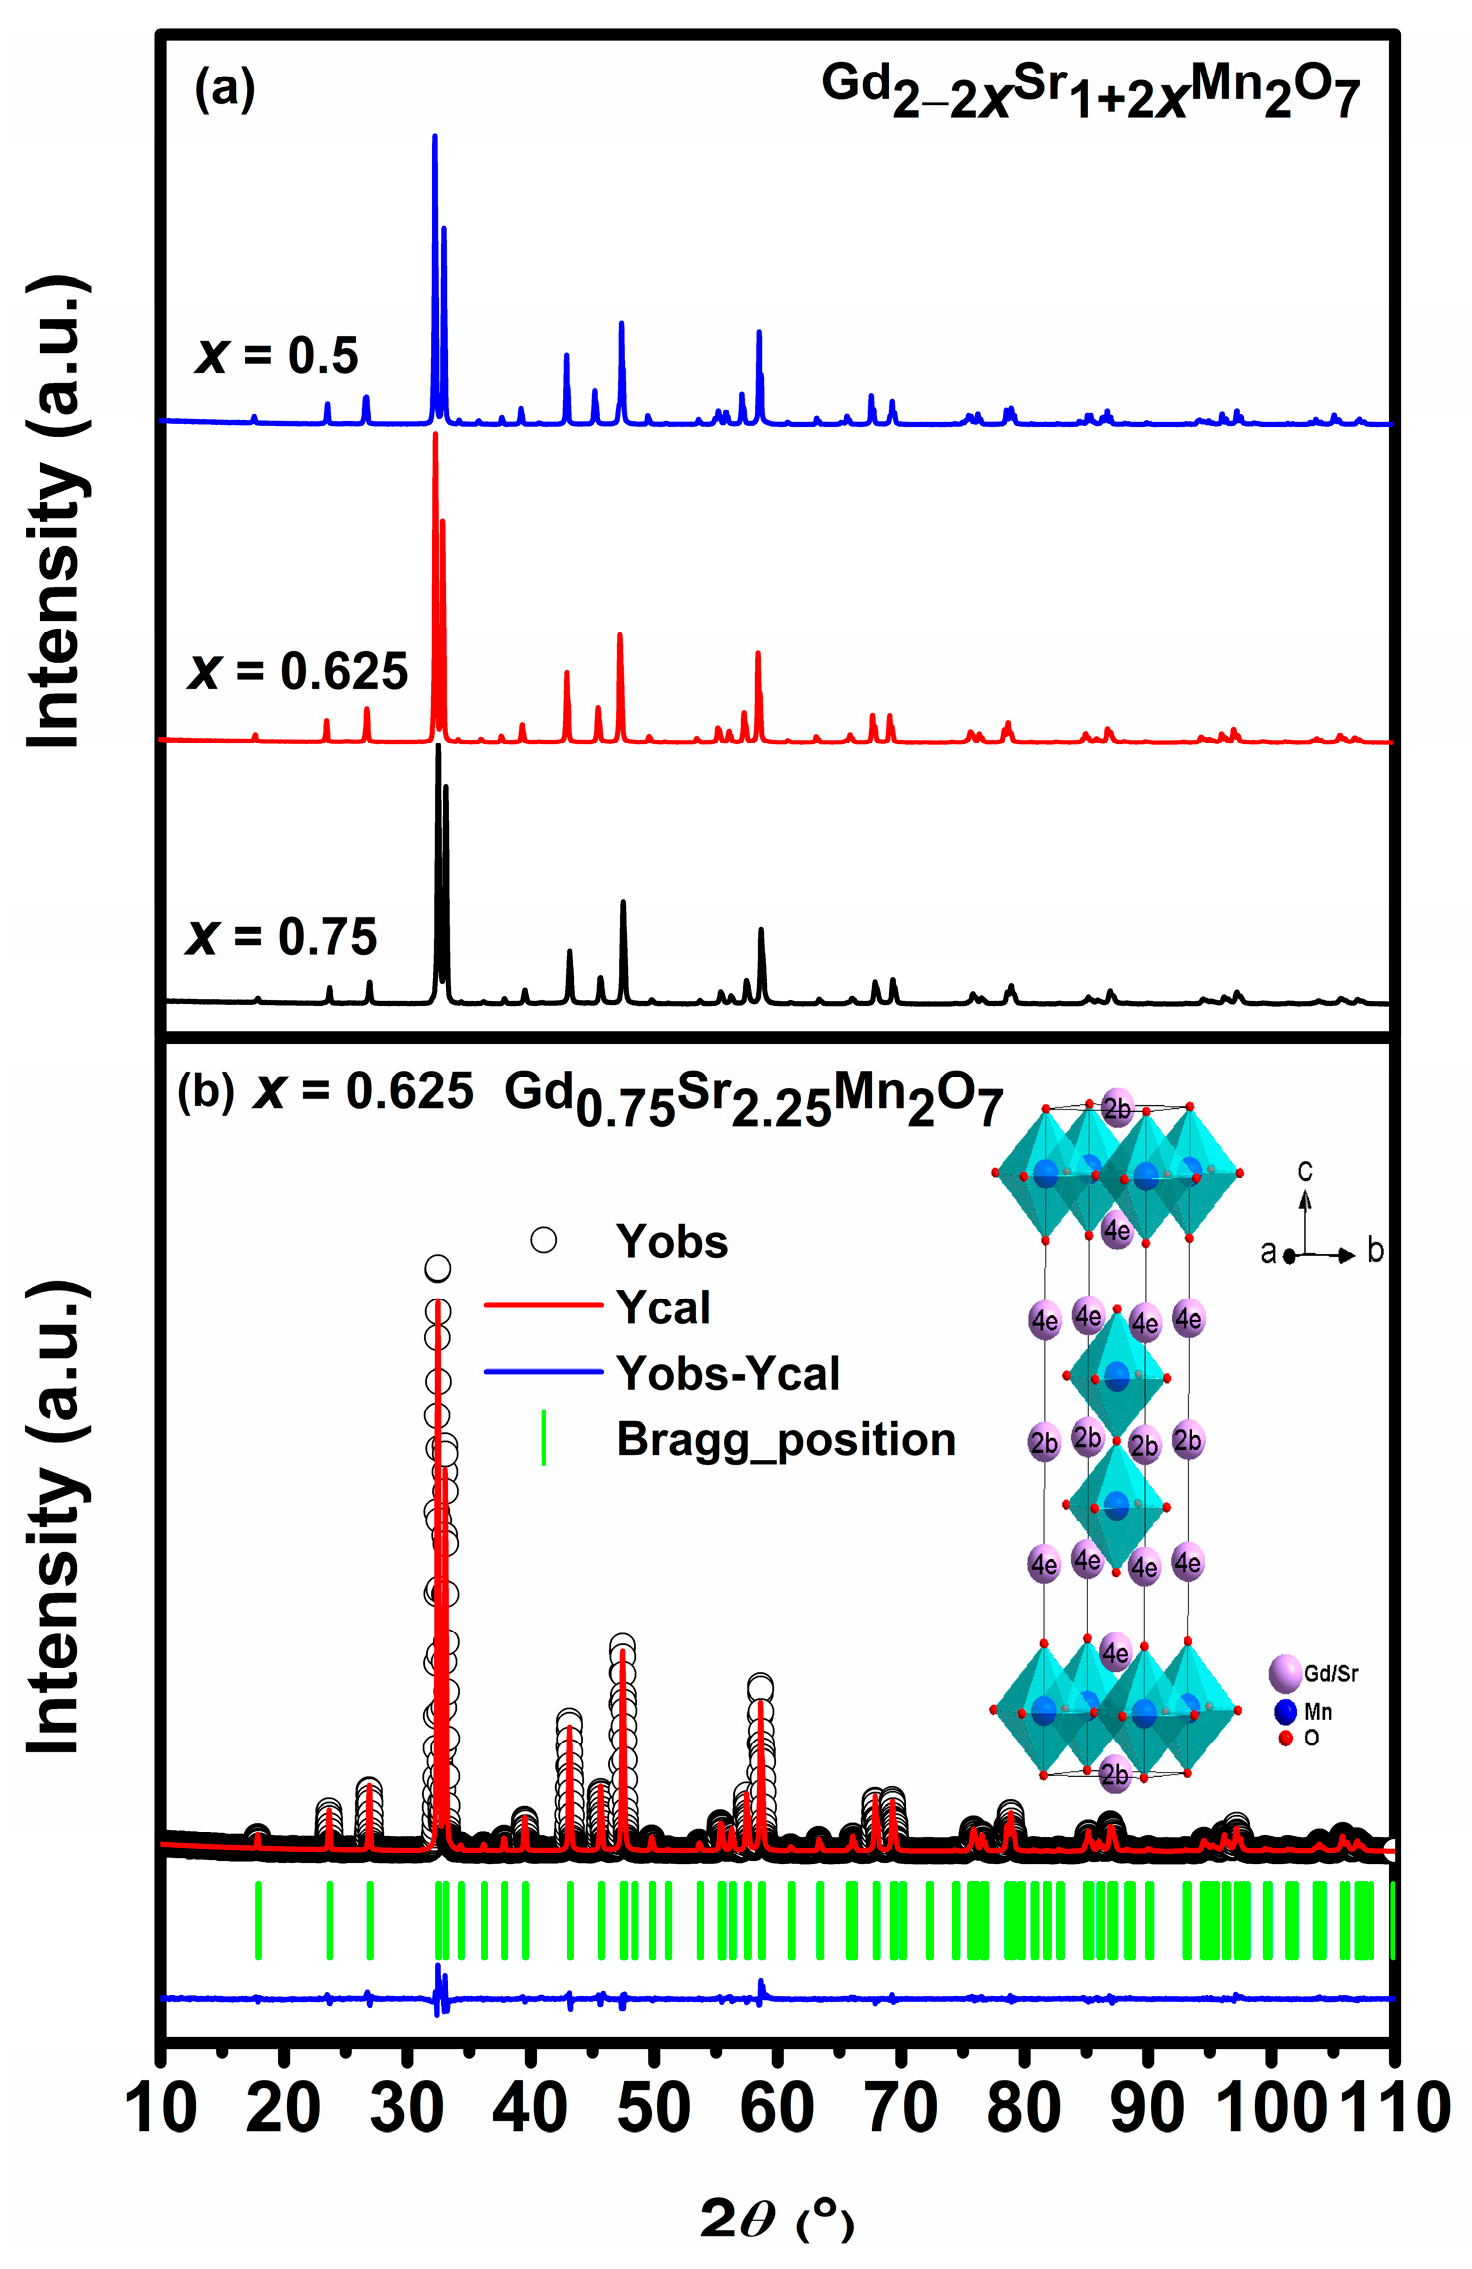
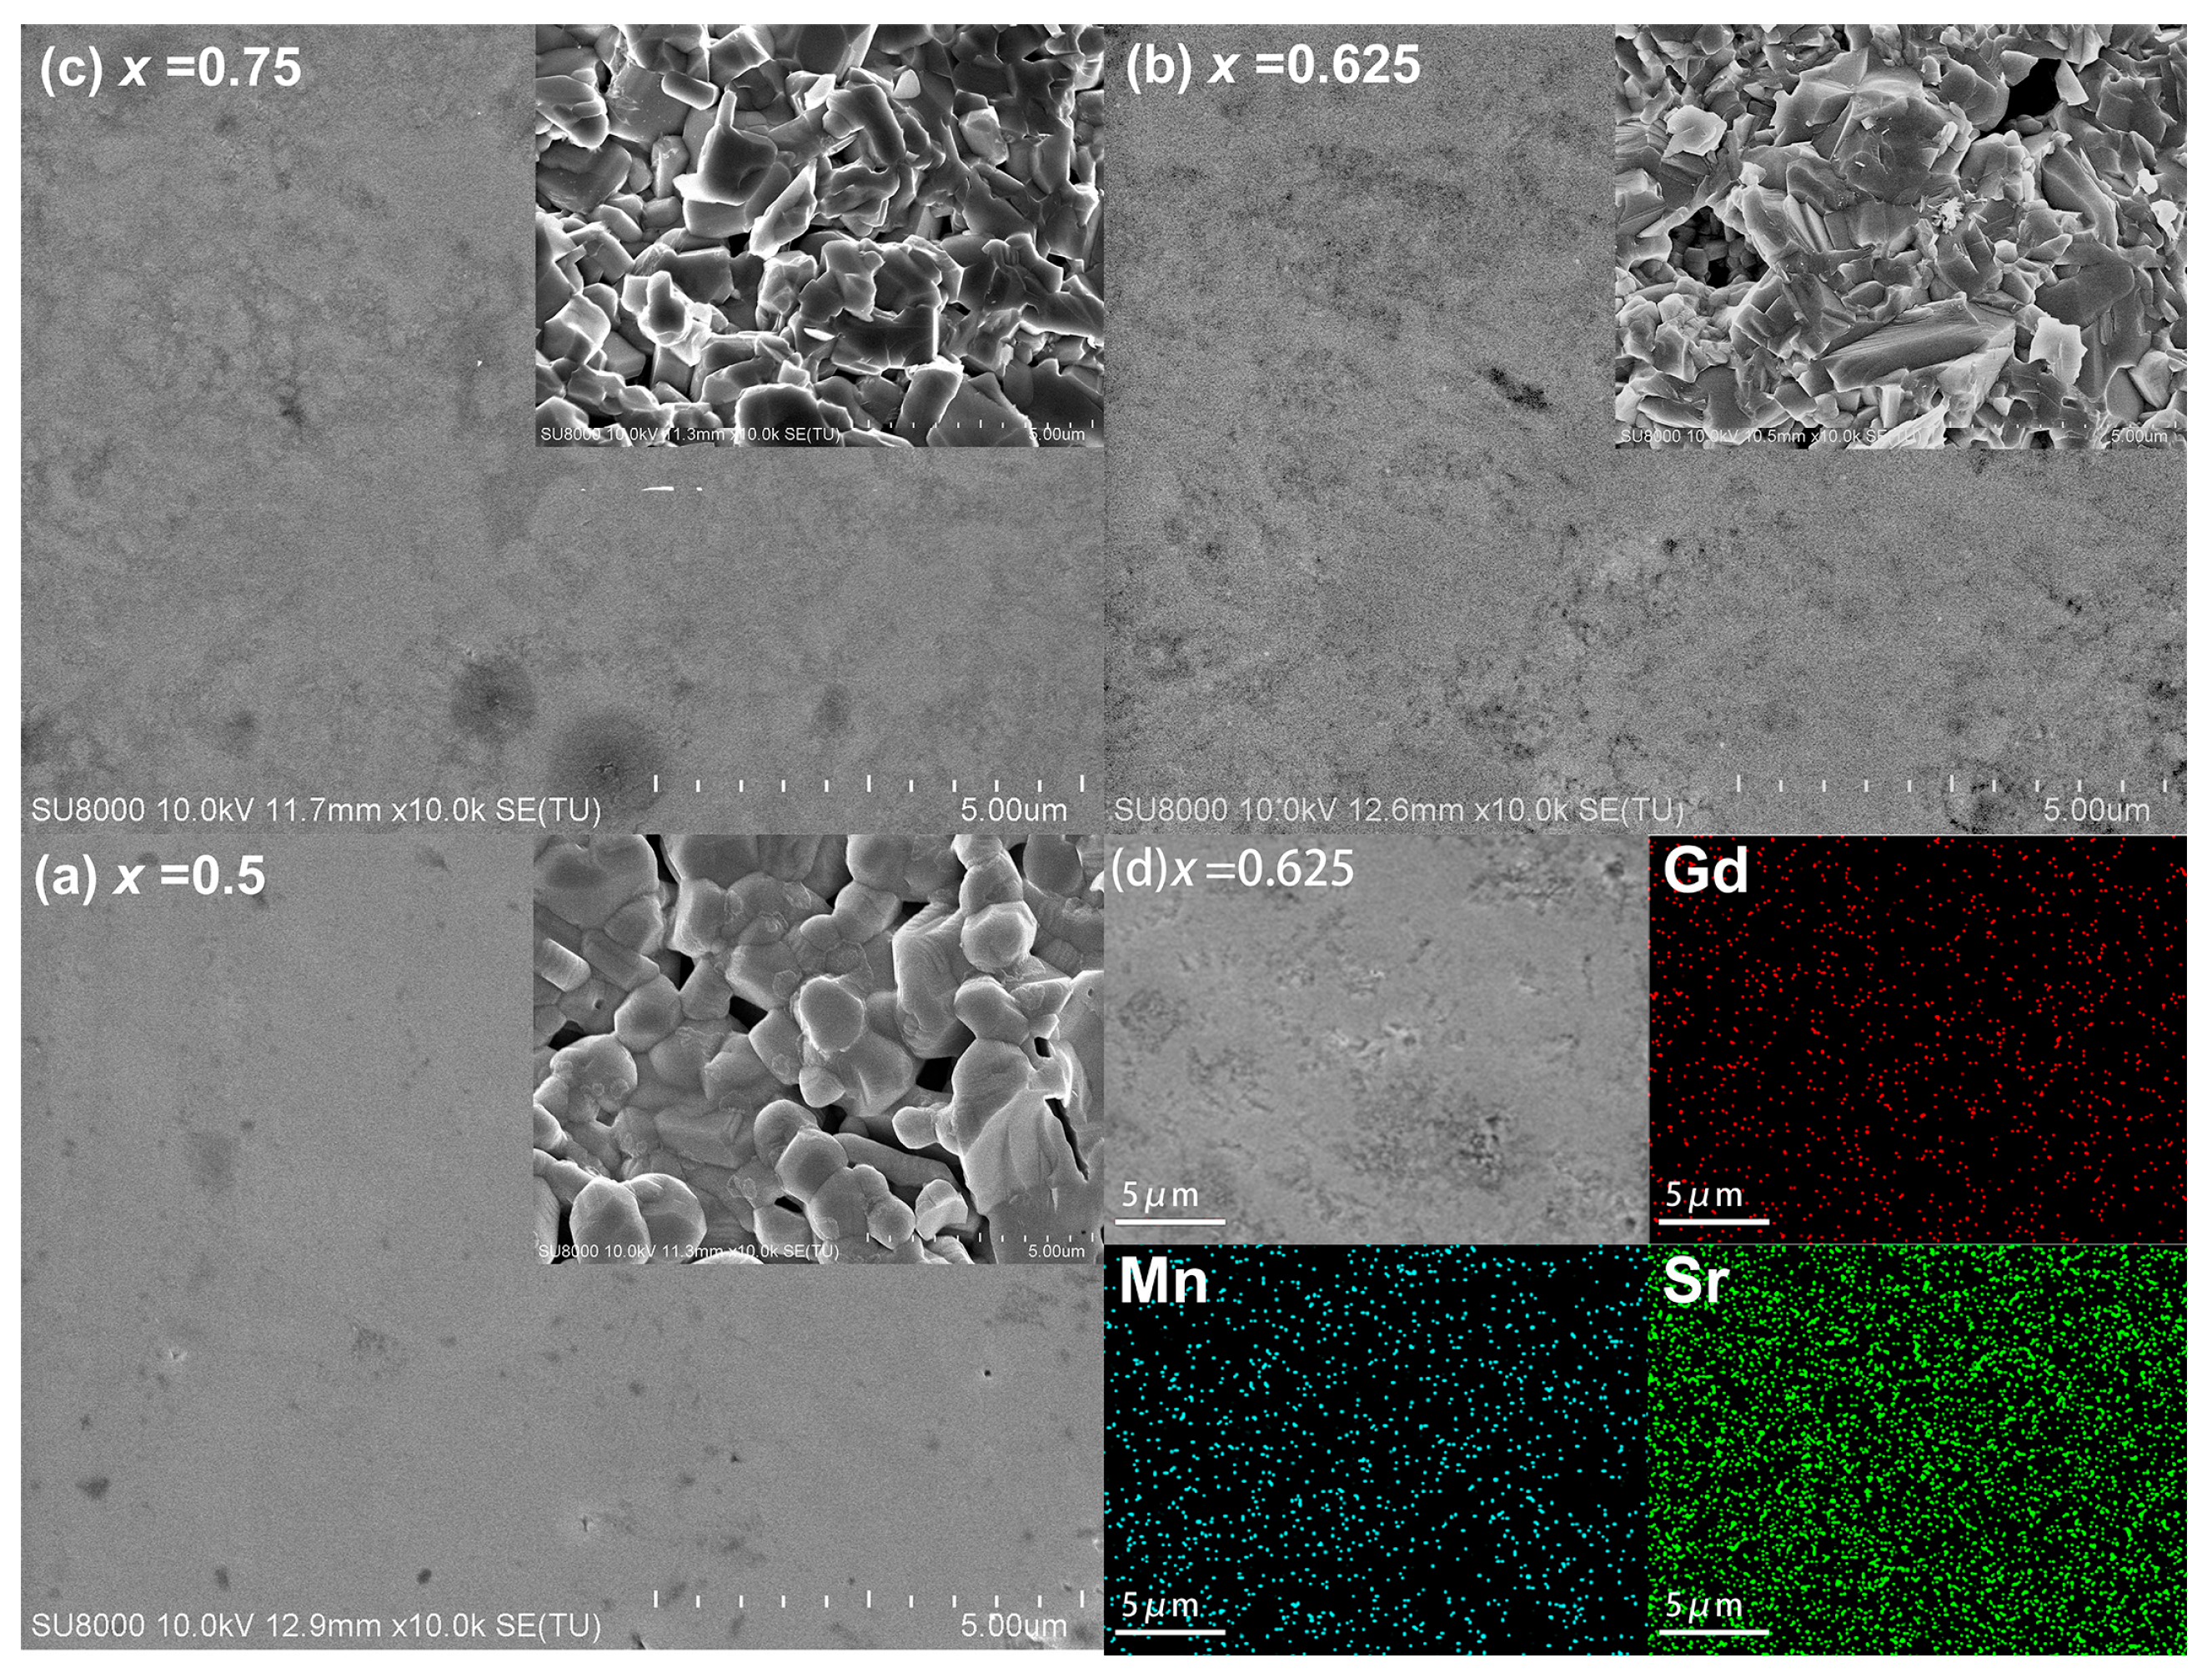
3.1. Structural and Morphological Analysis

Figure 1a shows the powder XRD patterns of Gd2−2xSr1+2xMn2O7 (x = 0.5, 0.625, 0.75). All the diffraction peaks can be indexed in a tetragonal Sr3Ti2O7 type structure with space group I4/mmm (No. 139). A typical Rietveld refinement pattern and the crystal structure for the sample x = 0.625 are demonstrated in Figure 1b. As seen from the structure, two stacked MnO2 layers (i.e., double perovskite layers) form the quasi-two-dimensional (2D) magnetic layer (called bilayer). Two adjacent MnO2 bilayers are separated by the (Gd, Sr)2O2 rock salt layers. The refined structural parameters, theoretical density (ρx), selected bond lengths, and reliability factors for Gd2−2xSr1+2xMn2O7 are summarized in Table 1. The measured bulk density d of the sintered samples and the relative density (% T. D.) are also given in Table 1. The relative density for all the samples is about 94%, indicating that the samples are of similar compactness.
According to the analysis from the neutron powder diffraction data [27], the Sr/RE ions occupy two Wyckoff sites, i.e., 2b (0, 0, 1/2) site in the 12-coordinate perovskite-like block and 4e (0, 0, z) site in the 9-coordinate rock salt layer. As seen in Figure 1b, each Gd3+/Sr2+ ion is labeled by 2b or 4e to indicate its atomic Wyckoff position. Smaller RE ions such as Gd3+, Tb3+, Dy3+, etc., were found to prefer the 4e site [27]. Refinements on the occupancies of Gd3+/Sr2+ ions showed that they co-occupied the 2b and 4e sites with a higher occupation of Gd3+ ions at the 4e sites. The refined occupancies of Gd3+/Sr2+ ions are given in Table 1. This is in agreement with the results of the refinement of DySr2Mn2O7 [27] and (Sr0.95RE0.05)3Ti2O7 [14]. This preferential occupation of RE3+ ions at the 4e sites might be due to the smaller ionic radius differences between RE3+ ions and 9-coordinate Sr2+ (r = 1.31Å, coordination number (CN) = 9) as compared to 12-coordinate Sr2+ (r = 1.44Å, CN = 12) [14]. With increasing Gd content, the unit cell volume increases while the unit cell parameter a first increases and then decreases, and c shows the opposite variation with a. These size variations have been found for Nd0.2La1.8−2xSr1+2xMn2O7 (0.3 ≤ x ≤ 0.7) [28], and can be attributed to the simultaneous occurrence of the substitution of Sr2+ (r = 1.31Å, CN = 9) ions with smaller Gd3+ ions (r = 1.107Å, CN = 9) and the conversion of Mn4+ (r = 0.53 Å, CN = 6) to larger Mn3+ (high spin, r = 0.645 Å, CN = 6) to maintain charge neutrality. It is therefore expected that the increasing amount of the Jahn–Teller active Mn3+ ions would lead to a stronger MnO6 octahedral distortion with increasing Gd content in Gd2−2xSr1+2xMn2O7. The tolerance factor t describes the structural distortion, defined as t = r A + r O / 2 r B + r O , where r O is the ionic radius of the O ion and r A and r B are the mean radii of the ions at the A and B sites, respectively. With increasing Gd content, r A decreases and r B increases, a decreasing t is then obtained which confirms the enhancement of the structural distortion. Accordingly, the bond lengths of the apical Mn–O1 bonds (Mn to the apical oxygen atom O1 shared between the two MnO2 layers within a bilayer) and the in-plane Mn–O3 bonds (Mn to the equatorial oxygen atom O3 in the MnO2 layers) vary oppositely, with the Mn–O1 bonds along the c axis showing a larger extent of variation. The bond lengths of the apical Mn–O2 bonds (Mn to the apical oxygen atom O2 in the (Gd/Sr)2O2 rock-salt layers) are longer than those of the apical Mn–O1 and in-plane Mn–O3 bonds, and are elongated with increasing Gd content, which indicates the enlargement of the interlayer Mn–Mn distances.
Figure 2a–c presents the FE-SEM polished surface micrographs of sintered pellets of Gd2−2xSr1+2xMn2O7 (x = 0.5, 0.625, 0.75) samples. The insets of Figure 2a–c are the fractured surface micrographs. Samples x = 0.625 and x = 0.75 show similar polished surface morphologies, with an uneven surface and opened pores. It is evident from the insets that the fractured morphology evolves from slightly aggregated spherical shape grains for x = 0.5 to lath-like or even flake-shaped grains for x = 0.625 and x = 0.75, respectively. The fractured morphologies of all the samples show a dense structure, which is consistent with the relative density of 94% obtained from Archimedes’ method (Table 1). Figure 2d shows the EDS mapping images of the cations for x = 0.625, indicating homogeneous distributions of the elements Gd, Sr, and Mn. The compositions measured by EDS are given in Table 2. It is shown that the molar ratios of the cations correspond well to the nominal compositions.

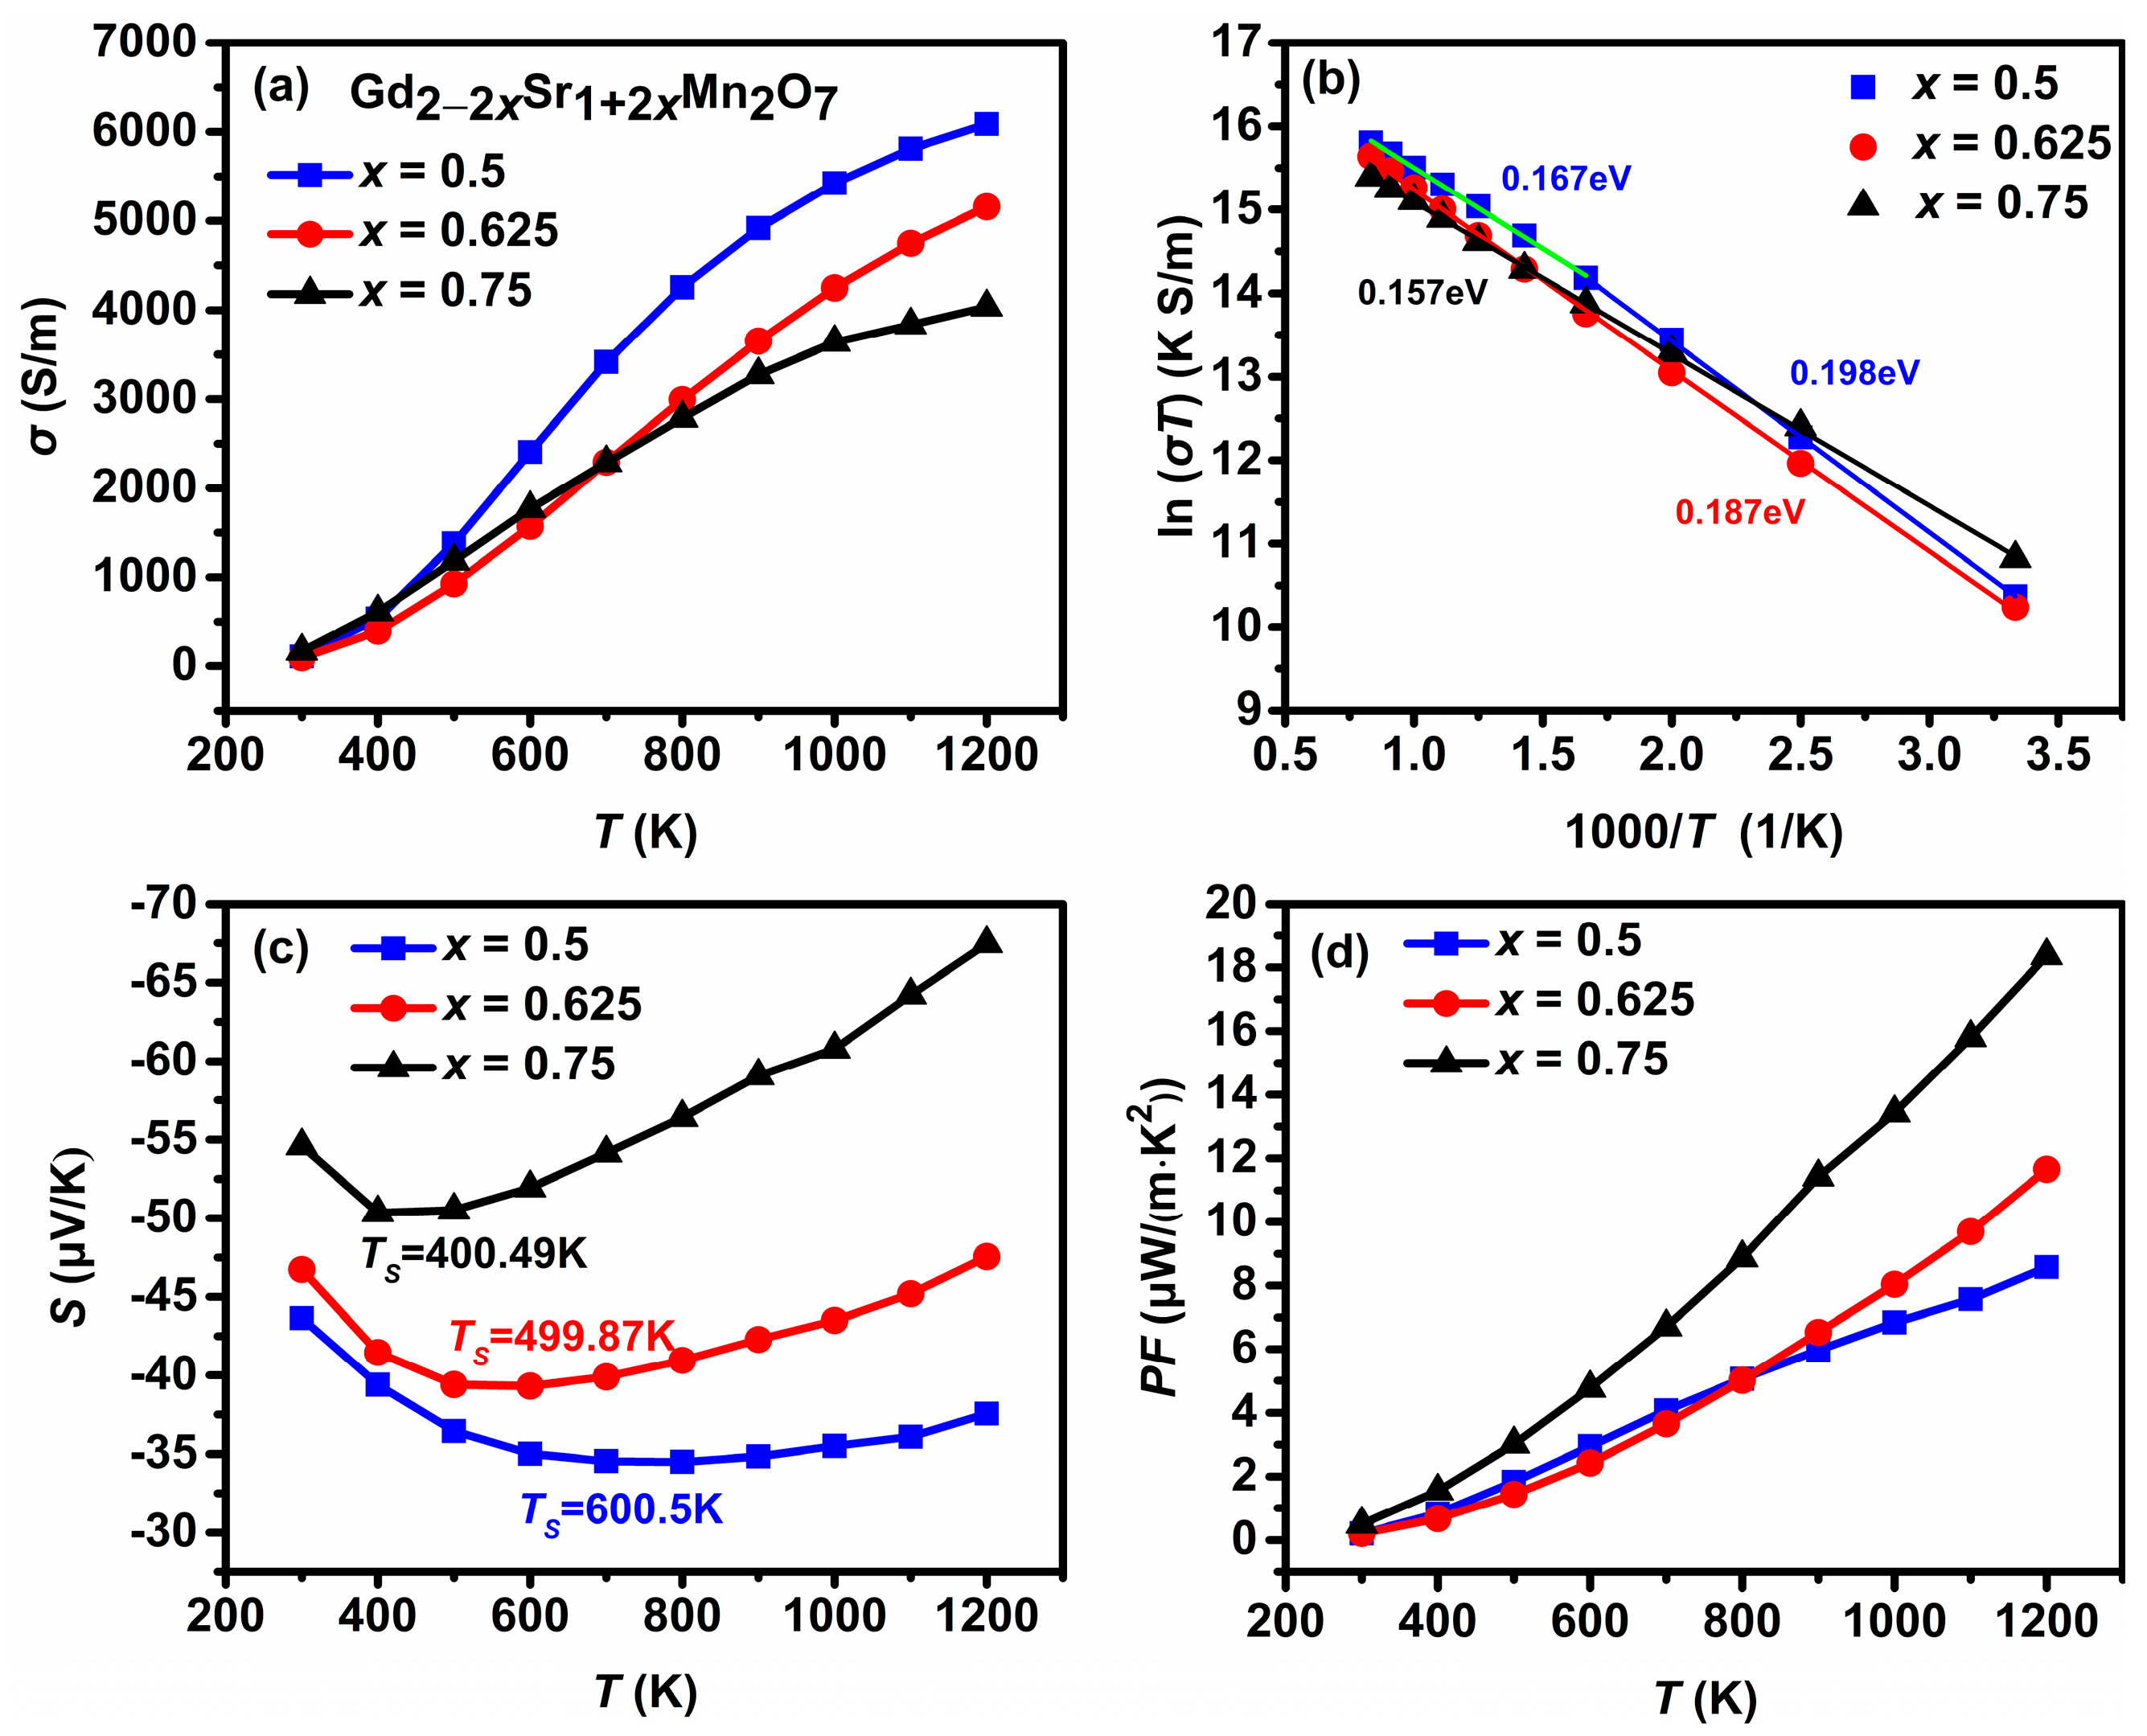
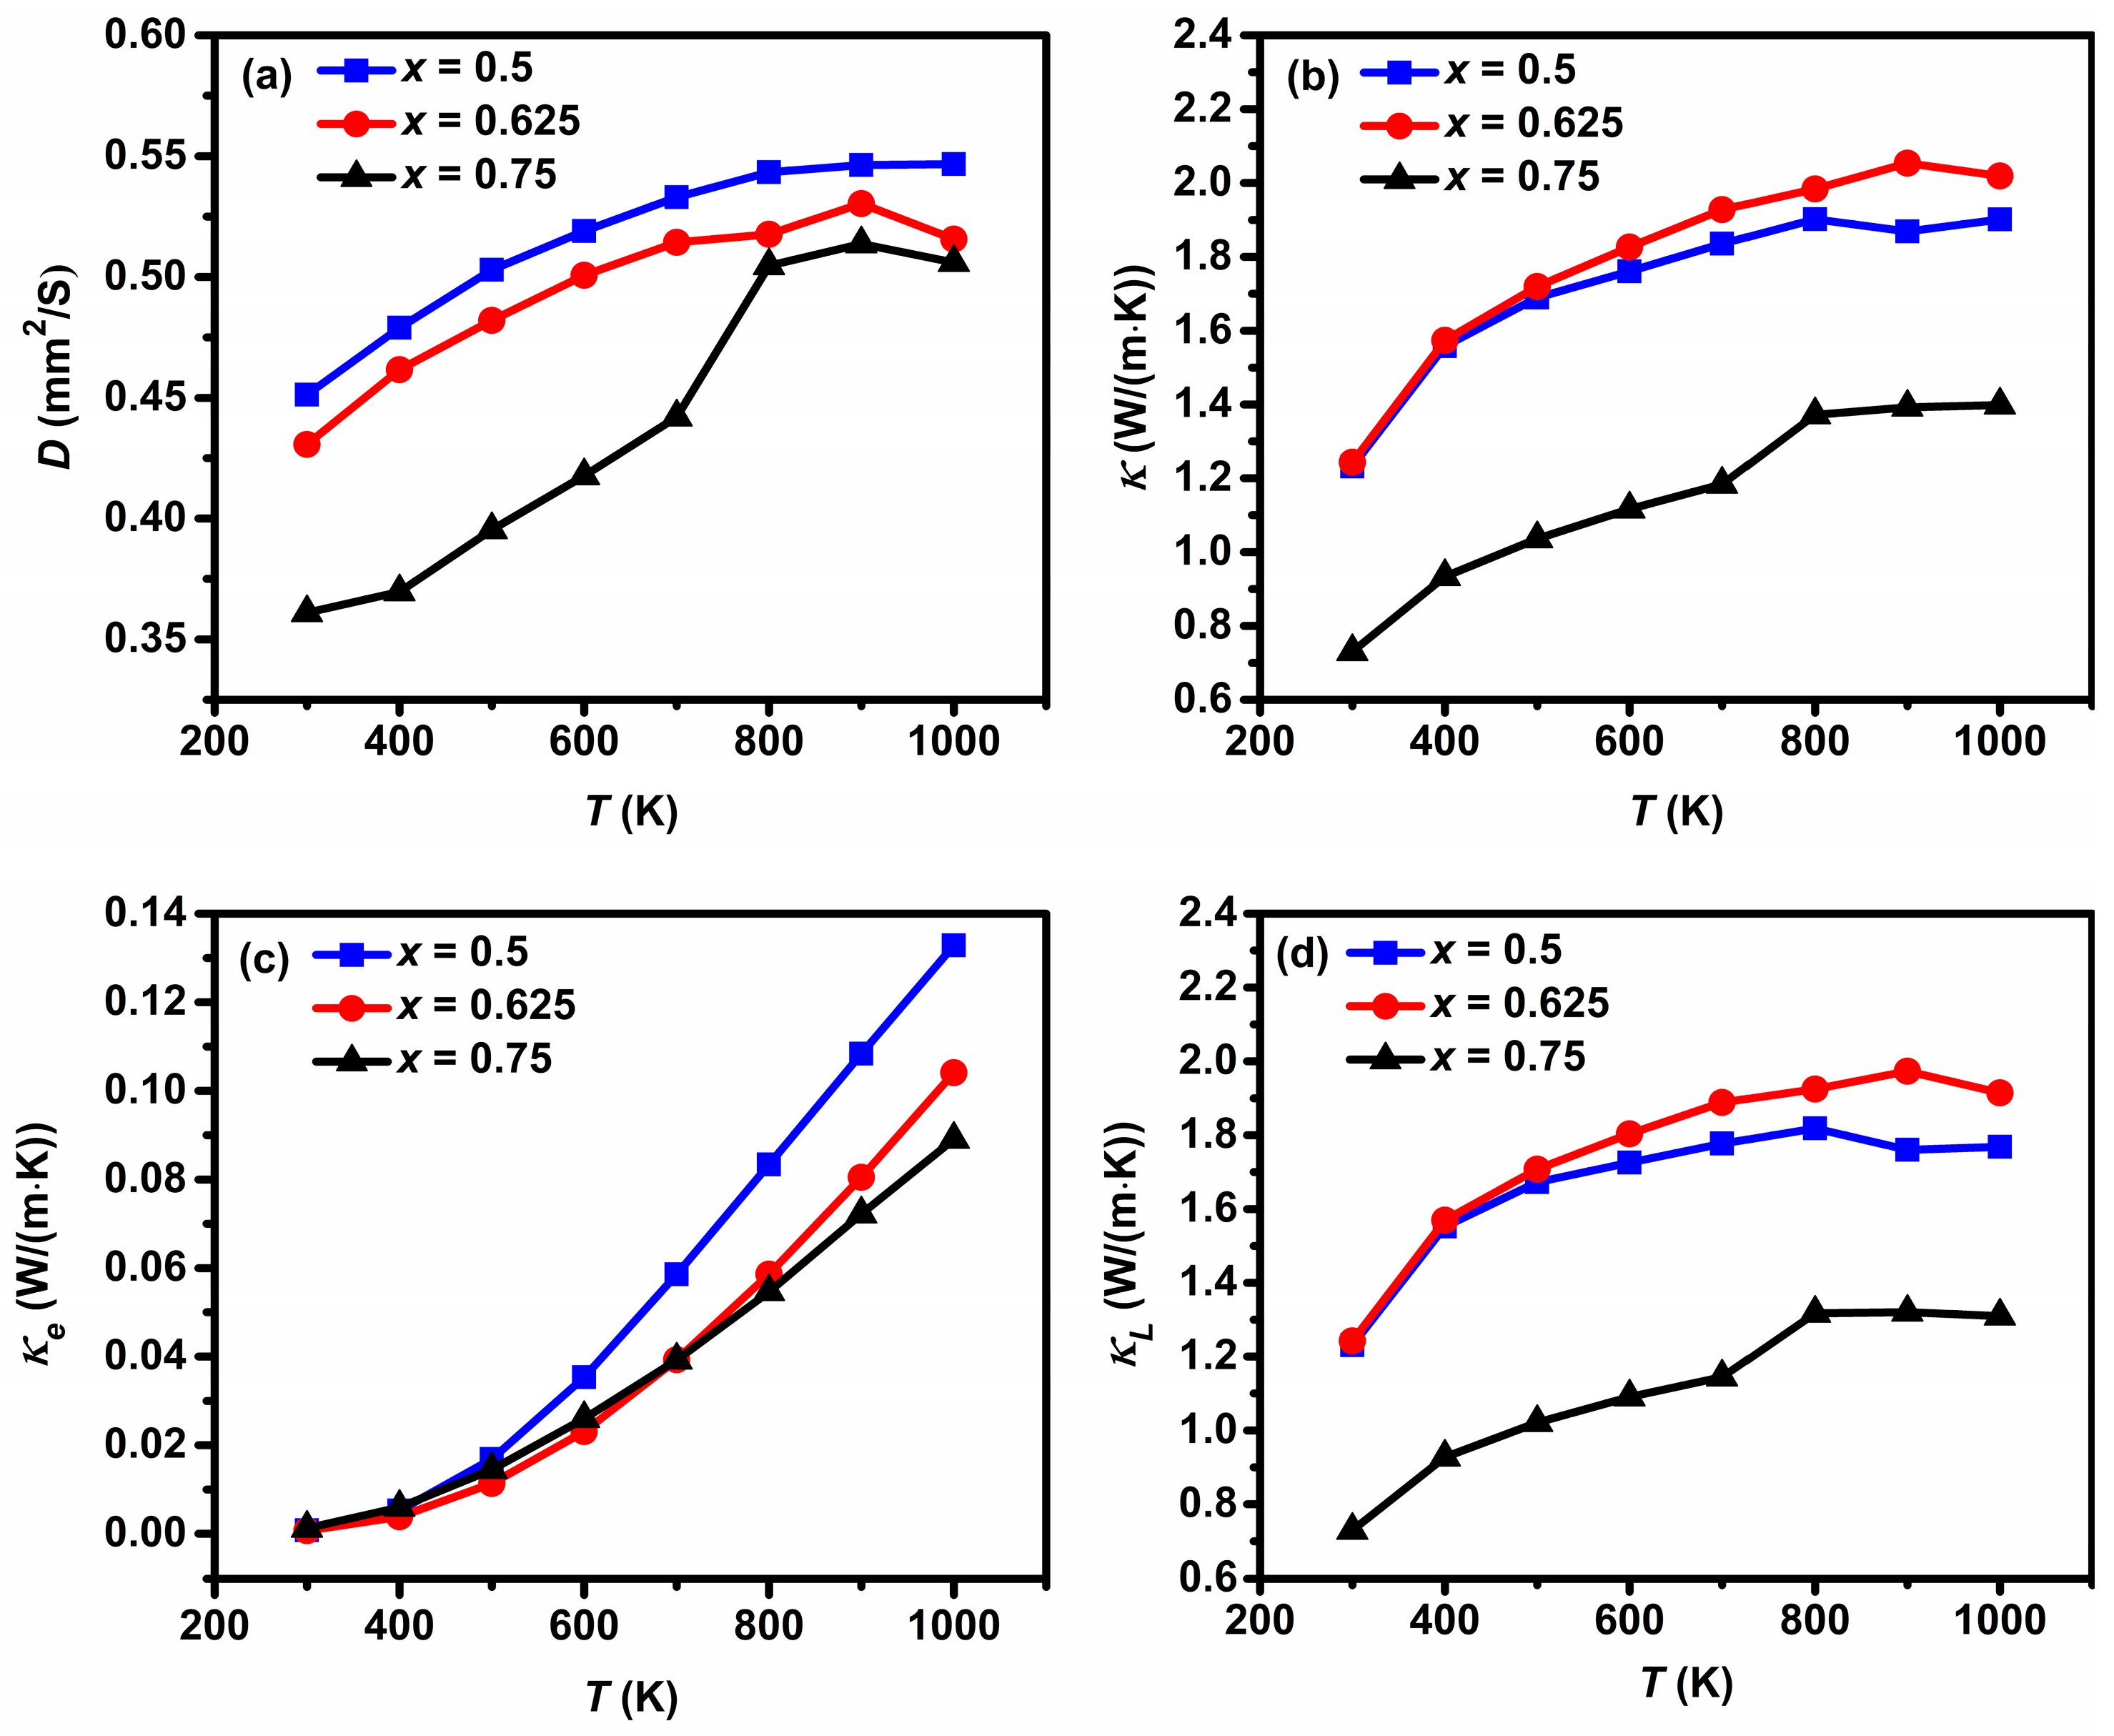
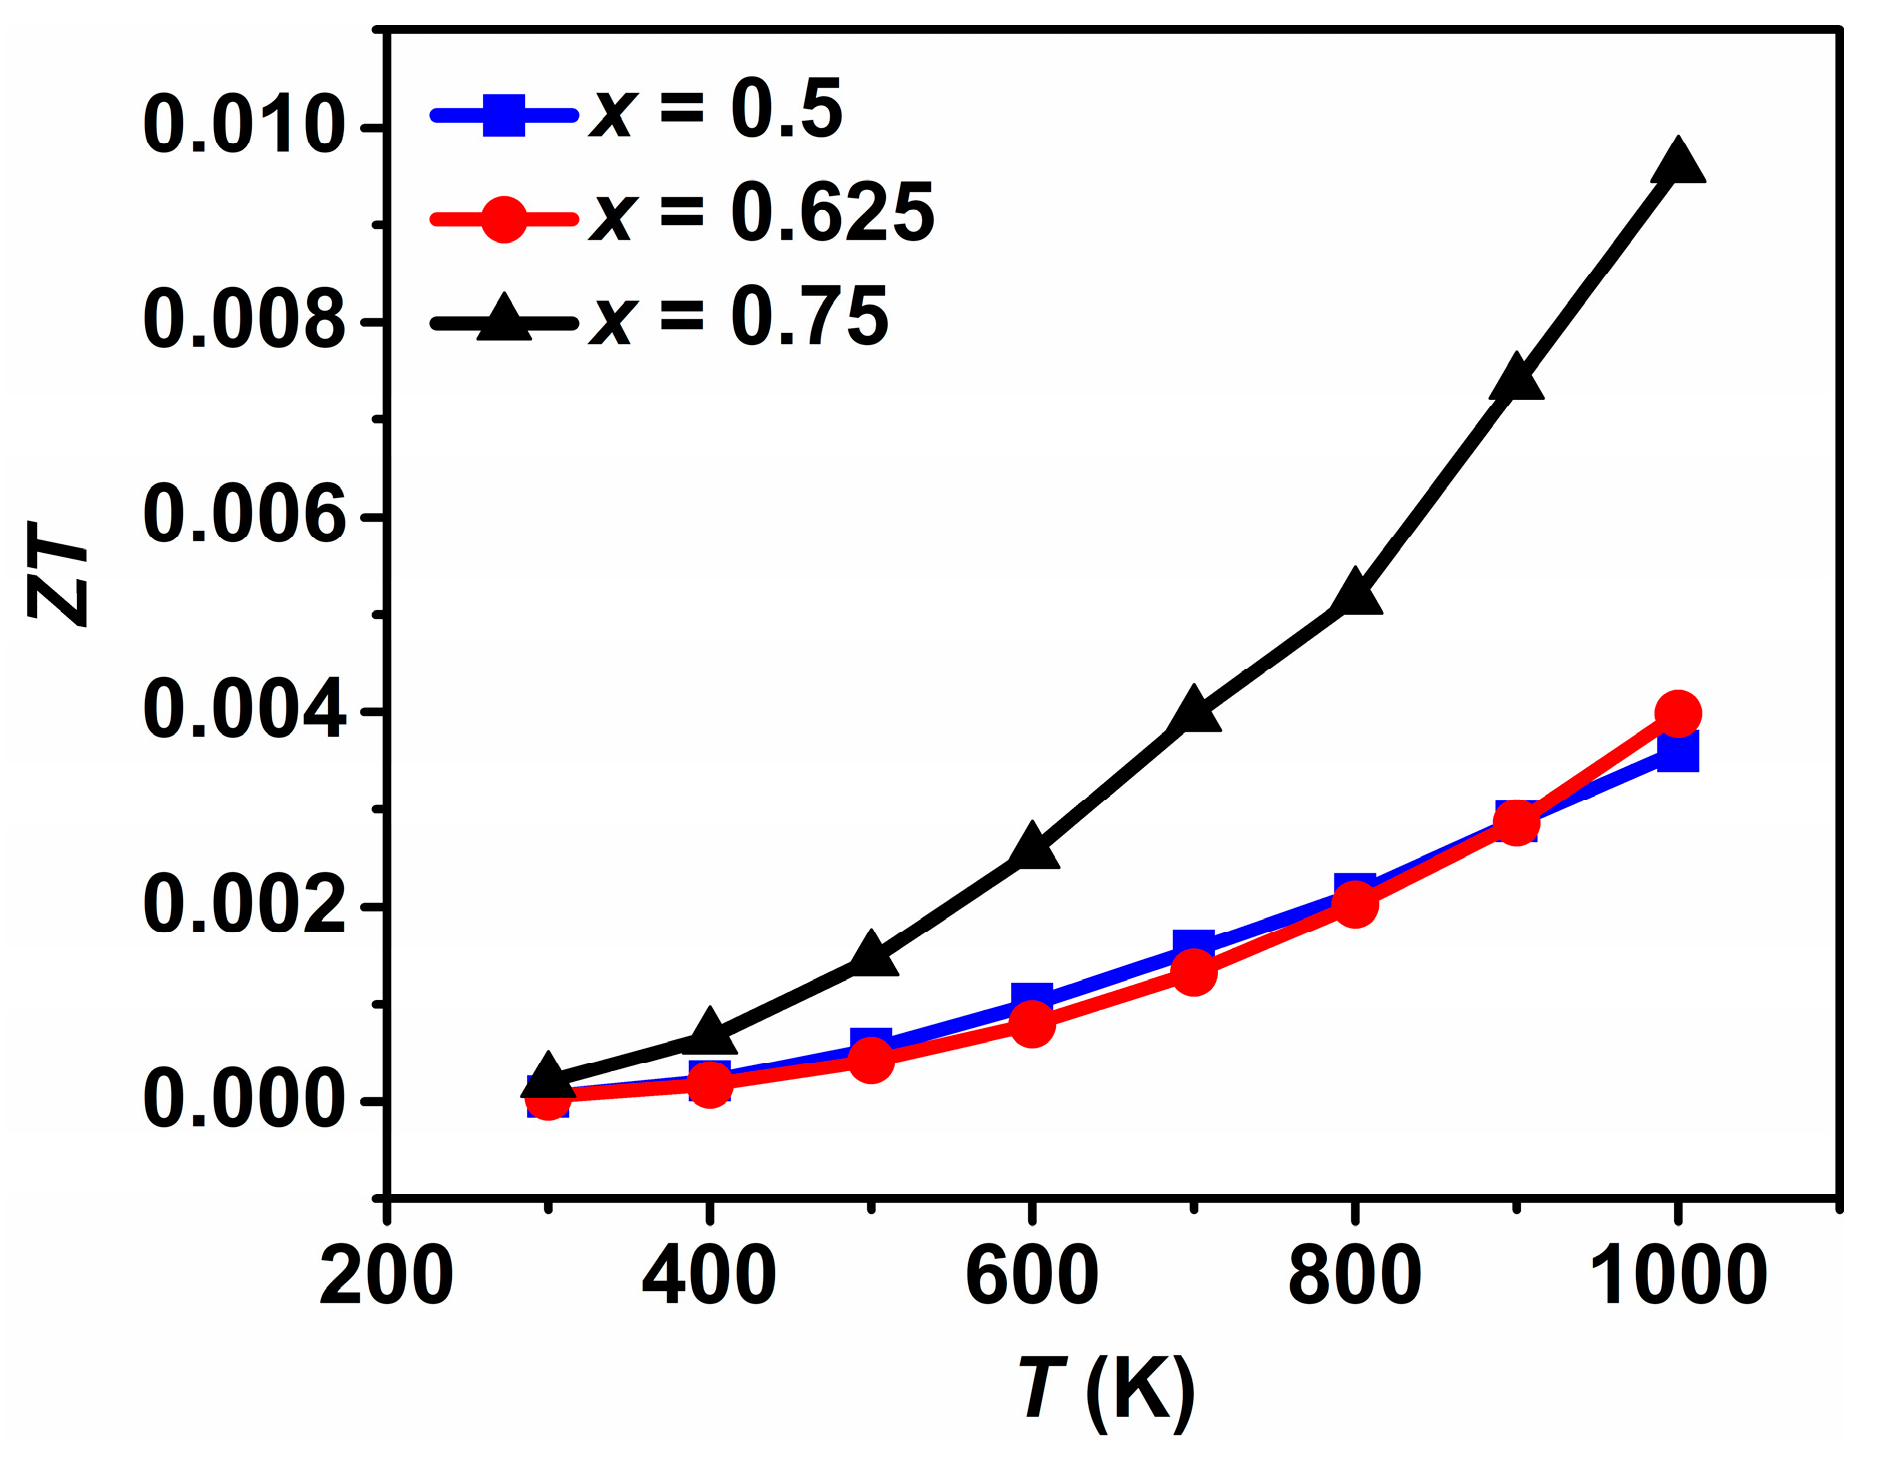
3.2. Thermoelectric Properties

Figure 3a shows the temperature dependence of σ for Gd2−2xSr1+2xMn2O7 (x = 0.5, 0.625, 0.75) in the temperature range of 300–1200 K. All the samples exhibit a semiconducting behavior with dσ/dT > 0. σ increases gradually with increasing Gd content at the high-temperature region, and a maximum value of 6.1 × 10³ S/m at 1200 K is observed for x = 0.5, which is of the same order of magnitude as those for Ca0.96Dy0.02RE0.02MnO3 [29]. As the substitution of Gd3+ ions for Sr2+ ions induces Mn3+ ions and donates electrons, where the nominal amount of Mn3+ ions (i.e., nominal electron concentration) can be estimated from the composition subscript (2−2x) while the nominal amount of Mn4+ ions (nominal hole concentration) estimated from the composition subscript (2x), the Jahn–Teller distortion of the Mn3+ ions leads to the formation of polarons where the electrons are localized due to the strong electron–phonon coupling. The electrical transport of Gd2−2xSr1+2xMn2O7 is thought to be dominated by the hopping motions of electrons or small polaron between Mn3+ and Mn4+ ions. The small polaron hopping conduction can be expressed by the equation [30]:
σ T = σ 0 T e x p E a k B T
where σ 0 is the pre-exponential constant, Ea is the activation energy of small polaron hopping, kB is Boltzmann constant, and T is the absolute temperature. The values of Ea were deduced from the slope of the plot of ln (σT) versus 1000/T. As shown in Figure 3b, good linear fittings were obtained over the whole temperature range for x = 0.625 and 0.75, and Ea was found to be 0.187 and 0.157 eV, respectively. A change in slope was observed for x = 0.5, with an Ea of 0.198 eV at the 300–600 K region and 0.167 eV at the 600–1200 K region. It is found that Ea increases with Gd content below 600 K, that is, 0.198, 0.187, and 0.157 eV for x = 0.5, 0.625, and 0.75, respectively. This may be attributed to the increasing concentration of Mn3+ Jahn–Teller ions which is favorable for the formation of small polarons in this temperature range [31].
The values of S are negative in the whole measured temperature range as seen in Figure 3c, indicating that electrons are the dominant charge carriers. σ increases while the absolute value of S decreases with increasing Gd content due to the increase in electron carrier concentration, which is similar to those for La2−2xCa1+2xMn2O7 (0.75 ≤ x ≤ 1.0) [11], La2−2xSr1+2xMn2O7 [32], and Gd1−xSrxMnO3 (x = 0.5, 0.6, 0.7, 0.8) [33]. The absolute values |S| at 1200 K are found to be decreased by 44% from 67.5 μV/K for x = 0.75 to 37.5 μV/K for x = 0.5. It is observed that the absolute values |S| initially decrease and then increase with temperature, showing a change from a typical semiconducting behavior to a metallic or degenerate semiconducting behavior, which does not coincide with the temperature dependence of σ. The mechanism behind this phenomenon is not clear at present. The temperature Ts which are marked in Figure 3c corresponding to the minimum |S| value, or the so-called metal–insulator transition temperature, was found to shift to higher temperature with increasing Gd content owing to higher electron carrier concentration. Above Ts, all the samples exhibit a metallic or degenerate semiconducting behavior arising from the enhanced scattering of electrons at high temperatures. The dependence of S on the carrier concentration n and temperature T for degenerate semiconductors can be expressed as [34]:
S = 8 π 2 k B 2 3 e h 2 m * T π 3 n 2 3
where m* is the effective mass of the carrier, kB is the Boltzmann constant, e is the elementary charge, and h is Plank’s constant. It is seen from Figure 3a that as T increases from room temperature to 600 K, σ increases sharply from ca. 1.0 × 10² S/m to 2.0 × 10³ S/m, implying a rapid increase in electron carrier concentration n. This rapid increasing n at low temperatures is the dominant factor for the initial decrease in |S| because |S| is inversely proportional to the electron concentration. Then |S| gradually increases with further increasing temperature for an approximately given carrier concentration. Simultaneous increases in σ and |S| with increasing temperature are observed above Ts. This phenomenon was also found in CaMnO3−δ [12] and Yb0.1Ca0.9Mn1−xNbxO3 (x = 0.08, 0.1) [35], and was explained by using a two-band model of S which consists of contributions from the hole (Mn4+) and electron (Mn3+) due to the existence of mixed-valence Mn3+ and Mn4+. This model may be applicable to the present Gd2−2xSr1+2xMn2O7. Figure 3d shows the temperature dependence of the power factor PF. The monotonic increase in PF with temperature for all the samples is obtained due to the increases in both σ and |S| at high temperatures. The PF increases with decreasing Gd content and a maximum value of 18.36 μW/(m K²) is observed for x = 0.75 at 1200 K.
The measured κ was obtained using the relationship κ = DCpd. Measurements for D and CP were carried out from 300 to 1000 K. As seen from Figure 4a, D increases with increasing temperature and with Gd content. CP also increases with increasing temperature, ranging from 0.46, 0.51, 0.36 J/(g K) at 300 K to 0.58, 0.69, 0.50 J/(g K) at 1000 K for x = 0.5, 0.625, 0.75, respectively. The values of D and CP at 300 K are comparable to those for La2−2xCa1+2xMn2O7 in Ref. [11]. Figure 4b shows the temperature dependence of measured κ for Gd2−2xSr1+2xMn2O7 (x = 0.5, 0.625, 0.75). κ is lower than 2 W/(m K) over the measured temperature range. κ increases slightly with temperature and with increasing Gd content, which is constant with those for La2−2xCa1+2xMn2O7 in Ref. [11]. The measured κ consists of two contributions from phonons and electron carriers, i.e., κ = κL + κe, the lattice thermal conductivity κL, and the electronic thermal conductivity κe. κe can be calculated according to the Wiedemann–Franz law, κe = LσT, where L is the Lorentz number (2.45 × 10⁻⁸ W Ω/K2). Increasing σ is accompanied by an increase in κe. Temperature-dependent κe and κL are presented in Figure 4c,d. The values of κe are seen to be one order of magnitude smaller than those of κL, indicating that a significant contribution is related to the lattice vibration for the heat transport in Gd2−2xSr1+2xMn2O7. Figure 5 shows the temperature dependence of ZT. A similar trend is observed for ZT and PF. The x = 0.75 compound Gd0.5Sr2.5Mn2O7 shows better performances than the other ones due to the simultaneously enhanced S and reduced κ, with a σ of 3.6 × 10³ S/m, a S of −60.8 μV/K, and a κ of 1.4 W/(m K) at 1000 K. A maximum ZT of 0.01 is thus obtained for x = 0.75, which is comparable to that of n-type La2−2xCa1+2xMn2O7 (0.75 ≤ x ≤ 1.0) [11] and p-type Ca3Co2−xMnxO6 [36]. The ZT value is very low for practical TE applications. These results reveal that efforts should be made to enhance σ and/or S through compositional and processing optimizations in order to obtain high ZT for these double layered manganites to be used as potential candidates for n-type TE materials.

4. Conclusions

The structure and TE properties of Mn3+/Mn4+ mixed-valence double-layered manganites Gd2−2xSr1+2xMn2O7 (x = 0.5, 0.625, 0.75) were studied. XRD patterns of the samples were consistent with a tetragonal Sr3Ti2O7 type structure with space group I4/mmm (No. 139). The Rietveld refinements indicated that the unit cell volume and the distortion in the MnO6 octahedra increase with increasing Gd content. SEM micrographs and EDS measurements of all the samples show dense and uniform microstructures. All the samples are n-type semiconductors, and σ can be fitted well by the small polaron hopping model in the whole temperature range. With increasing Gd content, σ increases while |S| decreases due to the increasing electron carrier concentration. It is found that the absolute values |S| initially decrease and then increase with temperature, and both σ and |S| increase with temperature approximately above 600 K, resulting in a monotonic increase in PF. These phenomena are interesting, and the physical mechanisms are worthy of further study. κ increases with increasing Gd content, and is lower than 2 W/(m K) over the temperature range of 300–1000 K. A maximum ZT of 0.01 is obtained for x = 0.75 at 1000 K. Although the ZT of Gd2−2xSr1+2xMn2O7 does not yet reach the performance required for practical TE materials, the present study sheds light on their electrical and thermal transport properties and the relevant mechanisms and lays a foundation for seeking new applications for these double-layered manganites.

Author Contributions

Methodology, N.Q. and Y.P.; formal analysis, N.Q. and Y.P.; investigation, N.Q.; resources, X.C. and Z.X.; writing—original draft preparation, N.Q.; writing—review and editing, J.Y.; supervision, J.Y.; project administration, X.C. and J.Y.; funding acquisition, X.C. and J.Y. All authors have read and agreed to the published version of the manuscript.

Funding

This work was financially supported by the National Natural Science Foundation of China (Grant Nos. 51961006 and 52062002).

Institutional Review Board Statement

Not applicable.

Informed Consent Statement

Not applicable.

Data Availability Statement

Data are contained within the article.

Conflicts of Interest

The authors declare no conflict of interest.

References

  1. Terasaki, I.; Sasago, Y.; Uchinokura, K. Large thermoelectric power in NaCo2O4 single crystals. Phys. Rev. B 1997, 56, R12685–R12687. [Google Scholar] [CrossRef]
  2. Fergus, J.W. Oxide materials for high temperature thermoelectric energy conversion. J. Eur. Ceram. Soc. 2012, 32, 525–540. [Google Scholar] [CrossRef]
  3. Yin, Y.N.; Tudu, B.; Tiwari, A. Recent advances in oxide thermoelectric materials and modules. Vacuum 2017, 146, 356–374. [Google Scholar] [CrossRef]
  4. Zhao, L.-D.; He, J.; Berardan, D.; Lin, Y.; Li, J.-F.; Nan, C.-W.; Dragoe, N. BiCuSeO oxyselenides: New promising thermoelectric materials. Energy Environ. Sci. 2014, 7, 2900–2924. [Google Scholar] [CrossRef]
  5. Megha, A.; Sourav, J.S.; Mani, R.; Tanmoy, M. High performance (ZT>1) n-type oxide thermoelectric composites from earth abundant materials. Nano Energy 2021, 84, 105905. [Google Scholar] [CrossRef]
  6. Wang, H.; Su, W.; Liu, J.; Wang, C. Recent development of n-type perovskite thermoelectrics. J. Mater. 2016, 2, 225–236. [Google Scholar] [CrossRef] [Green Version]
  7. Walia, S.; Balendhran, S.; Nili, H.; Zhuiykov, S.; Rosengarten, G.; Wang, Q.H.; Bhaskaran, M.; Sriram, S.; Strano, M.S.; Kalantar-zadeh, K. Transition metal oxides—Thermoelectric properties. Prog. Mater Sci. 2013, 58, 1443–1489. [Google Scholar] [CrossRef] [Green Version]
  8. Kimura, T.; Tokura, Y. Layered Magnetic Manganites. Annu. Rev. Mater. Sci. 2000, 30, 451–474. [Google Scholar] [CrossRef]
  9. Dawley, N.M.; Pek, E.K.; Lee, C.-H.; Ragasa, E.J.; Xiong, X.; Lee, K.; Phillpot, S.R.; Chernatynskiy, A.V.; Cahill, D.G.; Schlom, D.G. Thermal conductivity of the n = 1–5 and 10 members of the (SrTiO3)nSrO Ruddlesden–Popper superlattices. Appl. Phys. Lett. 2021, 118, 091904. [Google Scholar] [CrossRef]
  10. Wang, Y.F.; Lee, K.H.; Ohta, H.; Koumoto, K. Fabrication and thermoelectric properties of heavily rare-earth metal-doped SrO(SrTiO3)n (n=1, 2) ceramics. Ceram. Int. 2008, 34, 849–852. [Google Scholar] [CrossRef]
  11. Toyoda, T.; Sasaki, N.; Shimada, K.; Okube, M.; Sasaki, S. High-Temperature Thermoelectric Property of Layered La2−2xCa1+2xMn2O7 Manganites (0.75 ≤x ≤ 1.0). Jpn. J. Appl. Phys. 2011, 50, 041101. [Google Scholar] [CrossRef]
  12. Liu, C.-J.; Bhaskar, A.; Yuan, J.J. High-temperature transport properties of Ca0.98RE0.02MnO3−δ (RE=Sm, Gd, and Dy). Appl. Phys. Lett. 2011, 98, 214101. [Google Scholar] [CrossRef]
  13. Sun, R.R.; Qin, X.Y.; Li, L.L.; Li, D.; Zhang, J.; Zhang, Y.S.; Tang, C.J. The effects of elements doping on transport and thermoelectric properties of Sr3Ti2O7. J. Phys. Chem. Solids 2014, 75, 629–637. [Google Scholar] [CrossRef]
  14. Wang, Y.F.; Lee, K.H.; Hyuga, H.; Kita, H.; Ohta, H.; Koumoto, K. Enhancement of thermoelectric performance in rare earth-doped Sr3Ti2O7 by symmetry restoration of TiO6 octahedra. J. Electroceram. 2010, 24, 76–82. [Google Scholar] [CrossRef]
  15. Mitchell, J.F.; Argyriou, D.N.; Berger, A.; Gray, K.E.; Osborn, R.; Welp, U. Spin, Charge, and Lattice States in Layered Magnetoresistive Oxides. J. Phys. Chem. B 2001, 105, 10731–10745. [Google Scholar] [CrossRef]
  16. Zhang, J.; Wang, F.; Zhang, P.; Sun, X.; Yan, Q. Magnetic and electric properties of layered perovskites Nd2−2xSr1+2xMn2O7 (x=0.3–0.5). J. Magn. Magn. Mater. 1998, 190, 166–170. [Google Scholar] [CrossRef]
  17. Moritomo, Y.; Asamitsu, A.; Kuwahara, H.; Tokura, Y. Giant magnetoresistance of manganese oxides with a layered perovskite structure. Nature 1996, 380, 141–144. [Google Scholar] [CrossRef]
  18. Kimura, T.; Tomioka, Y.; Kuwahara, H.; Asamitsu, A.; Tamura, M.; Tokura, Y. Interplane Tunneling Magnetoresistance in a Layered Manganite Crystal. Science 1996, 274, 1698–1701. [Google Scholar] [CrossRef]
  19. Hur, N.H.; Kim, J.-T.; Yoo, K.H.; Park, Y.K.; Park, J.-C. Effect of lanthanide ions on the magnetotransport properties in layered Sr1.6R1.4Mn2O7 (R=La, Pr, Nd, Gd). Phys. Rev. B 1998, 57, 10740–10744. [Google Scholar] [CrossRef]
  20. Asano, H.; Hayakawa, J.; Matsui, M. Two-dimensional ferromagnetic ordering and magnetoresistance in the layered perovskite La2−2xCa1+2xMn2O7. Phys. Rev. B 1997, 56, 5395–5403. [Google Scholar] [CrossRef]
  21. Battle, P.D.; Green, M.A.; Laskey, N.S.; Kasmir, N.; Millburn, J.E.; Spring, L.E.; Sullivan, S.P.; Rosseinsky, M.J.; Vente, J.F. Control of electronic properties by lanthanide size and manganese oxidation state in the MnIII/MnIV Ruddlesden-Popper phases Ln2−xSr1+xMn2O7. J. Mater. Chem. 1997, 7, 977–988. [Google Scholar] [CrossRef]
  22. He, L.; Qin, N.; Wei, J.; Li, M.; Song, Y.; Yan, J. Metastable phase diagram of the Gd2O3–SrO–CoOx ternary system. Int. J. Mater. Res. 2022, 113, 508–519. [Google Scholar] [CrossRef]
  23. Wei, J.X.; Yin, Y.; Yan, J.L. Structural and thermoelectric properties of GdxSr2−xCoO4 layered perovskites. Ceram. Int. 2021, 47, 19835–19842. [Google Scholar] [CrossRef]
  24. Argyriou, D.N.; Mitchell, J.F.; Potter, C.D.; Bader, S.D.; Kleb, R.; Jorgensen, J.D. Unconventional magnetostriction in layered La1.2Sr1.8Mn2O7: Evidence for spin-lattice coupling above TC. Phys. Rev. B 1997, 55, R11965–R11968. [Google Scholar] [CrossRef]
  25. Kumar, B.; Tiwari, J.K.; Chauhan, H.C.; Ghosh, S. Multiple magnetic phase transitions with different universality classes in bilayer La1.4Sr1.6Mn2O7 manganite. Sci. Rep. 2021, 11, 21184. [Google Scholar] [CrossRef]
  26. Rodríguez-Carvajal, J. Recent advances in magnetic structure determination by neutron powder diffraction. Physica B 1993, 192, 55–69. [Google Scholar] [CrossRef]
  27. Battle, P.D.; Green, M.A.; Laskey, N.S.; Millburn, J.E.; Murphy, L.; Rosseinsky, M.J.; Sullivan, S.P.; Vente, J.F. Layered Ruddlesden-Popper manganese oxides: Synthesis and cation ordering. Chem. Mater. 1997, 9, 552–559. [Google Scholar] [CrossRef]
  28. Ruck, K.; Dorr, K.; Nenkov, K.; Muller, K.H.; Krabbes, G.; Schupp, B.; Khristov, M. Magnetic and transport properties of Nd0.2La1.8−2xSr1+2xMn2O7 (x=0.5, 0.4, 0.3) and La1.5Sr1.5Mn2O7. J. Phys. Condens. Matter 2001, 13, 1571–1583. [Google Scholar] [CrossRef]
  29. Zhu, Y.; Wang, C.; Su, W.; Li, J.; Liu, J.; Du, Y.; Mei, L. High-temperature thermoelectric performance of Ca0.96Dy0.02RE0.02MnO3 ceramics (RE=Ho, Er, Tm). Ceram. Int. 2014, 40, 15531–15536. [Google Scholar] [CrossRef]
  30. Nag, A.; Shubha, V. Oxide Thermoelectric Materials: A Structure–Property Relationship. J. Electron. Mater. 2014, 43, 962–977. [Google Scholar] [CrossRef] [Green Version]
  31. Lan, J.; Lin, Y.-H.; Fang, H.; Mei, A.; Nan, C.-W.; Liu, Y.; Xu, S.; Peters, M. High-Temperature Thermoelectric Behaviors of Fine-Grained Gd-Doped CaMnO3 Ceramics. J. Am. Ceram. Soc. 2010, 93, 2121–2124. [Google Scholar] [CrossRef]
  32. Nakamae, S.; Colson, D.; Forget, A.; Legros, I.; Marucco, J.F.; Ayache, C.; Ocio, M. Thermoelectric power of hole-doped manganites: La2−2xSr1+2xMn2O7 (0.3 ≤x ≤0.5). Phys. Rev. B 2001, 63, 092407. [Google Scholar] [CrossRef]
  33. Tanwar, K.; Anjum, F.; Shukla, A.K.; Maiti, T. Role of structural distortion on thermoelectric aspects of heavily Sr2+ doped GdMnO3. J. Appl. Phys. 2018, 124, 094902. [Google Scholar] [CrossRef]
  34. Cutler, M.; Leavy, J.F.; Fitzpatrick, R.L. Electronic Transport in Semimetallic Cerium Sulfide. Phys. Rev. 1964, 133, A1143–A1152. [Google Scholar] [CrossRef]
  35. Wang, C.; Shi, L.; Xu, X.; Zhou, S.; Zhao, J.; Guo, Y.; Liu, H.; He, L.; Cai, X.; Xu, G. High-temperature thermoelectric characteristics of B-site substituted Yb0.1Ca0.9Mn1−xNbxO3 system (0≤x≤0.1). Appl. Phys. A 2013, 112, 1003–1009. [Google Scholar] [CrossRef]
  36. Kanas, N.; Singh, S.P.; Rotan, M.; Desissa, T.D.; Grande, T.; Wiik, K.; Norby, T.; Einarsrud, M.-A. Thermoelectric Properties of Ca3Co2−xMnxO6 (x = 0.05, 0.2, 0.5, 0.75, and 1). Materials 2019, 12, 497. [Google Scholar] [CrossRef] [Green Version]
Figure 1. (a) Powder XRD patterns for Gd2−2xSr1+2xMn2O7 (x = 0.5, 0.625, 0.75). (b) Rietveld refinement pattern for x = 0.625. The inset shows the crystal structure of the unit cell.
Materials 16 02548 g001
Figure 2. FE-SEM micrographs of the polished surface of sintered Gd2−2xSr1+2xMn2O7 with (a) x = 0.5, (b) x = 0.625, (c) x = 0.75. The insets of (ac) are the fractured surface micrographs. (d) EDS mapping images for x = 0.625.
Materials 16 02548 g002
Figure 3. (a) Temperature dependence of the electrical conductivity, (b) plot of ln(σT) versus 1000/T. The solid lines represent the fitting of the small polaron hopping model. Temperature dependence of (c) the Seebeck coefficient, and (d) the power factor for Gd2−2xSr1+2xMn2O7 (x = 0.5, 0.625, 0.75).
Materials 16 02548 g003
Figure 4. Temperature dependence of (a) the thermal diffusivity, (b) the measured thermal conductivity, (c) the electronic thermal conductivity, and (d) the lattice thermal conductivity for Gd2−2xSr1+2xMn2O7 (x = 0.5, 0.625, 0.75).
Materials 16 02548 g004
Figure 5. Temperature dependence of ZT for Gd2−2xSr1+2xMn2O7 (x = 0.5, 0.625, 0.75).
Materials 16 02548 g005
Table 1. Structural parameters obtained from Rietveld refinements for Gd2−2xSr1+2xMn2O7. Space group I4/mmm (No. 139), atomic Wyckoff positions: Gd1/Sr1, 2b (0, 0, 1/2), Gd2/Sr2, 4e (0, 0, z), Mn, 4e (0, 0, z), O1, 2a (0, 0, 0), O2, 4e (0, 0, z), O3, 8g (0, 1/2, z).
x = 0.5x = 0.625x = 0.75
a (Å)3.82705 (5)3.83642 (7)3.83446 (10)
c (Å)20.0030 (3)19.8882 (4)19.9048 (6)
V3)292.971 (7)292.72 (1)292.66 (1)
ρx (g/cm3) *6.3426.1235.842
d (g/cm3)5.97165.69425.5009
% T. D.94.293.094.2
Occ. Gd1/Sr10.141/0.8590.176/0.8240.131/0.869
zGd2/Sr20.31729 (4)0.31714 (4)0.31677 (5)
Occ. Gd2/Sr20.466/0.5340.306/0.6940.150/0.850
zMn0.09766 (8)0.09698 (9)0.0975 (1)
zO20.1996 (3)0.1973 (3)0.1966 (4)
zO30.0989 (2)0.0969 (2)0.0959 (3)
dMn-O1 (Å)1.9535 (18)1.9288 (18)1.9417 (24)
dMn-O2 (Å)2.0391 (63)1.9952 (62)1.9716 (83)
dMn-O3 (Å)1.9137 (1)1.91821 (4)1.9175 (1)
Rp (%)10.910.712.8
Rwp (%)12.712.715.2
Rexp (%)7.387.096.69
* Calculated using the relationship ρ x = Z M / N A V , where Z is the number of formula units per unit cell, M is the sum of the atomic weights of all cations and all anions in the formula unit, N A is Avogadro’s number and V is the volume of the unit cell. Here Z = 2. M was calculated from the compositions obtained from the refined occupancies, not from the nominal compositions.
Table 2. The measured compositions from EDS results for Gd2−2xSr1+2xMn2O7 (x = 0.5, 0.625, 0.75).
EDS Composition (at.%)
xNominal FormulaGdSrMnEDS Formula
0.5GdSr2Mn2O720.77 ± 3.5340.02 ± 1.4839.21 ± 3.28Gd1.038Sr2.001Mn1.961O7
0.625Gd0.75Sr2.25Mn2O714.07 ± 4.1246.25 ± 4.2839.68 ± 1.92Gd0.703Sr2.313Mn1.984O7
0.75Gd0.5Sr2.5Mn2O712.64 ± 3.7946.49 ± 3.6740.87 ± 1.67Gd0.632Sr2.325Mn2.043O7
Disclaimer/Publisher’s Note: The statements, opinions and data contained in all publications are solely those of the individual author(s) and contributor(s) and not of MDPI and/or the editor(s). MDPI and/or the editor(s) disclaim responsibility for any injury to people or property resulting from any ideas, methods, instructions or products referred to in the content.

