
Platinum-Functionalized Graphene Oxide: One-Pot Synthesis and Application as an Electrocatalyst

Abstract
:1. Introduction
2. Materials and Methods
2.1. Reagents
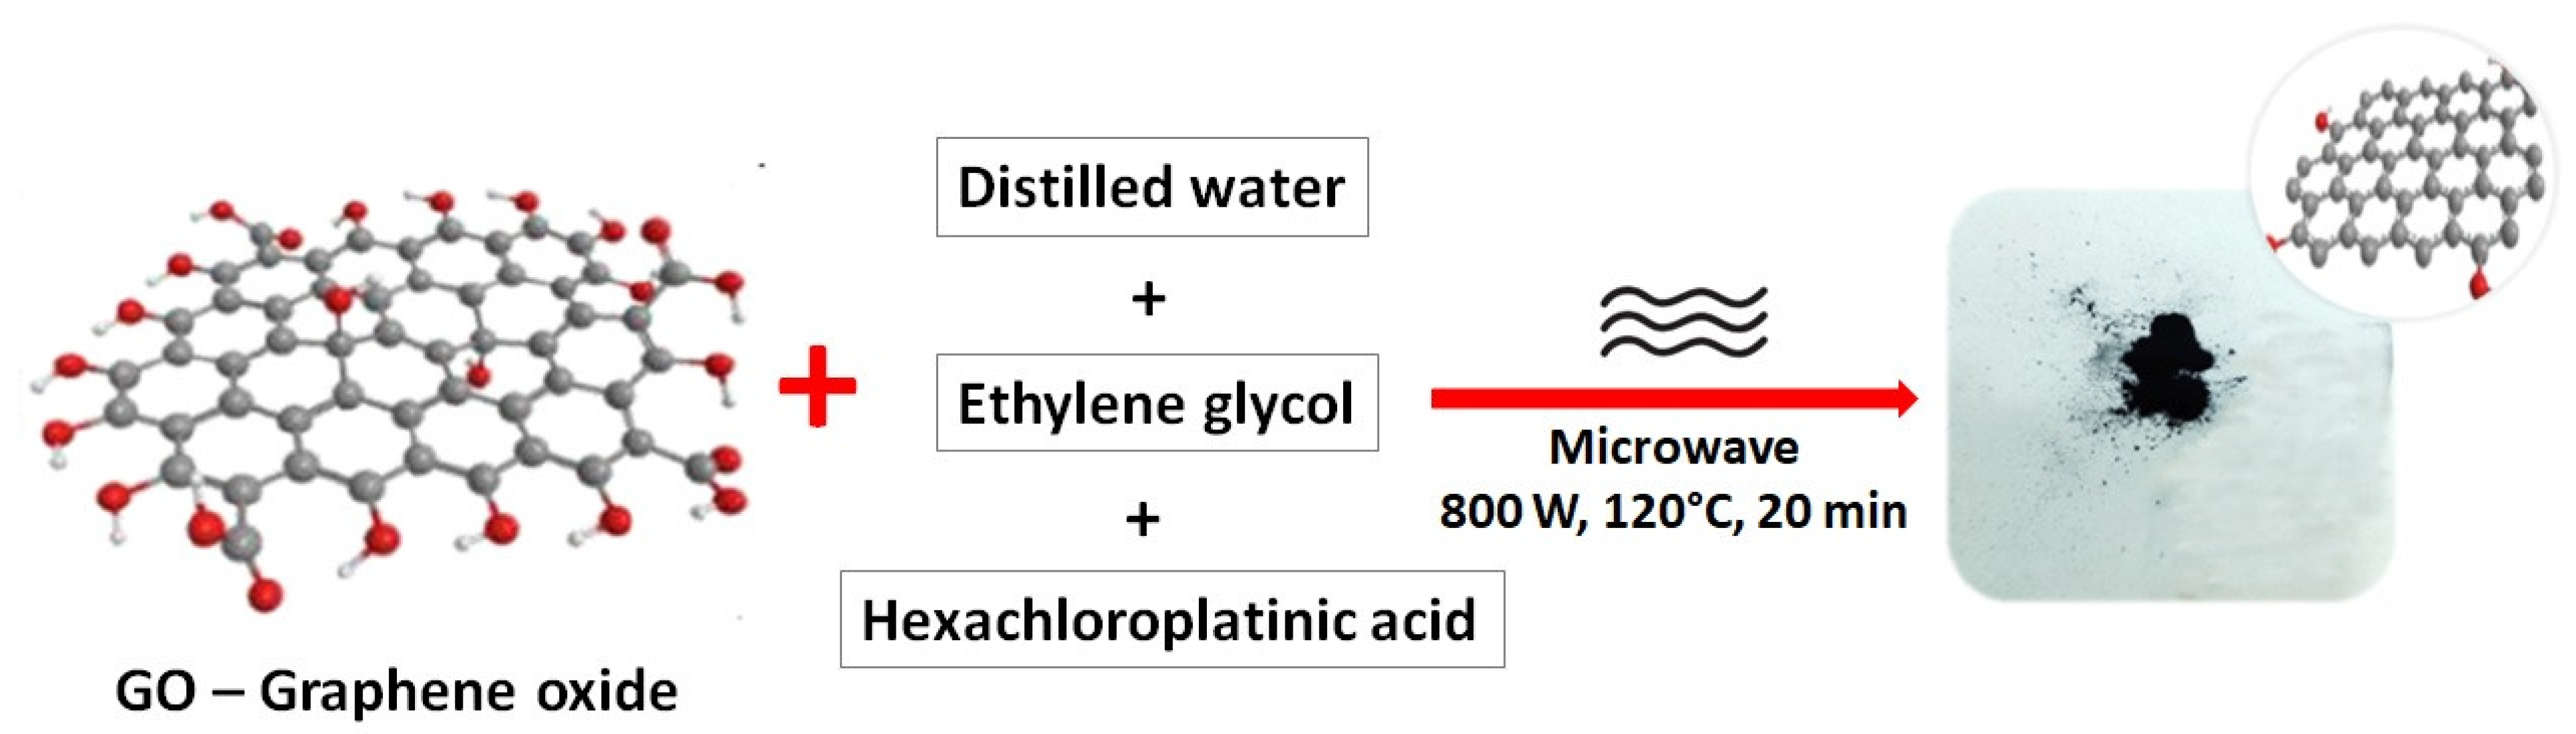
2.2. Synthesis
2.3. Instrumentation
3. Results and Discussion
4. Conclusions
Author Contributions
Funding
Data Availability Statement
Acknowledgments
Conflicts of Interest
References
- Cele, N.P.; Sinha-Ray, S.; Munda, J.; Jimoh, A.A. The state of the art proton exchange membrane fuel cells for clean energy. In 2010 IEEE International Energy Conference; IEEE: Piscataway, NJ, USA, 2010; pp. 865–869. [Google Scholar]
- Pérez-Rodríguez, S.; Pastor, E.; Lázaro, M.J. Electrochemical behavior of the carbon black Vulcan XC-72R: Influence of the surface chemistry. Int. J. Hydrog. Energy 2018, 43, 7911–7922. [Google Scholar] [CrossRef] [Green Version]
- Mark, K. Debe, Electrocatalyst approaches and chanllenges for automotive fuel cell. Nature 2012, 486, 43. [Google Scholar] [CrossRef]
- Ma, R.; Lin, G.; Zhou, Y.; Liu, Q.; Zhang, T.; Shan, G.; Yang, M.; Wang, J. A review of oxygen reduction mechanism for metal-free carbon-based electrocatalysts. npj Comput. Mater. 2019, 5, 78. [Google Scholar] [CrossRef] [Green Version]
- Osman, S.H.; Kamarudin, S.K.; Karim, N.A.; Basri, S. Application of graphene in low-temperature fuel cell technology: An overview. Int. J. Energy Res. 2021, 45, 18318–18336. [Google Scholar] [CrossRef]
- Kamat, P.V. Graphene-based nanoarchitectures. Anchoring semiconductor and metal nanoparticles on a two-dimensional carbon support. J. Phys. Chem. Lett. 2010, 1, 520–527. [Google Scholar] [CrossRef]
- Allen, M.J.; Tung, V.C.; Kaner, R.B. Honeycomb carbon: A review of graphene. Chem. Rev. 2010, 110, 132–145. [Google Scholar] [CrossRef]
- Chen, D.; Tang, L.; Li, J. Graphene-based materials in electrochemistry. Chem. Soc. Rev. 2010, 39, 3157–3180. [Google Scholar] [CrossRef]
- Novoselov, K.S.; Geim, A.K.; Morozov, S.V.; Jiang, D.E.; Zhang, Y.; Dubonos, S.V.; Firsov, A.A. Electric field effect in atomically thin carbon films. Science 2004, 306, 666–669. [Google Scholar] [CrossRef] [Green Version]
- Ovid’Ko, I.A. Mechanical properties of graphene. Rev. Adv. Mater. Sci. 2013, 34, 1–11. [Google Scholar]
- Woodford, C. Graphene—A Simple Introduction. Explain that Stuff. 2021. Available online: https://www.explainthatstuff.com/graphene.html (accessed on 5 July 2022).
- Gosling, J.H.; Makarovsky, O.; Wang, F.; Cottam, N.D.; Greenaway, M.T.; Patanè, A.; Fromhold, T.M. Universal mobility characteristics of graphene originating from charge scattering by ionised impurities. Commun. Phys. 2021, 4, 30. [Google Scholar] [CrossRef]
- Tani, H.; Izutani, Y.; Lu, R.; Koganezawa, S.; Tagawa, N. Electric field effect on friction coefficient of diamond-like carbon film heated by laser irradiation. Tribol. Lett. 2021, 69, 103. [Google Scholar] [CrossRef]
- Rao, C.E.E.; Sood, A.E.; Subrahmanyam, K.E.; Govindaraj, A. Graphene: The new two-dimensional nanomaterial. Angew. Chem. Int. Ed. 2009, 48, 7752–7777. [Google Scholar] [CrossRef]
- Si, Y.; Samulski, E.T. Exfoliated graphene separated by platinum nanoparticles. Chem. Mater. 2008, 20, 6792–6797. [Google Scholar] [CrossRef]
- Bong, S.; Kim, Y.R.; Kim, I.; Woo, S.; Uhm, S.; Lee, J.; Kim, H. Graphene supported electrocatalysts for methanol oxidation. Electrochem. Commun. 2010, 12, 129–131. [Google Scholar] [CrossRef]
- Tiliakos, A.; Trefilov, A.M.; Tanasă, E.; Balan, A.; Stamatin, I. Laser-induced graphene as the microporous layer in proton exchange membrane fuel cells. Appl. Surf. Sci. 2020, 504, 144096. [Google Scholar] [CrossRef]
- Tiliakos, A.; Trefilov, A.M.; Tanasă, E.; Balan, A.; Stamatin, I. Space-Filling Supercapacitor Carpets: Highly scalable fractal architecture for energy storage. J. Power Sources 2018, 384, 145–155. [Google Scholar] [CrossRef]
- Dong, L.; Gari, R.R.S.; Li, Z.; Craig, M.M.; Hou, S. Graphene-supported platinum and platinum–ruthenium nanoparticles with high electrocatalytic activity for methanol and ethanol oxidation. Carbon 2010, 48, 781–787. [Google Scholar] [CrossRef]
- Yoo, B.M.; Shin, J.E.; Lee, H.D.; Park, H.B. Graphene and graphene oxide membranes for gas separation applications. Curr. Opin. Chem. Eng. 2017, 16, 39–47. [Google Scholar] [CrossRef]
- Mendoza, J.J.; Ledezma, R.; Gallardo, C.A.; Elias, A.; Elizalde, L.E. Covalent surface functionalization of carbon nanostructures via [2+1] cycloaddition microwave-assisted reactions. J. Mater. Sci. 2021, 56, 13524–13539. [Google Scholar] [CrossRef]
- Georgakilas, V.; Tiwari, J.N.; Kemp, K.C.; Perman, J.A.; Bourlinos, A.B.; Kim, K.S.; Zboril, R. Noncovalent functionalization of graphene and graphene oxide for energy materials, biosensing, catalytic, and biomedical applications. Chem. Rev. 2016, 116, 5464–5519. [Google Scholar] [CrossRef] [Green Version]
- Yap, P.L.; Kabiri, S.; Auyoong, Y.L.; Tran, D.N.; Losic, D. Tuning the multifunctional surface chemistry of reduced graphene oxide via combined elemental doping and chemical modifications. ACS Omega 2019, 4, 19787–19798. [Google Scholar] [CrossRef]
- Lee, J.Y.; Yung, T.Y.; Liu, L.K. The microwave-assisted ionic liquid nanocomposite synthesis: Platinum nanoparticles on graphene and the application on hydrogenation of styrene. Nanoscale Res. Lett. 2013, 8, 1–6. [Google Scholar] [CrossRef] [Green Version]
- Li, F.; Gao, X.; Xue, Q.; Li, S.; Chen, Y.; Lee, J.M. Reduced graphene oxide supported platinum nanocubes composites: One-pot hydrothermal synthesis and enhanced catalytic activity. Nanotechnology 2015, 26, 065603. [Google Scholar] [CrossRef]
- Nie, R.; Wang, J.; Wang, L.; Qin, Y.; Chen, P.; Hou, Z. Platinum supported on reduced graphene oxide as a catalyst for hydrogenation of nitroarenes. Carbon 2012, 50, 586–596. [Google Scholar] [CrossRef]
- Sahoo, P.K.; Sahoo, S.; Satpati, A.K.; Bahadur, D. Solvothermal synthesis of reduced graphene oxide/Au nanocomposite-modified electrode for the determination of inorganic mercury and electrochemical oxidation of toxic phenolic compounds. Electrochim. Acta 2015, 180, 1023–1032. [Google Scholar] [CrossRef]
- Marinoiu, A.; Carcadea, E.; Sacca, A.; Carbone, A.; Sisu, C.; Dogaru, A.; Raceanu, M.; Varlam, M. One-step synthesis of graphene supported platinum nanoparticles as electrocatalyst for PEM fuel cells. Int. J. Hydrog. Energy 2021, 46, 12242–12253. [Google Scholar] [CrossRef]
- Chen, D.; Feng, H.; Li, J. Graphene oxide: Preparation, functionalization, and electrochemical applications. Chem. Rev. 2012, 112, 6027–6053. [Google Scholar] [CrossRef]
- Modafferi, V.; Santangelo, S.; Fiore, M.; Fazio, E.; Triolo, C.; Patanè, S.; Ruffo, R.; Musolino, M.G. Transition metal oxides on reduced graphene oxide nanocomposites: Evaluation of physicochemical properties. J. Nanomater. 2019, 2019, 1703218. [Google Scholar] [CrossRef] [Green Version]
- Marinoiu, A.; Raceanu, M.; Carcadea, E.; Andrulevicius, M.; Tamuleviciene, A.; Tamulevicius, T.; Capris, C.; Varlam, M. Efficient method to obtain Platinum–Cobalt supported on graphene oxide and electrocatalyst development. Int. J. Hydrog. Energy 2020, 45, 26226–26237. [Google Scholar] [CrossRef]
- Marinoiu, A.; Raceanu, M.; Carcadea, E.; Varlam, M.; Stefanescu, I. Iodinated carbon materials for oxygen reduction reaction in proton exchange membrane fuel cell. Scalable synthesis and electrochemical performances. Arab. J. Chem. 2019, 12, 868–880. [Google Scholar] [CrossRef]
- Fei, H.; Dong, J.; Wan, C.; Zhao, Z.; Xu, X.; Lin, Z.; Wang, Y.; Liu, H.; Zang, K.; Luo, J.; et al. Microwave-assisted rapid synthesis of graphene-supported single atomic metals. Adv. Mater. 2018, 30, 1802146. [Google Scholar] [CrossRef]
- Oubraham, A.; Ion-Ebrasu, D.; Vasut, F.; Soare, A.; Sorlei, I.-S.; Marinoiu, A. pH-Dependence and Electrocatalytic Activity of Platinum-Functionalized Reduced Graphene Oxide Synthesized By Microwave Methods. In Proceedings of the 5th International Conference Emerging Technologies in Materials Engineering, Bucharest, Romania, 27–28 October 2022. [Google Scholar]
- Yilbas, B.S.; Ibrahim, A.; Ali, H.; Khaled, M.; Laoui, T. Hydrophobic and optical characteristics of graphene and graphene oxide films transferred onto functionalized silica particles deposited glass surface. Appl. Surf. Sci. 2018, 442, 213–223. [Google Scholar] [CrossRef]
- Delgado, A.V.; Ahualli, S.; Fernández, M.M.; González, M.A.; Iglesias, G.R.; Vivo-Vilches, J.F.; Jiménez, M.L. Geometrical properties of materials for energy production by salinity exchange. Environ. Chem. 2017, 14, 279–287. [Google Scholar] [CrossRef]
- Baturina, O.A.; Aubuchon, S.R.; Wynne, K.J. Thermal Stability in Air of Pt/C Catalysts and PEM Fuel Cell Catalyst Layers. Chem. Mater. 2006, 18, 1498–1504. [Google Scholar] [CrossRef]
- Davey, W.P. Precision measurements of the lattice constants of twelve common metals. Phys. Rev. 1925, 25, 753. [Google Scholar] [CrossRef]
- Sun, L.; Luo, Y.; Li, M.; Hu, G.; Xu, Y.; Tang, T.; Wen, J.; Li, X.; Wang, L. Role of Pyridinic-N for Nitrogen-doped graphene quantum dots in oxygen reaction reduction. J. Colloid Interface Sci. 2017, 508, 154–158. [Google Scholar] [CrossRef]
- Fan, M.; Zhu, C.; Yang, J.; Sun, D. Facile self-assembly N-doped graphene quantum dots/graphene for oxygen reduction reaction. Electrochim. Acta 2016, 216, 102–109. [Google Scholar] [CrossRef]
- Selvaganesh, S.V.; Dhanasekaran, P.; Chetty, R.; Bhat, S.D. Microwave assisted poly (3, 4-ethylenedioxythiophene)–reduced graphene oxide nanocomposite supported Pt as durable electrocatalyst for polymer electrolyte fuel cells. N. J. Chem. 2018, 42, 10724–10732. [Google Scholar] [CrossRef]
- Lim, S.Y.; Kim, S.I.; Lee, M.S.; Bak, S.J.; Lee, D.H.; Kwon, S.H.; Kim, T. Effect of uniformity and surface morphology of Pt nanoparticles to enhance oxygen reduction reaction in polymer electrolyte membrane fuel cells. Int. J. Hydrog. Energy 2022, 47, 29456–29466. [Google Scholar] [CrossRef]
- Nair, A.S.; Jafri, R.I. A facile one-step microwave synthesis of Pt deposited on N & P co-doped graphene intercalated carbon black-An efficient cathode electrocatalyst for PEM fuel cell. Int. J. Hydrog. Energy 2023, 48, 3653–3664. [Google Scholar]
- Wang, H.; Wang, W.; Xu, Y.Y.; Dong, S.; Xiao, J.; Wang, F.; Liu, H.; Xia, B.Y. Hollow nitrogen-doped carbon spheres with Fe3O4 nanoparticles encapsulated as a highly active oxygen-reduction catalyst. ACS Appl. Mater. Interfaces 2017, 9, 10610–10617. [Google Scholar] [CrossRef]
- Zhou, R.; Zheng, Y.; Jaroniec, M.; Shi Zhang Qiao, S.Z. Determination of Electron Transfer Number for Oxygen Reduction Reaction: From Theory to Experiment. ACS Appl. Mater. Interfaces 2016, 6, 4720–4728. [Google Scholar] [CrossRef]
- Talukder, N.; Wang, Y.; Nunna, B.B.; Lee, E.S. An In-Depth Exploration of the Electrochemical Oxygen Reduction Reaction (ORR) Phenomenon on Carbon-Based Catalysts in Alkaline and Acidic Mediums. Catalysts 2022, 12, 791. [Google Scholar] [CrossRef]
- Ruiz-Camacho, B.; Palafox-Segoviano, J.A.; P_erez-Díaz, P.J.; Medina-Ramírez, A. Synthesis of supported Pt nanoparticles by sonication for ORR: Effect of the graphene oxide carbon composite. Int. J. Hydrog. Energy 2021, 46, 26027–26039. [Google Scholar] [CrossRef]


| Samples | pH | Pt (Wt.%) a by AAS | Pt (Wt.%) b by EDX |
|---|---|---|---|
| PtrGO1 | 3.3 | 4.1 | 4.3 |
| PtrGO2 | 11.9 | 2.0 | 2.2 |
| PtrGO3 | 7.2 | 6.5 | 5.7 |
| Element | Wt.% |
|---|---|
| C K | 73.2 |
| O K | 21.1 |
| Pt M | 5.7 |
| Totals | 100.0 |
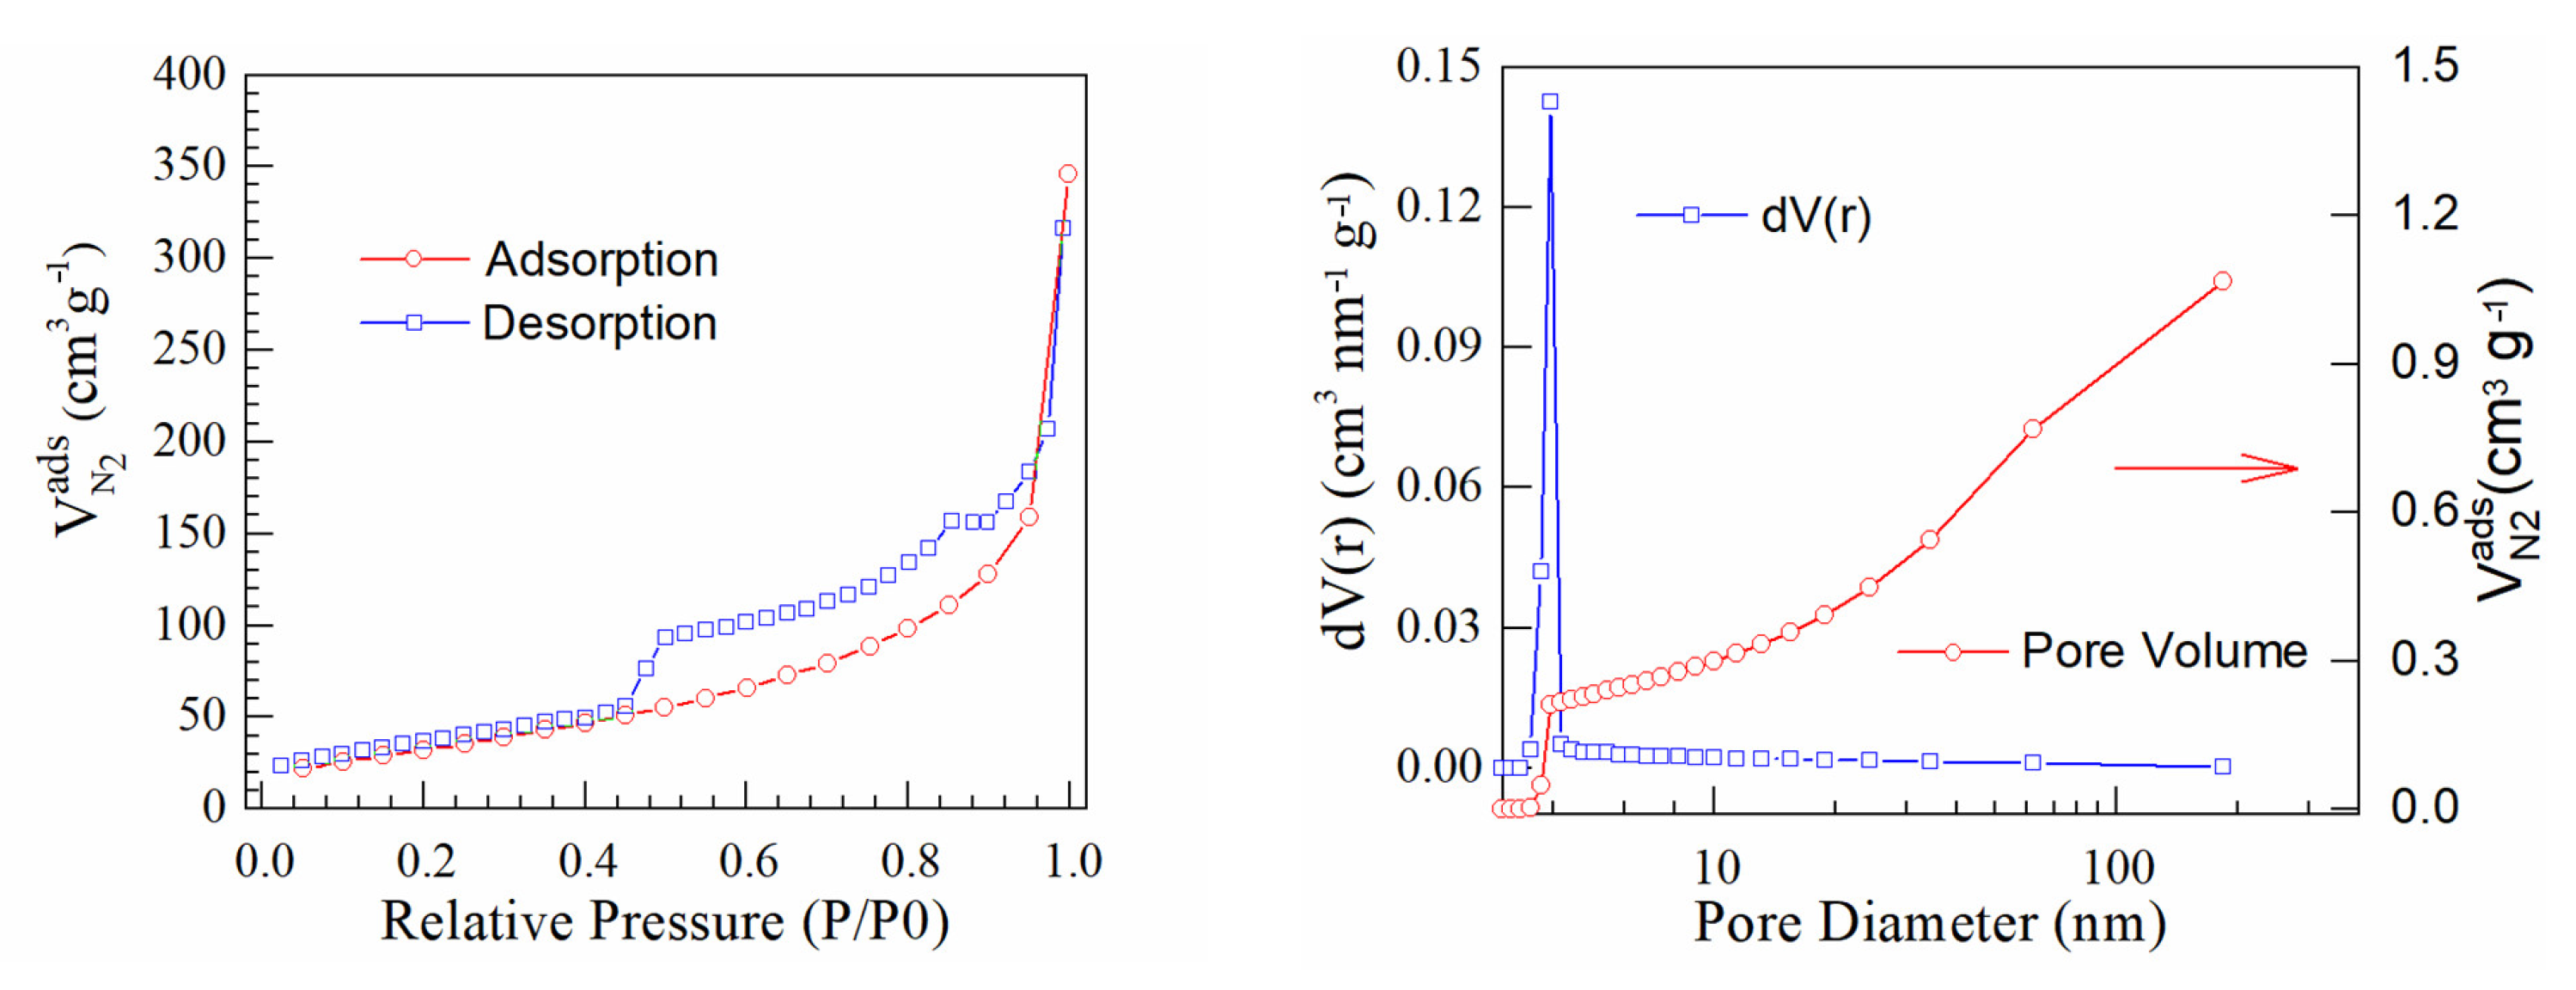
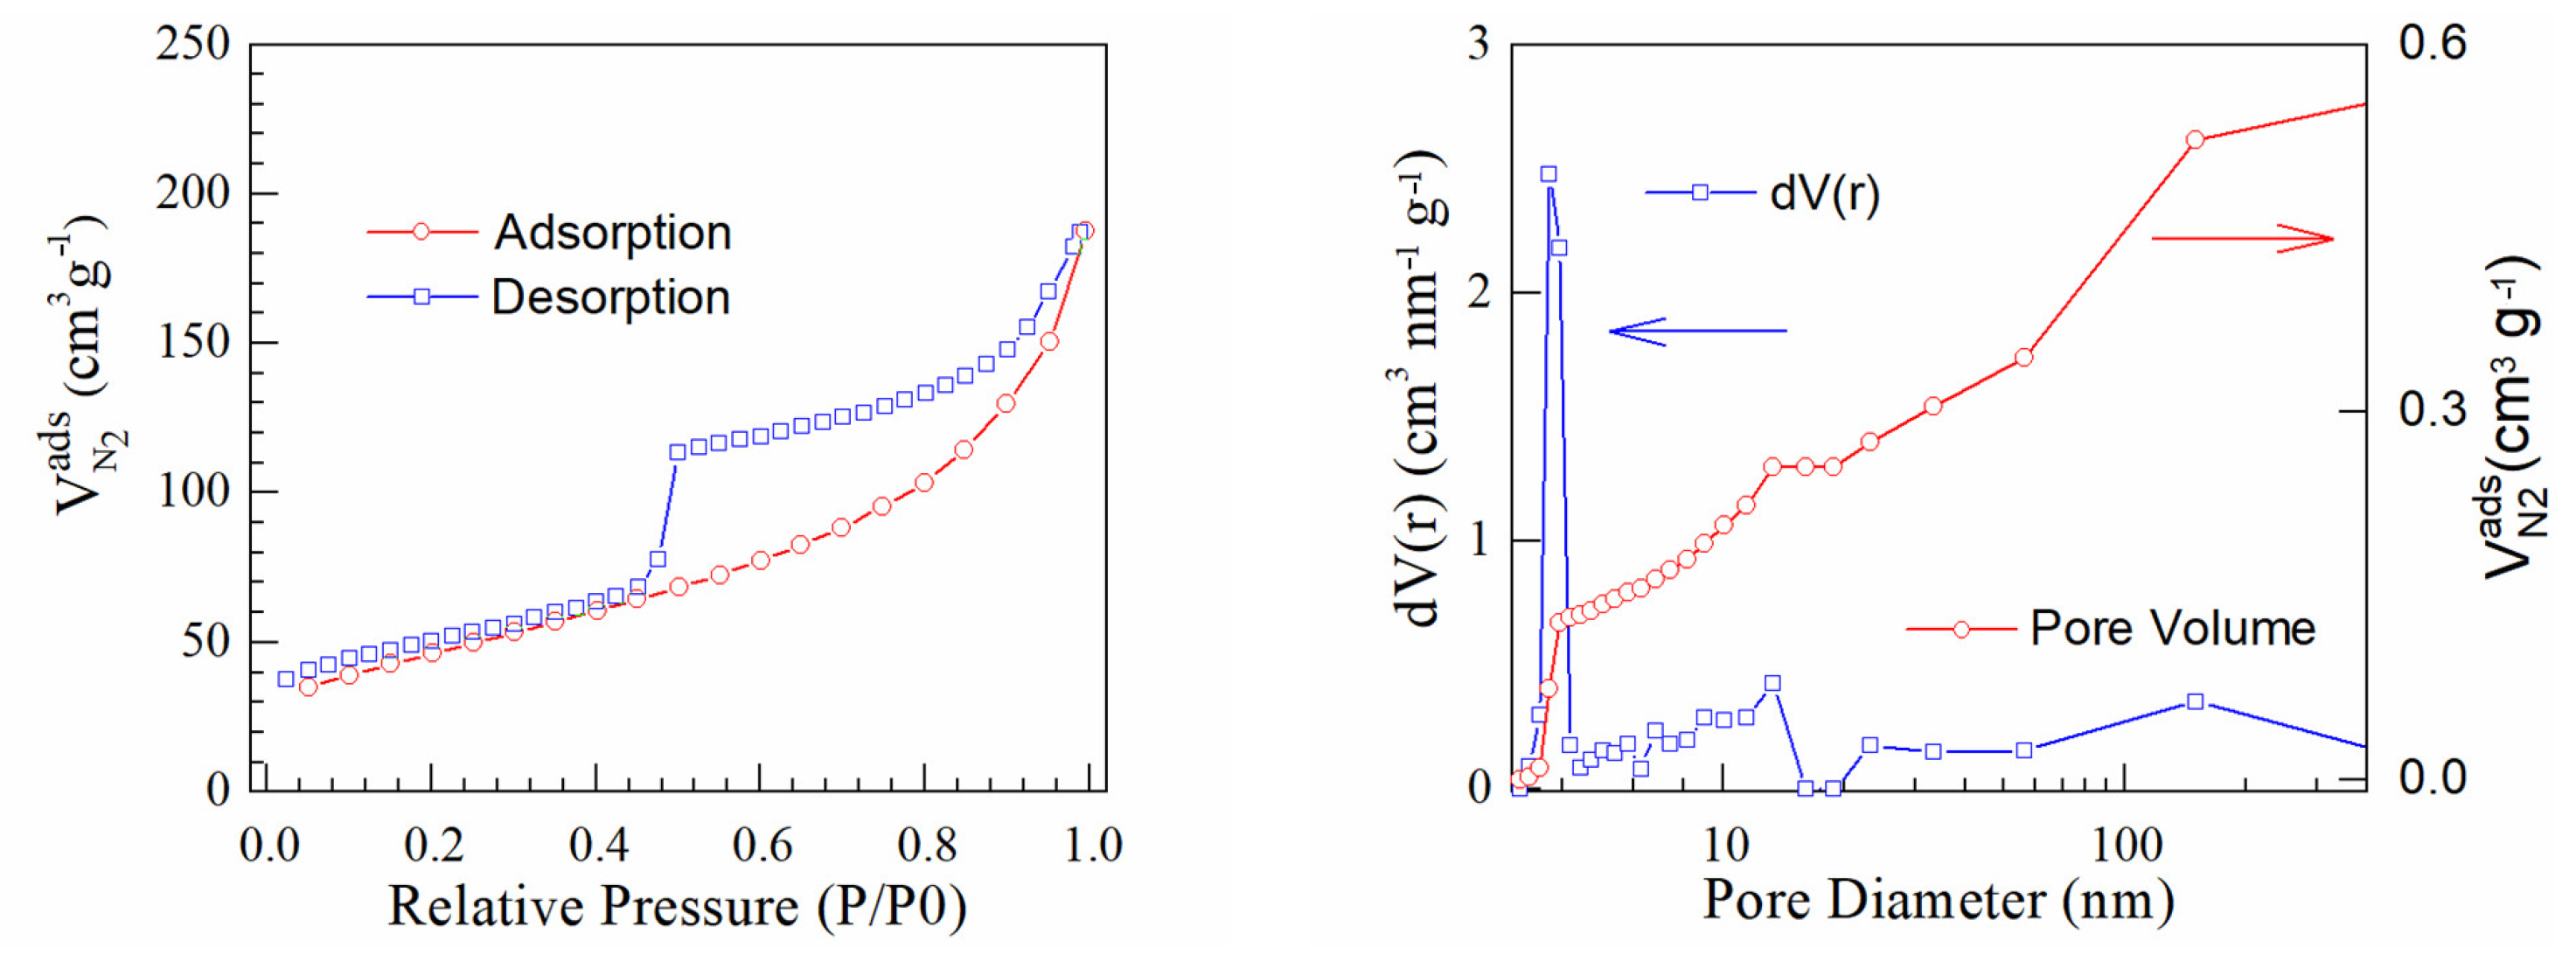
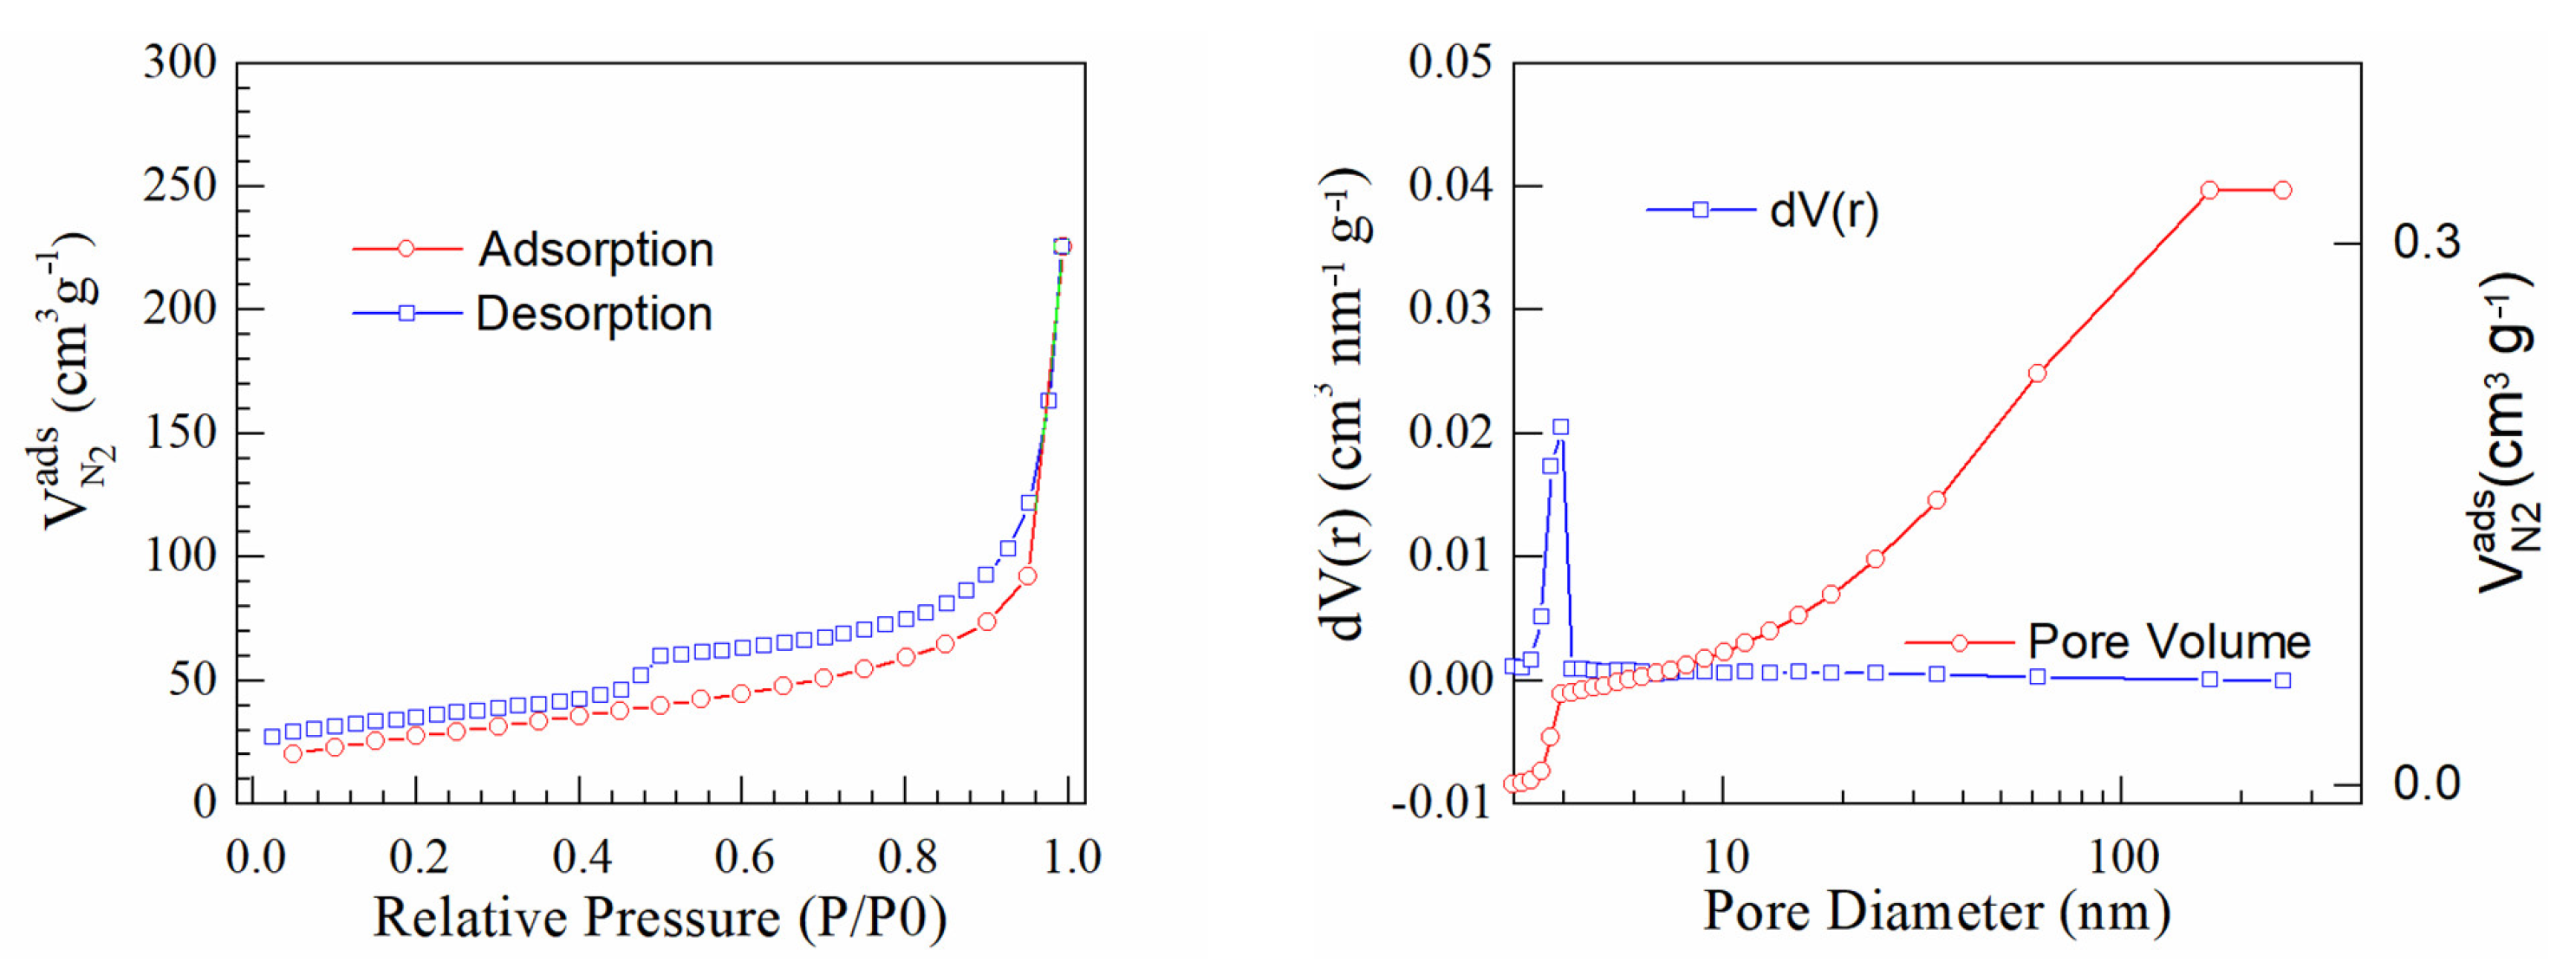
| Samples | Specific Surface (m2/g) | Pore Volume (cc/g) | Pore Radius (Å) |
|---|---|---|---|
| PtrGO1 | 128 | 0.568 | 18.543 |
| PtrGO2 | 166 | 0.289 | 19.672 |
| PtrGO3 | 98 | 0.329 | 19.667 |
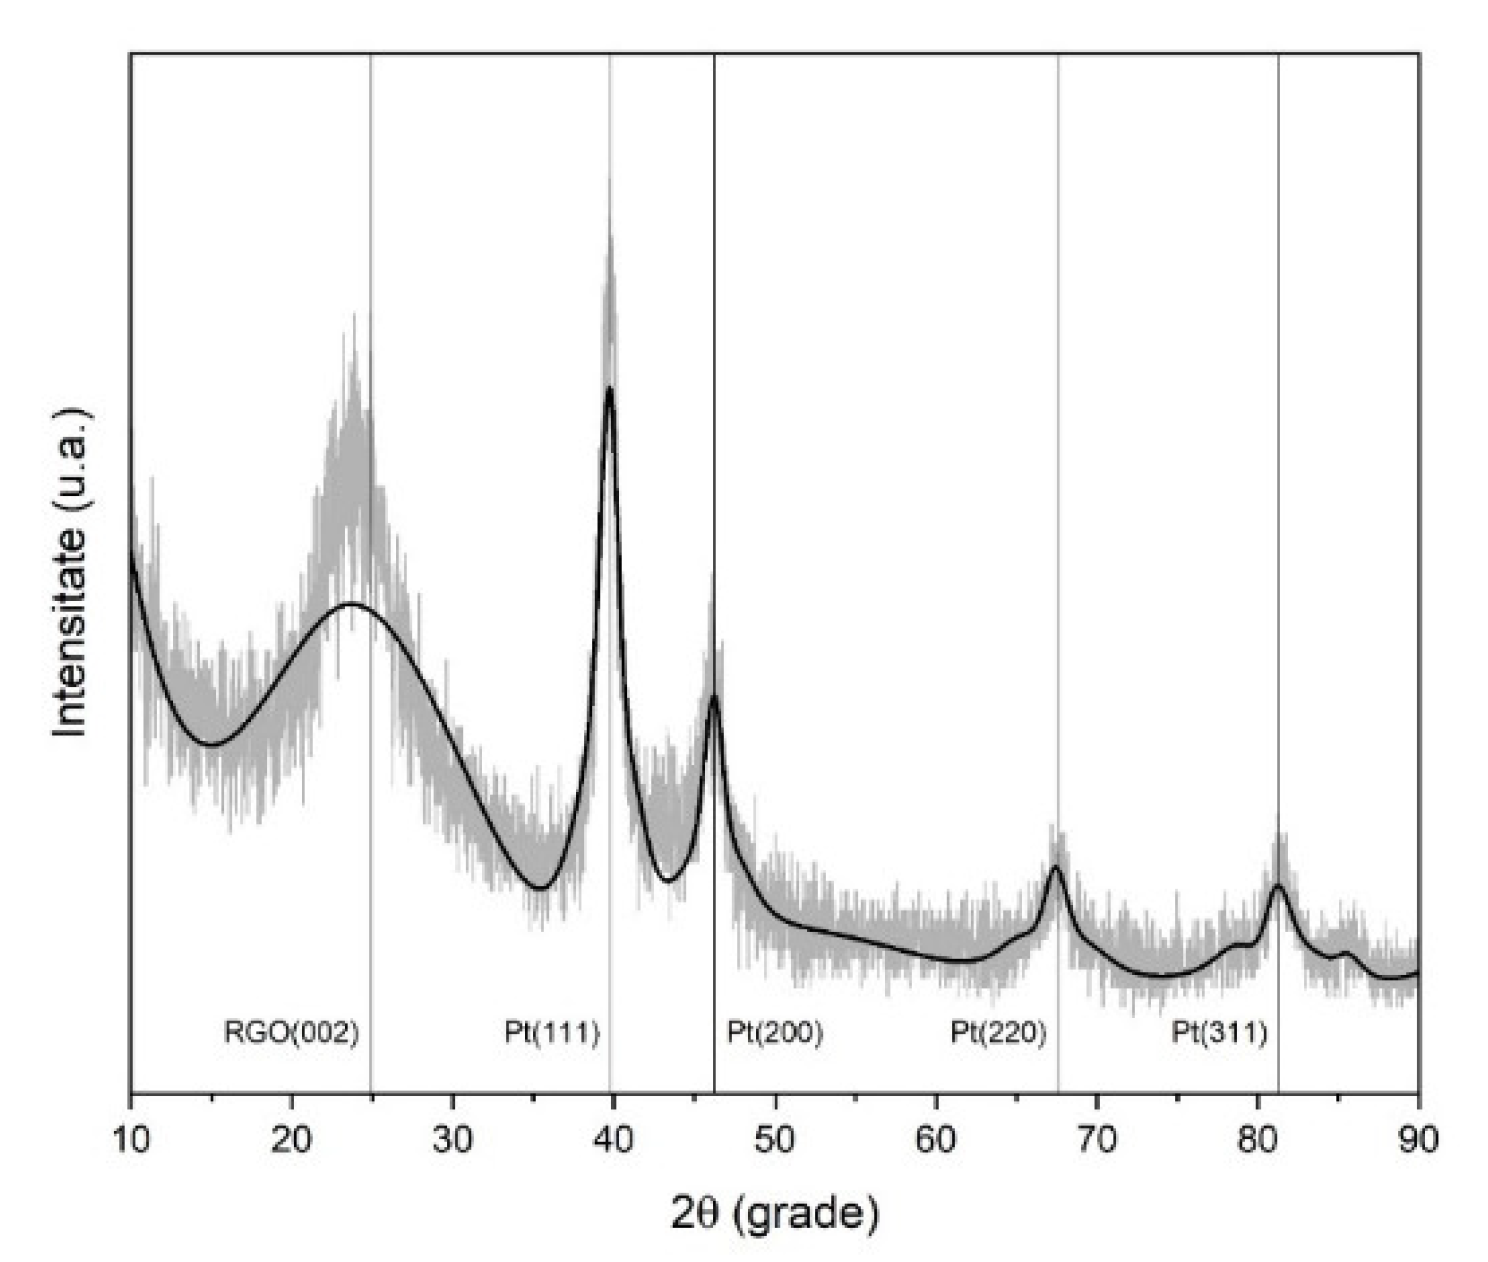
| a/a | 2ϑ (Deg.) | Miller (hkl) | d (Å) | FWHM (Deg.) | Size (Å) | Phase |
|---|---|---|---|---|---|---|
| 1 | 24.90 | 002 | 3.573 | 4.49 | 18.9 | rGO |
| 2 | 39.79 | 111 | 2.263 | 1.38 | 64.0 | Pt |
| 3 | 46.25 | 200 | 1.962 | 1.69 | 53.0 | Pt |
| 4 | 67.62 | 220 | 1.384 | 2.26 | 44.0 | Pt |
| 5 | 81.28 | 311 | 1.182 | 1.74 | 63.0 | Pt |
Disclaimer/Publisher’s Note: The statements, opinions and data contained in all publications are solely those of the individual author(s) and contributor(s) and not of MDPI and/or the editor(s). MDPI and/or the editor(s) disclaim responsibility for any injury to people or property resulting from any ideas, methods, instructions or products referred to in the content. |
© 2023 by the authors. Licensee MDPI, Basel, Switzerland. This article is an open access article distributed under the terms and conditions of the Creative Commons Attribution (CC BY) license (https://creativecommons.org/licenses/by/4.0/).
Share and Cite
Oubraham, A.; Ion-Ebrasu, D.; Vasut, F.; Soare, A.; Sorlei, I.-S.; Marinoiu, A. Platinum-Functionalized Graphene Oxide: One-Pot Synthesis and Application as an Electrocatalyst. Materials 2023, 16, 1897. https://doi.org/10.3390/ma16051897
Oubraham A, Ion-Ebrasu D, Vasut F, Soare A, Sorlei I-S, Marinoiu A. Platinum-Functionalized Graphene Oxide: One-Pot Synthesis and Application as an Electrocatalyst. Materials. 2023; 16(5):1897. https://doi.org/10.3390/ma16051897
Chicago/Turabian StyleOubraham, Anisoara, Daniela Ion-Ebrasu, Felicia Vasut, Amalia Soare, Ioan-Sorin Sorlei, and Adriana Marinoiu. 2023. "Platinum-Functionalized Graphene Oxide: One-Pot Synthesis and Application as an Electrocatalyst" Materials 16, no. 5: 1897. https://doi.org/10.3390/ma16051897