

Analysis of Non-Destructive Indicating Properties for Predicting Compressive Strengths of Dendrocalamus sericeus Munro Bamboo Culms
 , and
, and
Abstract
:1. Introduction
2. Materials and Methodology
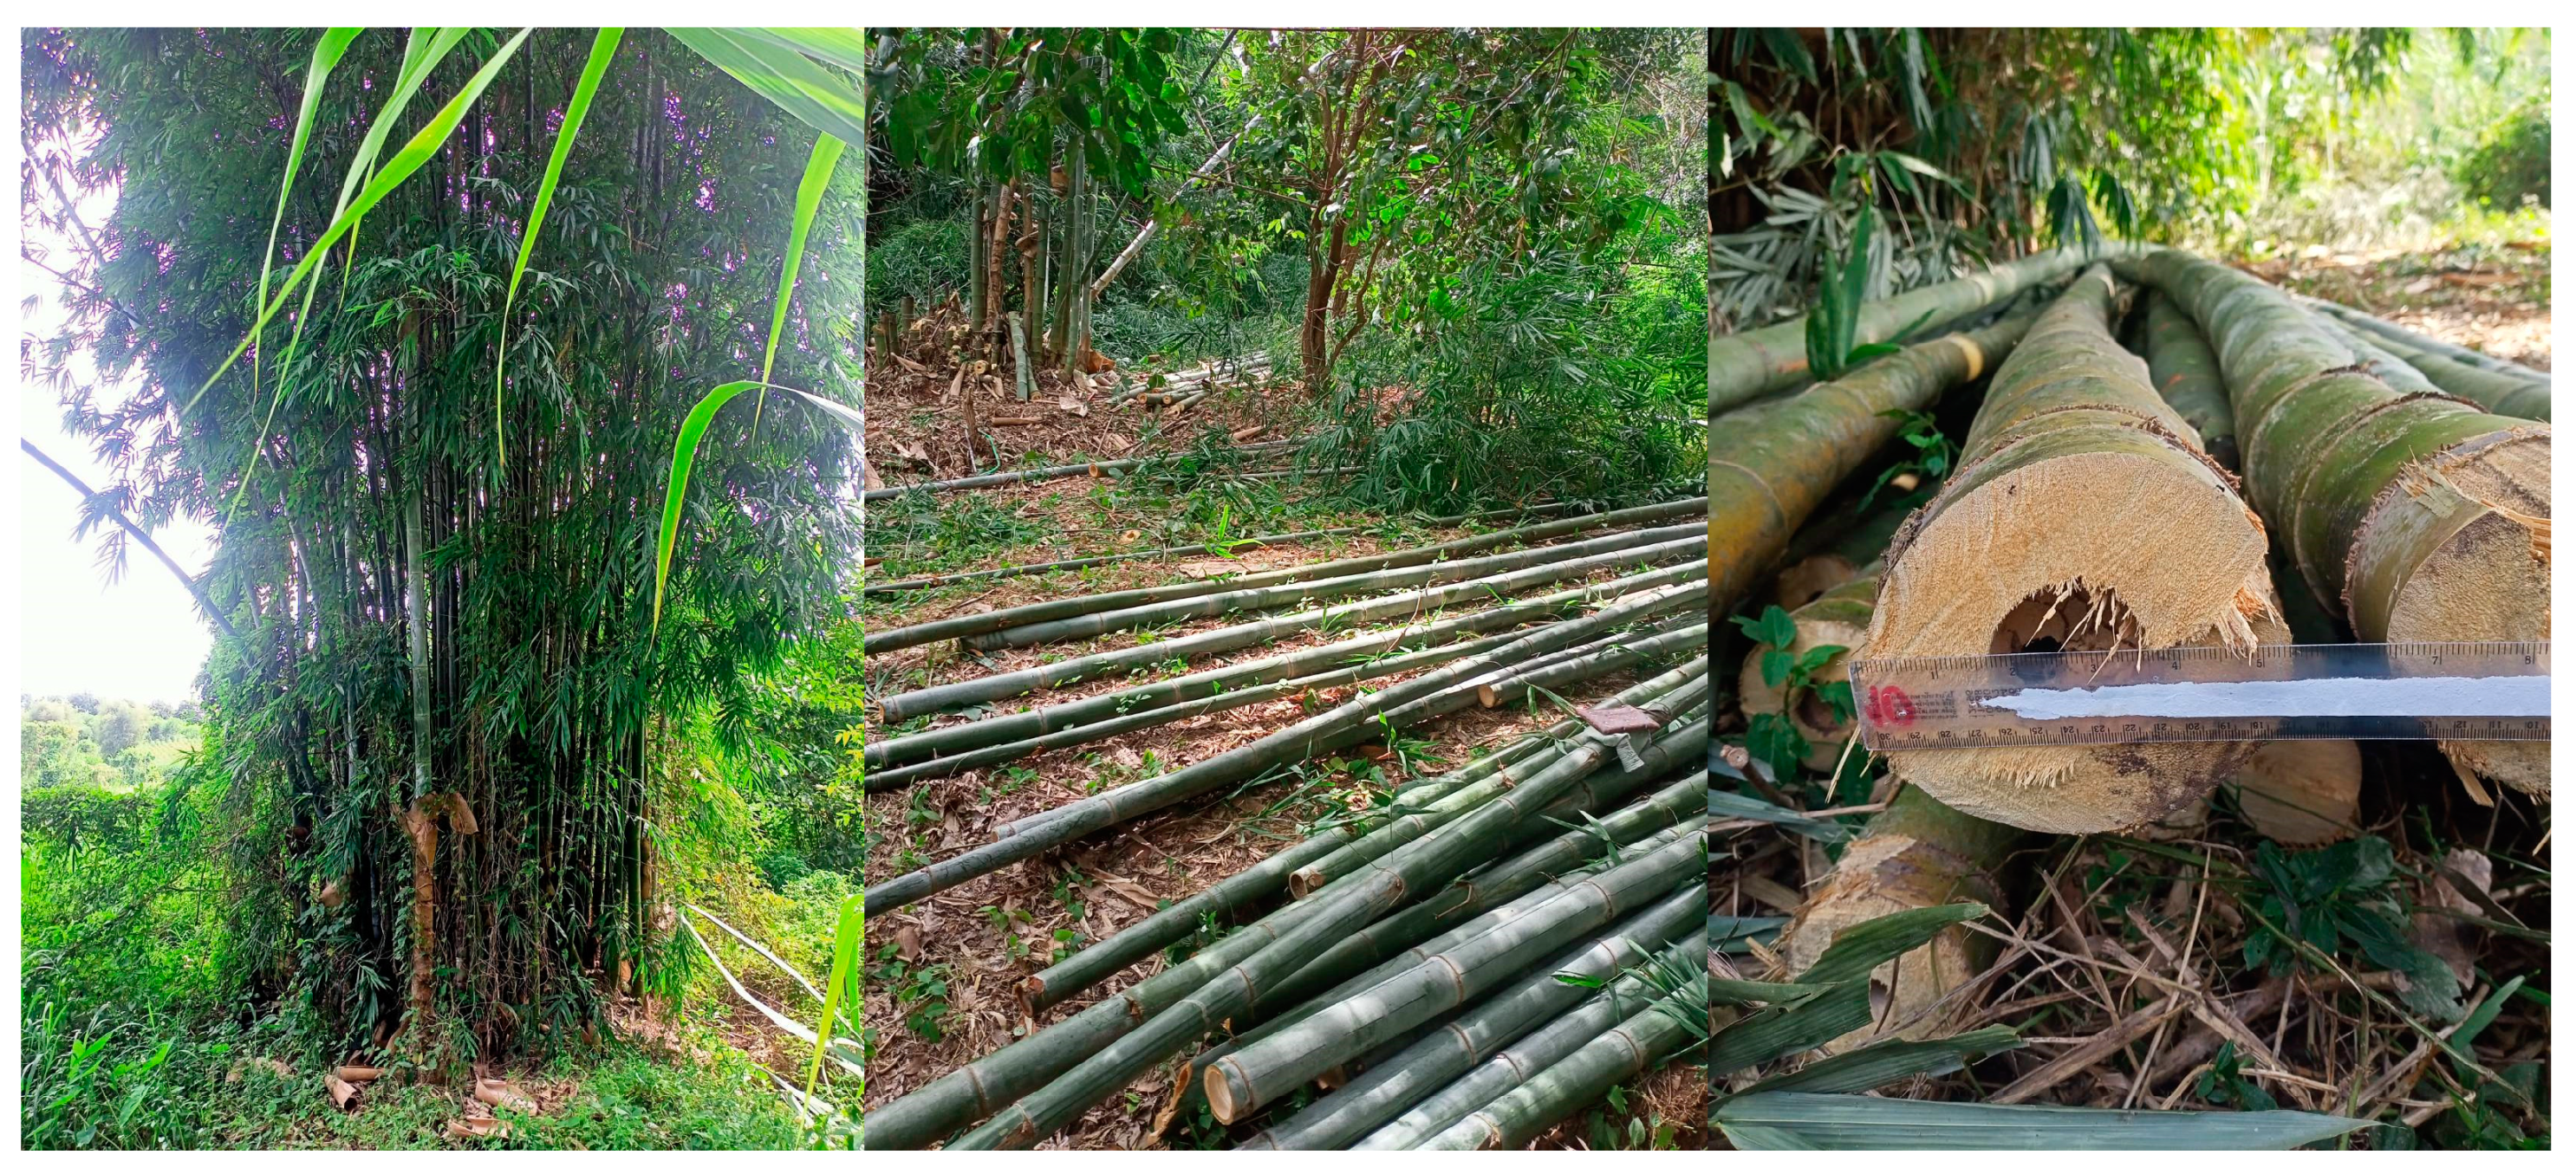
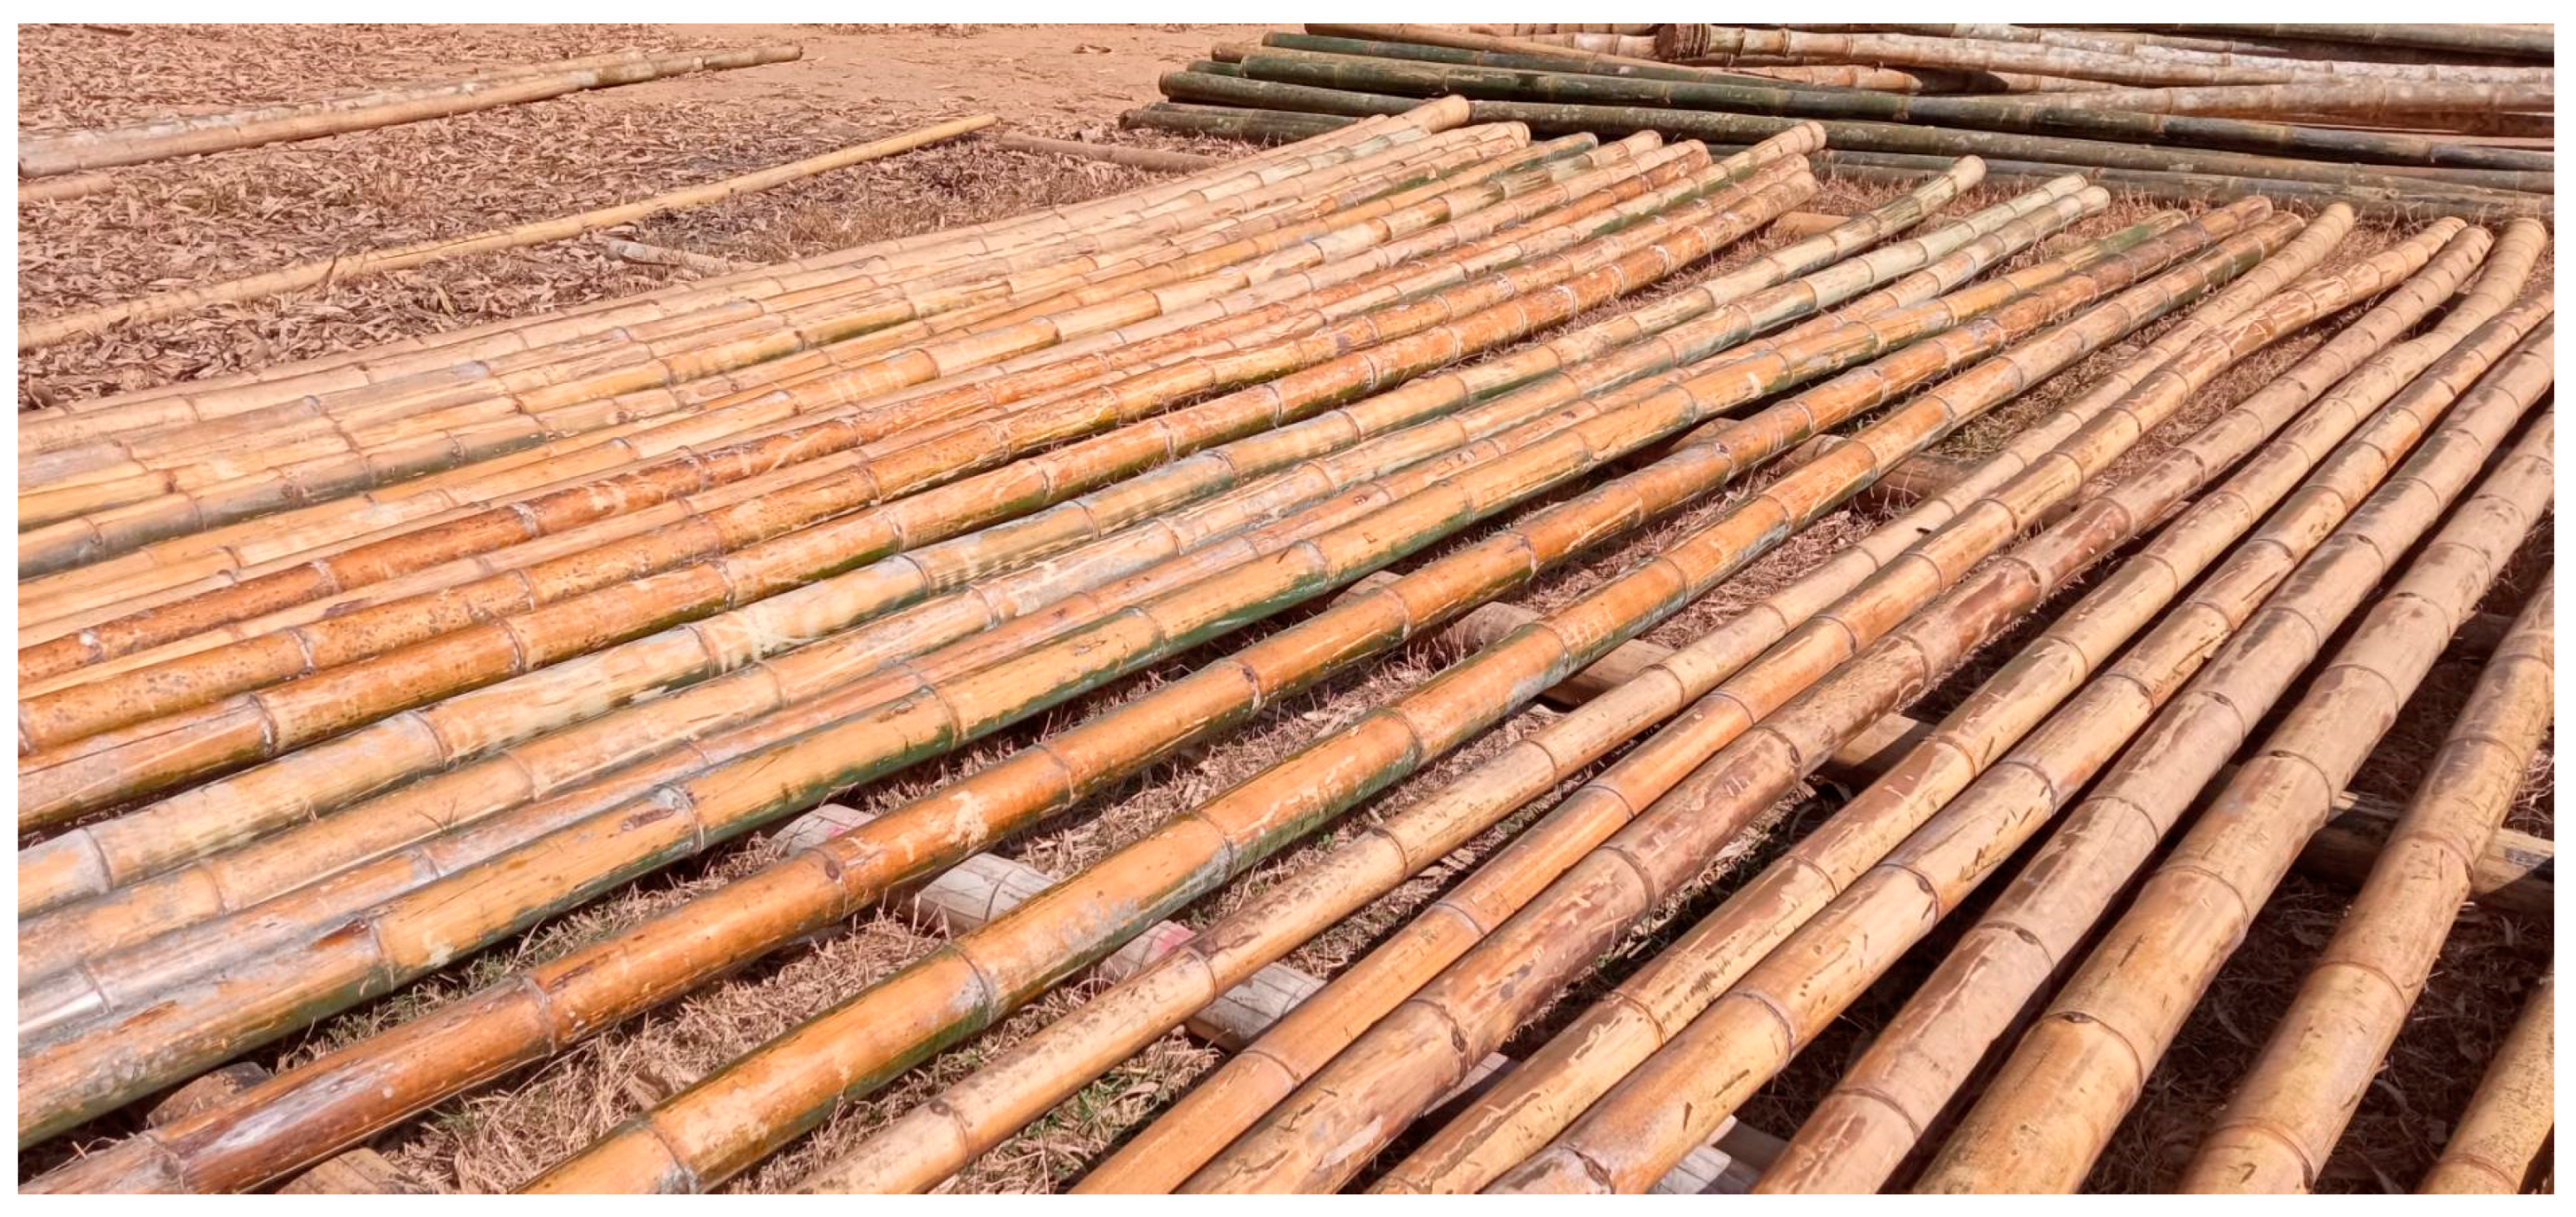
2.1. Sample Preparation
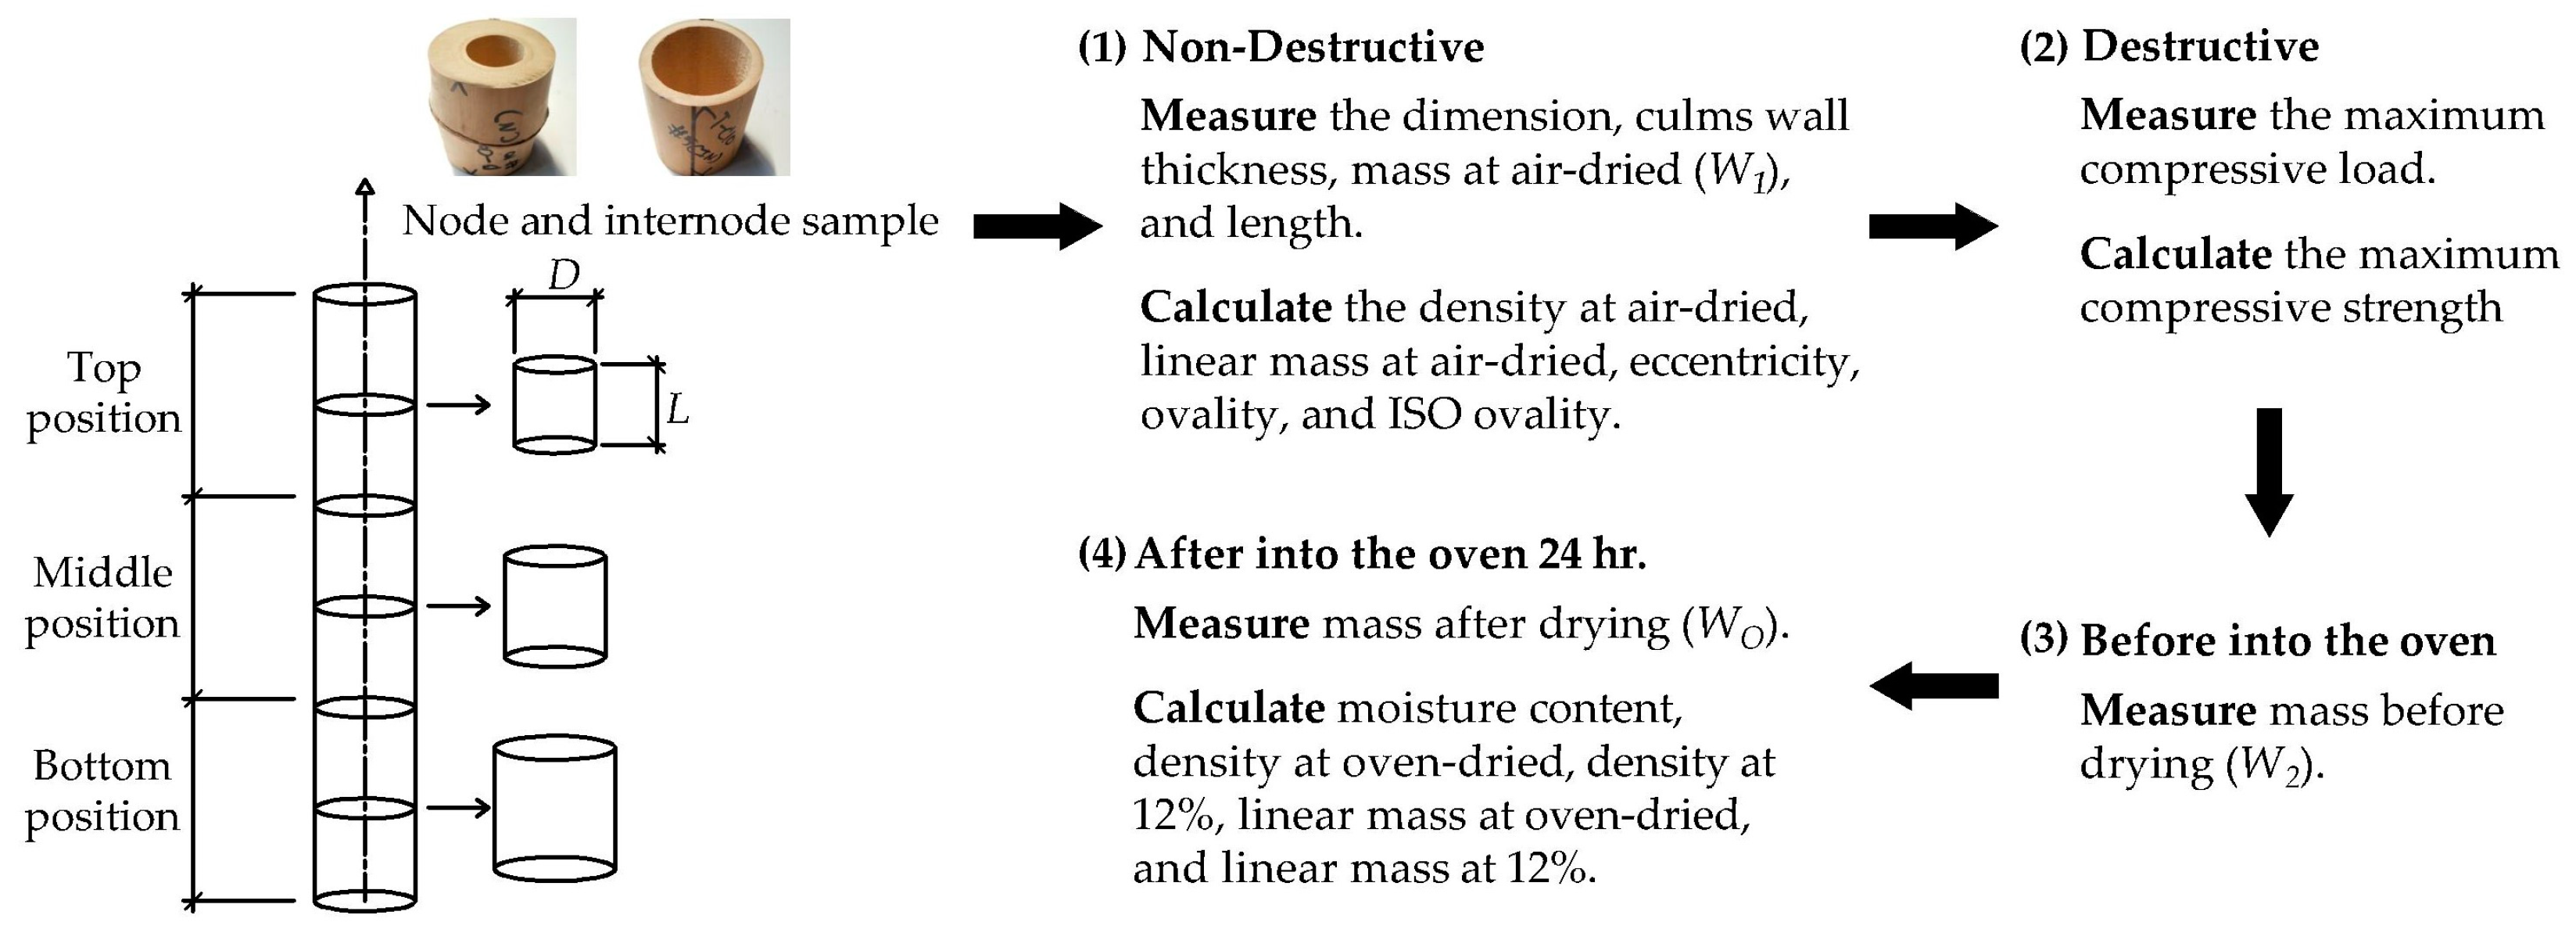
2.2. Measurement and Calculation of Indicating Properties
| Air-dried density: | (2) | |
| Oven-dried density: | (3) | |
| Density at 12% moisture content: | (4) | |
| Air-dried linear mass: | (5) | |
| Oven-dried linear mass: | (6) | |
| Linear mass at 12% moisture content: | (7) |
| Eccentricity: | (8) | |
| Ovality: | (9) | |
| ISO Ovality: | (10) |
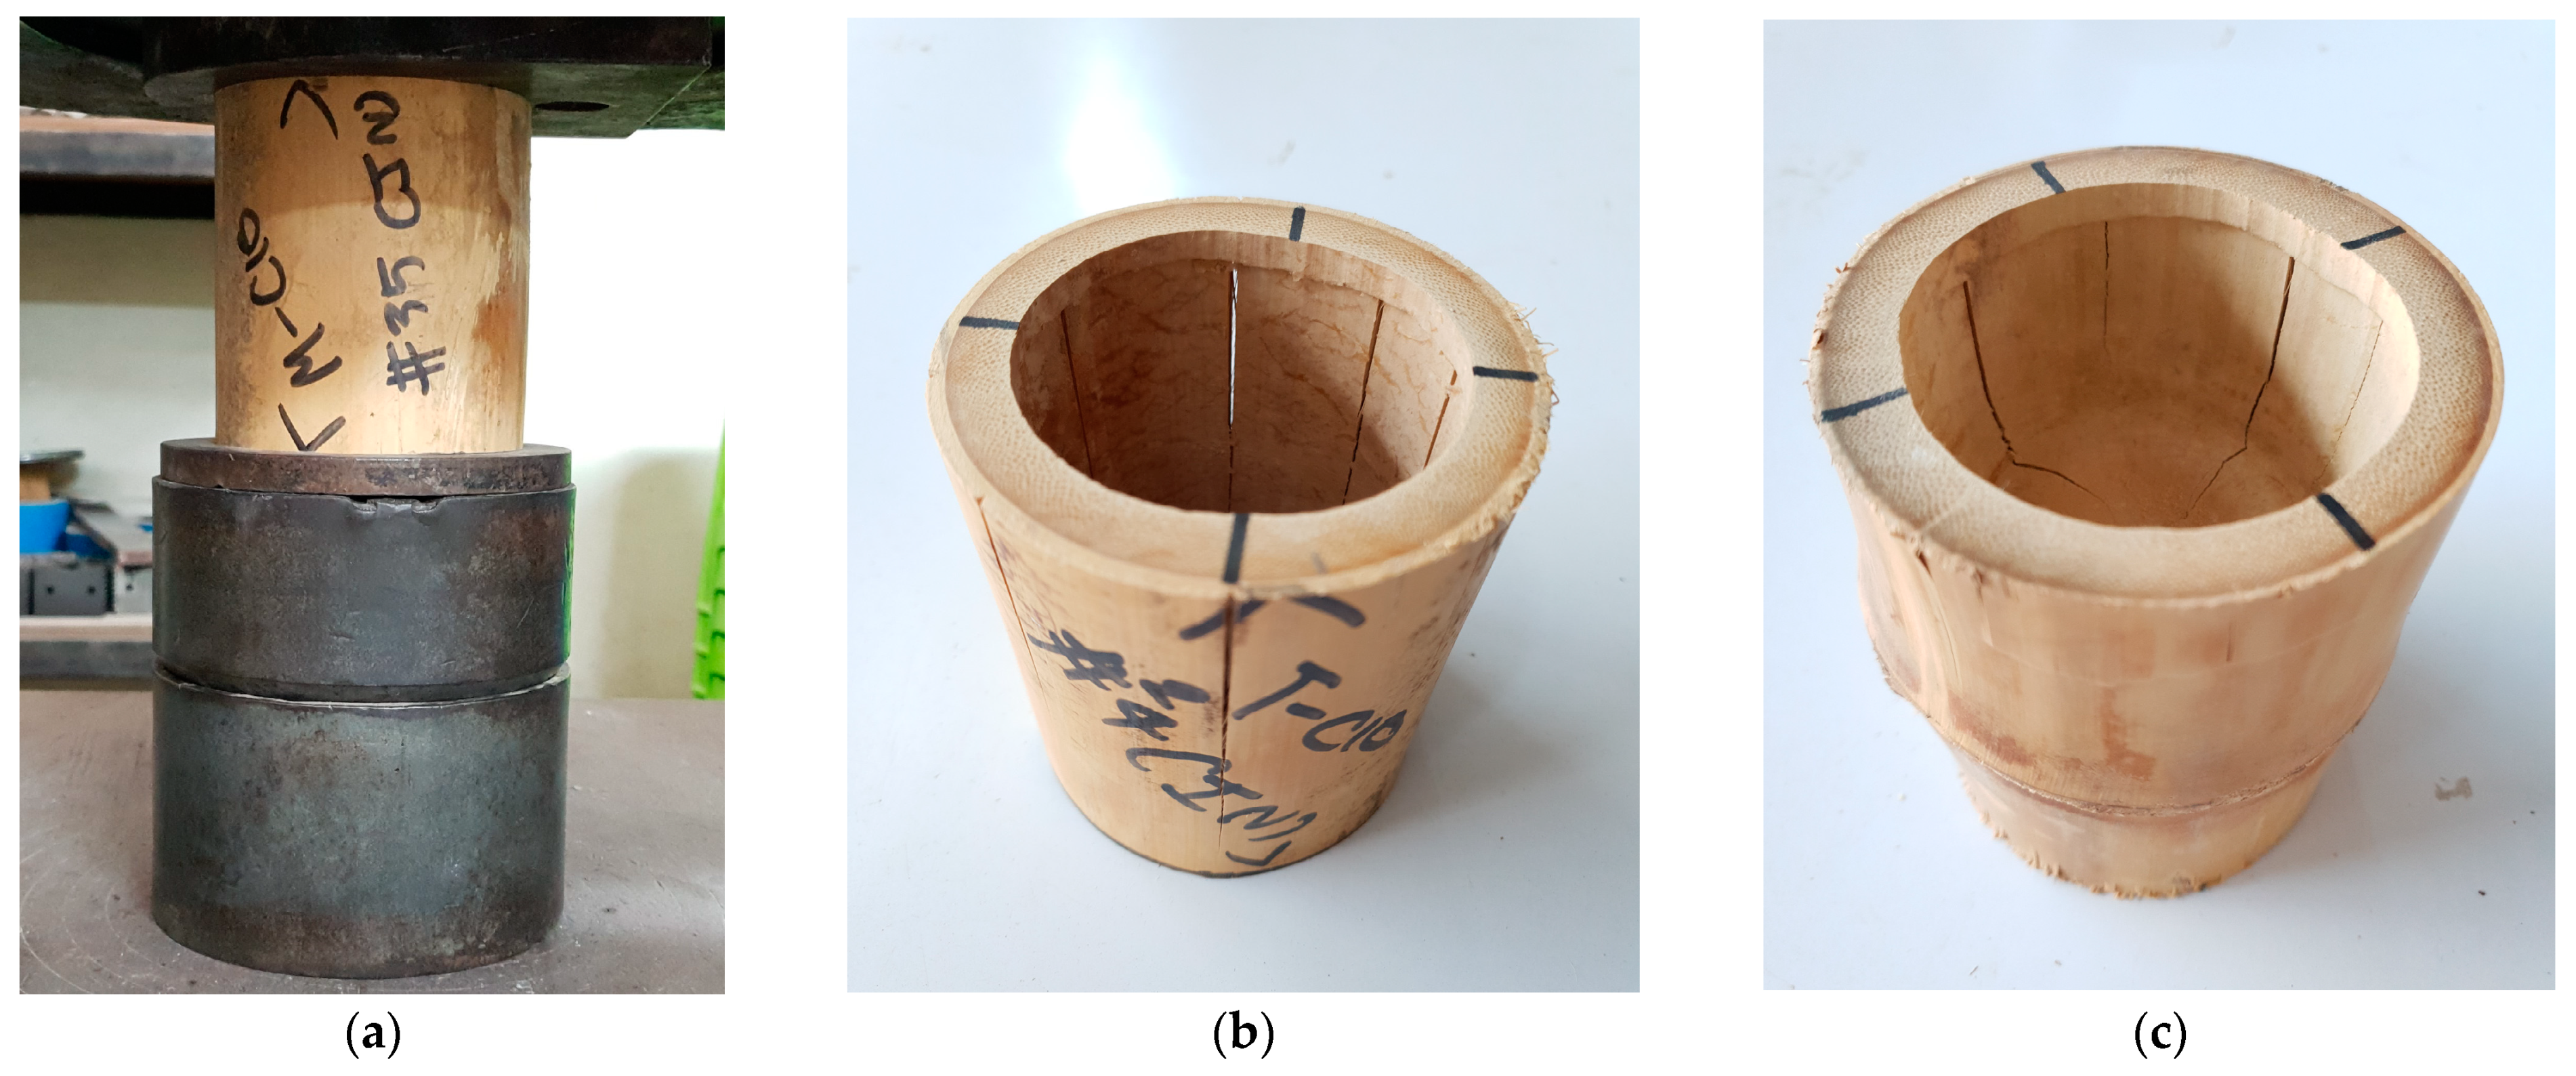
2.3. Compressive Tests
2.4. Correlation Analysis between the Indicating Properties and the Compressive Strengths
2.5. Simple and Multiple Linear Regression Analysis
2.6. Structural Grading
3. Results and Discussion–Physical and Mechanical Properties
3.1. Data Frequency Distribution
3.2. Effect of Node Inclusion and Position of the Bamboo Culm
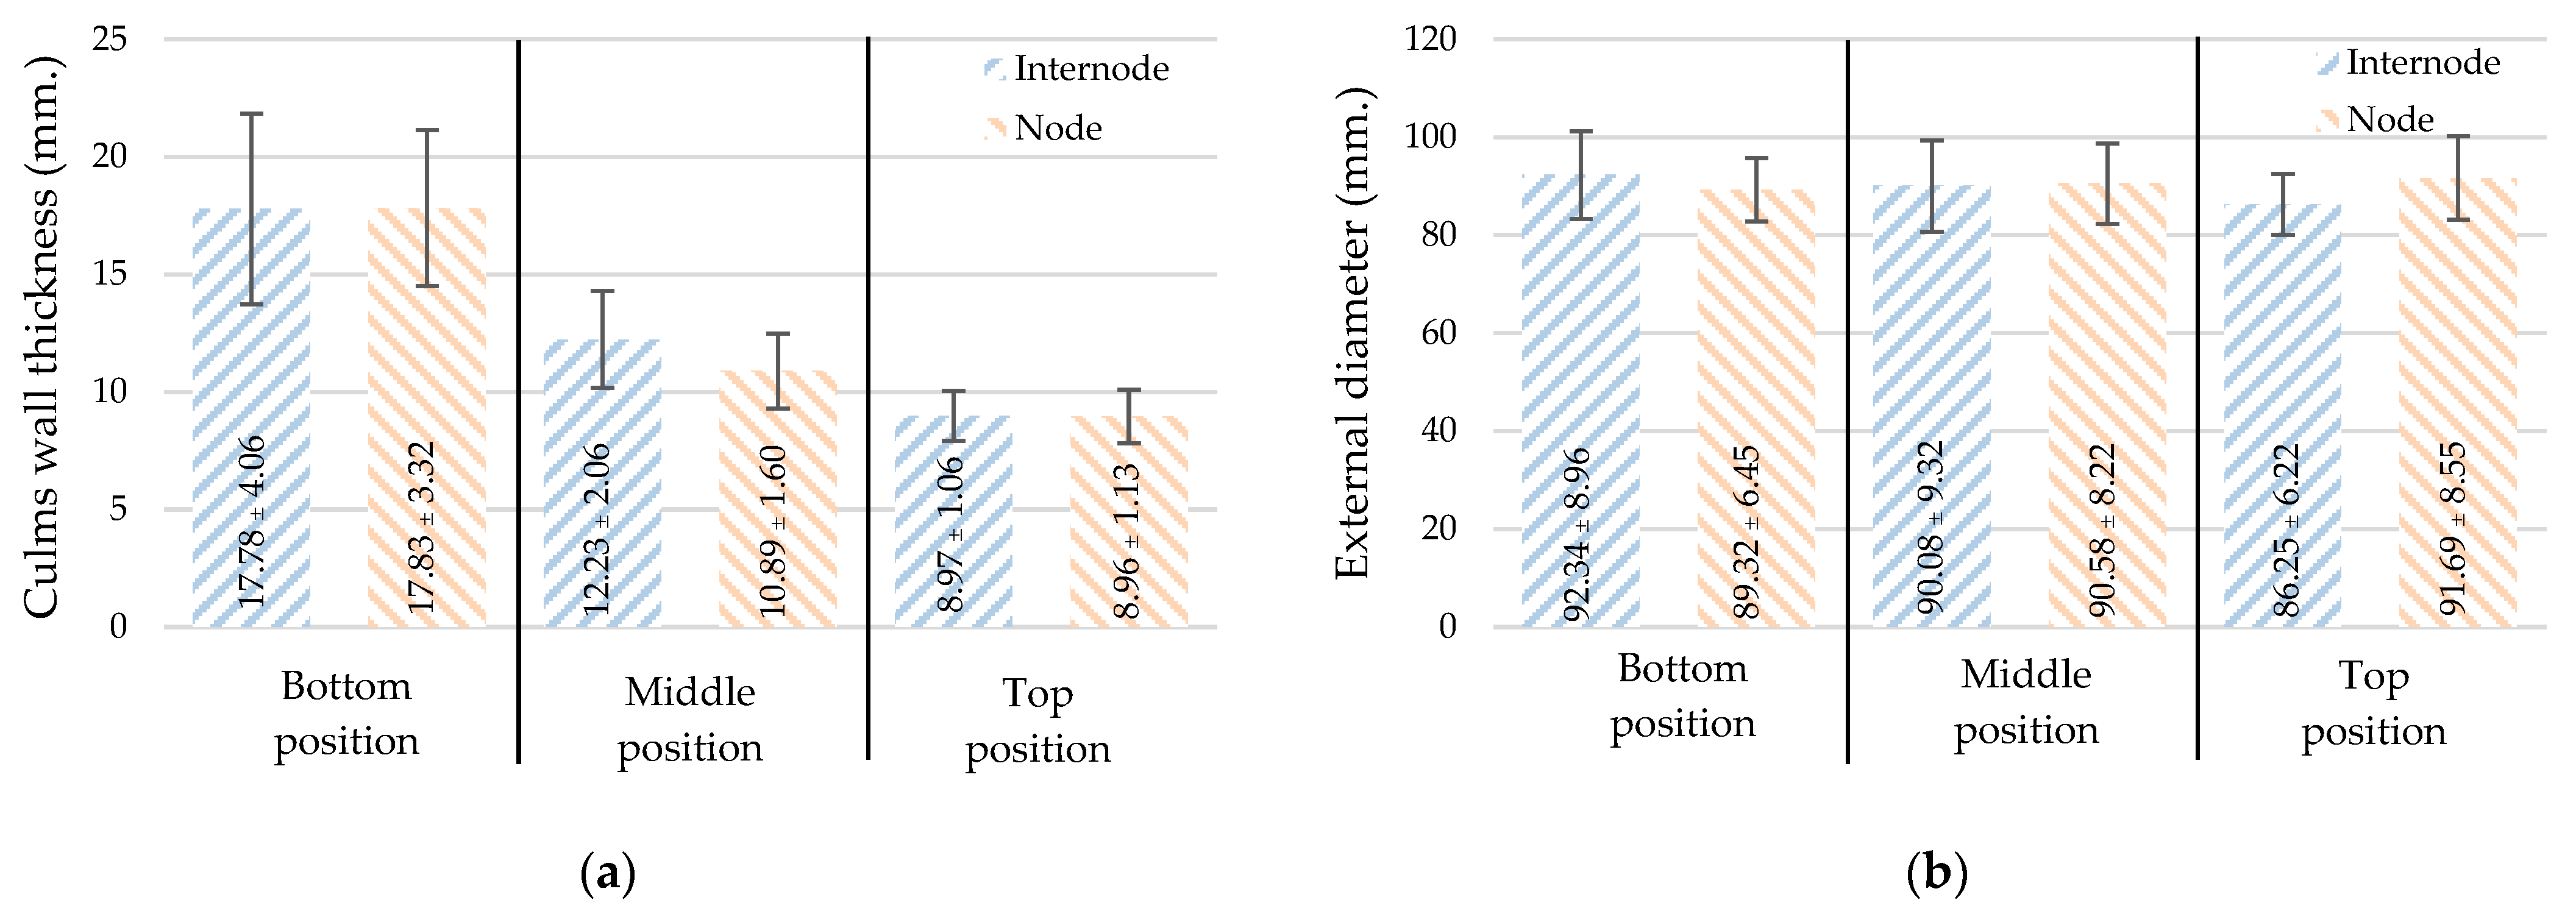
3.2.1. Dimensions
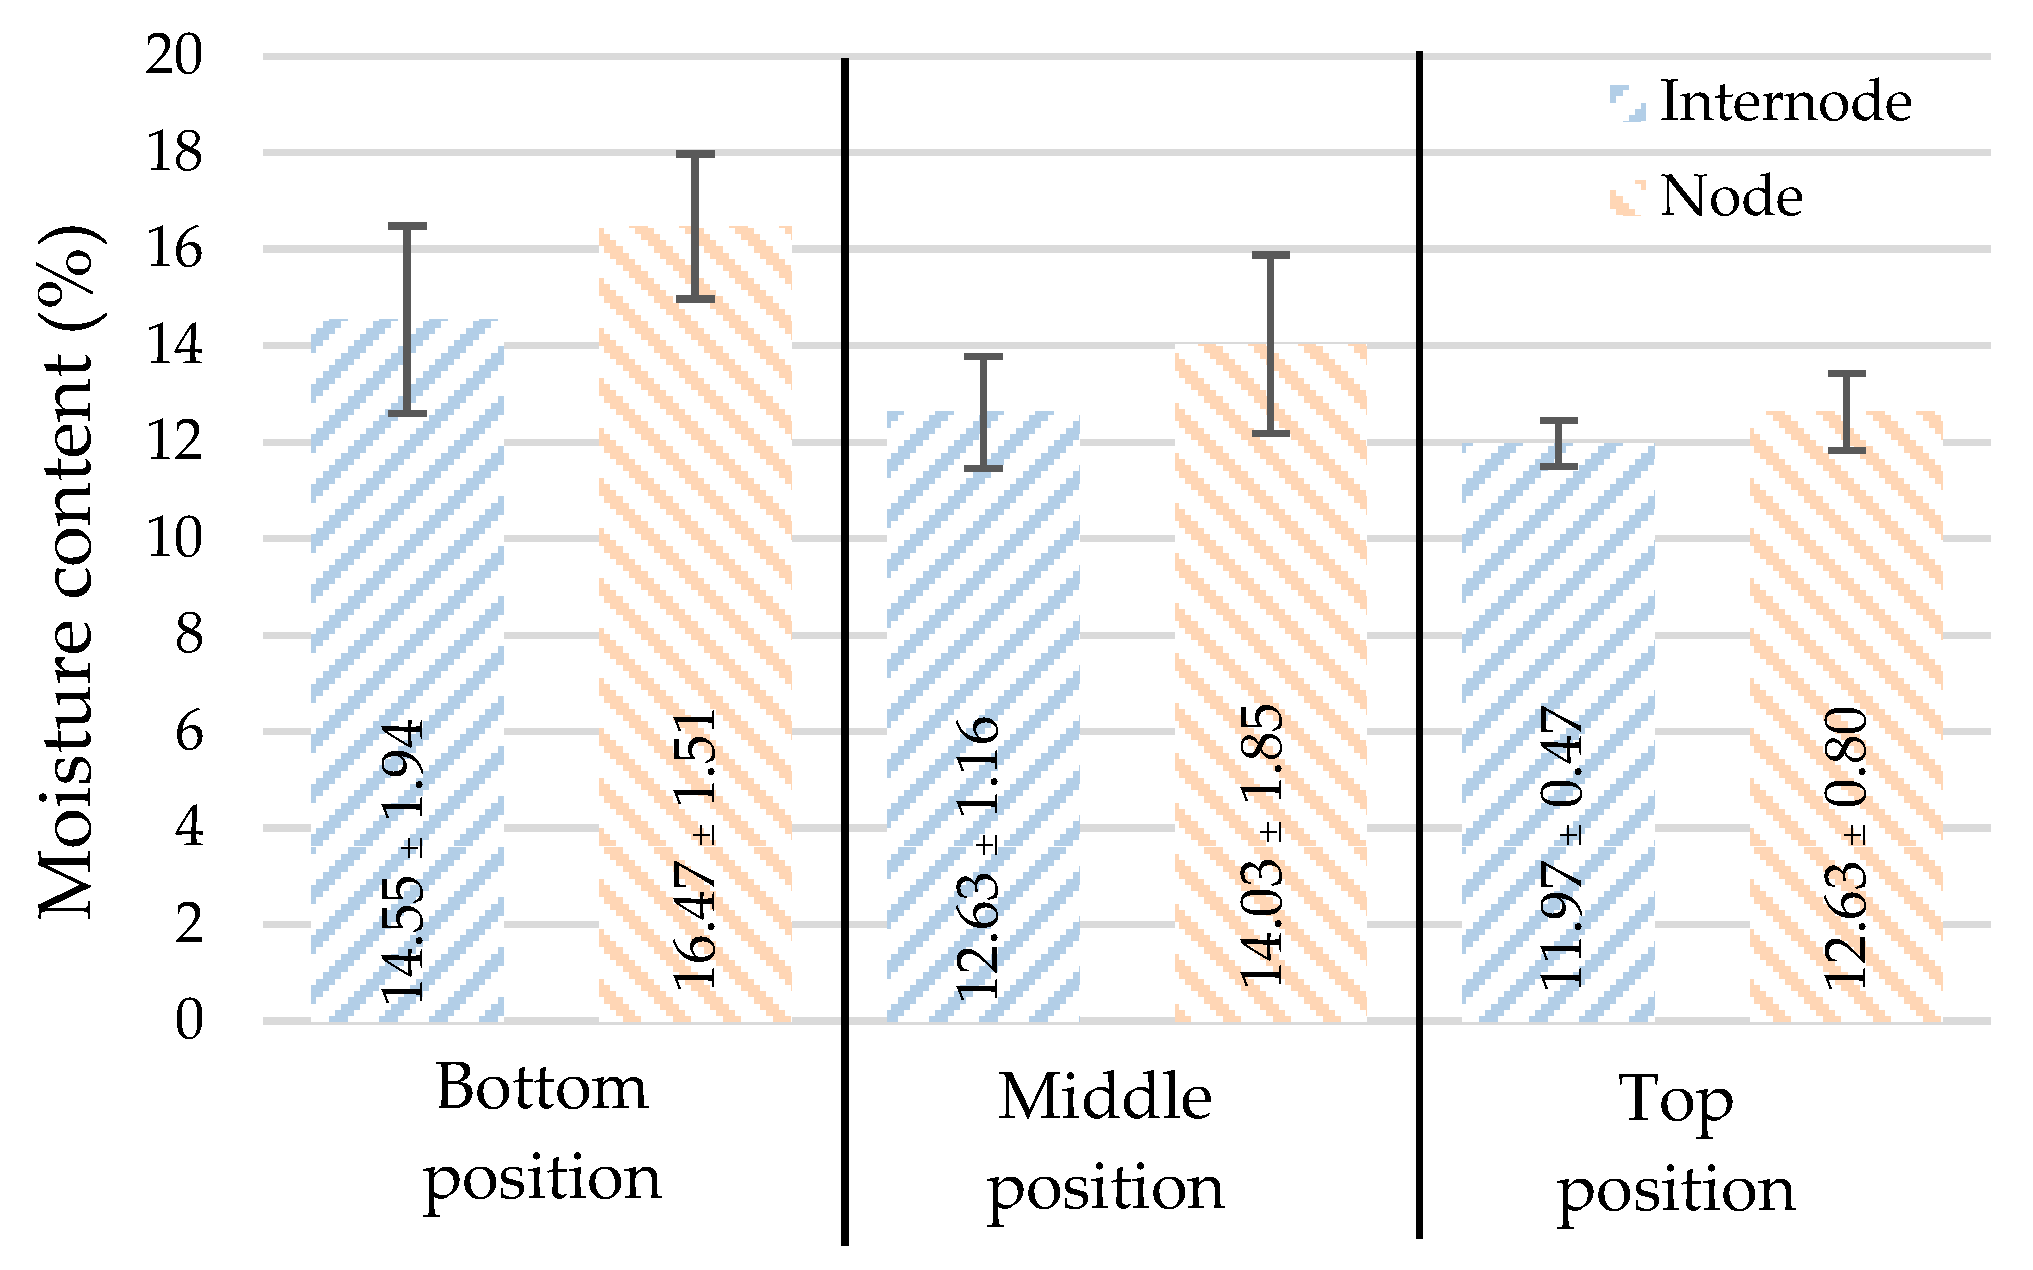
3.2.2. Moisture Content ()
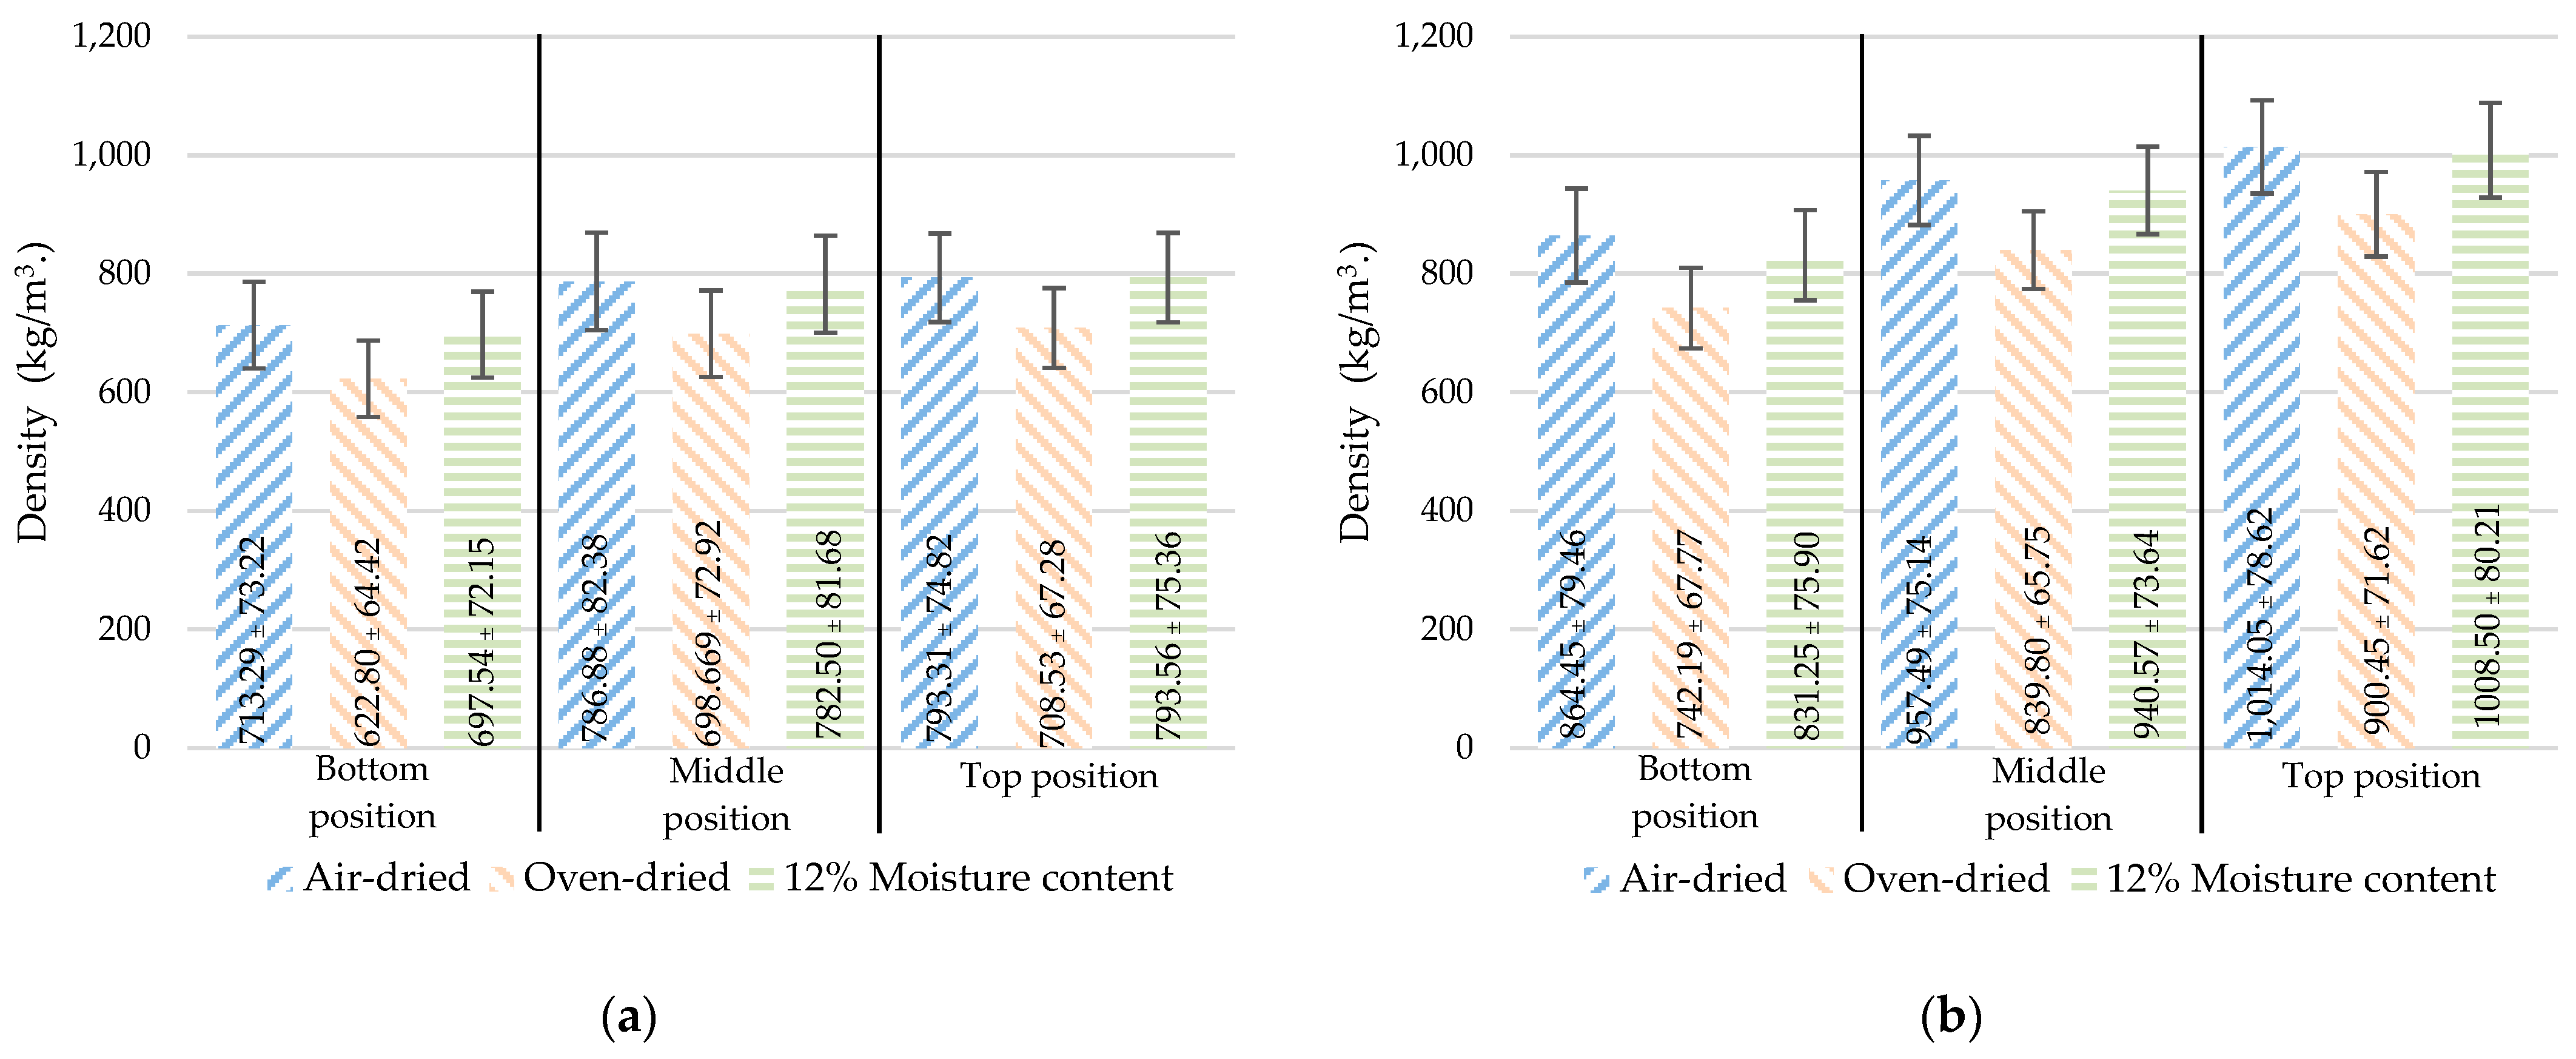
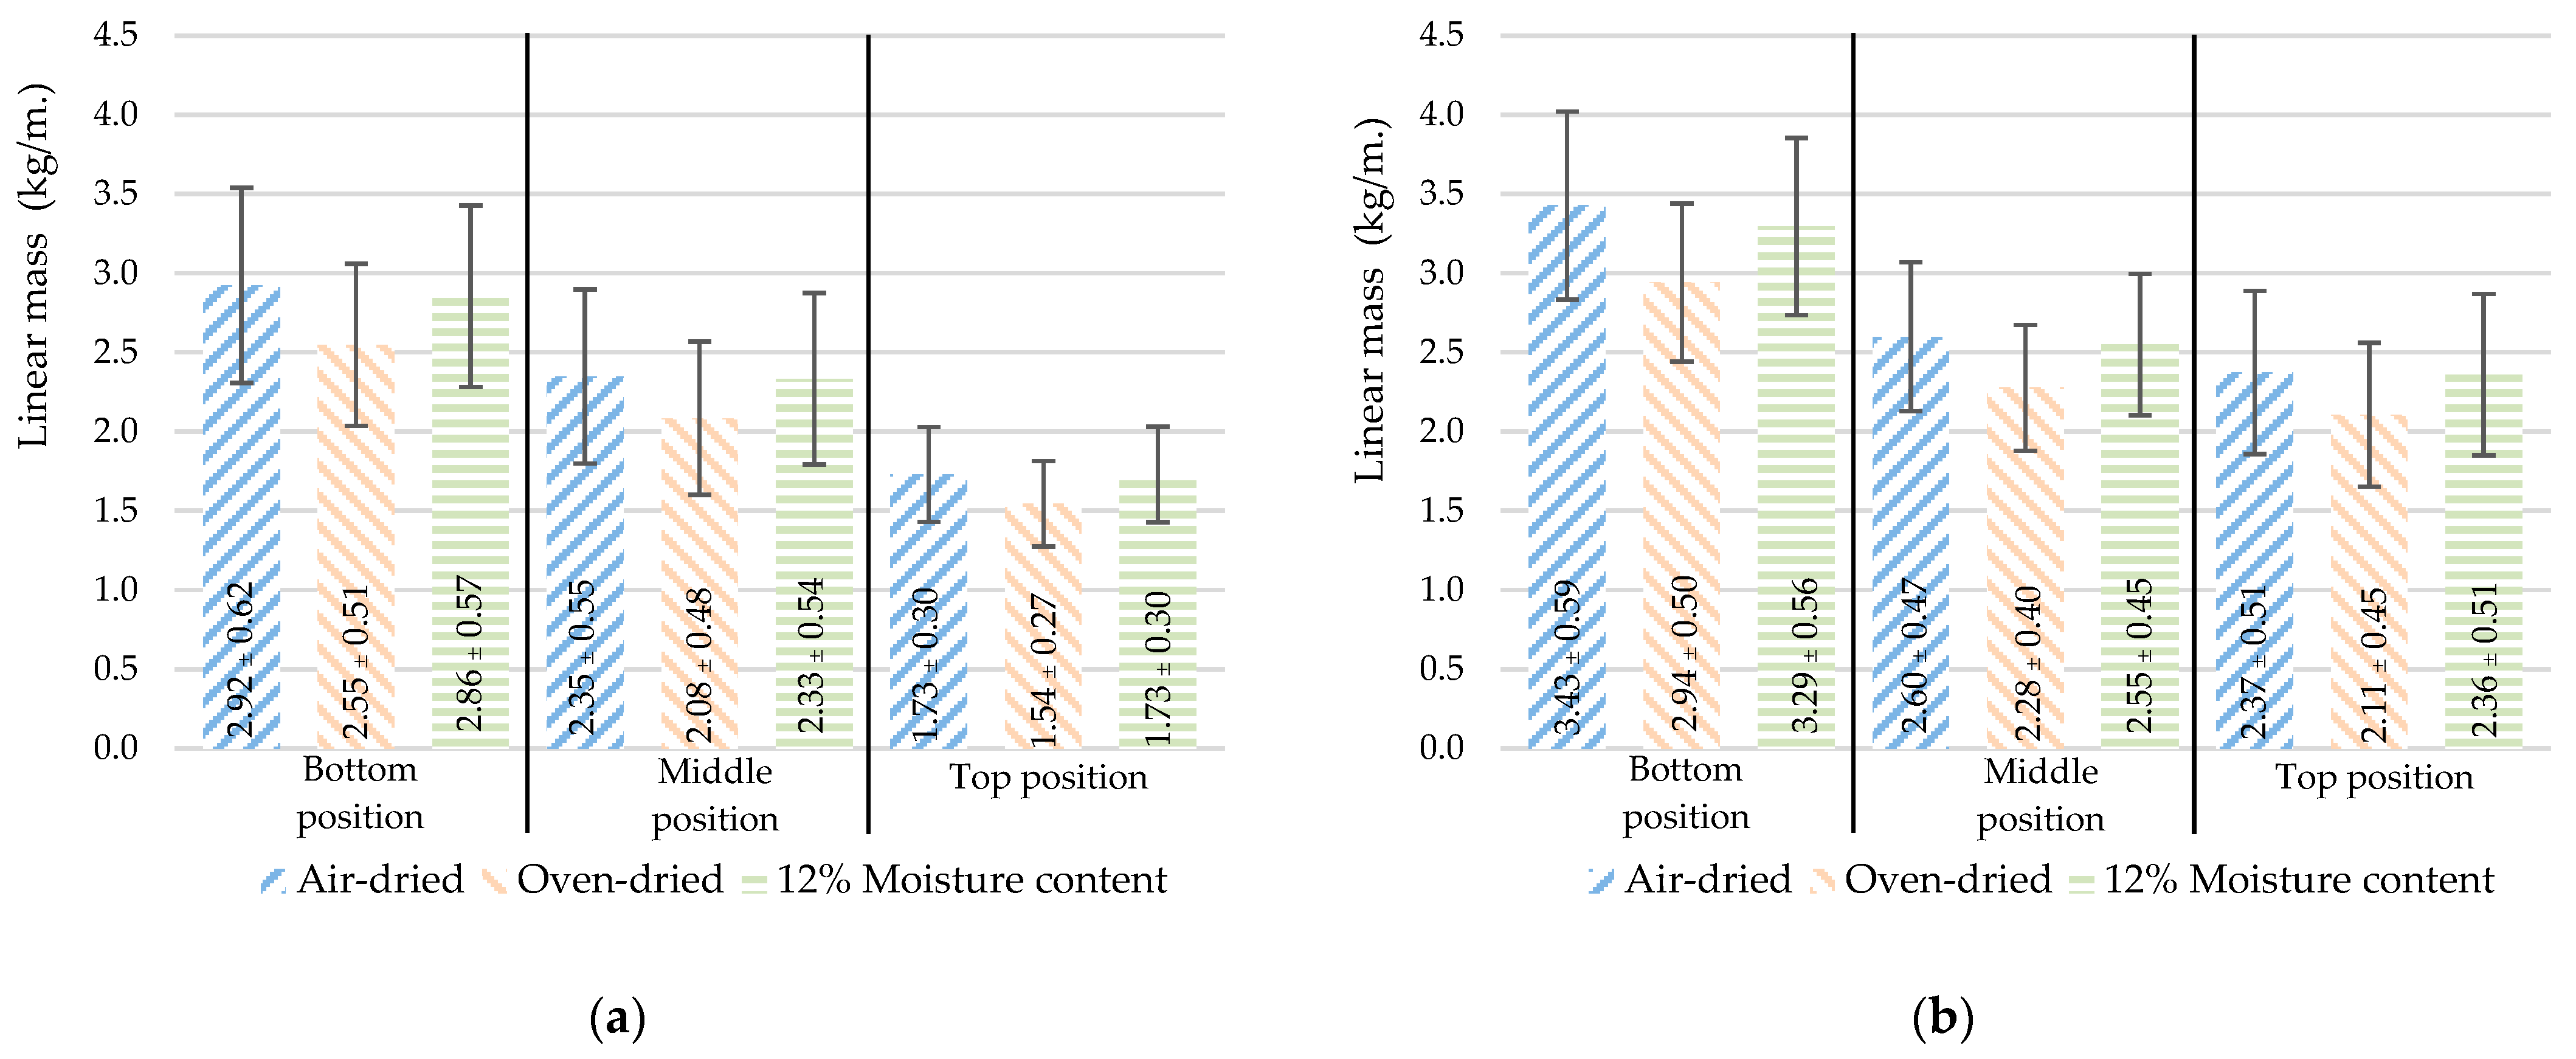
3.2.3. Density () and Linear Mass ()
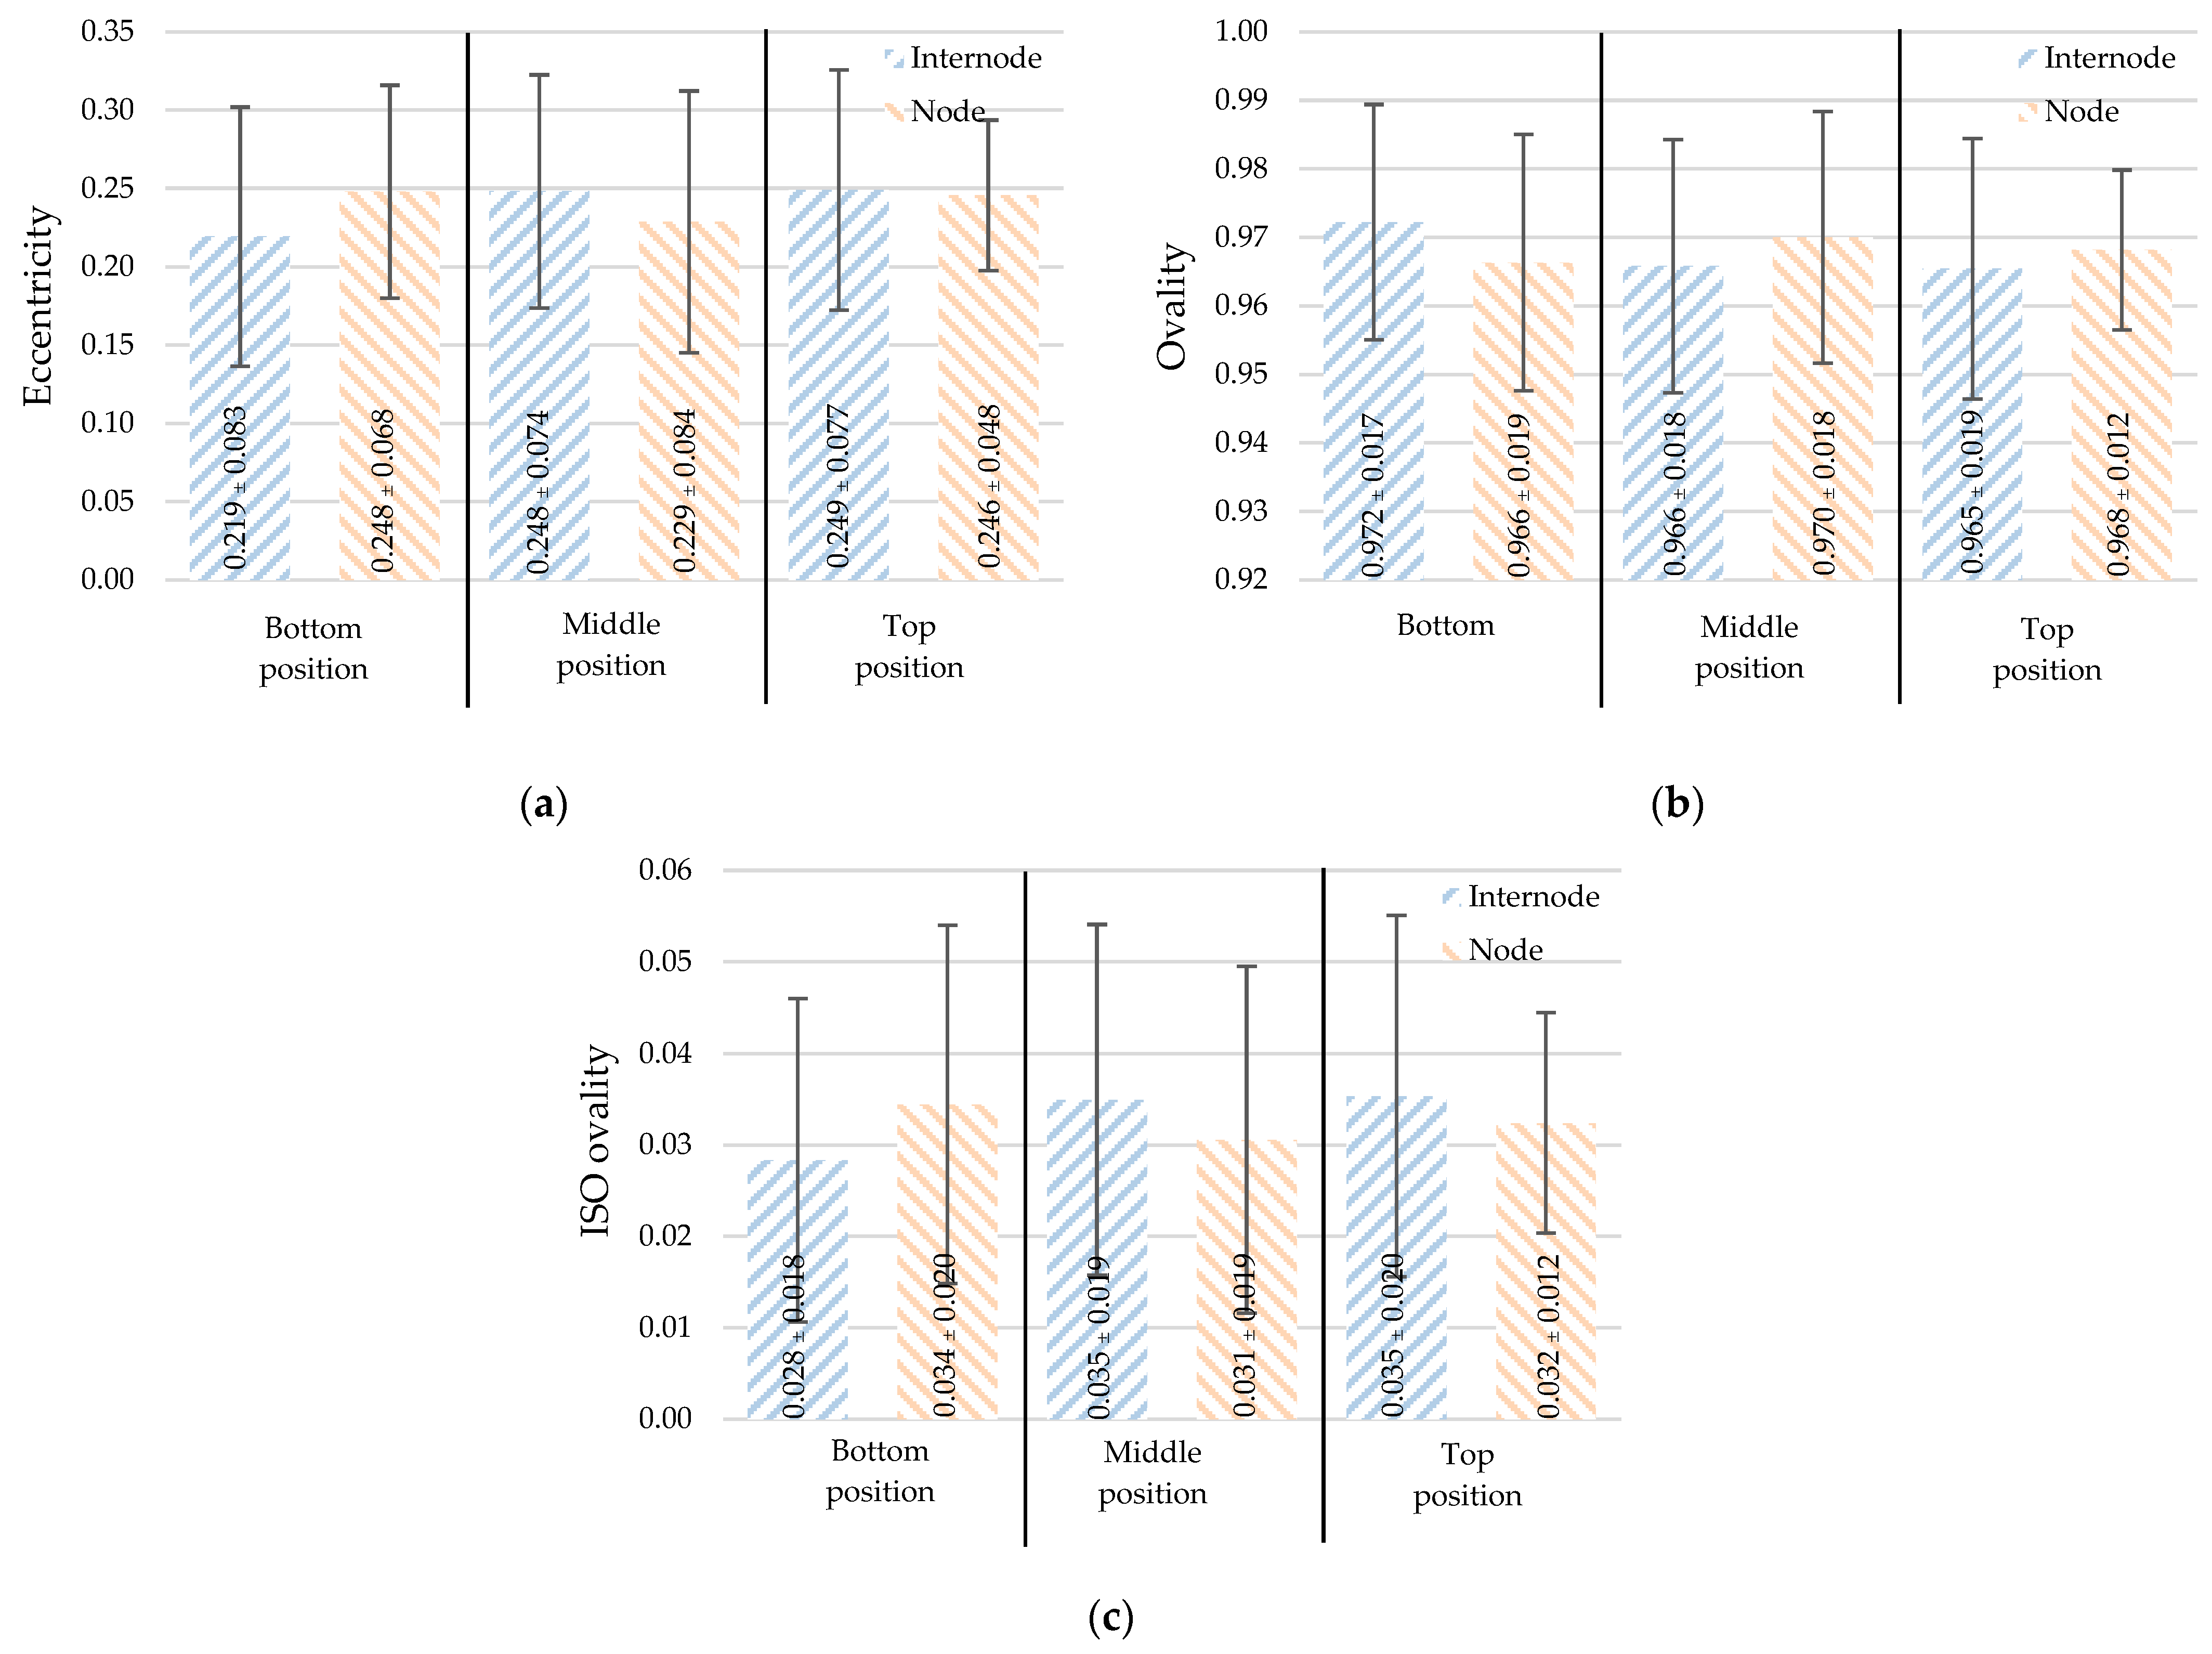
3.2.4. Eccentricity (), Ovality (), and ISO Ovality ()
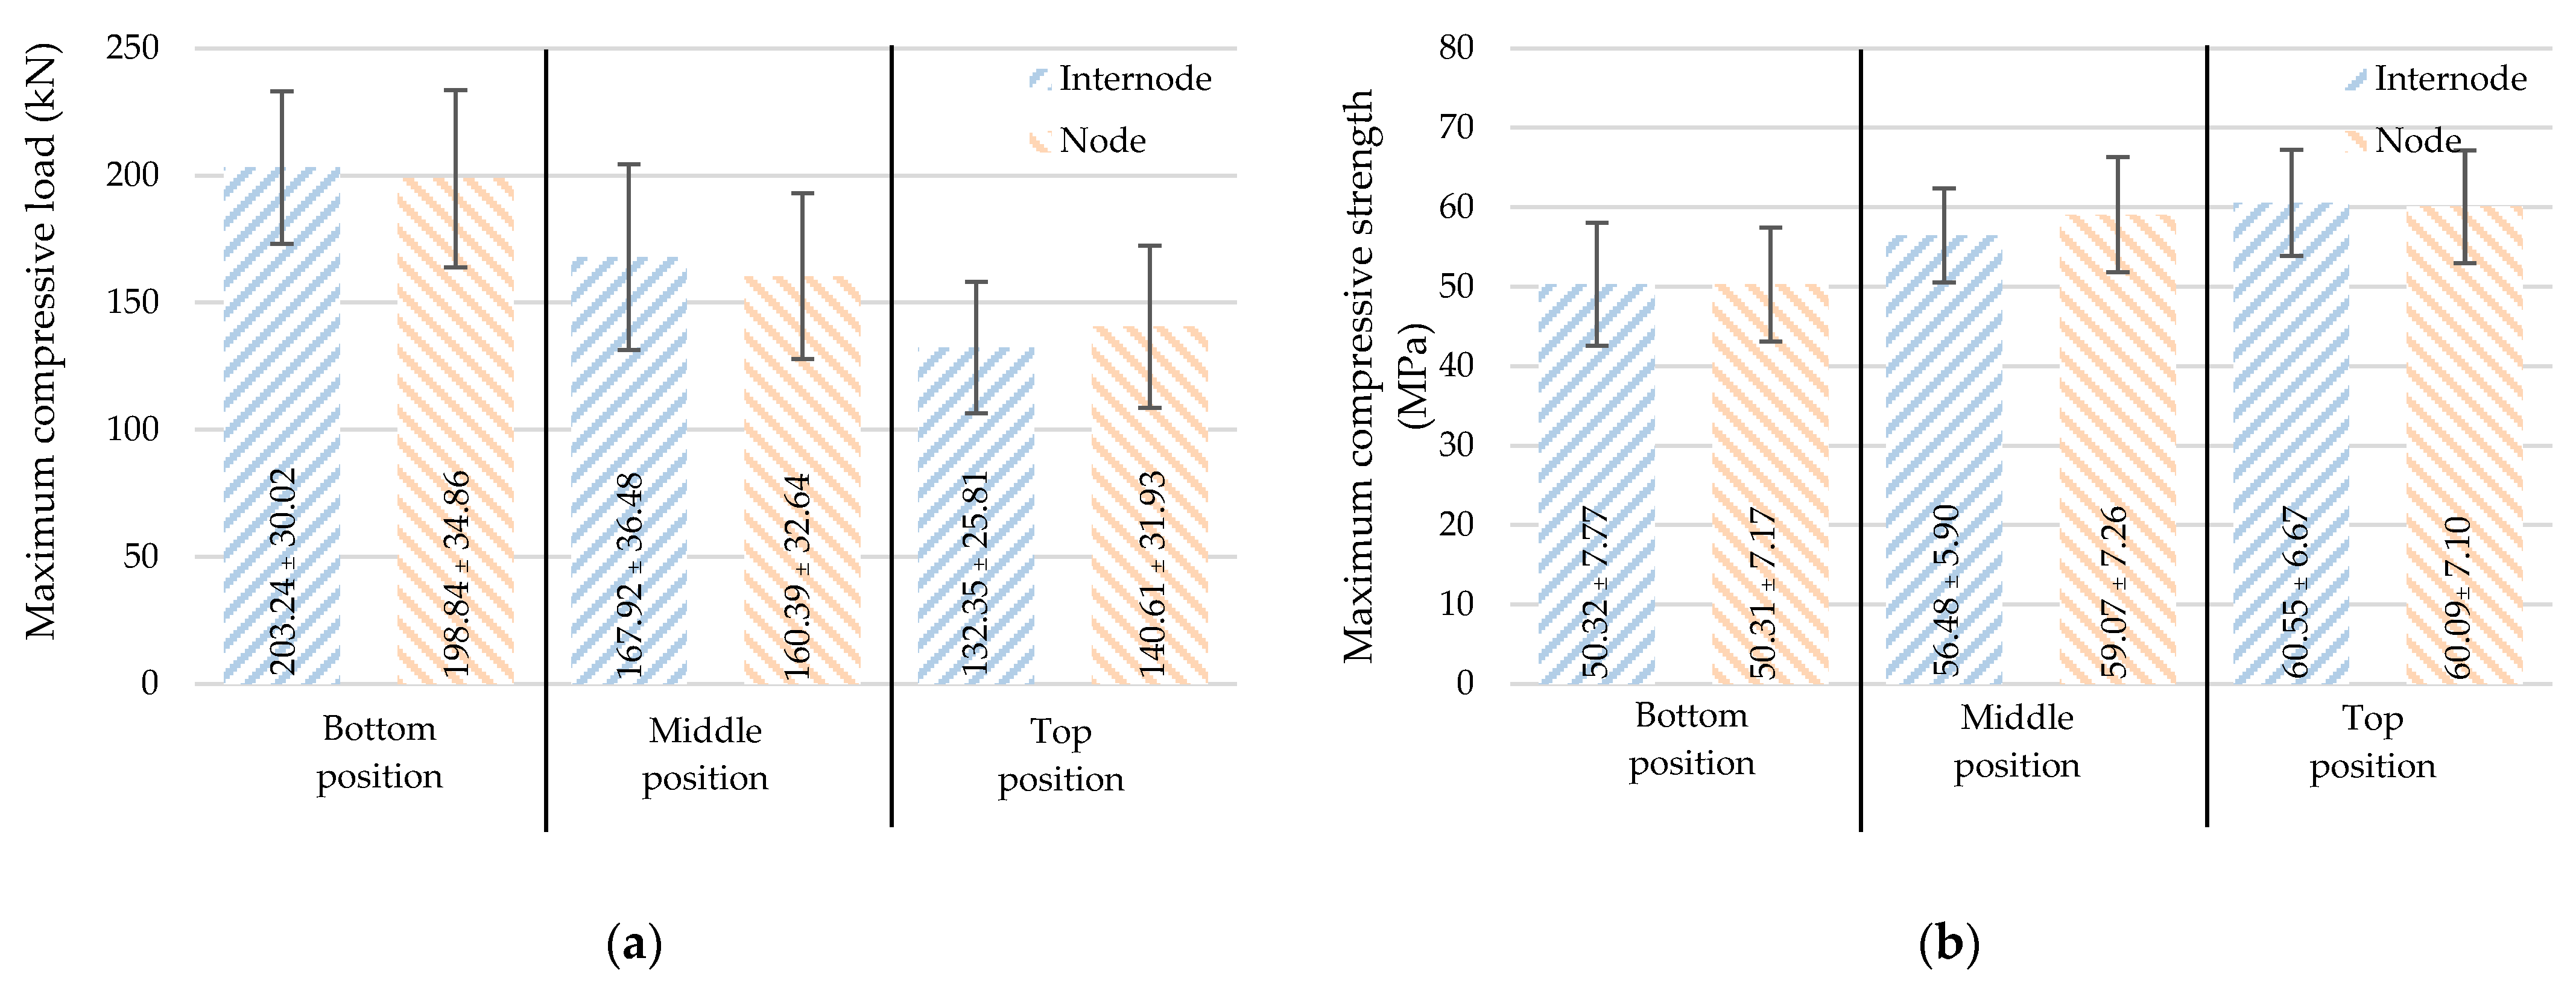
3.2.5. Axial Load Capacity
4. Correlation Analysis
4.1. Pearson Correlation Coefficient between Independent and Dependent Variables
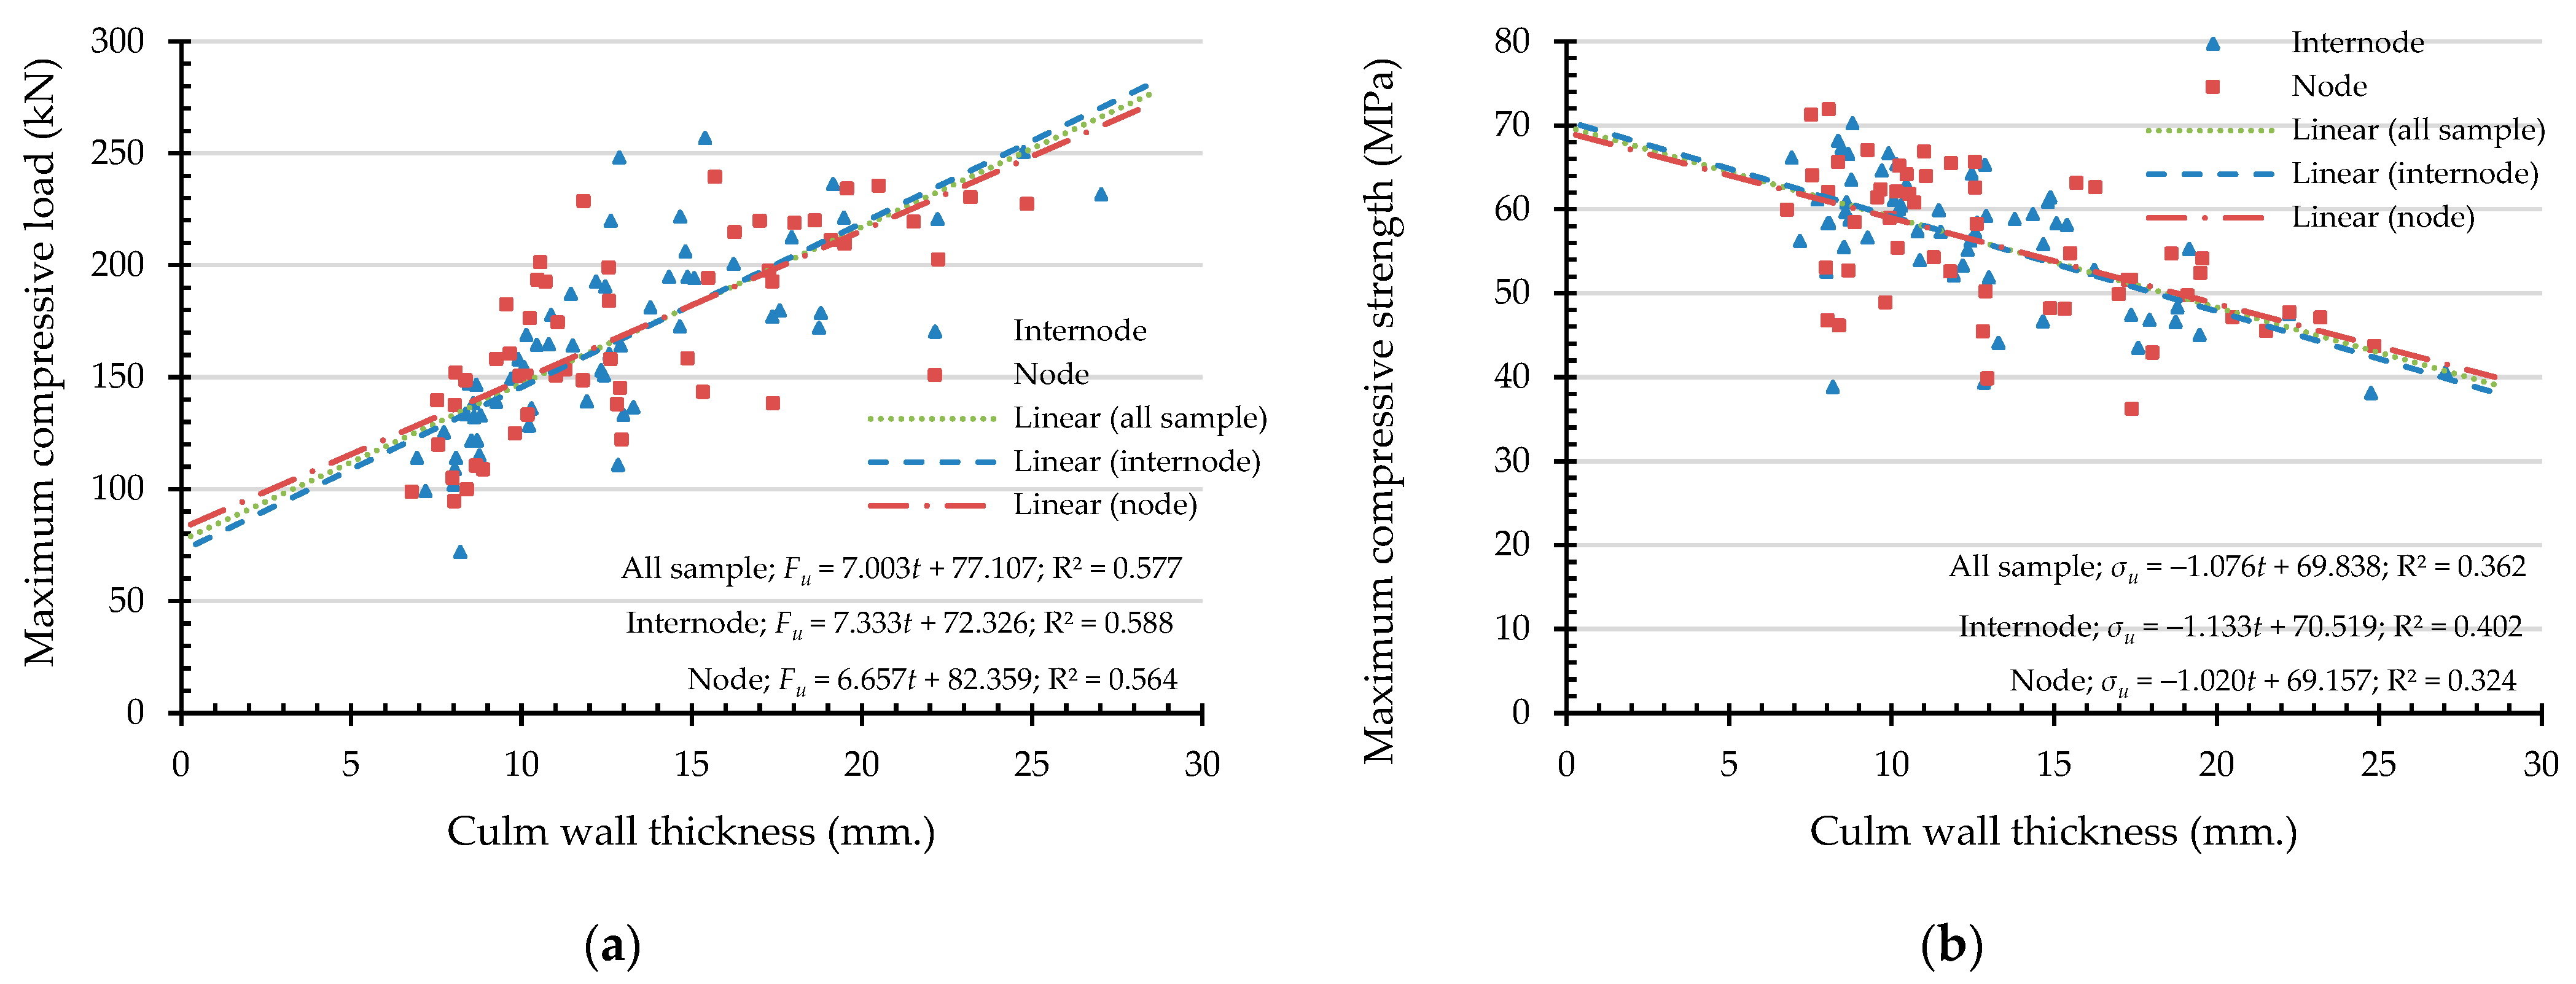
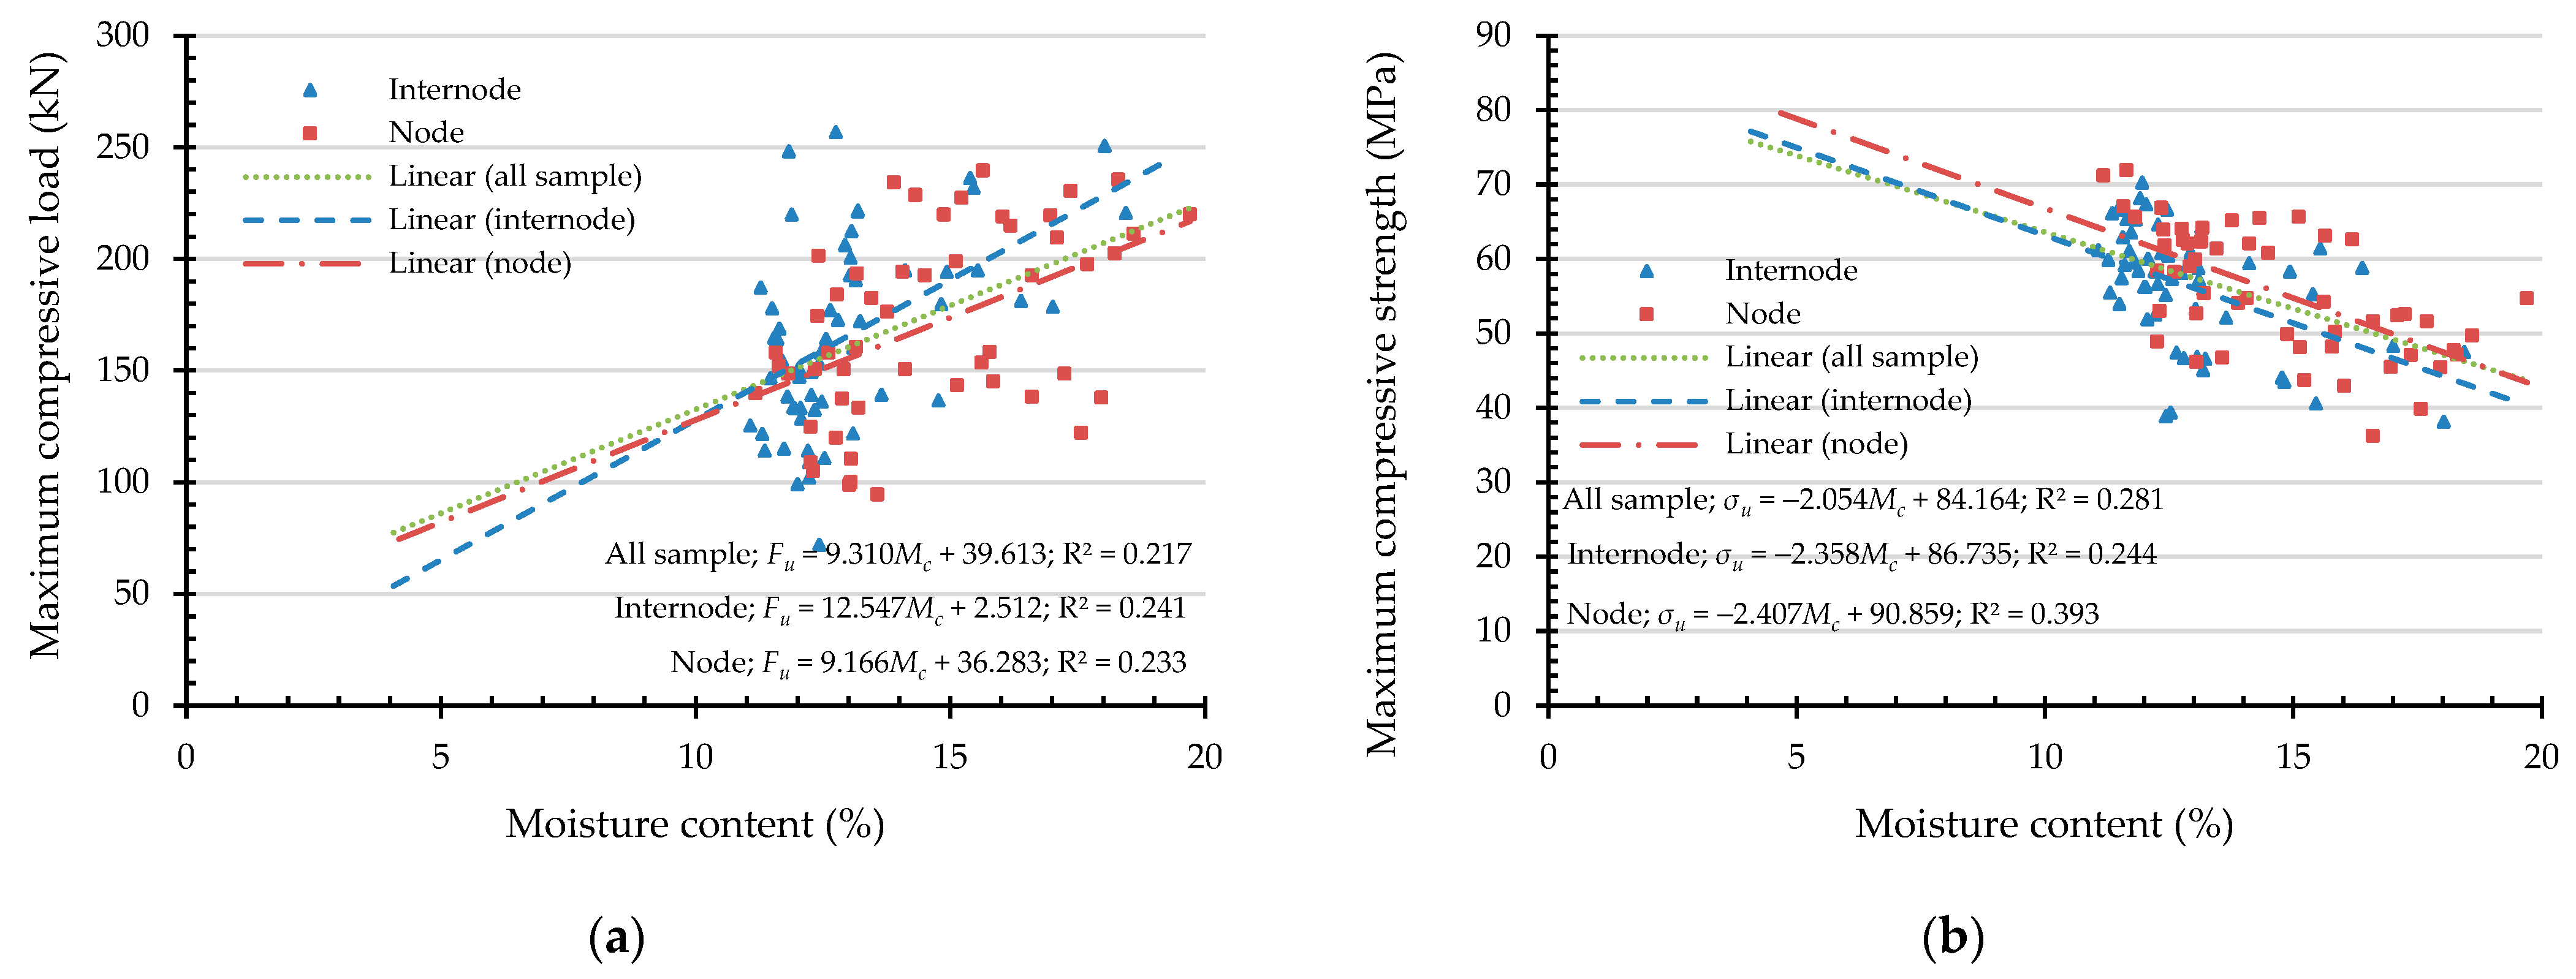
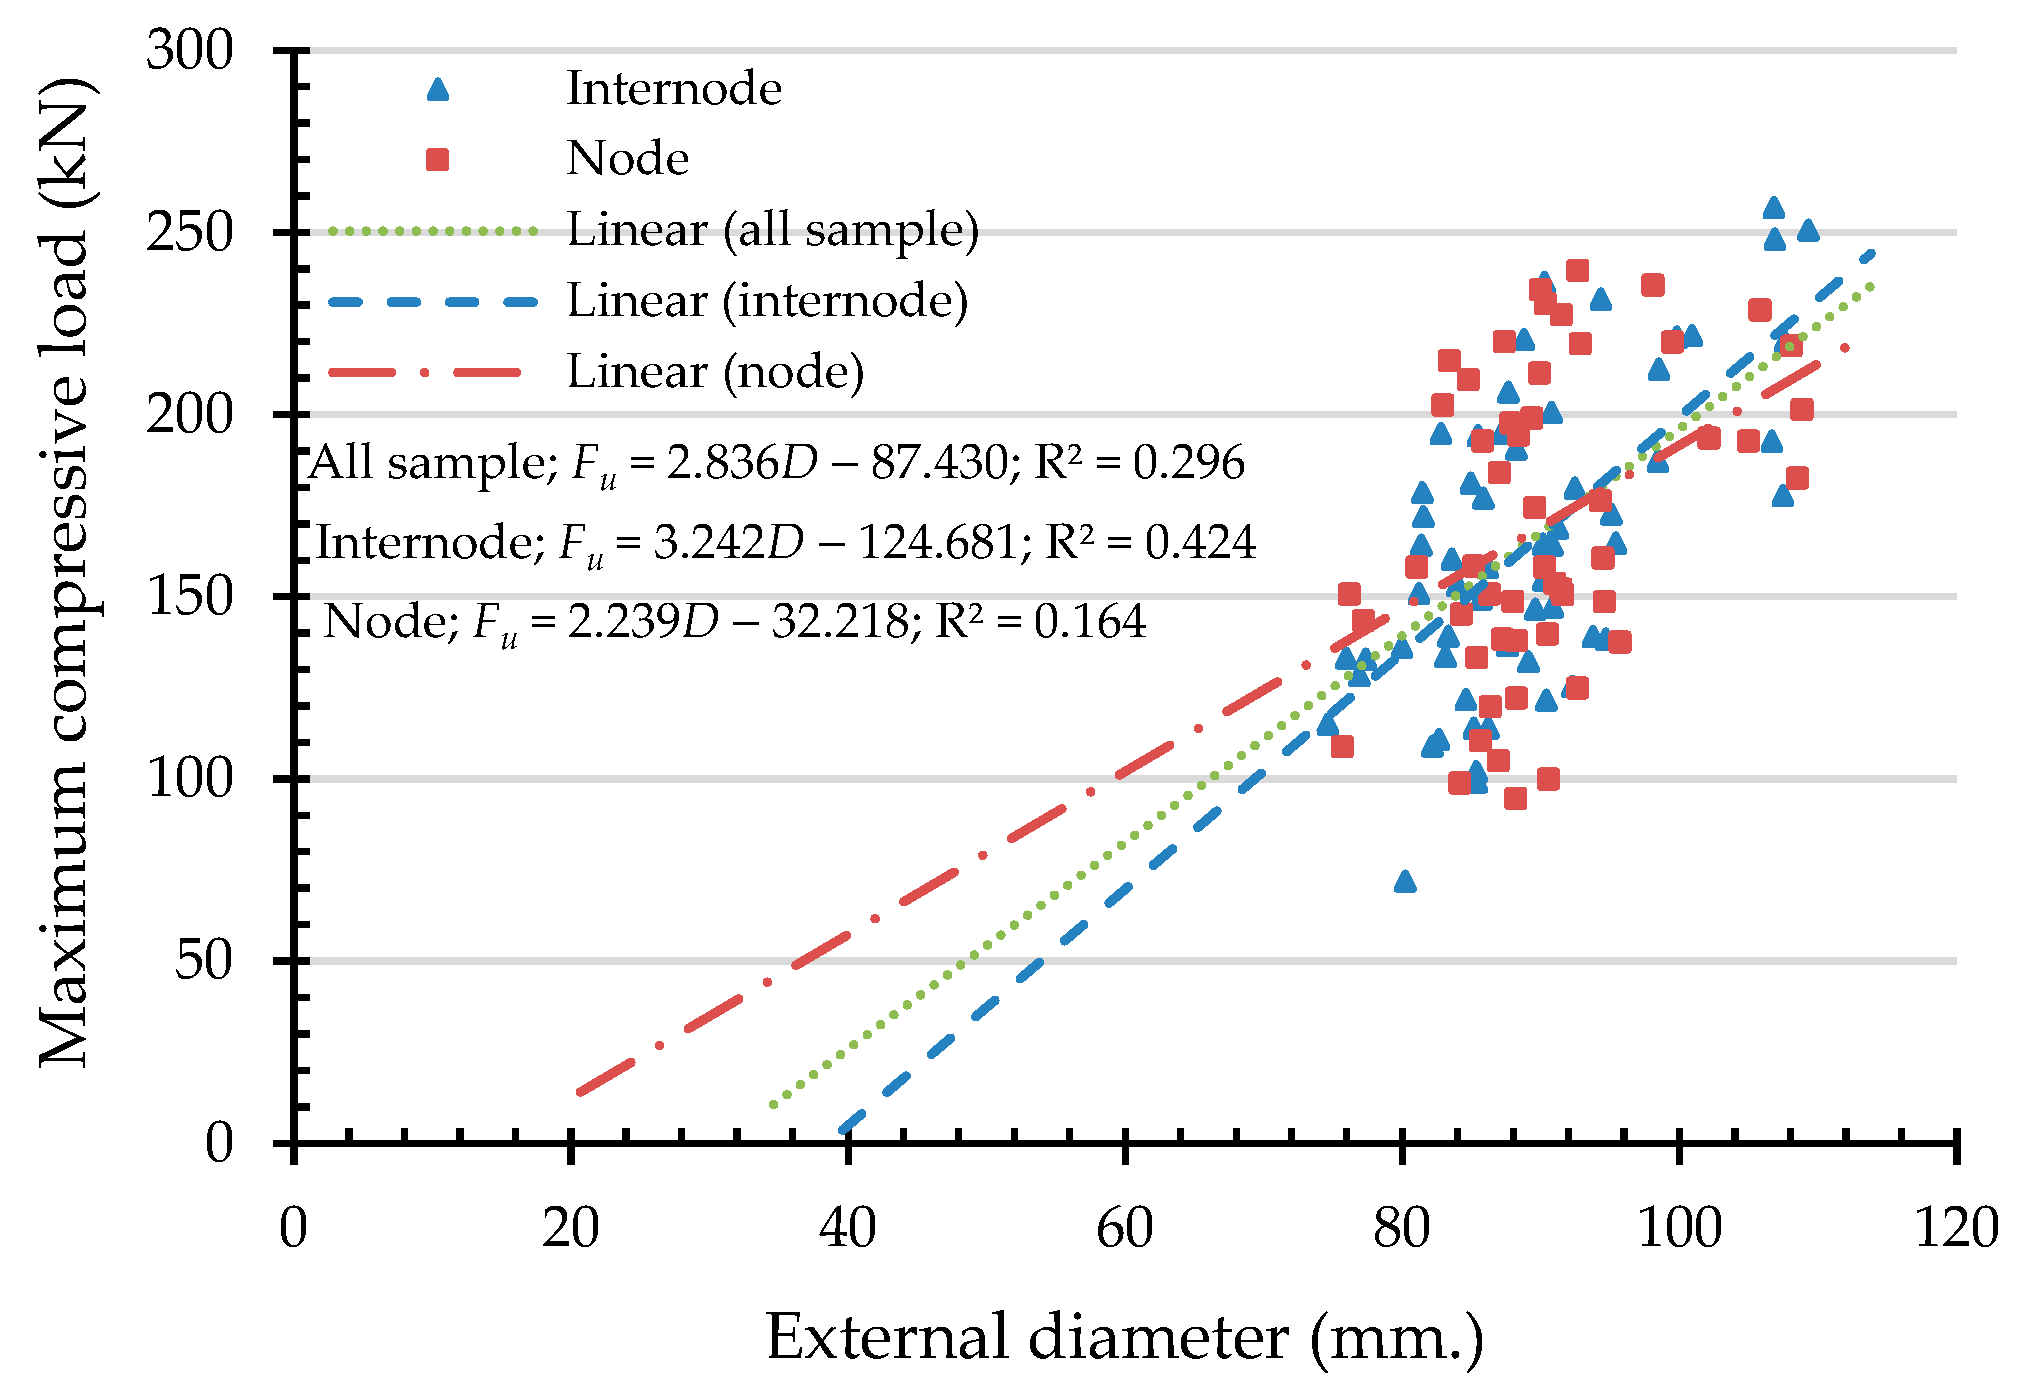
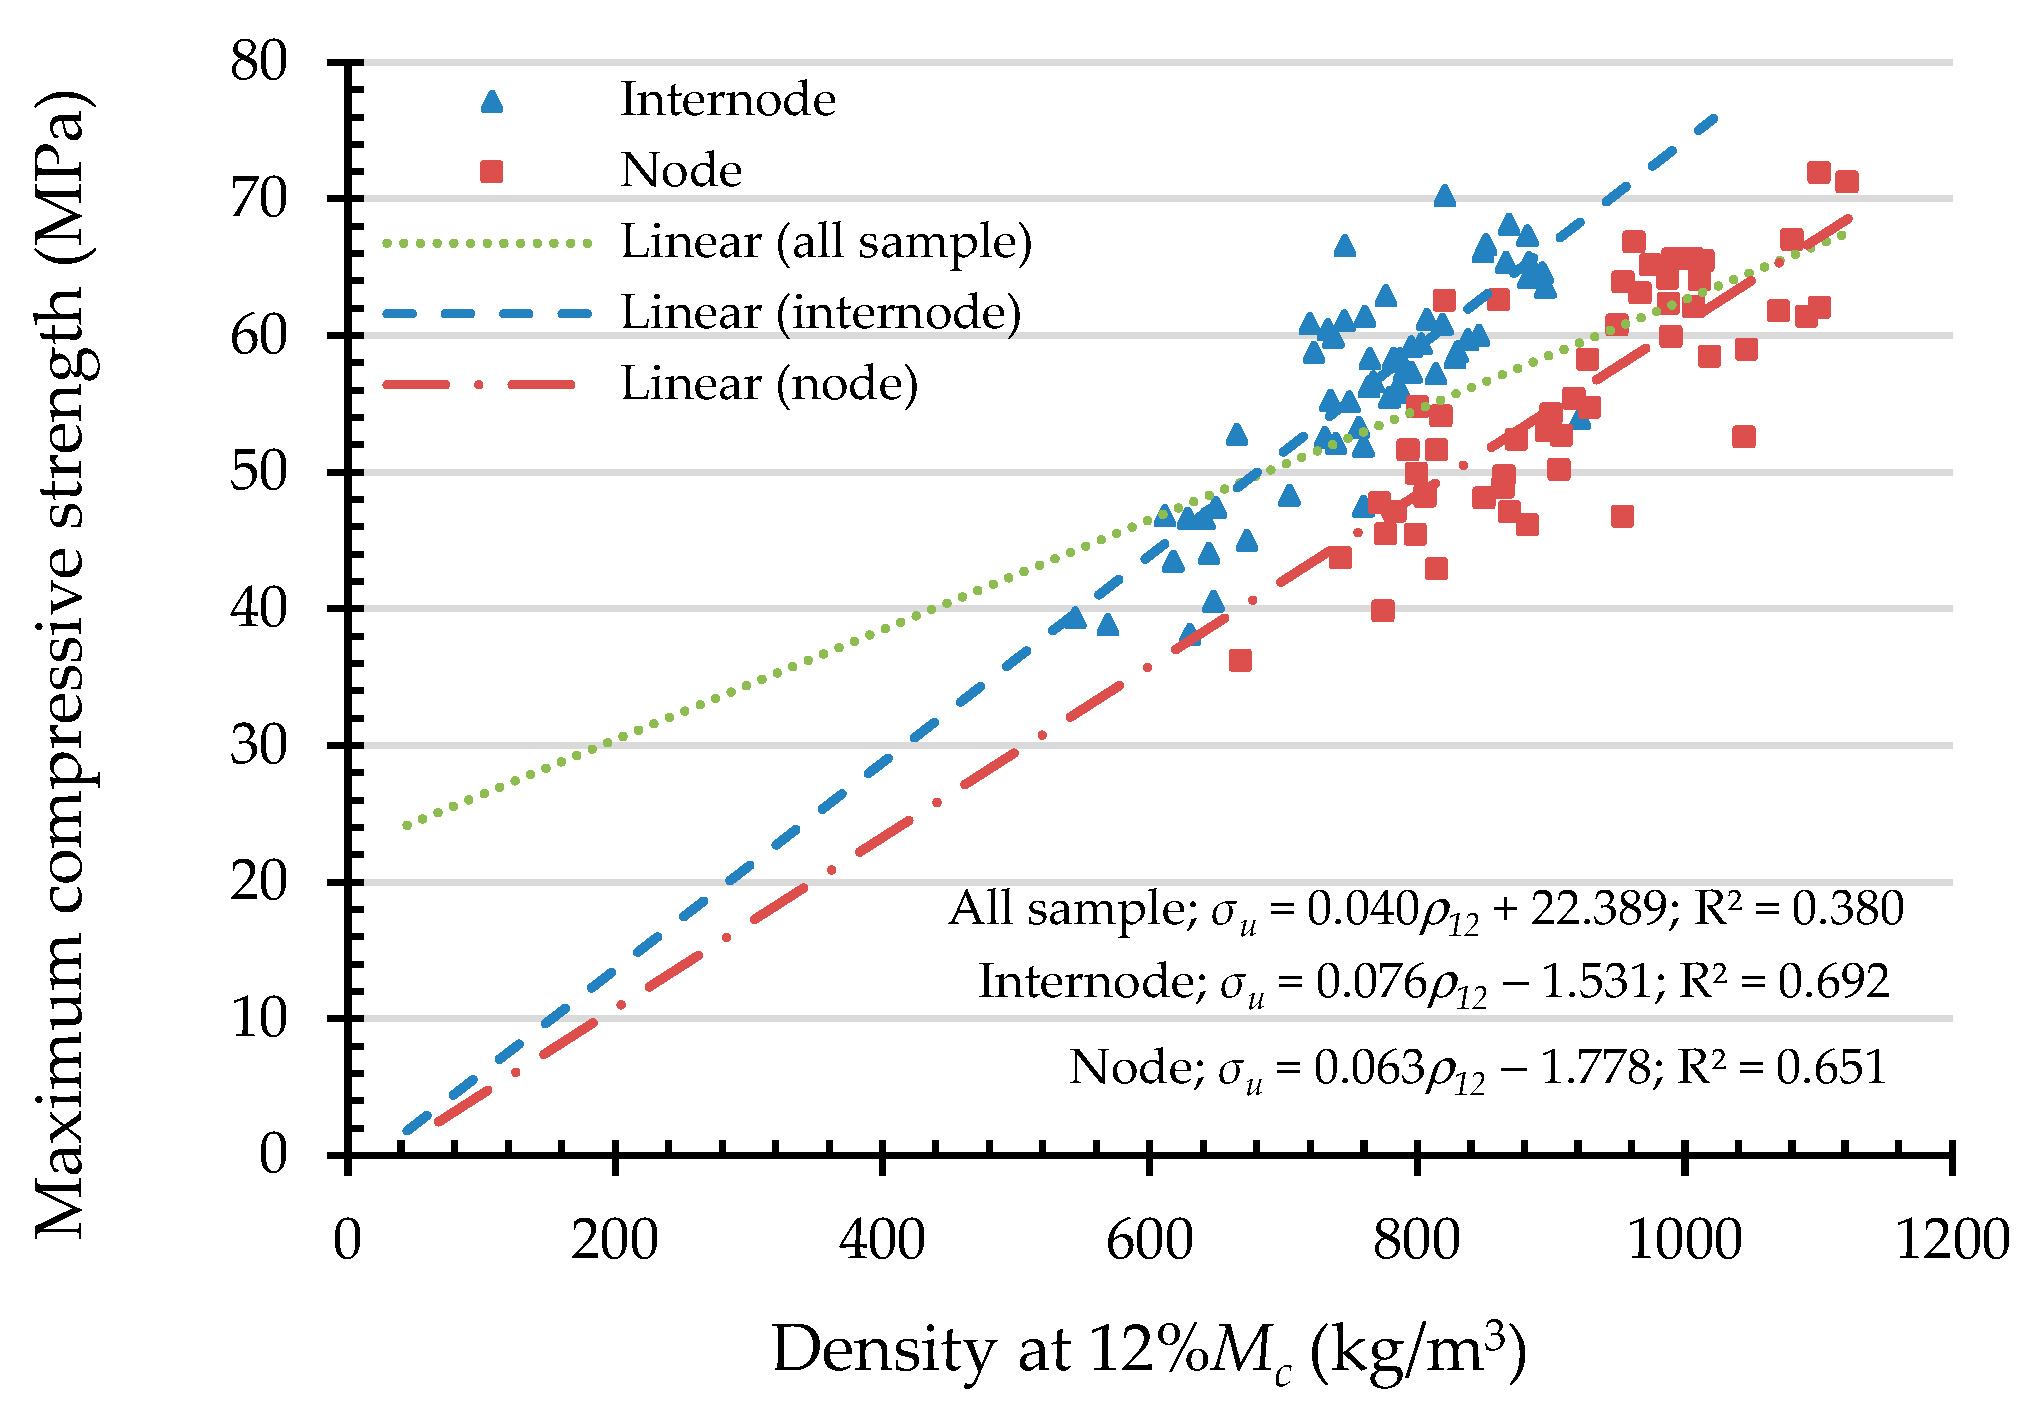
4.2. Simple Linear Regression Analysis
4.3. Multiple Linear Regression Analysis
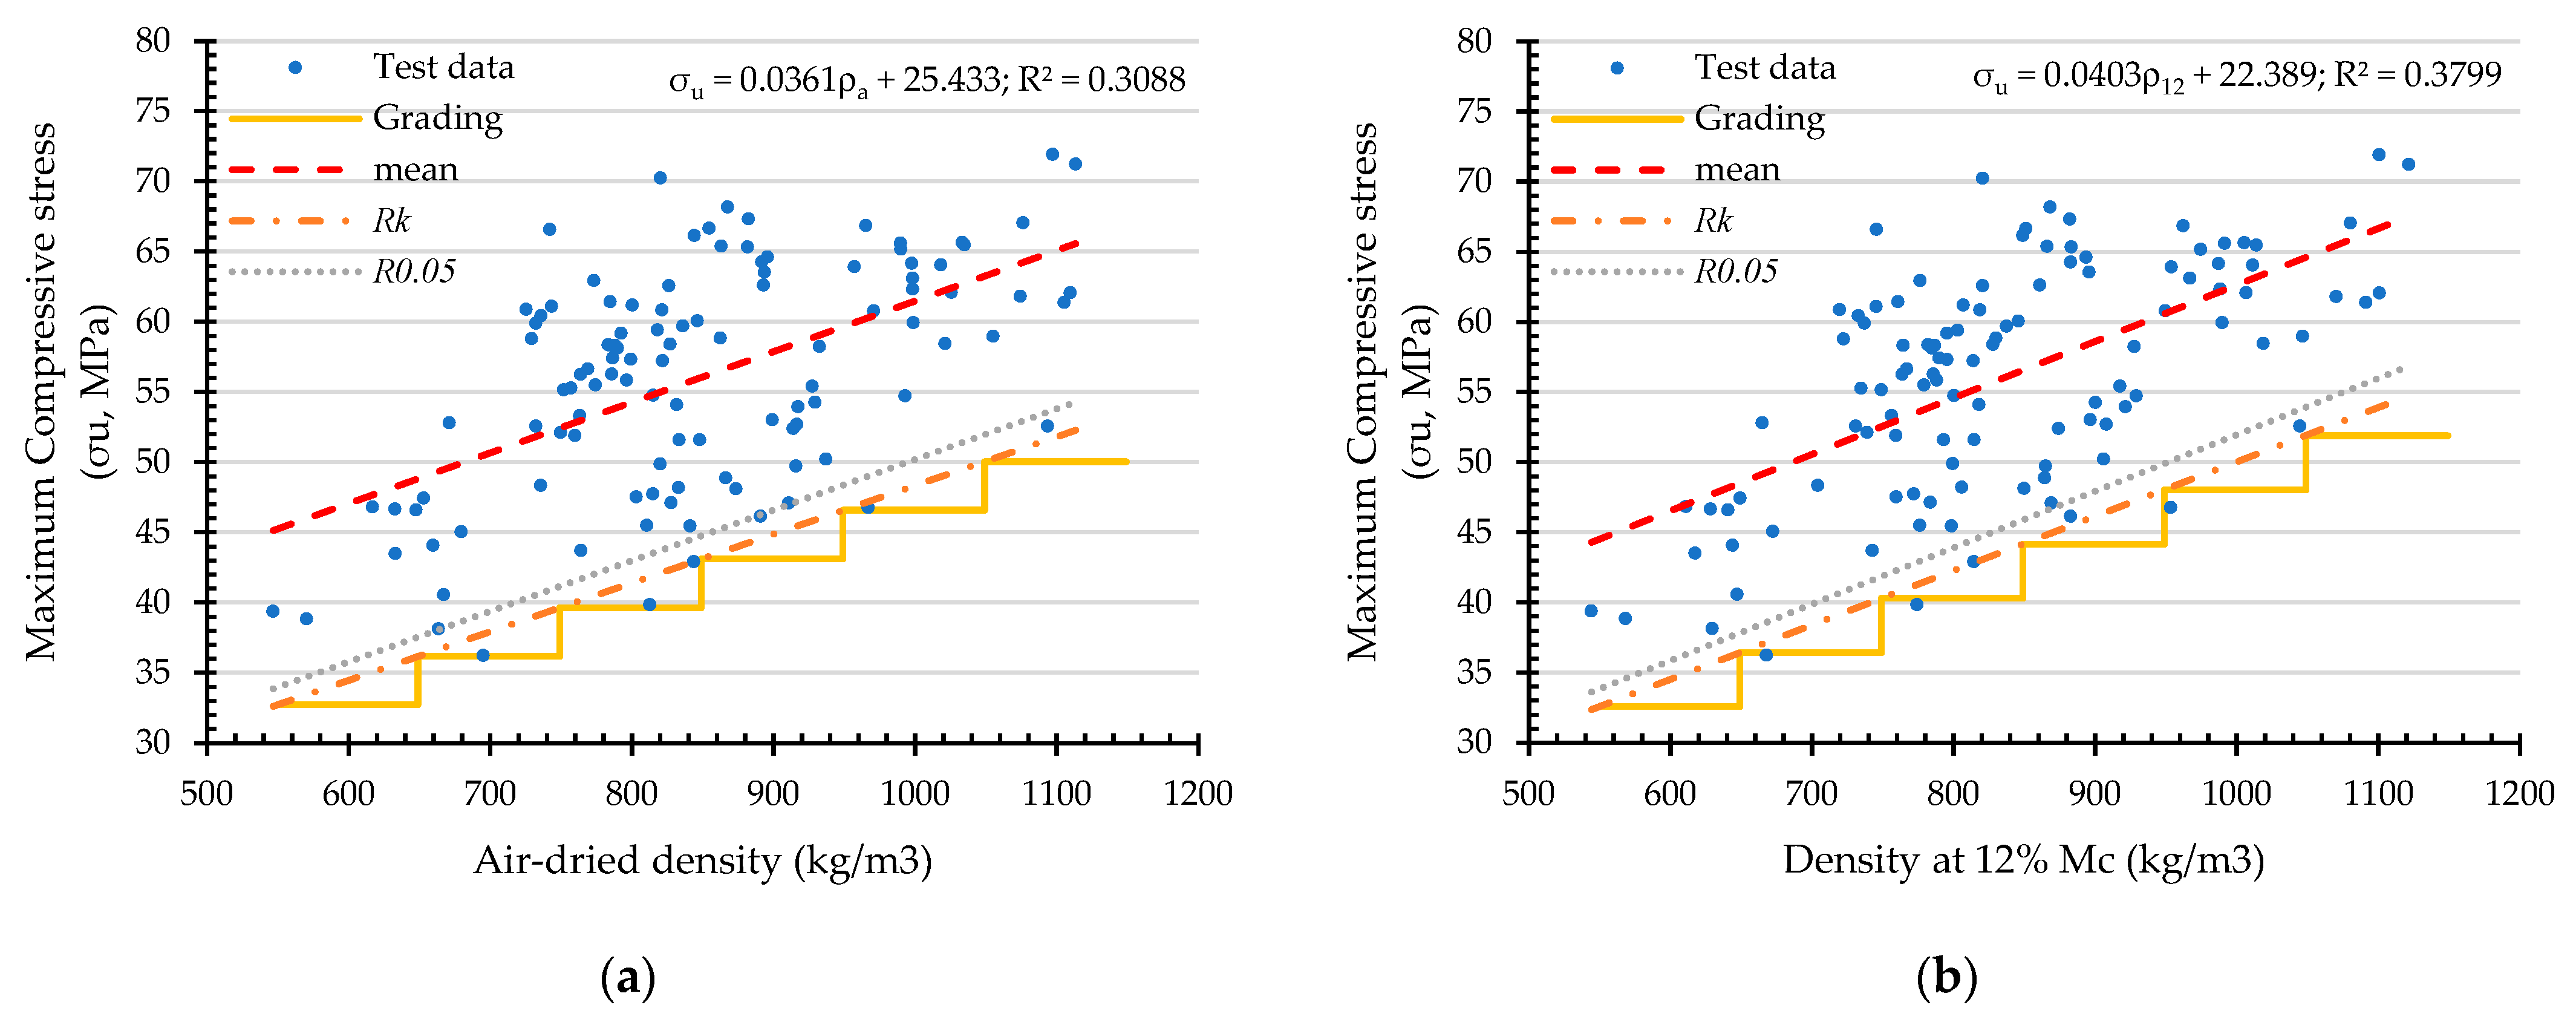
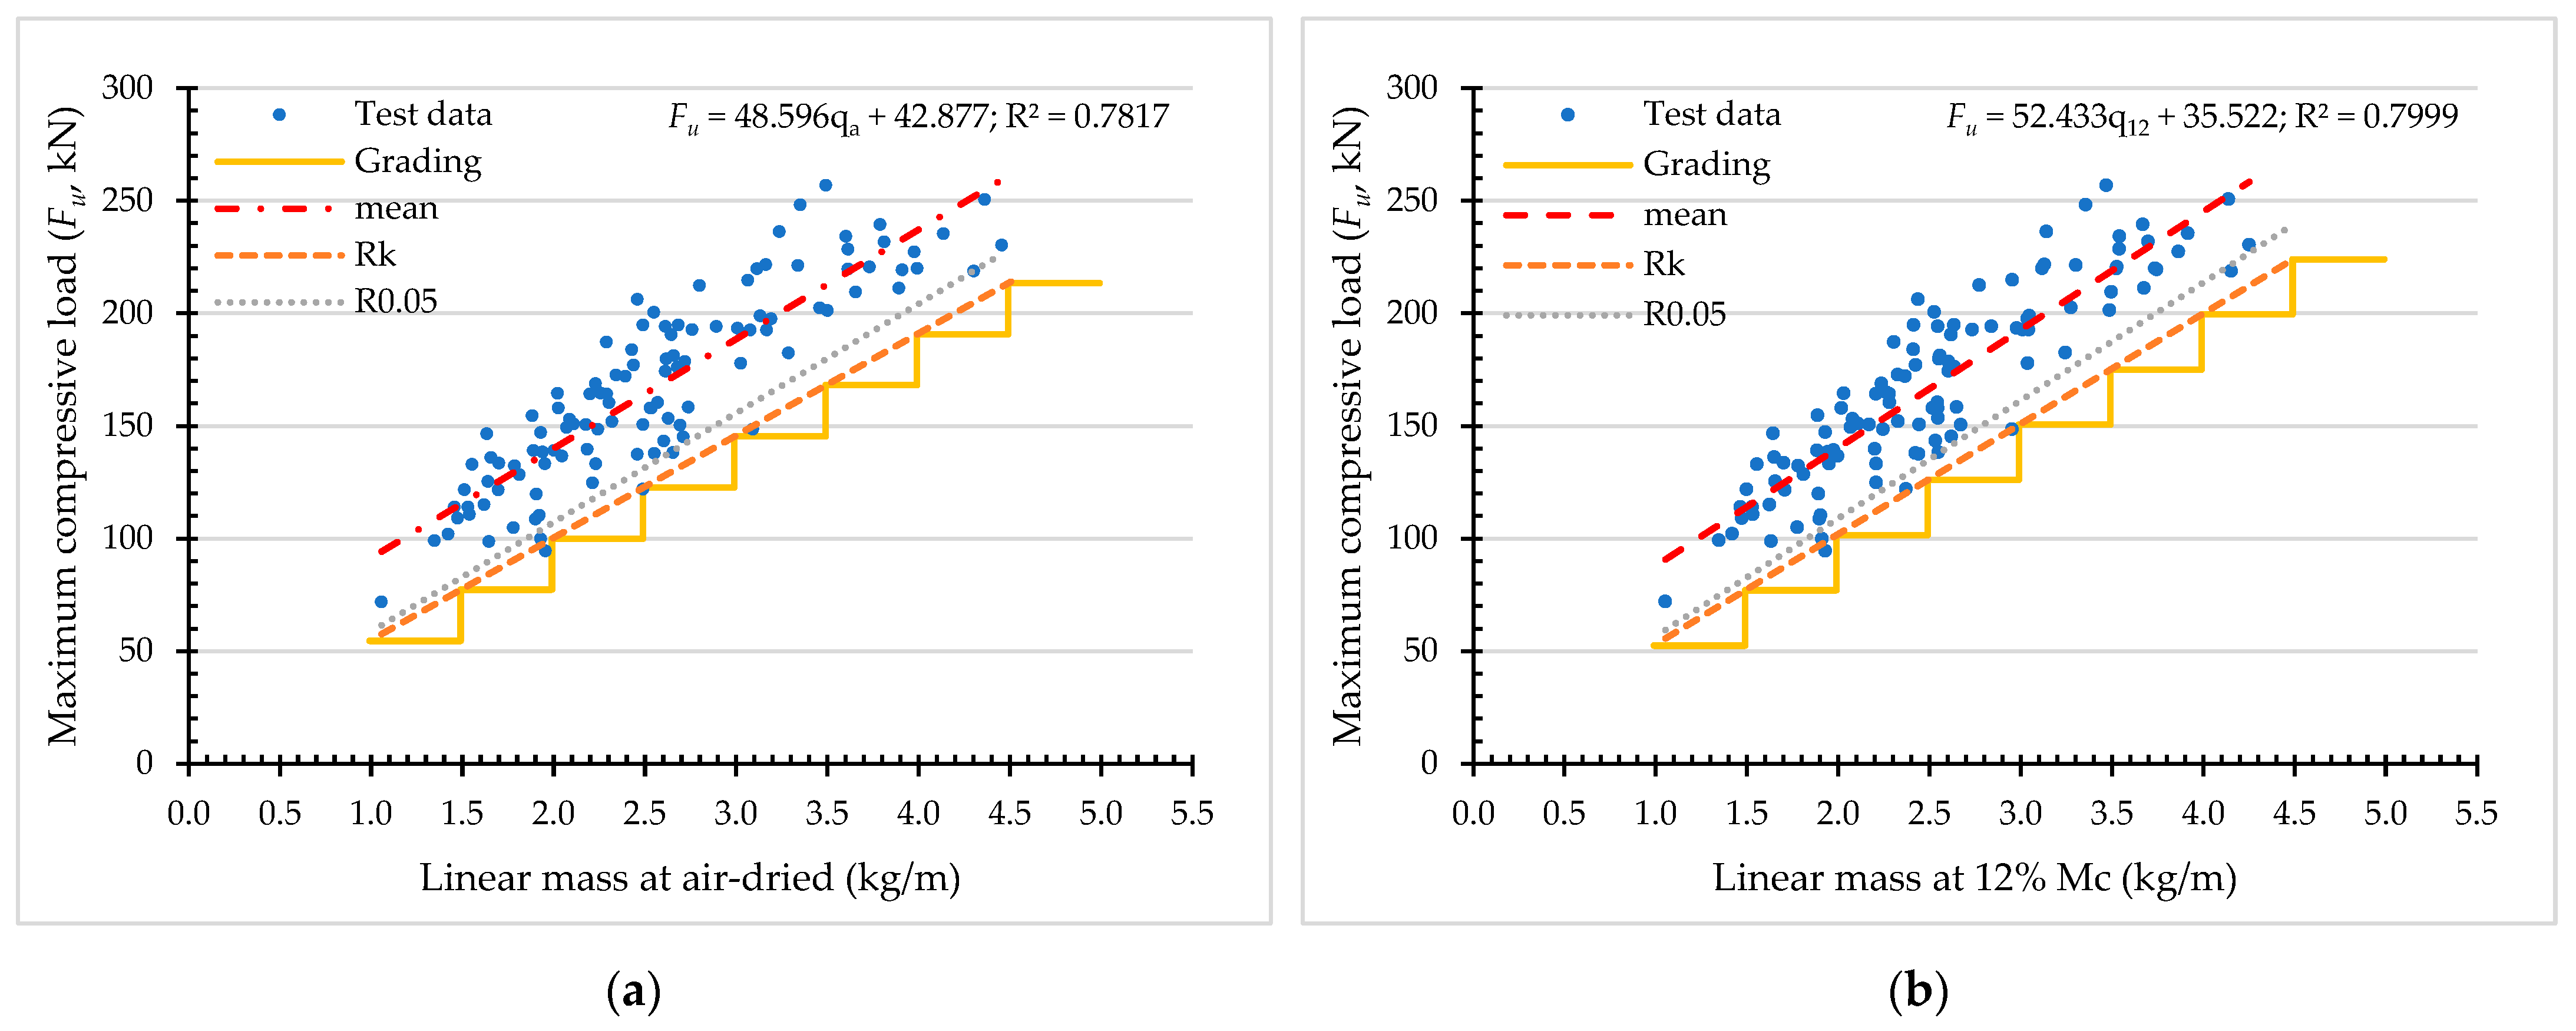
4.4. Structural Grading of Dendrocalamus Sericeus Munro Bamboo
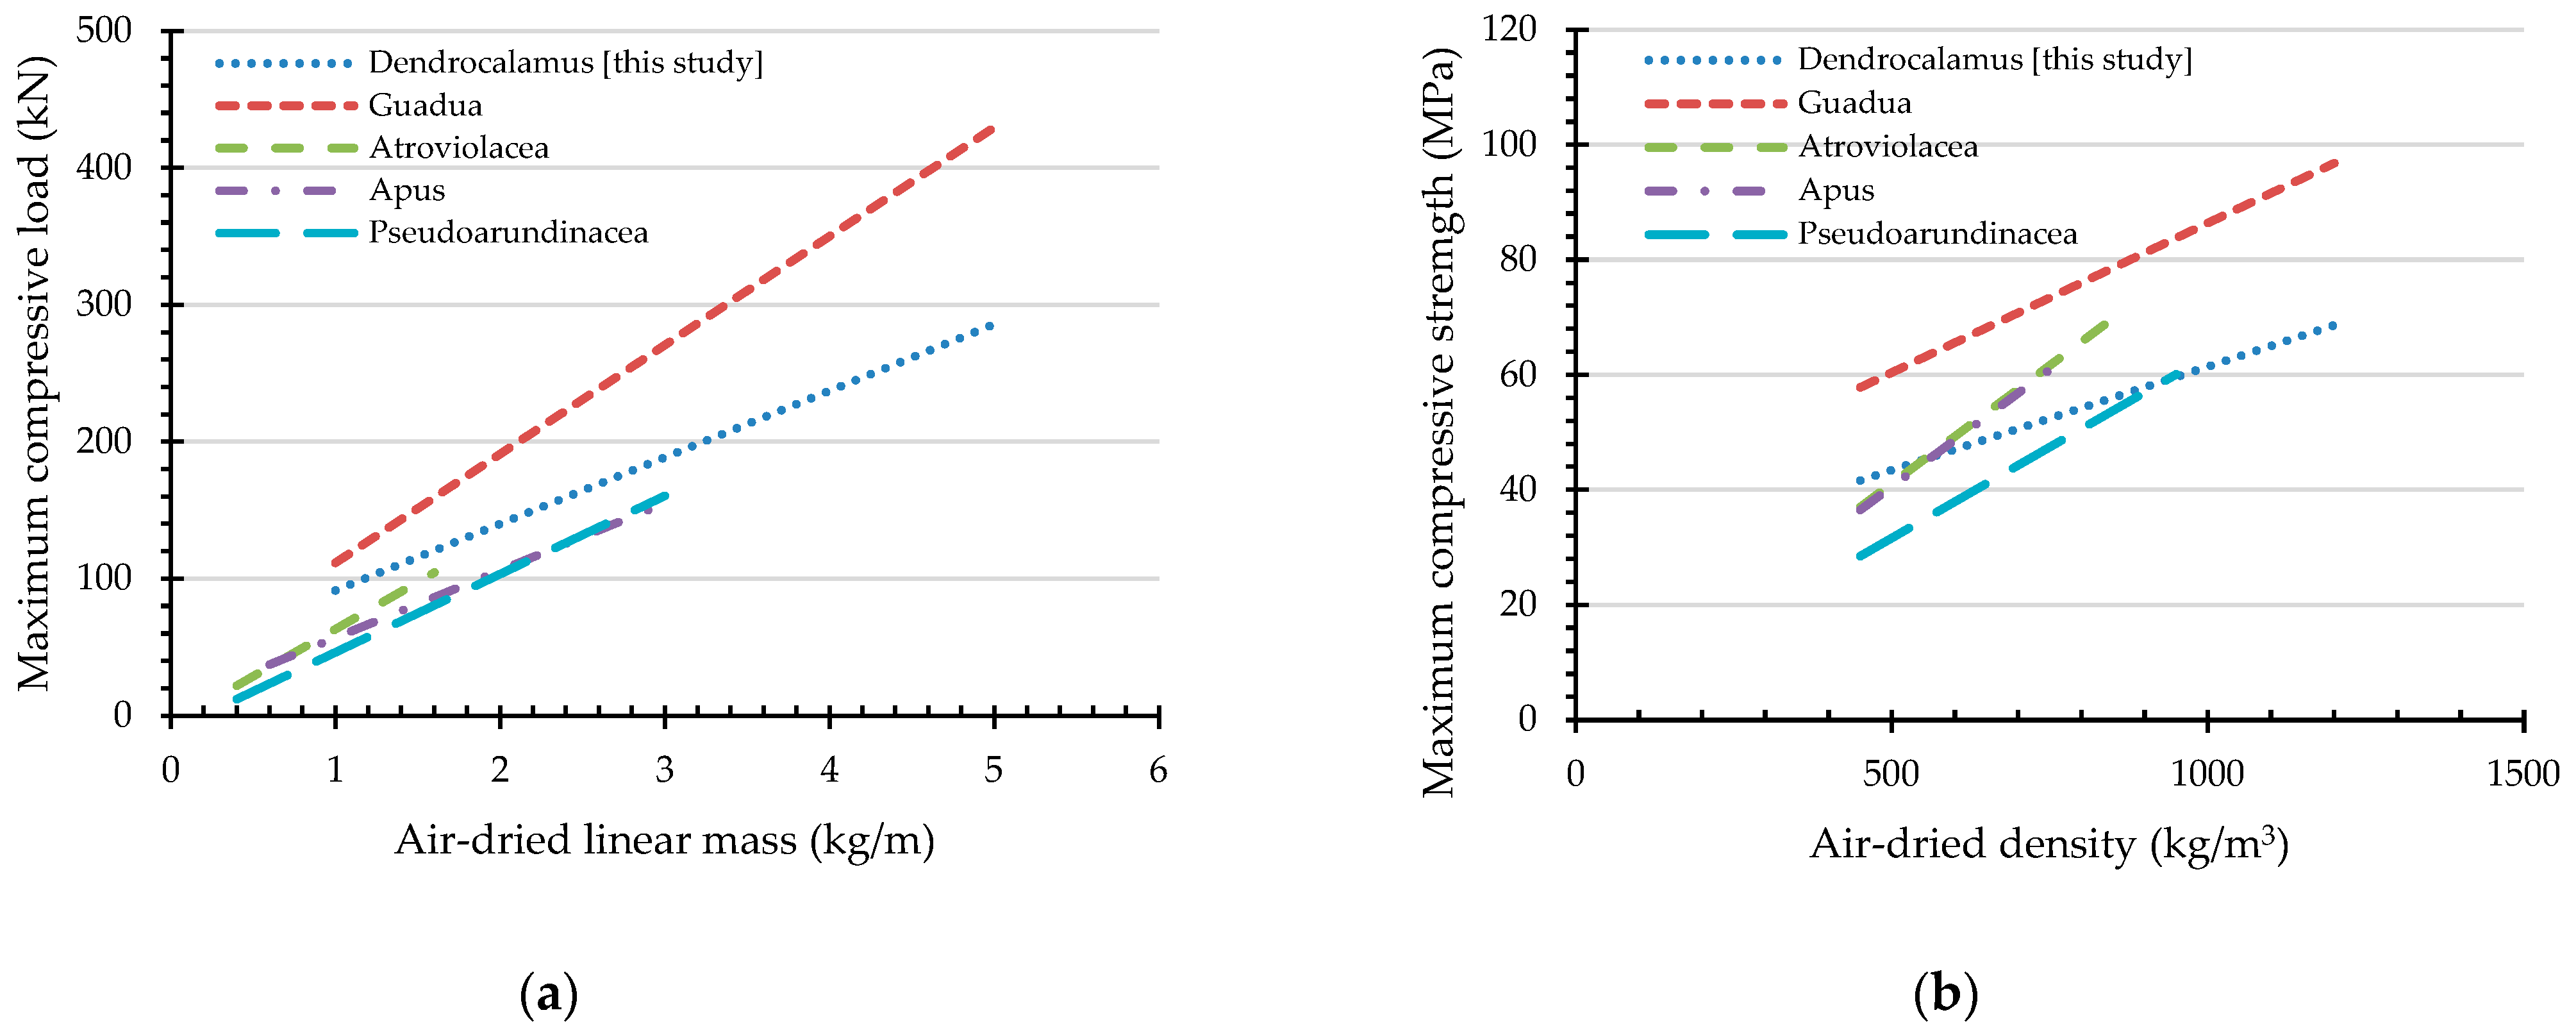
4.5. Maximum Compressive Load and Maximum Compressive Strength of Other Bamboo Species
5. Conclusions
Author Contributions
Funding
Institutional Review Board Statement
Informed Consent Statement
Data Availability Statement
Acknowledgments
Conflicts of Interest
References
- Canavan, S.; Richardson, D.M.; Visser, V.; Roux, J.J.; Vorontsova, M.S.; Wilson, J.R. The global distribution of bamboos: Assessing correlates of introduction and invasion. AoB Plants 2017, 9, plw078. [Google Scholar] [CrossRef]
- Yadav, M.; Mathur, A. Bamboo as a sustainable material in the construction industry: An overview. Mater. Today Proc. 2021, 43, 2872–2876. [Google Scholar] [CrossRef]
- Yu, W.K.; Chung, K.F.; Chan, S.L. Axial buckling of bamboo columns in bamboo scaffolds. Eng. Struct. 2005, 27, 61–73. [Google Scholar] [CrossRef]
- Chaowana, K.; Wisadsatorn, S.; Chaowana, P. Bamboo as a Sustainable Building Material—Culm Characteristics and Properties. Sustainability 2021, 13, 7376. [Google Scholar] [CrossRef]
- Bhonde, D.; Nagarnaik, P.B.; Parbat, D.K.; Waghe, U.P. Physical and Mechanical Properties of Bamboo (Dendrocalmus Strictus). Int. J. Sci. Eng. Res. 2014, 5, 455–459. [Google Scholar]
- Ye, F.; Fu, W. Physical and Mechanical Characterization of Fresh Bamboo for Infrastructure Projects. J. Mater. Civ. Eng. 2018, 30, 05017004. [Google Scholar] [CrossRef]
- Das, S.; Mukhopadhyay, P. Multi-hazard disaster resilient housing with bamboo-based system. Procedia Eng. 2018, 212, 937–945. [Google Scholar] [CrossRef]
- Gan, J.; Chen, M.; Semple, K.; Liu, X.; Dai, C.; Tu, Q. Life cycle assessment of bamboo products: Review and harmonization. Sci. Total Environ. 2022, 849, 157937. [Google Scholar] [CrossRef]
- Xu, P.; Zhu, J.; Li, H.; Wei, Y.; Xiong, Z.; Xu, X. Are bamboo construction materials environmentally friendly? A life cycle environmental impact analysis. Environ. Impact Assess. Rev. 2022, 96, 106853. [Google Scholar] [CrossRef]
- Hansapinyo, C.; Latcharote, P.; Limkatanyu, S. Seismic Building Damage Prediction From GIS-Based Building Data Using Artificial Intelligence System. Front. Built Environ. 2020, 6, 576919. [Google Scholar] [CrossRef]
- Ketsap, A.; Hansapinyo, C.; Kronprasert, N.; Limkatanyu, S. Uncertainty and Fuzzy Decisions in Earthquake Risk Evaluation of Buildings. Eng. J. 2019, 27, 89–105. [Google Scholar] [CrossRef]
- Saicheur, K.; Hansapinyo, C. Seismic loss estimation and reduction after structural rehabilitation in Chiang Rai city. Walailak J. Sci. Technol. 2017, 14, 485–499. [Google Scholar]
- Saicheur, K.; Hansapinyo, C. Structural Repair Prioritization of Buildings Damaged After Earthquake Using Fuzzy Logic Model. J. Disaster Res. 2016, 11, 559–565. [Google Scholar] [CrossRef]
- Hansapinyo, C.; Limkatanyu, S.; Zhang, H.; Imjai, T. Residual Strength of Reinforced Concrete Beams under Sequential Small Impact Loads. Buildings 2021, 11, 518. [Google Scholar] [CrossRef]
- Tantrapongsaton, W.; Hansapinyo, C.; Wongmatar, P.; Limkatanyu, S.; Zhang, H.; Charatpangoon, B. Analysis of colliding index on impact behavior of RC columns under repeated impact loading. Comput. Concr. 2022, 31, 19–32. [Google Scholar]
- Tantrapongsaton, W.; Hansapinyo, C.; Limkatanyu, S.; Zhang, H.; Vimonsatit, V. Nonlinear Response of RC Columns Subjected to Equal Energy-Double Impact Loads. Buildings 2022, 12, 1420. [Google Scholar] [CrossRef]
- Hansapinyo, C.; Wongmatar, P.; Vimonsatit, V.; Chen, W. Pounding of Seismically Designed Low-rise Reinforced Concrete Frames. Proc. Inst. Civ. Eng. Struct. Build. 2019, 172, 819–835. [Google Scholar] [CrossRef]
- Hailemariam, E.K.; Hailemariam, L.M.; Amede, E.A.; Nuramo, D.A. Identification of barriers, benefits and opportunities of using bamboo materials for structural purposes. Eng. Constr. Archit. Manag. 2022, ahead-of-print. [Google Scholar] [CrossRef]
- ISO 22157-1:2019; Bamboo—Determination of Physical and Mechanical Properties—Part 1. 2019. International Organization for Standardization: Geneva, Switzerland, 2019.
- ISO 19624:2018; Bamboo Structures—Grading of Bamboo Culms—Basic Principles and Procedures. 2018. International Organization for Standardization: Geneva, Switzerland, 2018.
- Bahtiar, E.T.; Trujillo, D.; Nugroho, N. Compression resistance of short members as the basis for structural grading of Guadua angustifolia. Constr. Build. Mater. 2020, 249, 118759. [Google Scholar] [CrossRef]
- Wakchaure, M.R.; Kute, S.Y. Effect of moisture content on physical and mechanical properties of bamboo. Asian J. Civ. Eng. (Build. Hous.) 2012, 13, 753–763. [Google Scholar]
- Park, J.W.; Awalluddin, D.; Mohd Ariffin, M.A.; Osman, M.H.; Hussin, M.W.; Ismail, M.A.; Lee, H.-S.; Lim, N.H.A.S.; Ay Lie, H.; Hardjasaputra, H.; et al. Mechanical properties of different bamboo species. In Proceedings of the 6th International Conference of Euro Asia Civil Engineering Forum (EACEF 2017), Seoul, Republic of Korea, 22–25 August 2017; Volume 138. [Google Scholar] [CrossRef]
- Ribeiro, L.H.M.d.S.; Aguiar, L.M.d.; Nogueira, E.A.d.S.; Dias, J.F.; Beijo, L.A. Influence of section and moisture content on the tensile strength parallel to fibers of bamboo culms woody material. Pesqui. Agropecuária Trop. 2019, 49, e53562. [Google Scholar] [CrossRef]
- Oka, G.M.; Triwiyono, A.; Awaludin, A.; Siswosukarto, S. Effects of Node, Internode and Height Position on the Mechanical Properties of Gigantochloa Atroviolacea Bamboo. Procedia Eng. 2014, 95, 31–37. [Google Scholar] [CrossRef]
- Liu, P.; Zhou, Q.; Fu, F.; Li, W. Effect of Bamboo Nodes on the Mechanical Properties of P. edulis (Phyllostachys edulis) Bamboo. Forests 2021, 12, 1309. [Google Scholar] [CrossRef]
- Chen, G.; Luo, H. Effects of node with discontinuous hierarchical fibers on the tensile fracture behaviors of natural bamboo. Sustain. Mater. Technol. 2020, 26, e00228. [Google Scholar] [CrossRef]
- Lo, T.Y.; Cui, H.Z.; Leung, H.C. The effect of fiber density on strength capacity of bamboo. Mater. Lett. 2004, 58, 2595–2598. [Google Scholar] [CrossRef]
- Bahtiar, E.T.; Imanullah, A.P.; Hermawan, D.; Nugroho, N.; Abdurachman. Structural grading of three sympodial bamboo culms (Hitam, Andong, and Tali) subjected to axial compressive load. Eng. Struct. 2019, 181, 233–245. [Google Scholar] [CrossRef]
- Huang, P.; Chang, W.-S.; Ansell, M.P.; Chew, Y.M.J.; Shea, A. Density distribution profile for internodes and nodes of Phyllostachys edulis (Moso bamboo) by computer tomography scanning. Constr. Build. Mater. 2015, 93, 197–204. [Google Scholar] [CrossRef]
- Nurmadina; Nugroho, N.; Bahtiar, E.T. Structural grading of Gigantochloa apus bamboo based on its flexural properties. Constr. Build. Mater. 2017, 157, 1173–1189. [Google Scholar] [CrossRef]
- Bahtiar, E.T.; Malkowska, D.; Trujillo, D.; Nugroho, N. Experimental study on buckling resistance of Guadua angustifolia bamboo column. Eng. Struct. 2021, 228, 111548. [Google Scholar] [CrossRef]
- Nugroho, N.; Bahtiar, E.T. Buckling formulas for designing a column with Gigantochloa apus. Case Stud. Constr. Mater. 2021, 14, e00516. [Google Scholar] [CrossRef]
- Jayanetti, L.; Follett, P. INBAR Technical Report 16: Bamboo in Construction—An Introdution; International Bamboo and Rattan Organization: Beijing, China, 1998. [Google Scholar]
- Liu, X.; Wu, Y.; Zhou, Y. Axial Compression Prediction and GUI Design for CCFST Column Using Machine Learning and Shapley Additive Explanation. Buildings 2022, 12, 698. [Google Scholar] [CrossRef]
- Eakin, M.; Schkade, L.L.; Whiteside, M. Optimal Cost Sampling for Decision Making with Multiple Regression Models. Decis. Sci. 1989, 20, 14–26. [Google Scholar] [CrossRef]
- Uyanık, G.K.; Güler, N. A Study on Multiple Linear Regression Analysis. Procedia Soc. Behav. Sci. 2013, 106, 234–240. [Google Scholar] [CrossRef]
- Bahtiar, E.T.; Nugroho, N.; Surjokusumo, S.; Karlinasari, L. Eccentricity Effect on Bamboo’s Flexural Properties. J. Biol. Sci. 2013, 13, 82–87. [Google Scholar] [CrossRef]
- Nettleton, D. Chapter 6—Selection of Variables and Factor Derivation. In Commercial Data Mining; Nettleton, D., Ed.; Morgan Kaufmann: Burlington, MA, USA, 2014; pp. 79–104. [Google Scholar]
- Kotu, V.; Deshpande, B. Chapter 4—Classification. In Data Science, 2nd ed.; Kotu, V., Deshpande, B., Eds.; Morgan Kaufmann: Burlington, MA, USA, 2019; pp. 65–163. [Google Scholar]
- Berman, J.J. Chapter 4—Understanding Your Data. In Data Simplification; Berman, J.J., Ed.; Morgan Kaufmann: Boston, MA, USA, 2016; pp. 135–187. [Google Scholar]
- Akoglu, H. User’s guide to correlation coefficients. Turk. J. Emerg. Med. 2018, 18, 91–93. [Google Scholar] [CrossRef]
- Trujillo, D.; Jangra, S. Grading of Bamboo. Int. Netw. Bamboo Ratt. 2016, 1, 38–47. [Google Scholar]
- ISO 22156:2021; Bamboo structure—Bamboo culms—Structural Design. 2021. International Organization for Standardization: Geneva, Switzerland, 2021.
- Binti Yusoff, S.; Bee Wah, Y. Comparison of conventional measures of skewness and kurtosis for small sample size. In Proceedings of the 2012 International Conference on Statistics in Science, Business and Engineering (ICSSBE), Langkawi, Malaysia, 10–12 September 2012; pp. 1–6. [Google Scholar]
- Yuan, K.-H.; Bentler, P.M.; Zhang, W. The Effect of Skewness and Kurtosis on Mean and Covariance Structure Analysis. Sociol. Methods Res. 2016, 34, 240–258. [Google Scholar] [CrossRef]
- Kim, H.Y. Statistical notes for clinical researchers: Assessing normal distribution (2) using skewness and kurtosis. Restor Dent Endod 2013, 38, 52–54. [Google Scholar] [CrossRef] [PubMed]
- Daoud, J.I. Multicollinearity and Regression Analysis. J. Phys. Conf. Ser. 2017, 949, 012009. [Google Scholar] [CrossRef]
- Shrestha, N. Detecting Multicollinearity in Regression Analysis. Am. J. Appl. Math. Stat. 2020, 8, 39–42. [Google Scholar] [CrossRef]


| The Correlation of Coefficient (r) | The Level of Statistical Correlation |
|---|---|
| ±0.01 to ±0.09 | Trivial |
| ±0.10 to ±0.29 | Low–moderate |
| ±0.30 to ±0.49 | Moderate–substantial |
| ±0.50 to ±0.69 | Substantial–very strong |
| ±0.70 to ±0.89 | Very strong |
| ±0.90 to ±0.99 | Near perfect |
| Properties | Min | Max | Mean | SD | Skewness | Kurtosis |
|---|---|---|---|---|---|---|
| Part 1. Dimensions and Physical Properties | ||||||
| Culm wall thickness (t, mm.) | 6.779 | 27.028 | 12.886 | 4.528 | 0.941 | 0.311 |
| External diameter (D, mm.) | 74.603 | 109.290 | 89.821 | 8.013 | 0.739 | 0.330 |
| Moisture content (, %) | 11.071 | 19.702 | 13.720 | 2.089 | 0.976 | −0.077 |
| Eccentricity () | 0.068 | 0.415 | 0.241 | 0.072 | −0.399 | −0.065 |
| Ovality () | 0.910 | 0.998 | 0.968 | 0.017 | −0.462 | 0.192 |
| ISO ovality () | 0.002 | 0.094 | 0.033 | 0.018 | 0.515 | 0.311 |
| Air-dried density (, kg/m3) | 546.710 | 1113.262 | 847.030 | 124.716 | 0.157 | −0.285 |
| Oven-dried density (, kg/m3) | 485.855 | 1001.355 | 745.062 | 110.649 | 0.214 | −0.212 |
| Density at 12% Mc (, kg/m3) | 544.158 | 1121.518 | 834.469 | 123.926 | 0.214 | −0.212 |
| Air-dried linear mass (, kg/m) | 1.057 | 4.454 | 2.561 | 0.760 | 0.507 | −0.382 |
| Oven-dried linear mass (, kg/m) | 0.940 | 3.796 | 2.245 | 0.636 | 0.442 | −0.458 |
| Linear mass at 12% Mc (, kg/m) | 1.053 | 4.251 | 2.514 | 0.712 | 0.443 | −0.458 |
| Part 2. Results from the compressive test | ||||||
| Maximum compressive load (, kN) | 71.982 | 256.934 | 167.342 | 41.755 | 0.132 | −0.821 |
| Maximum compressive strength (, MPa) | 36.233 | 71.923 | 55.979 | 8.094 | −0.358 | −0.579 |
| t | D | |||||||||||||
|---|---|---|---|---|---|---|---|---|---|---|---|---|---|---|
| t | 1 | 0.147 | 0.714 * | −0.097 | 0.069 | −0.067 | −0.36 * | −0.443 * | −0.443 * | 0.792 * | 0.777 * | 0.777 * | 0.759 * | −0.602 * |
| D | 1 | 0.020 | 0.039 | −0.051 | 0.052 | 0.123 | 0.122 | 0.122 | 0.532 * | 0.559 * | 0.559 * | 0.544 * | −0.032 | |
| 1 | 0.026 | −0.052 | 0.054 | 0.012 | −0.111 | −0.111 | 0.691 * | 0.651 * | 0.651 * | 0.466 * | −0.53 * | |||
| 1 | −0.977 * | 0.974 * | 0.162 | 0.157 | 0.157 | 0.011 | 0.011 | 0.011 | −0.021 | 0.090 | ||||
| 1 | −1 * | −0.112 | −0.104 | −0.104 | −0.023 | −0.021 | −0.021 | 0.002 | −0.059 | |||||
| 1 | 0.109 | 0.101 | 0.101 | 0.025 | 0.022 | 0.022 | −0.001 | 0.056 | ||||||
| 1 | 0.992 * | 0.992 * | 0.165 | 0.174 | 0.174 | −0.040 | 0.556 * | |||||||
| 1 | 1 * | 0.080 | 0.094 | 0.094 | −0.096 | 0.616 * | ||||||||
| 1 | 0.080 | 0.094 | 0.094 | −0.096 | 0.616 * | |||||||||
| 1 | 0.998 * | 0.998 * | 0.884 * | −0.301 * | ||||||||||
| 1 | 1 | 0.894 * | −0.277 * | |||||||||||
| 1 | 0.894 * | −0.277 * | ||||||||||||
| 1 | −0.091 | |||||||||||||
| 1 |
| Variable | Model 1 | Model 2 | ||||||
|---|---|---|---|---|---|---|---|---|
| Coefficients | Standardized Coefficients | Coefficients | Standardized Coefficients | |||||
| b | Std. Error | Beta | t | b | Std. Error | Beta | t | |
| Culm wall thickness | 3.413 | 28.543 | 0.370 | 5.274 * | 3.069 | 0.591 | 0.333 | 5.193 * |
| External diameter | 0.383 | 0.647 | 0.074 | 1.286 *** | - | - | - | - |
| Moisture content | −5.834 | 0.298 | −0.292 | −5.032 * | −6.440 | 1.063 | −0.322 | −6.060 * |
| Linear mass at 12% Mc | 44.301 | 1.159 | 0.756 | 8.270 * | 49.567 | 3.463 | 0.845 | 14.315 * |
| Constant | 57.593 | 5.357 | 2.018 ** | 91.530 | 10.889 | 8.405 * | ||
| R2 = 0.861, Standard error of the estimate = 15.854, F = 164.254, Significance of F < 0.001 | R2 = 0.859, Standard error of the estimate = 15.902, F = 217.130, Significance of F < 0.001 | |||||||
| Variable | Model 1 | Model 2 | ||||||
|---|---|---|---|---|---|---|---|---|
| Coefficients | Standardized Coefficients | Coefficients | Standardized Coefficients | |||||
| b | Std. Error | Beta | t | b | Std. Error | Beta | t | |
| Culm wall thickness | −0.089 | 0.184 | −0.050 | −0.481 ** | - | - | - | - |
| Moisture content | −1.683 | 0.360 | −0.434 | −4.678 * | −1.812 | 0.238 | −0.468 | −7.599 * |
| Density at 12% Mc | 0.036 | 0.005 | 0.546 | 7.538 * | 0.037 | 0.004 | 0.565 | 9.173 * |
| Constant | 50.435 | 5.037 | 10.013 * | 50.074 | 4.963 | 10.090 * | ||
| R2 = 0.597, Standard error of the estimate = 5.211, F = 52.791, Significance of F < 0.001 | R2 = 0.596, Standard error of the estimate = 5.192, F = 79.638, Significance of F < 0.001 | |||||||
| Grade | Compressive Strength , MPa) | Ratio | Grade | Compressive Strength , MPa) | Ratio | ||||
|---|---|---|---|---|---|---|---|---|---|
| 550–649 | 47.07 | 35.75 | 34.45 | 1.37 | 550–649 | 46.55 | 35.84 | 34.51 | 1.35 |
| 650–749 | 50.68 | 39.35 | 37.92 | 1.34 | 650–749 | 50.58 | 39.86 | 38.38 | 1.32 |
| 750–849 | 54.29 | 42.95 | 41.39 | 1.31 | 750–849 | 54.61 | 43.88 | 42.25 | 1.29 |
| 850–949 | 57.90 | 46.55 | 44.86 | 1.29 | 850–949 | 58.64 | 47.90 | 46.12 | 1.27 |
| 950–1049 | 61.51 | 50.15 | 48.33 | 1.27 | 950–1049 | 62.67 | 51.92 | 49.99 | 1.25 |
| ≥1050 | 65.12 | 53.75 | 51.80 | 1.26 | ≥1050 | 66.70 | 55.94 | 53.86 | 1.24 |
| Grade | Compressive Strength , kN) | Ratio | Grade | Compressive Strength , kN) | Ratio | ||||
|---|---|---|---|---|---|---|---|---|---|
| 0.50–0.99 | 79.08 | 46.45 | 43.48 | 1.82 | 0.50–0.99 | 74.58 | 43.33 | 40.56 | 1.84 |
| 1.00–1.49 | 103.38 | 70.70 | 66.18 | 1.56 | 1.00–1.49 | 100.80 | 69.51 | 65.06 | 1.55 |
| 1.50–1.99 | 127.68 | 94.95 | 88.88 | 1.44 | 1.50–1.99 | 127.02 | 95.68 | 89.56 | 1.42 |
| 2.00–2.49 | 151.98 | 119.20 | 111.58 | 1.36 | 2.00–2.49 | 153.23 | 121.85 | 114.06 | 1.34 |
| 2.50–2.99 | 176.27 | 143.45 | 134.28 | 1.31 | 2.50–2.99 | 179.45 | 148.03 | 138.56 | 1.30 |
| 3.00–3.49 | 200.57 | 167.70 | 156.98 | 1.28 | 3.00–3.49 | 205.67 | 174.20 | 163.06 | 1.26 |
| 3.50–3.99 | 224.87 | 191.95 | 179.68 | 1.25 | 3.50–3.99 | 231.88 | 200.38 | 187.56 | 1.24 |
| 4.00–4.49 | 249.17 | 216.20 | 202.38 | 1.23 | 4.00–4.49 | 258.10 | 226.55 | 212.07 | 1.22 |
| 4.50–4.99 | 273.47 | 240.46 | 225.08 | 1.21 | 4.50–4.99 | 284.32 | 252.72 | 236.57 | 1.20 |
| ≥5.00 | 297.76 | 264.71 | 247.78 | 1.20 | ≥5.00 | 310.53 | 278.90 | 261.07 | 1.19 |
| Compressive Strength | Species | Indicating Properties | Regression Equation | R2 |
|---|---|---|---|---|
| Maximum compressive Load | Dendrocalamus sericeus (this study) | Linear mass at 12% Mc (kg/m) | 0.80 | |
| Linear mass at air-dried (kg/m) | 0.78 | |||
| Culm wall thickness (mm) | 0.58 | |||
| External diameter (mm) | 0.30 | |||
| Moisture content (%) | 0.22 | |||
| Guadua angustifolia [21] | Linear mass at 12% Mc (kg/m) | 0.89 | ||
| Linear mass at air-dried (kg/m) | 0.88 | |||
| External diameter (mm) | 0.76 | |||
| Gigantochloa atroviolacea [29] | Linear mass at air-dried (kg/m) | 0.95 | ||
| Gigantochloa apus [29] | Linear mass at air-dried (kg/m) | 0.82 | ||
| Gigantochloa pseudoarundinacea [29] | Linear mass at air-dried (kg/m) | 0.95 | ||
| Maximum compressive strength | Dendrocalamus sericeus (this study) | Density at 12% Mc (kg/m3) | 0.38 | |
| Density at air-dried (kg/m3) | 0.31 | |||
| Culm wall thickness (mm) | 0.36 | |||
| Moisture content (%) | 0.28 | |||
| Guadua angustifolia [21] | Density at 12% Mc (kg/m3) | 0.22 | ||
| Density at air-dried (kg/m3) | 0.19 | |||
| Gigantochloa atroviolacea [29] | Density at air-dried (g/cm3) | 0.74 | ||
| Gigantochloa apus [29] | Density at air-dried (g/cm3) | 0.68 | ||
| Gigantochloa pseudoarundinacea [29] | Density at air-dried (g/cm3) | 0.55 |
Disclaimer/Publisher’s Note: The statements, opinions and data contained in all publications are solely those of the individual author(s) and contributor(s) and not of MDPI and/or the editor(s). MDPI and/or the editor(s) disclaim responsibility for any injury to people or property resulting from any ideas, methods, instructions or products referred to in the content. |
© 2023 by the authors. Licensee MDPI, Basel, Switzerland. This article is an open access article distributed under the terms and conditions of the Creative Commons Attribution (CC BY) license (https://creativecommons.org/licenses/by/4.0/).
Share and Cite
Tangphadungrat, P.; Hansapinyo, C.; Buachart, C.; Suwan, T.; Limkatanyu, S. Analysis of Non-Destructive Indicating Properties for Predicting Compressive Strengths of Dendrocalamus sericeus Munro Bamboo Culms. Materials 2023, 16, 1352. https://doi.org/10.3390/ma16041352
Tangphadungrat P, Hansapinyo C, Buachart C, Suwan T, Limkatanyu S. Analysis of Non-Destructive Indicating Properties for Predicting Compressive Strengths of Dendrocalamus sericeus Munro Bamboo Culms. Materials. 2023; 16(4):1352. https://doi.org/10.3390/ma16041352
Chicago/Turabian StyleTangphadungrat, Panumat, Chayanon Hansapinyo, Chinnapat Buachart, Teewara Suwan, and Suchart Limkatanyu. 2023. "Analysis of Non-Destructive Indicating Properties for Predicting Compressive Strengths of Dendrocalamus sericeus Munro Bamboo Culms" Materials 16, no. 4: 1352. https://doi.org/10.3390/ma16041352