
Effects of Cold Rolling or Precipitation Hardening Treatment on the Microstructure, Mechanical Properties, and Corrosion Resistance of Ti-Rich Metastable Medium-Entropy Alloys

Abstract
:1. Introduction
2. Materials and Methods
3. Results and Discussion
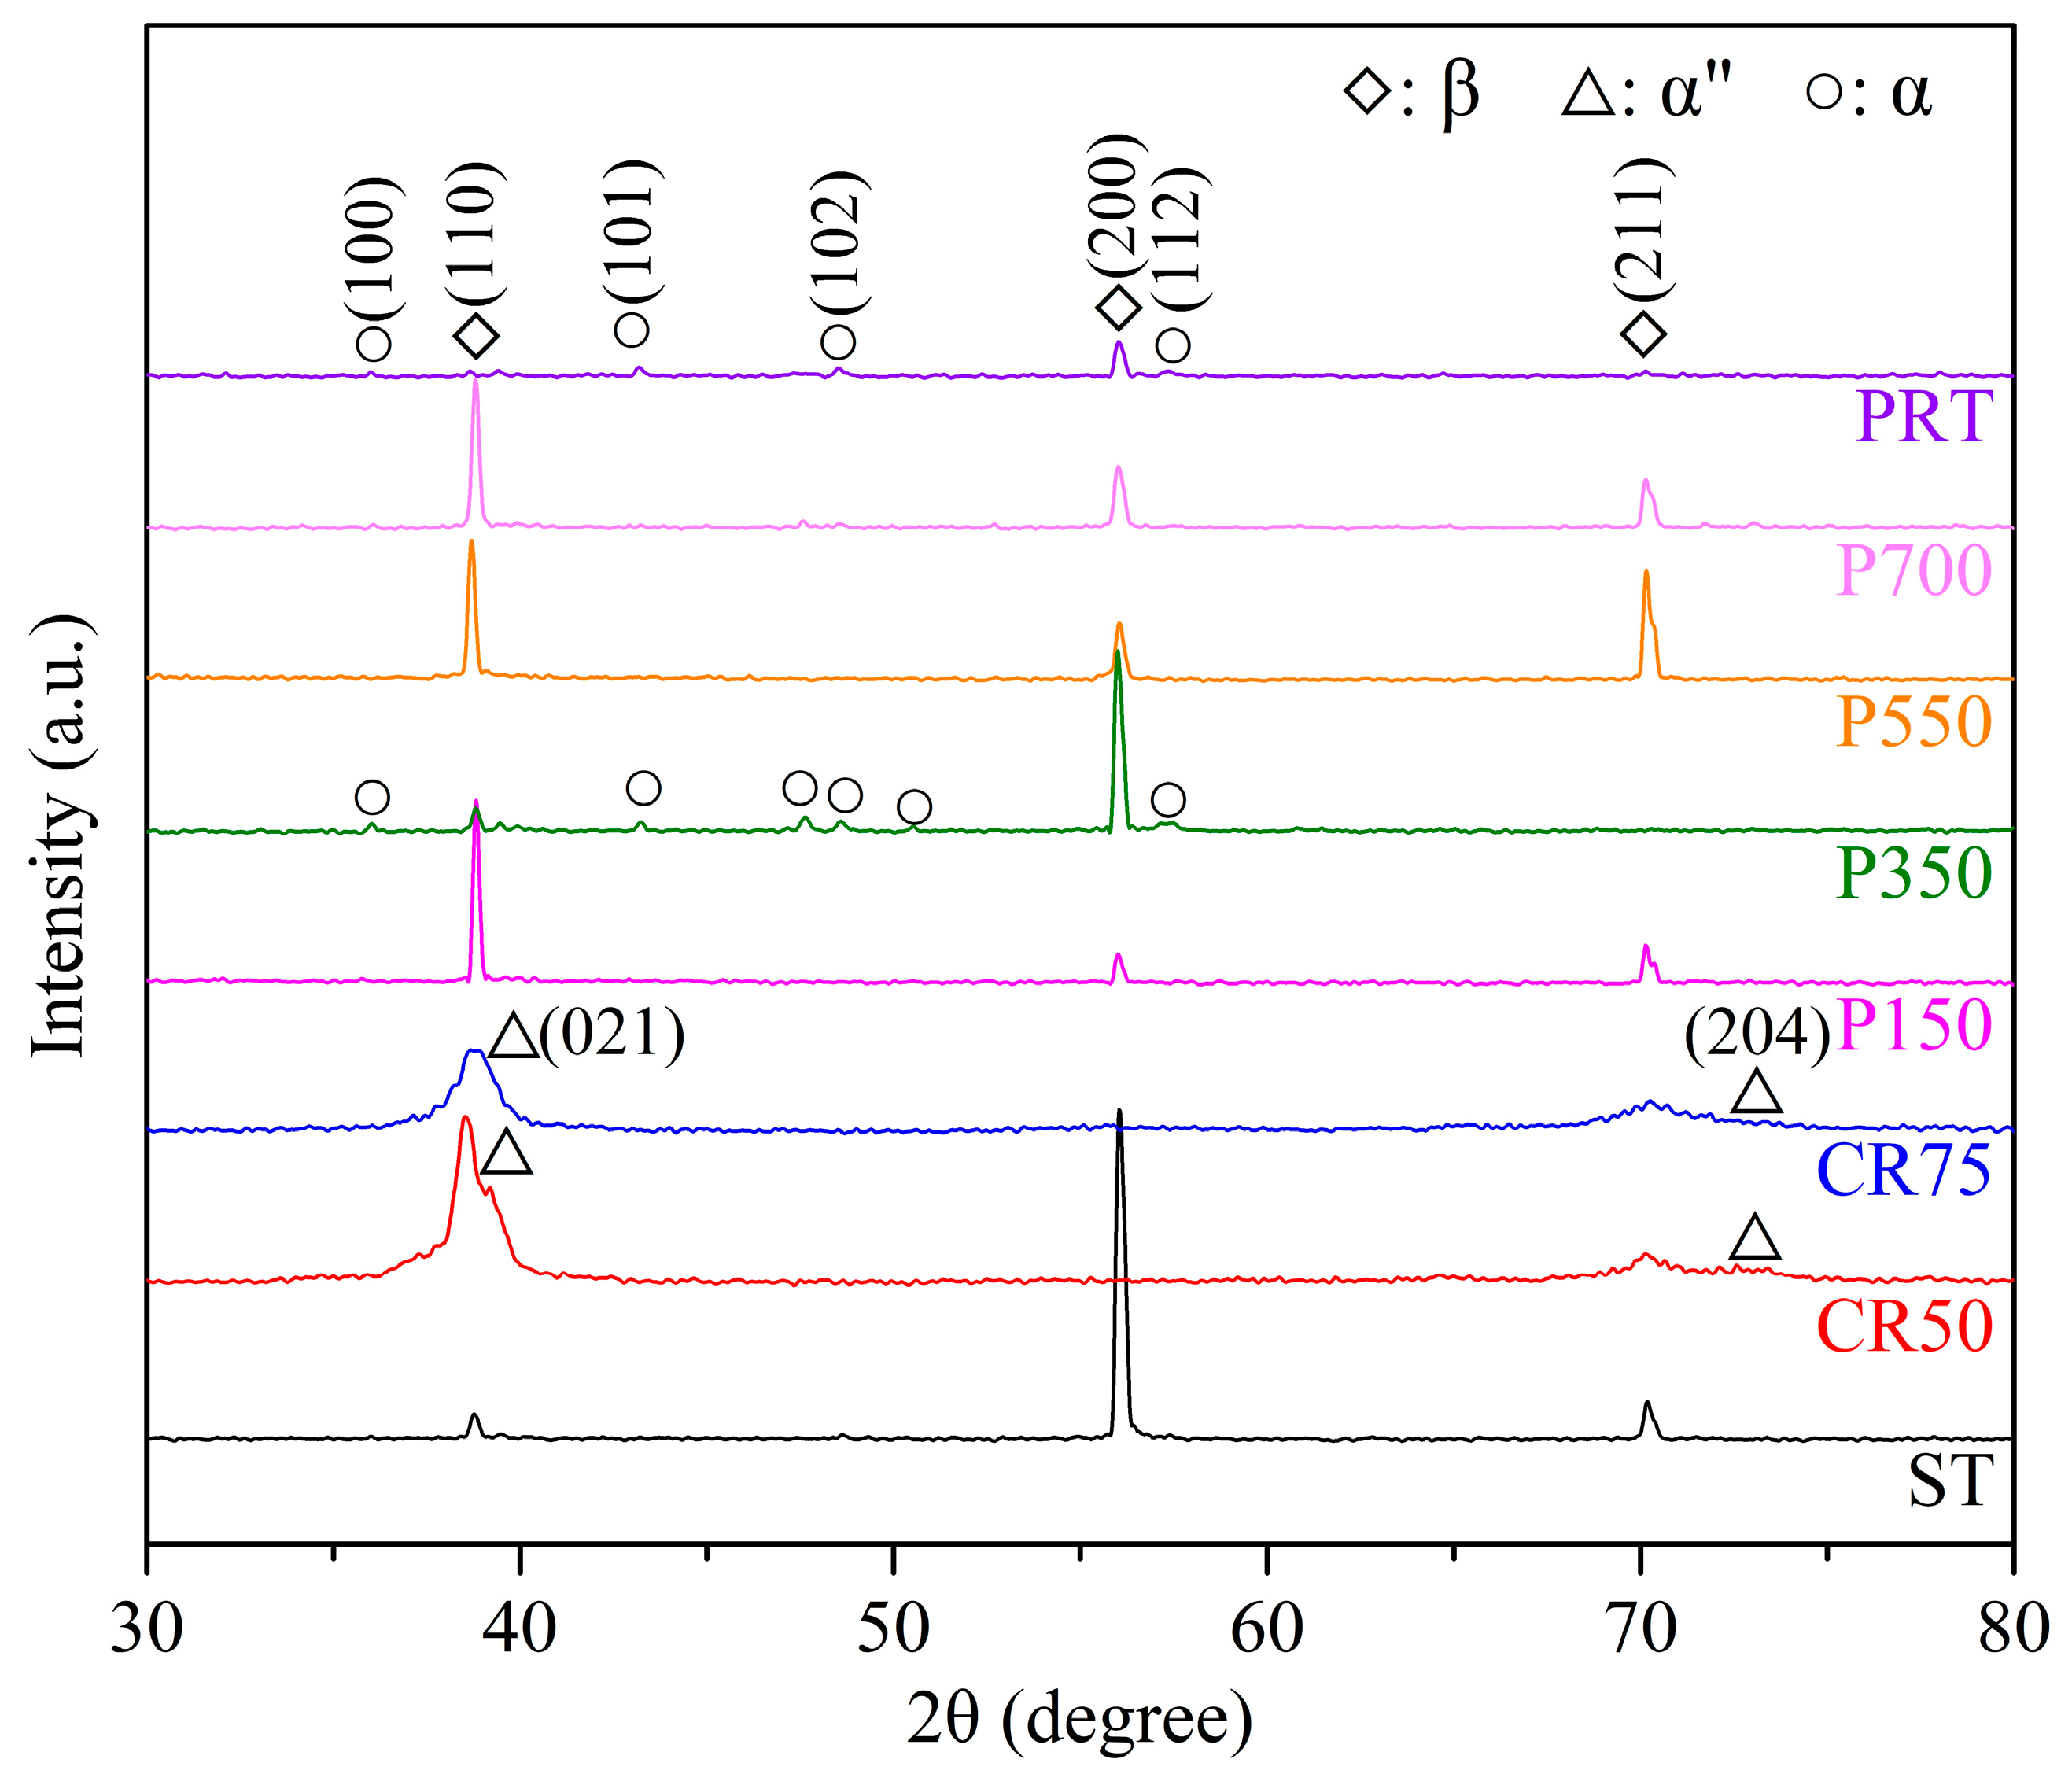
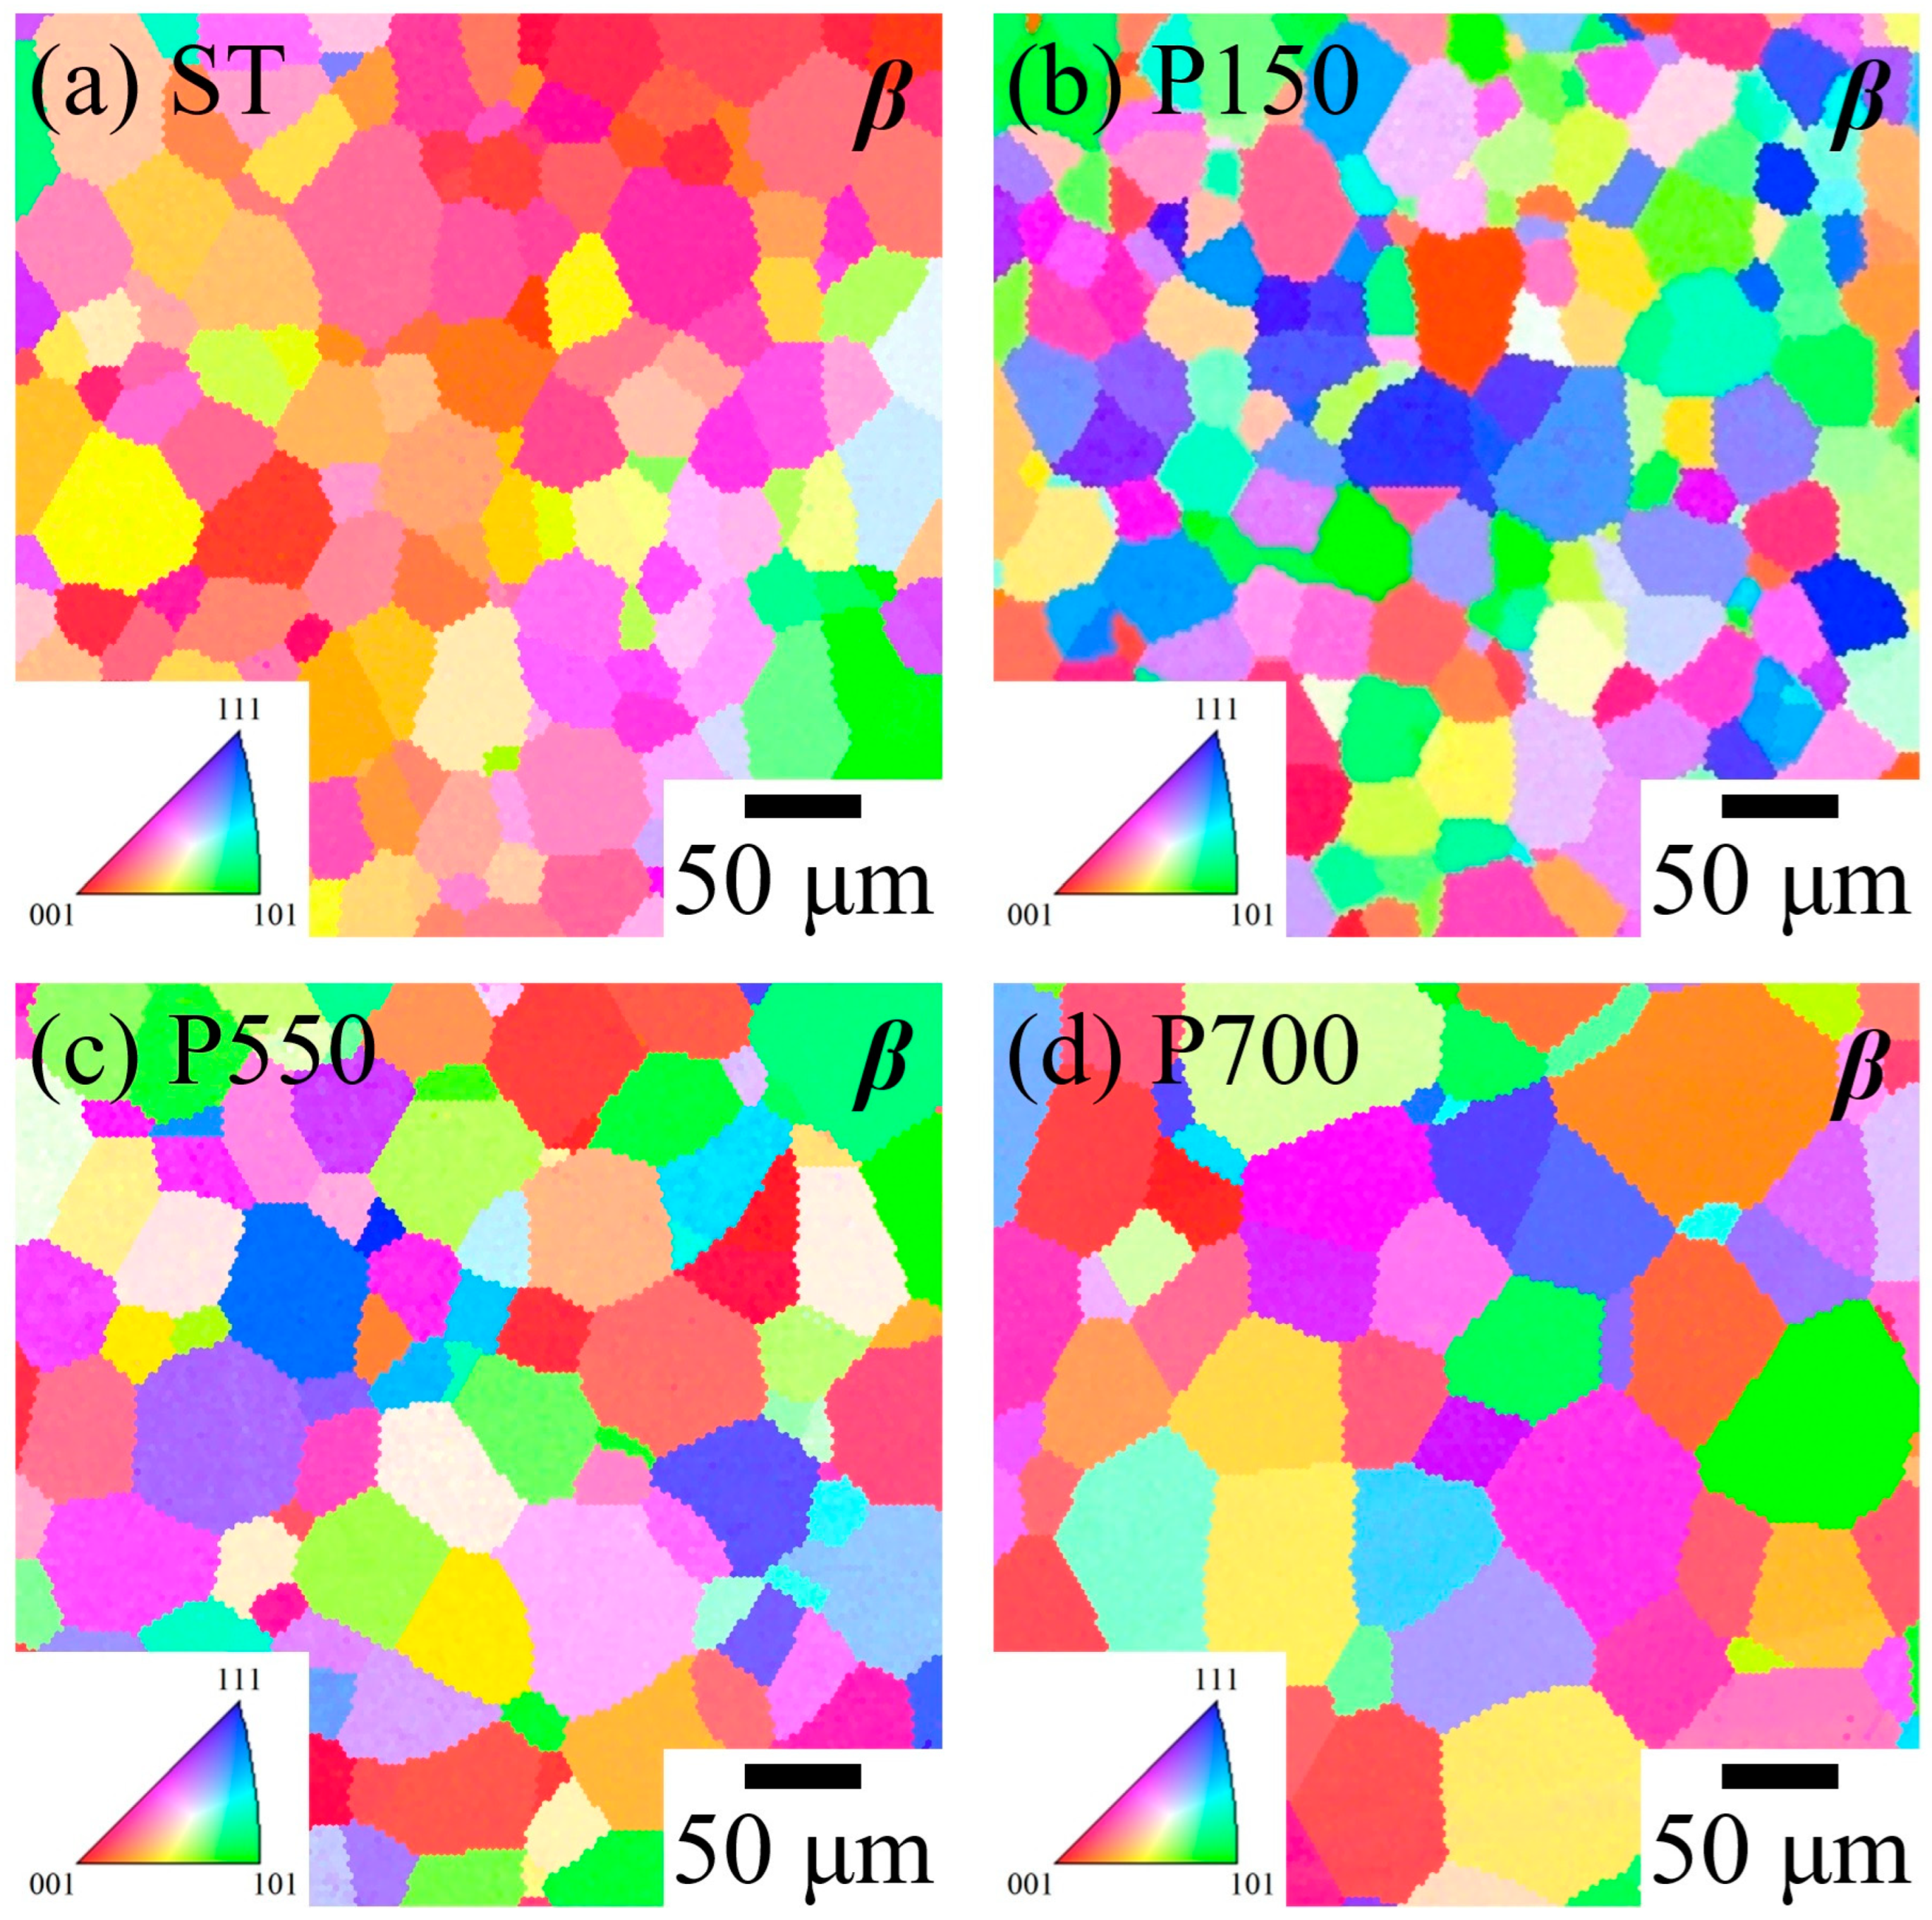
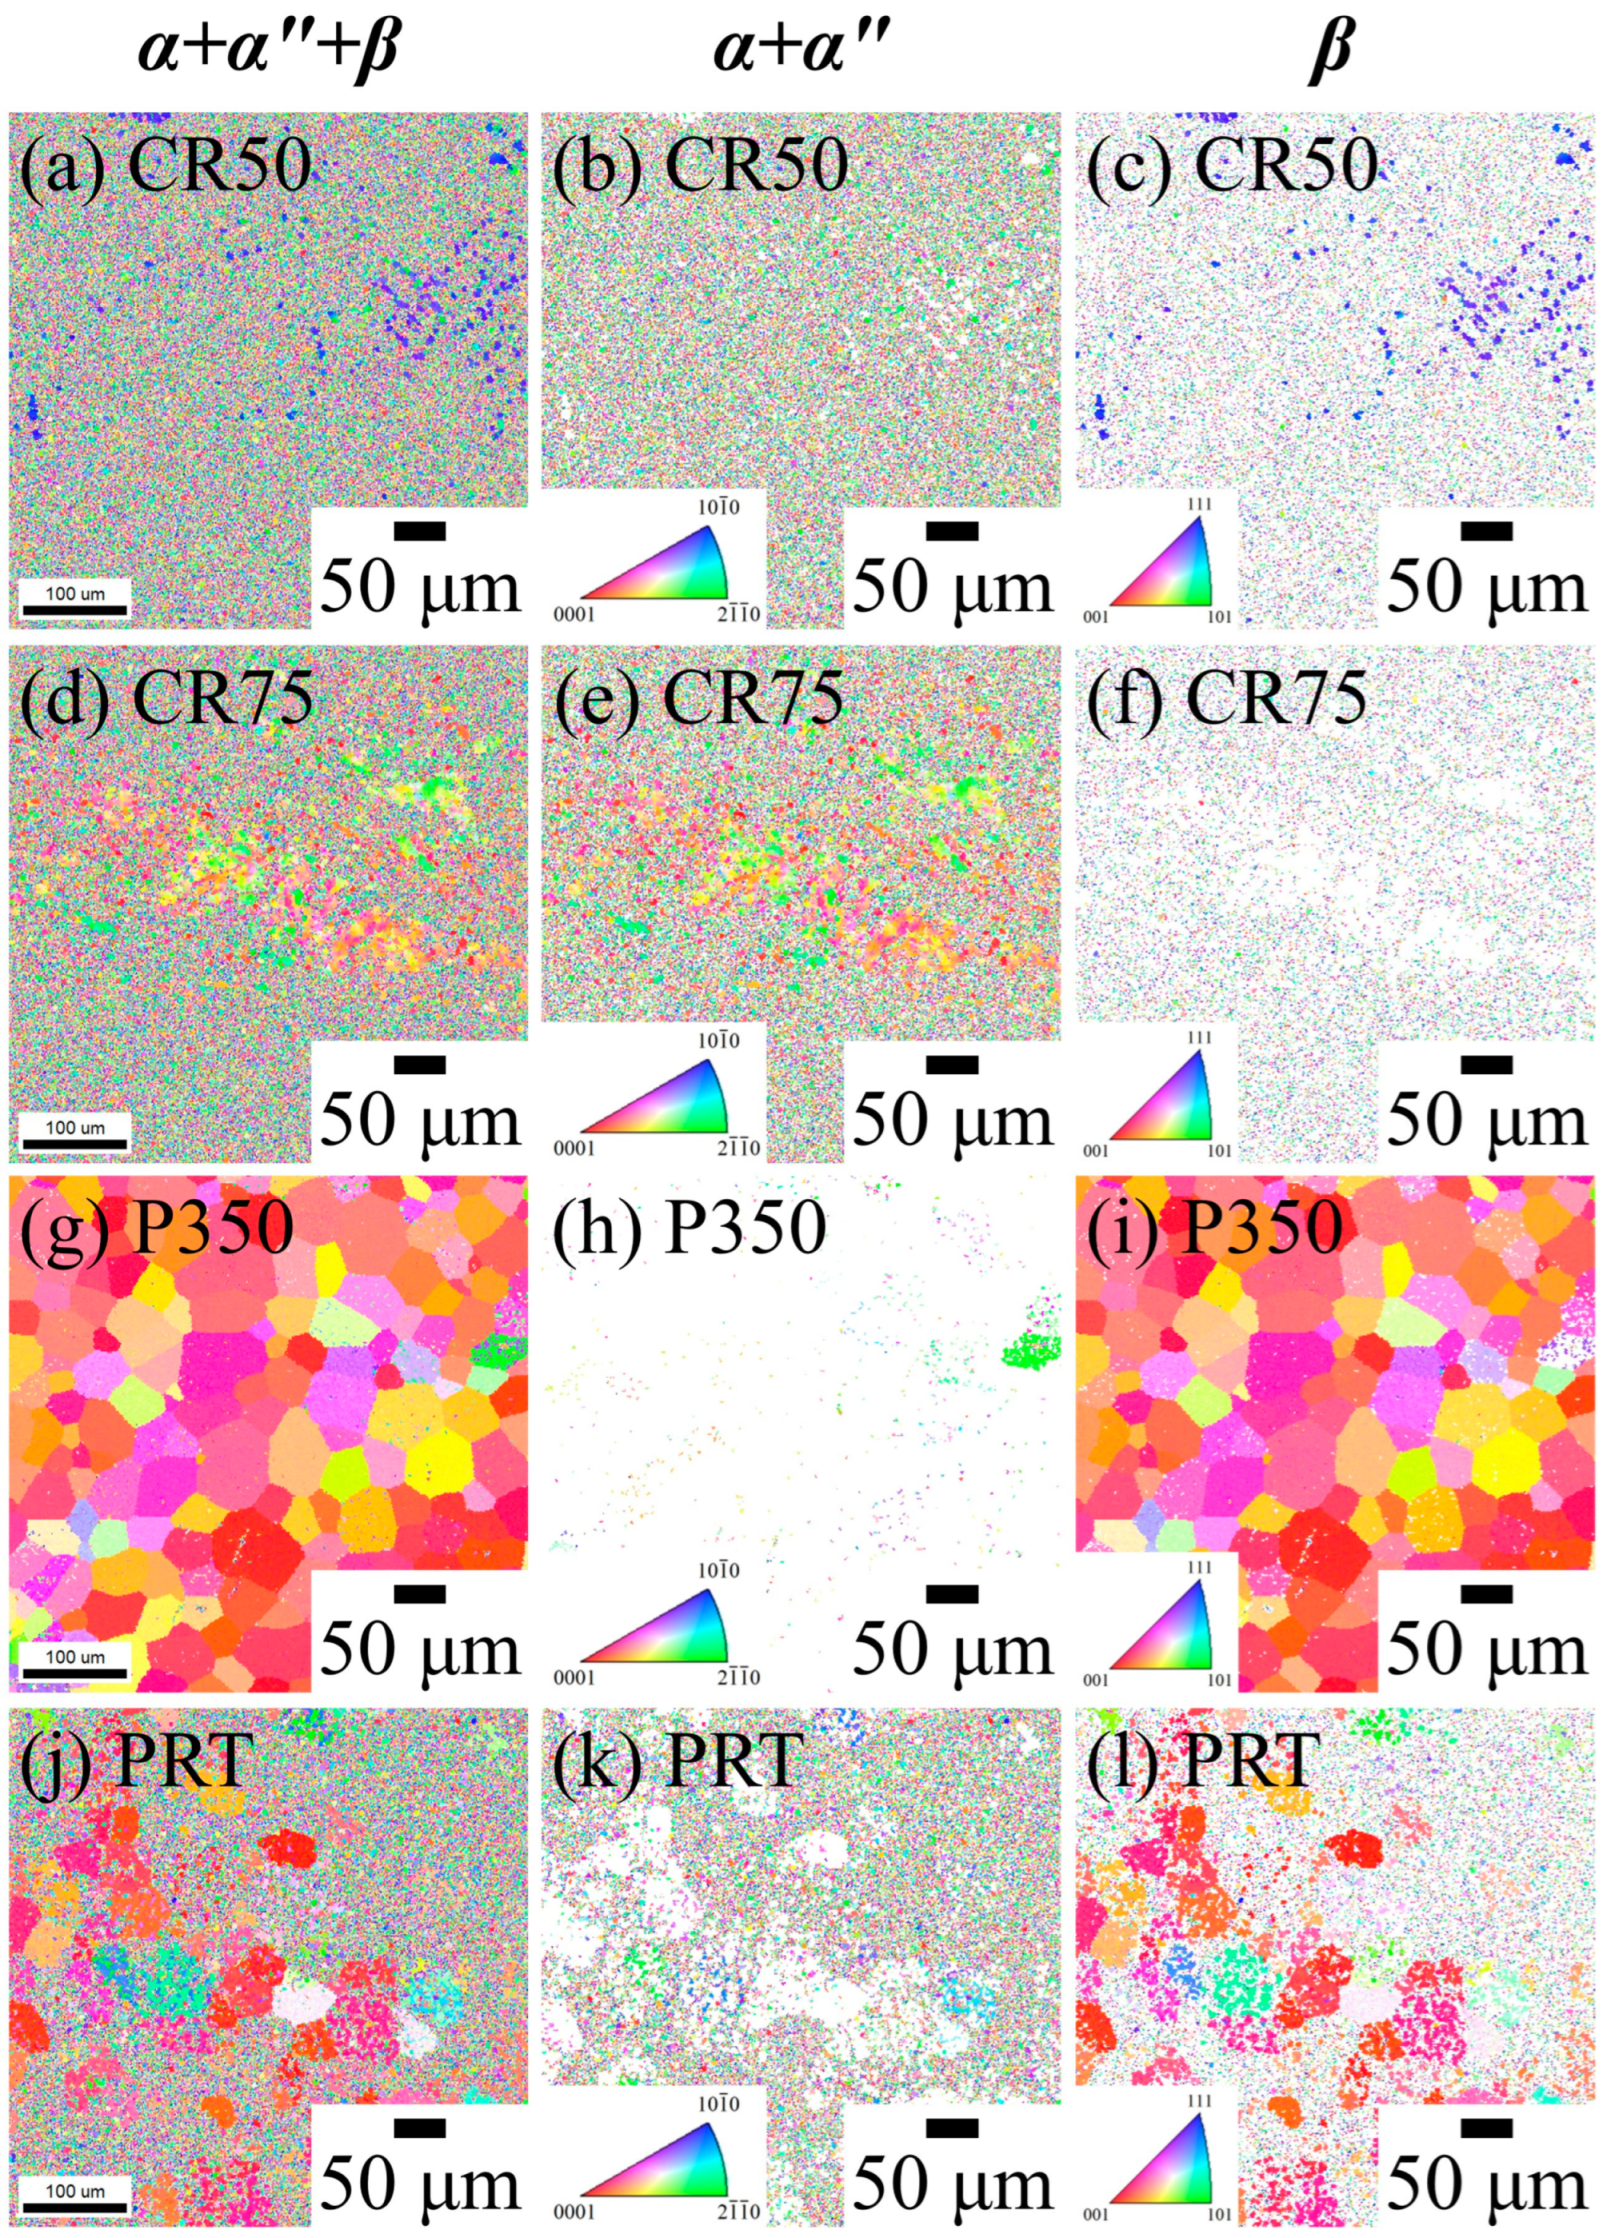
3.1. Microstructure
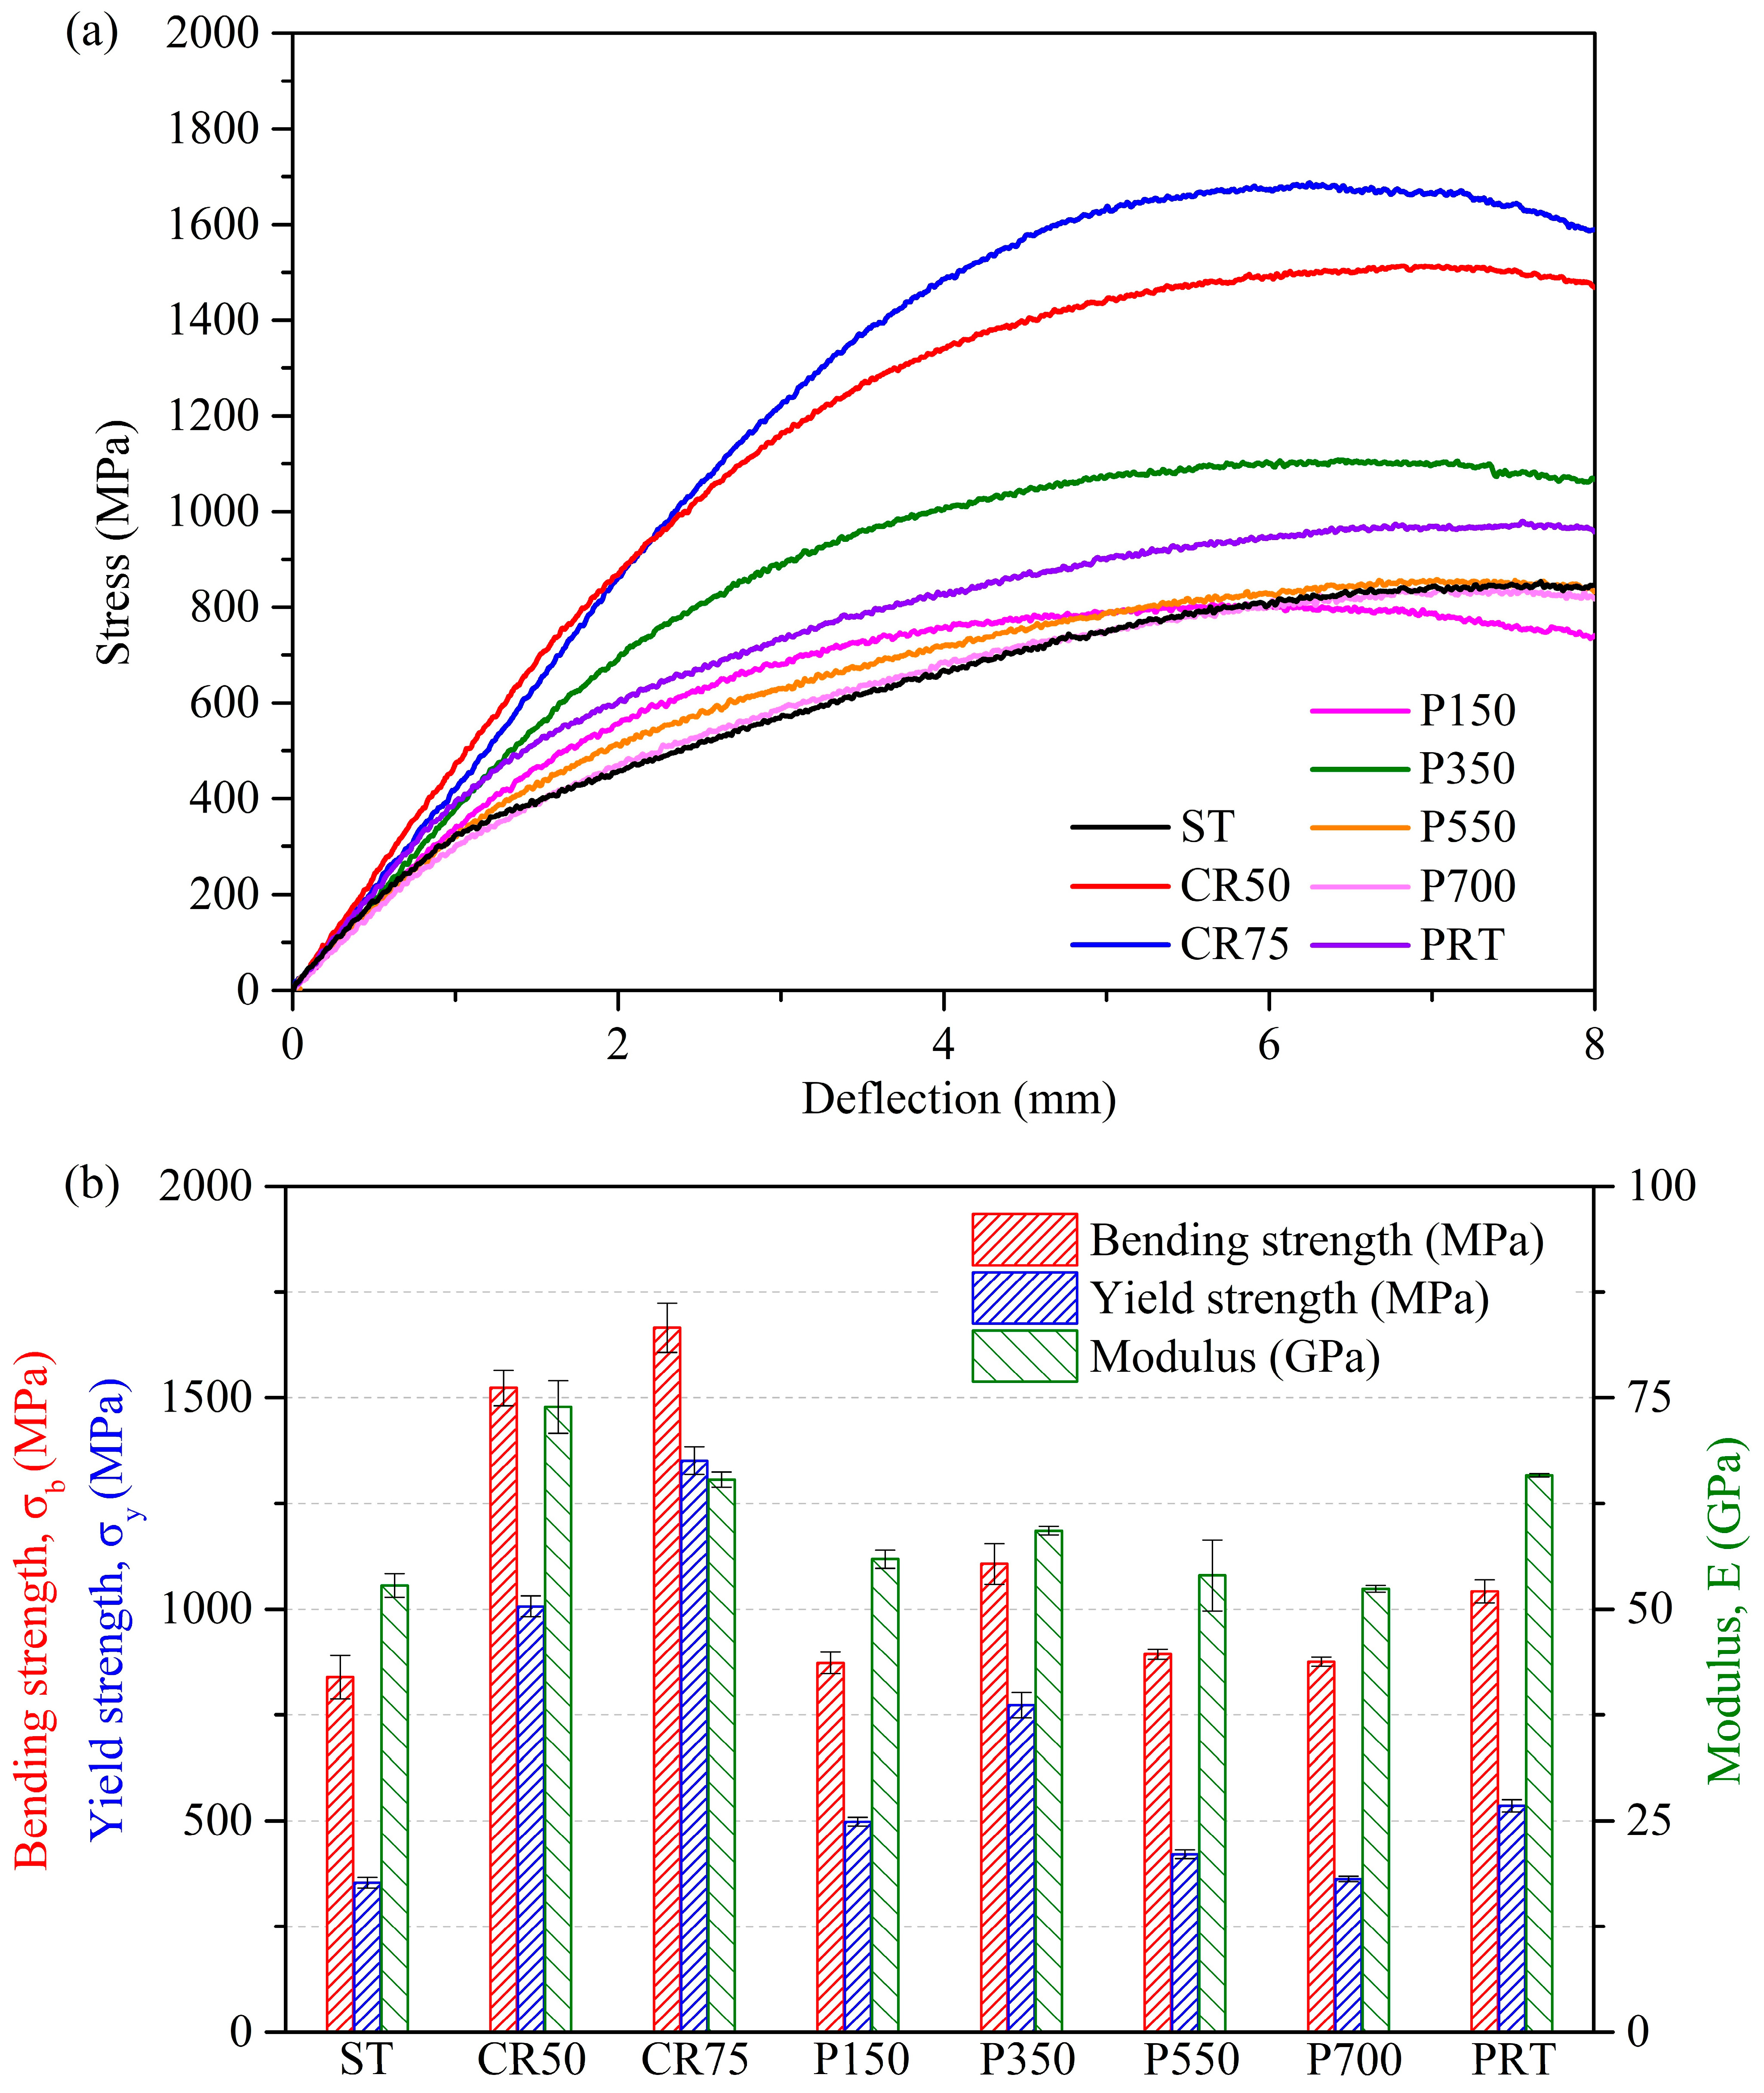
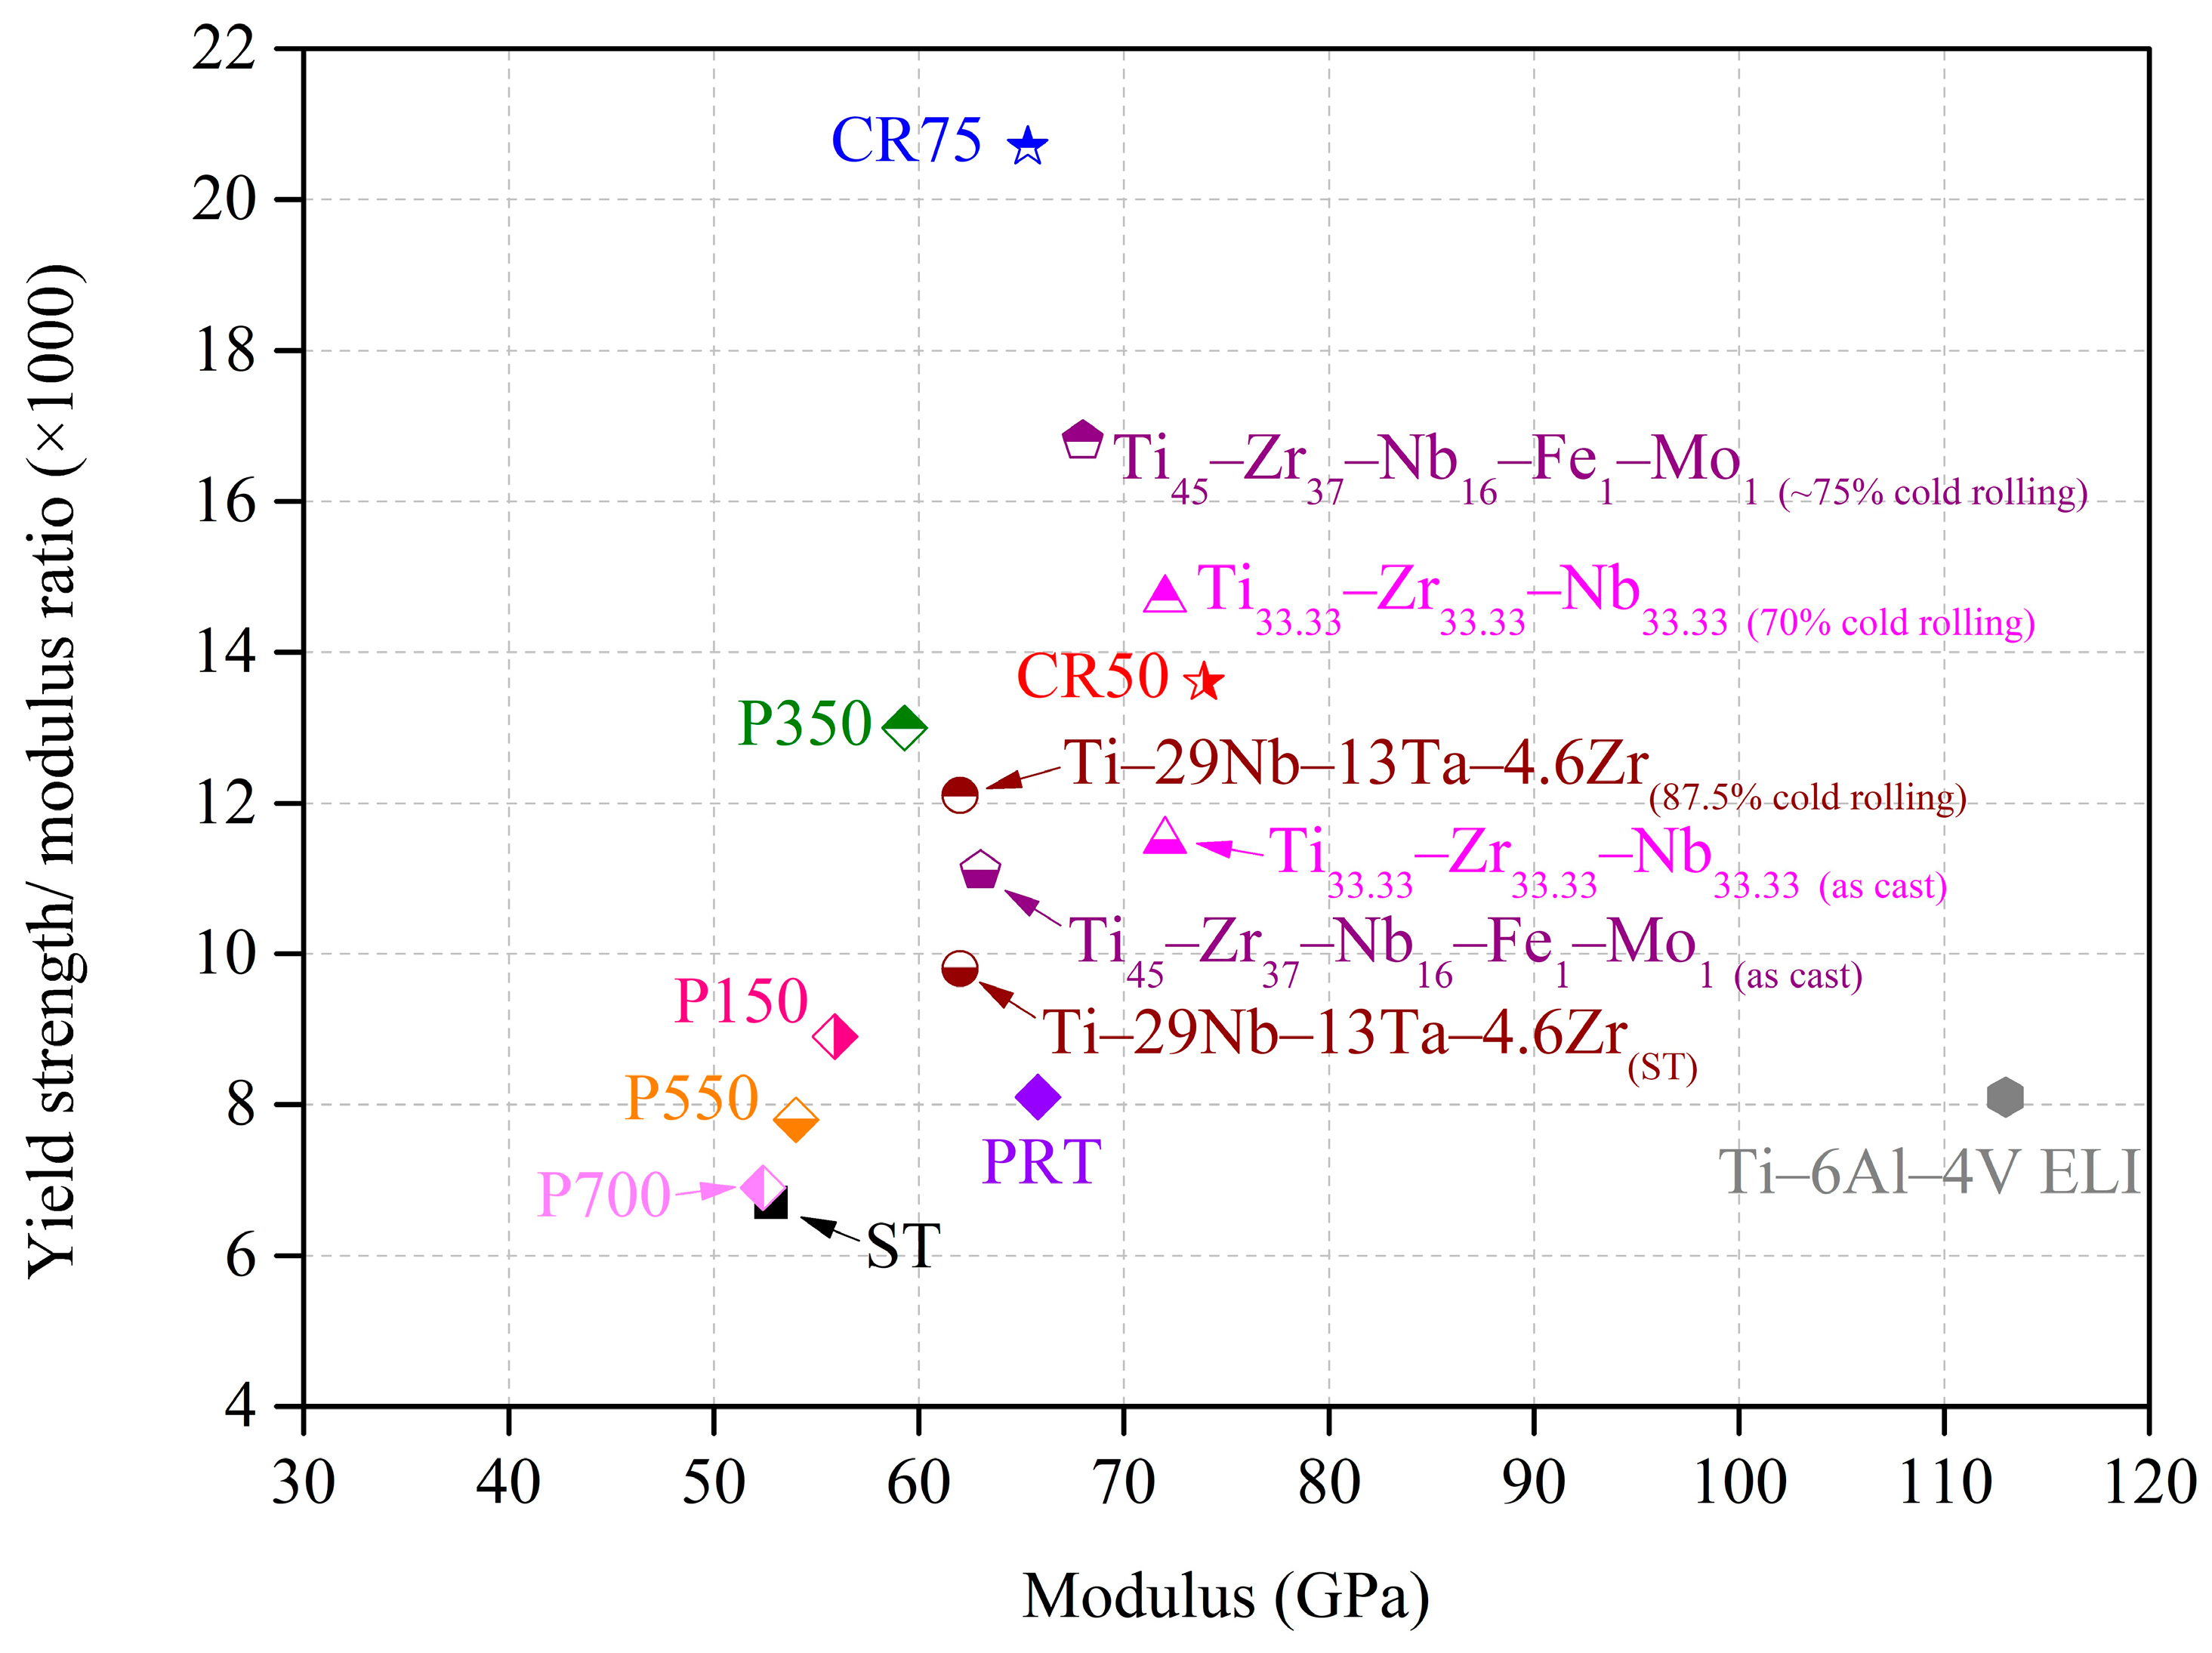
3.2. Mechanical Properties
3.3. Corrosion Properties
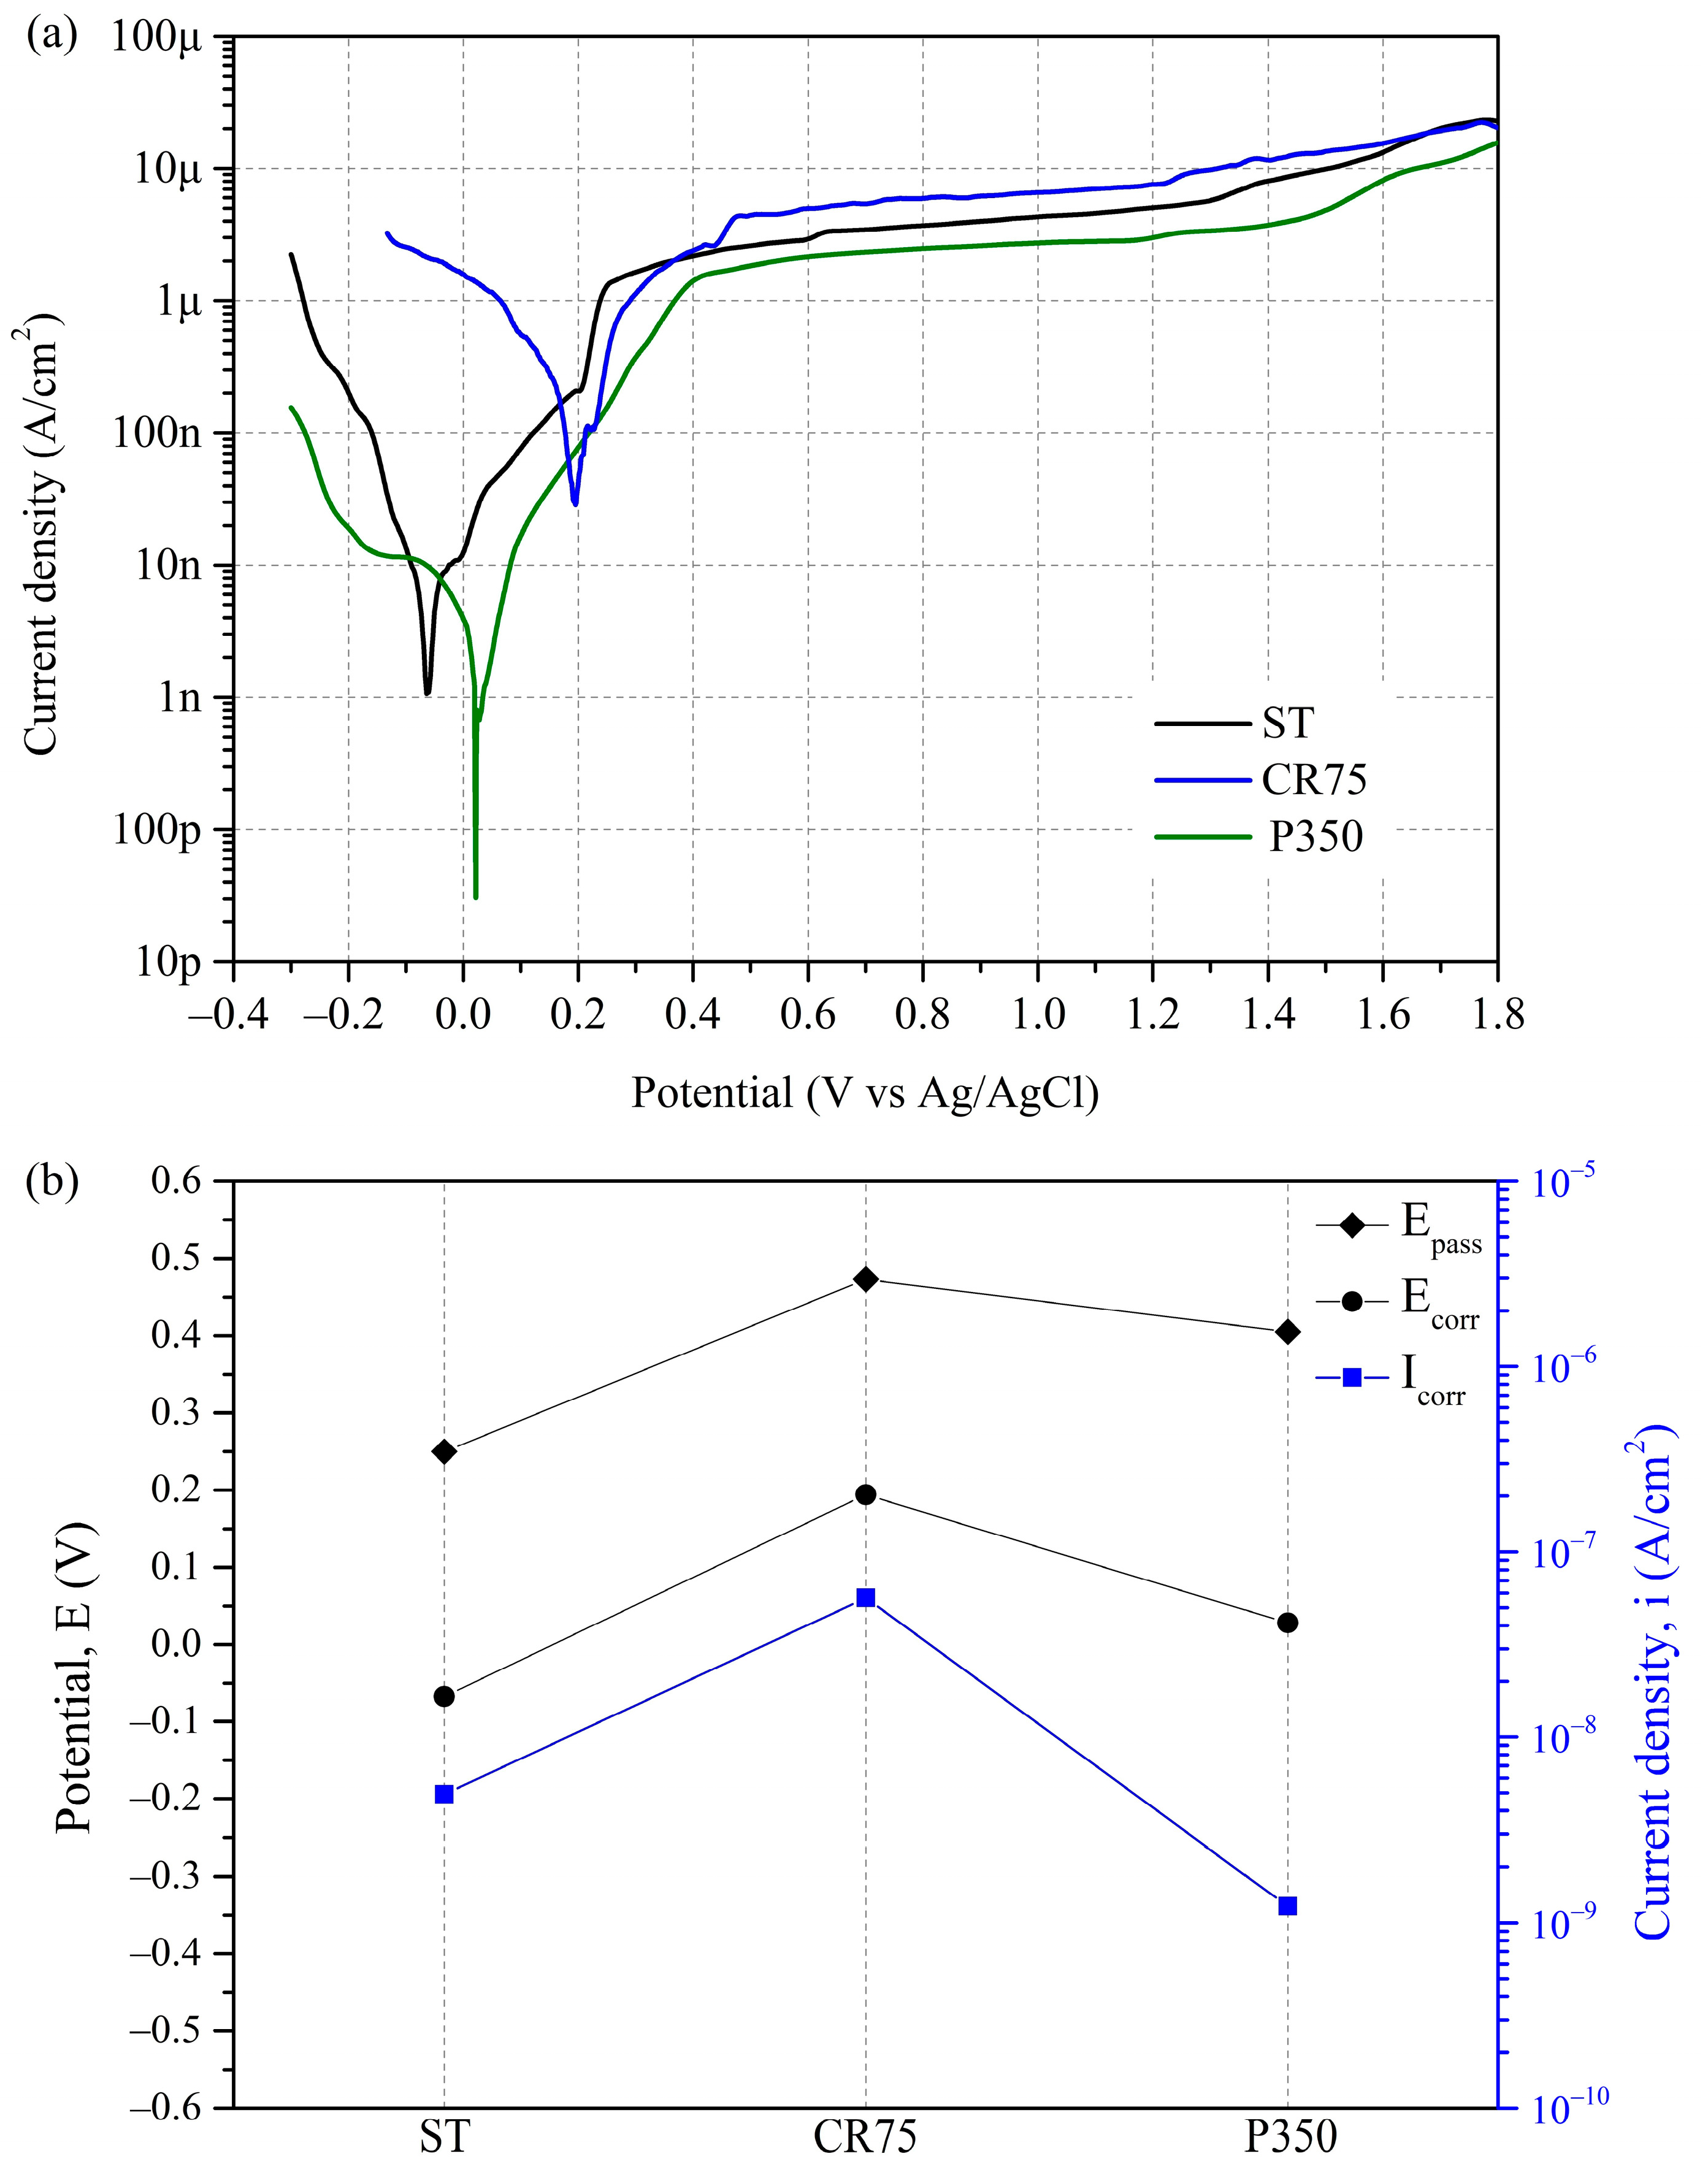
3.3.1. Potentiodynamic Polarization Test
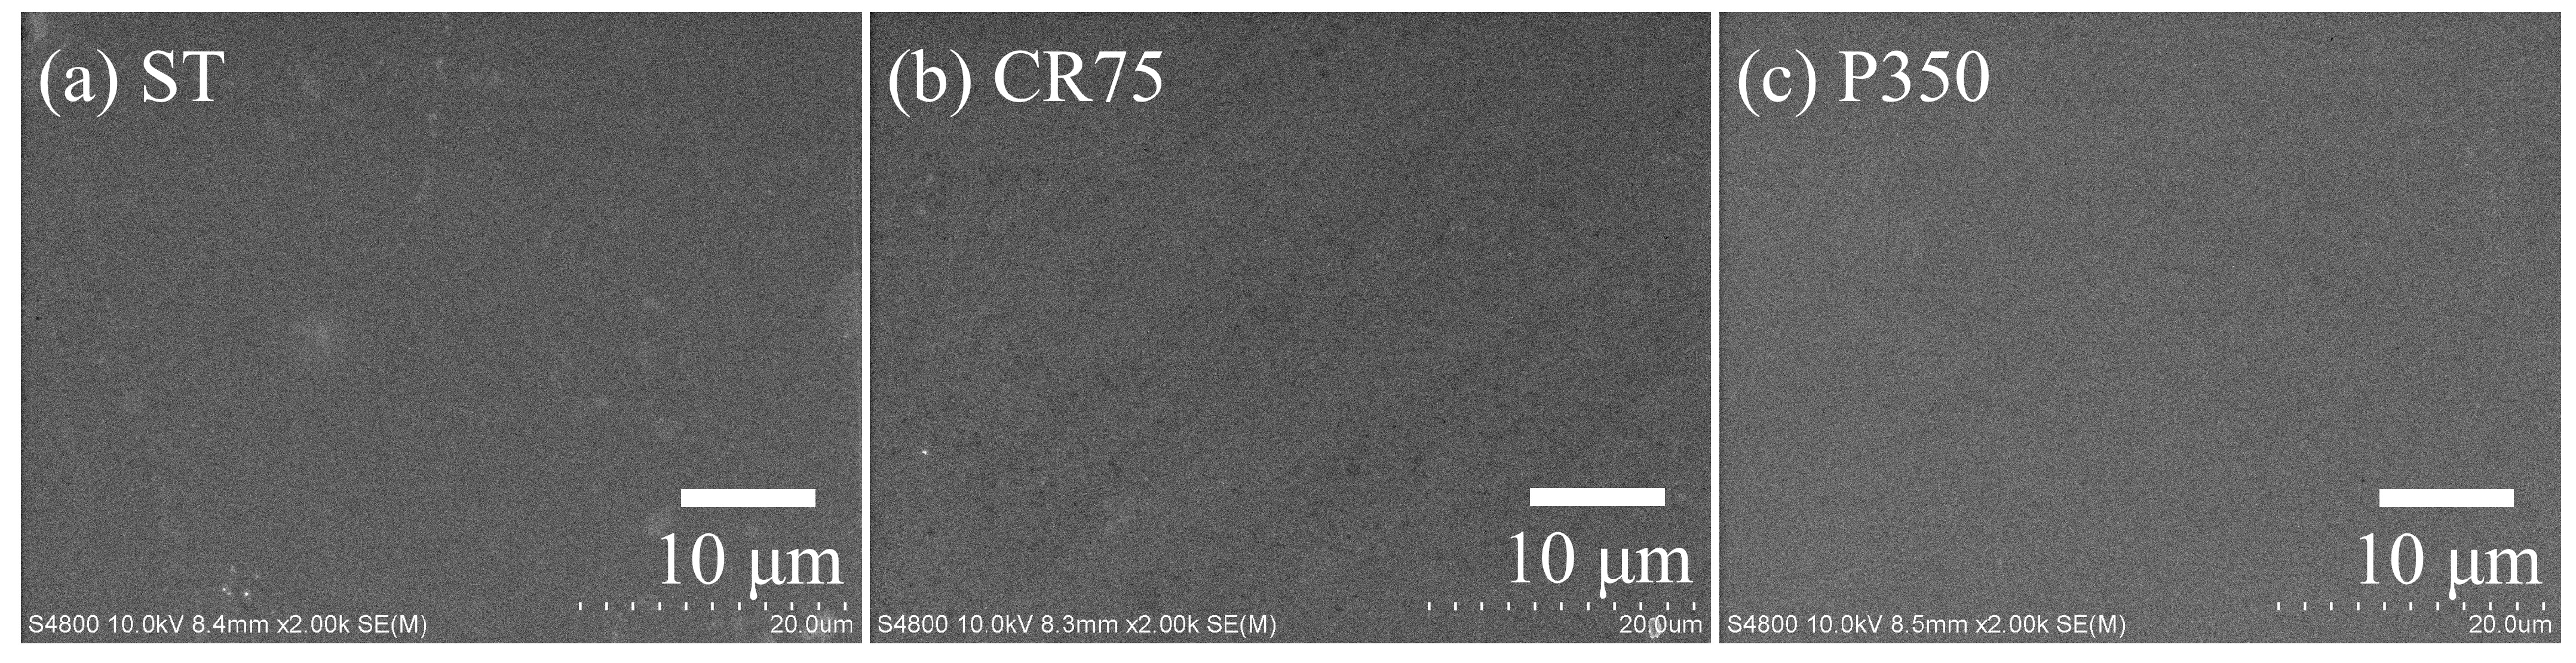
3.3.2. SEM Images
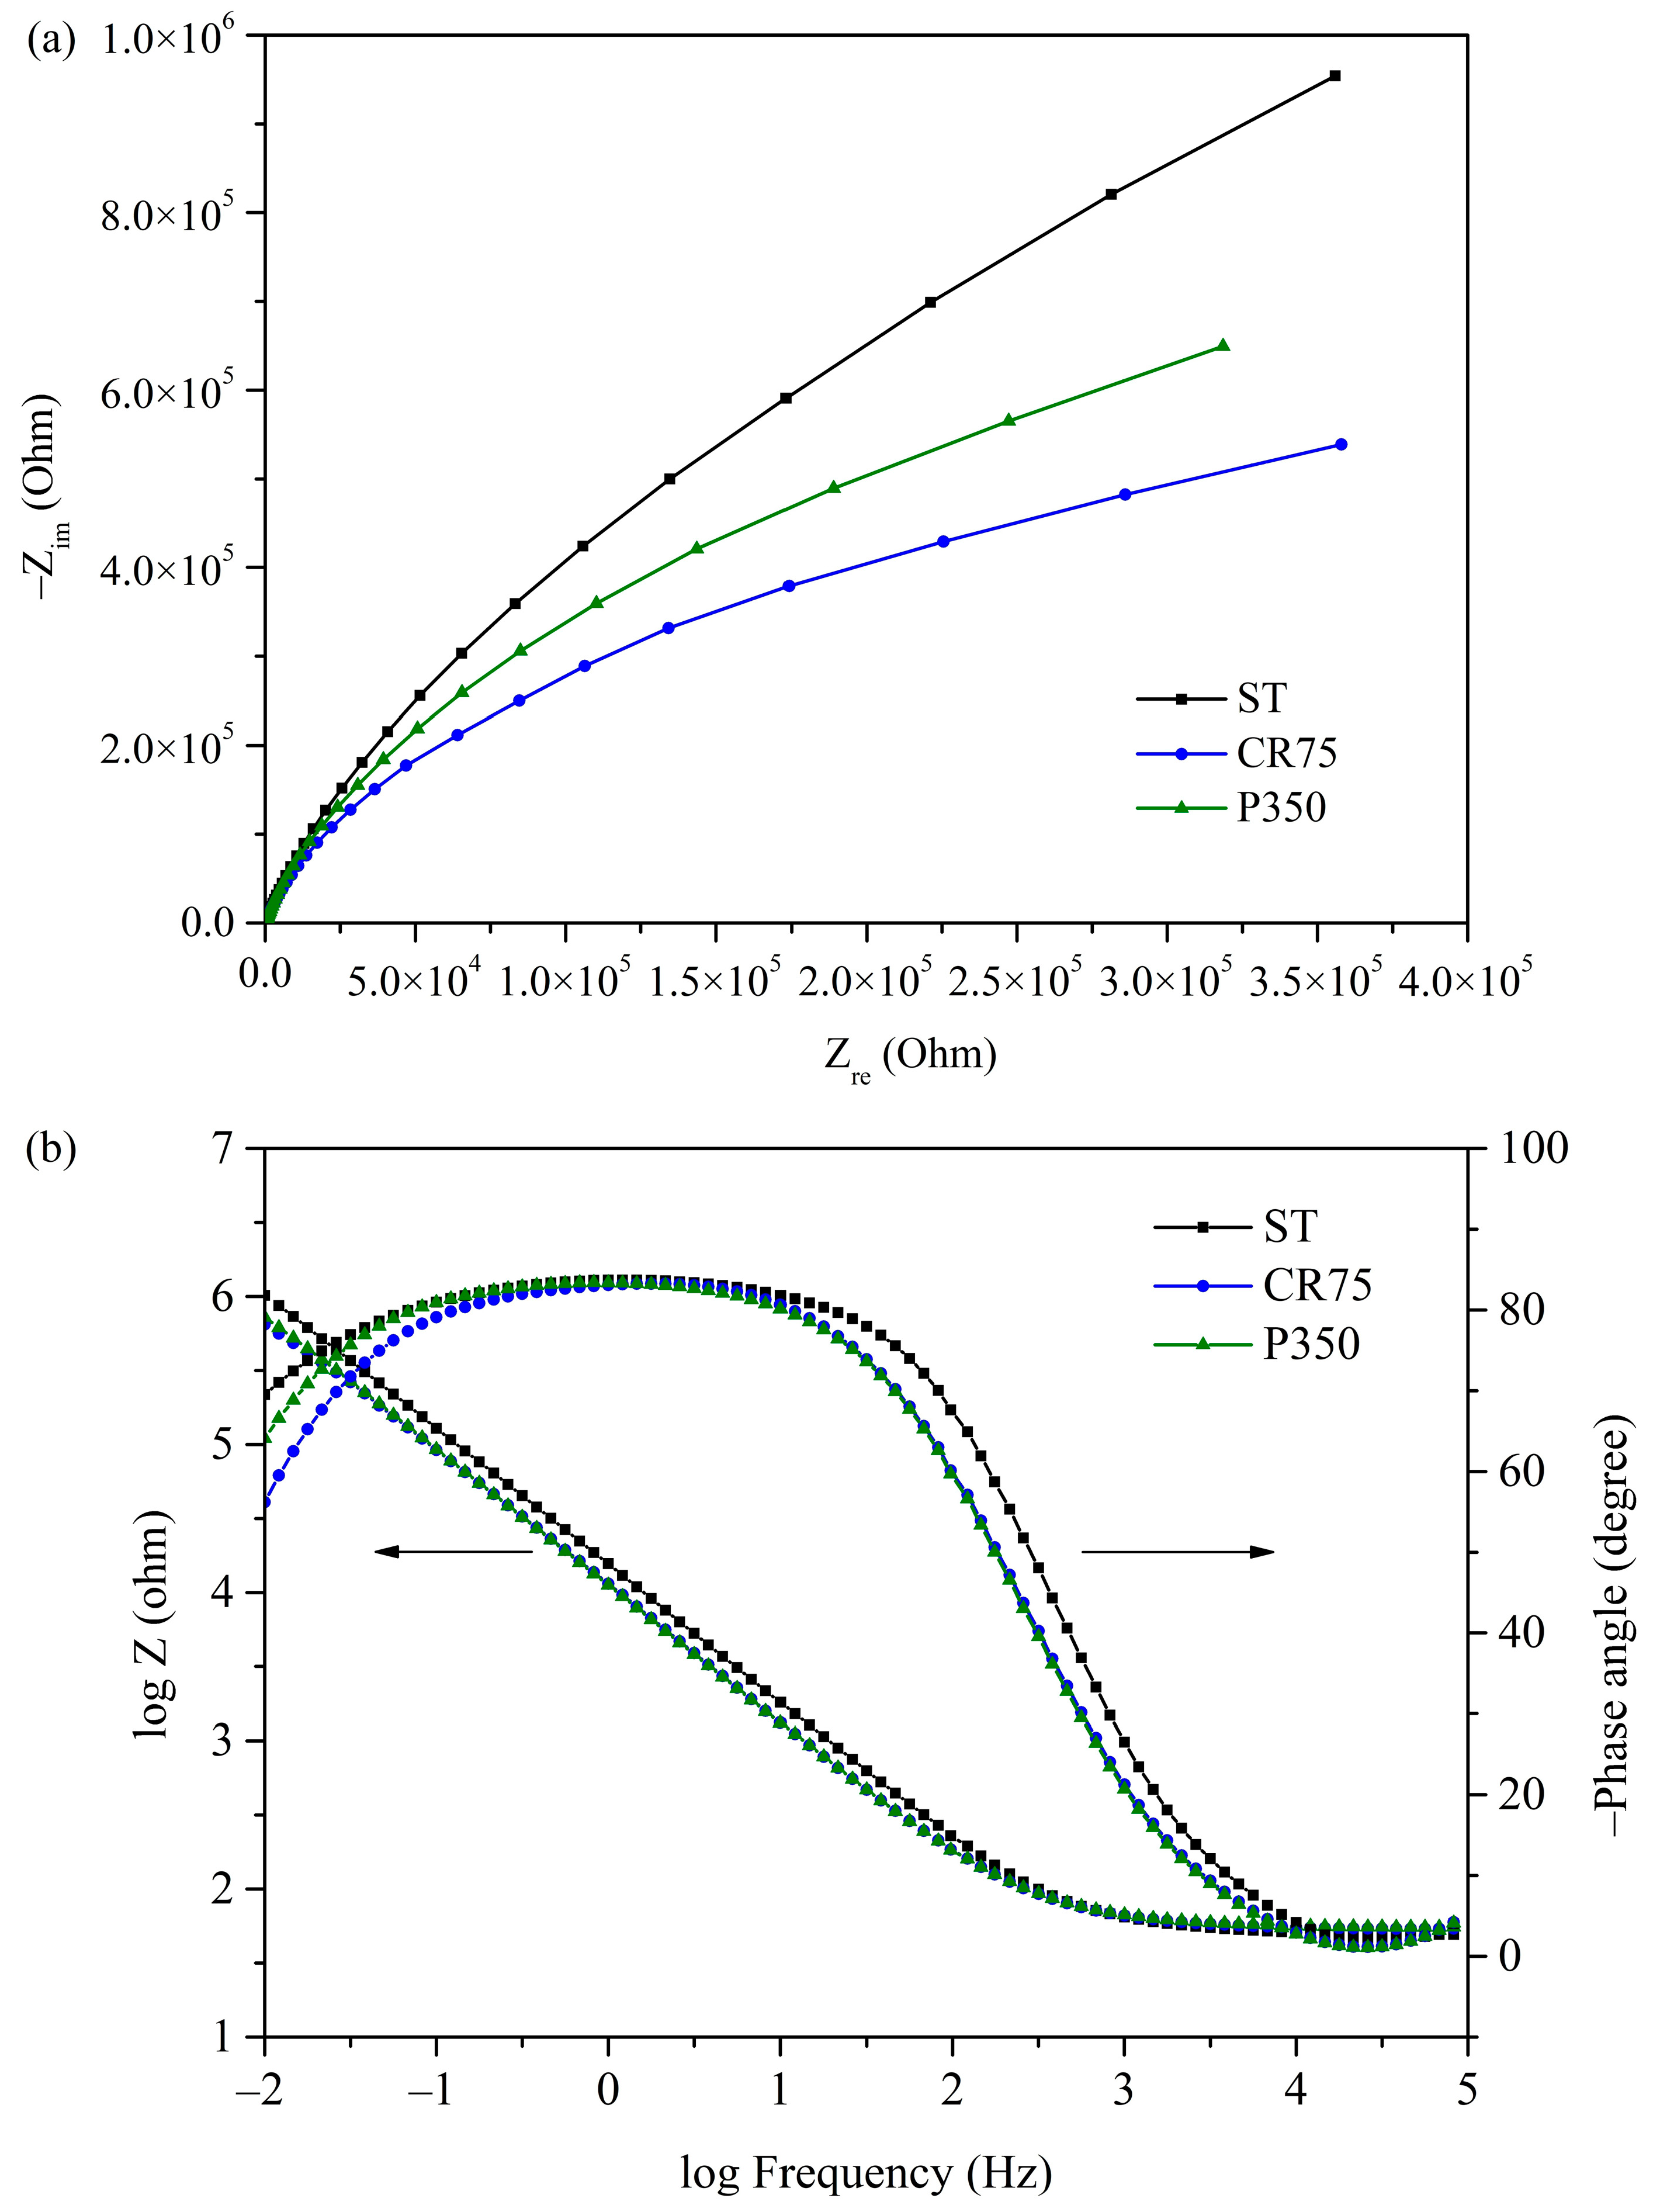
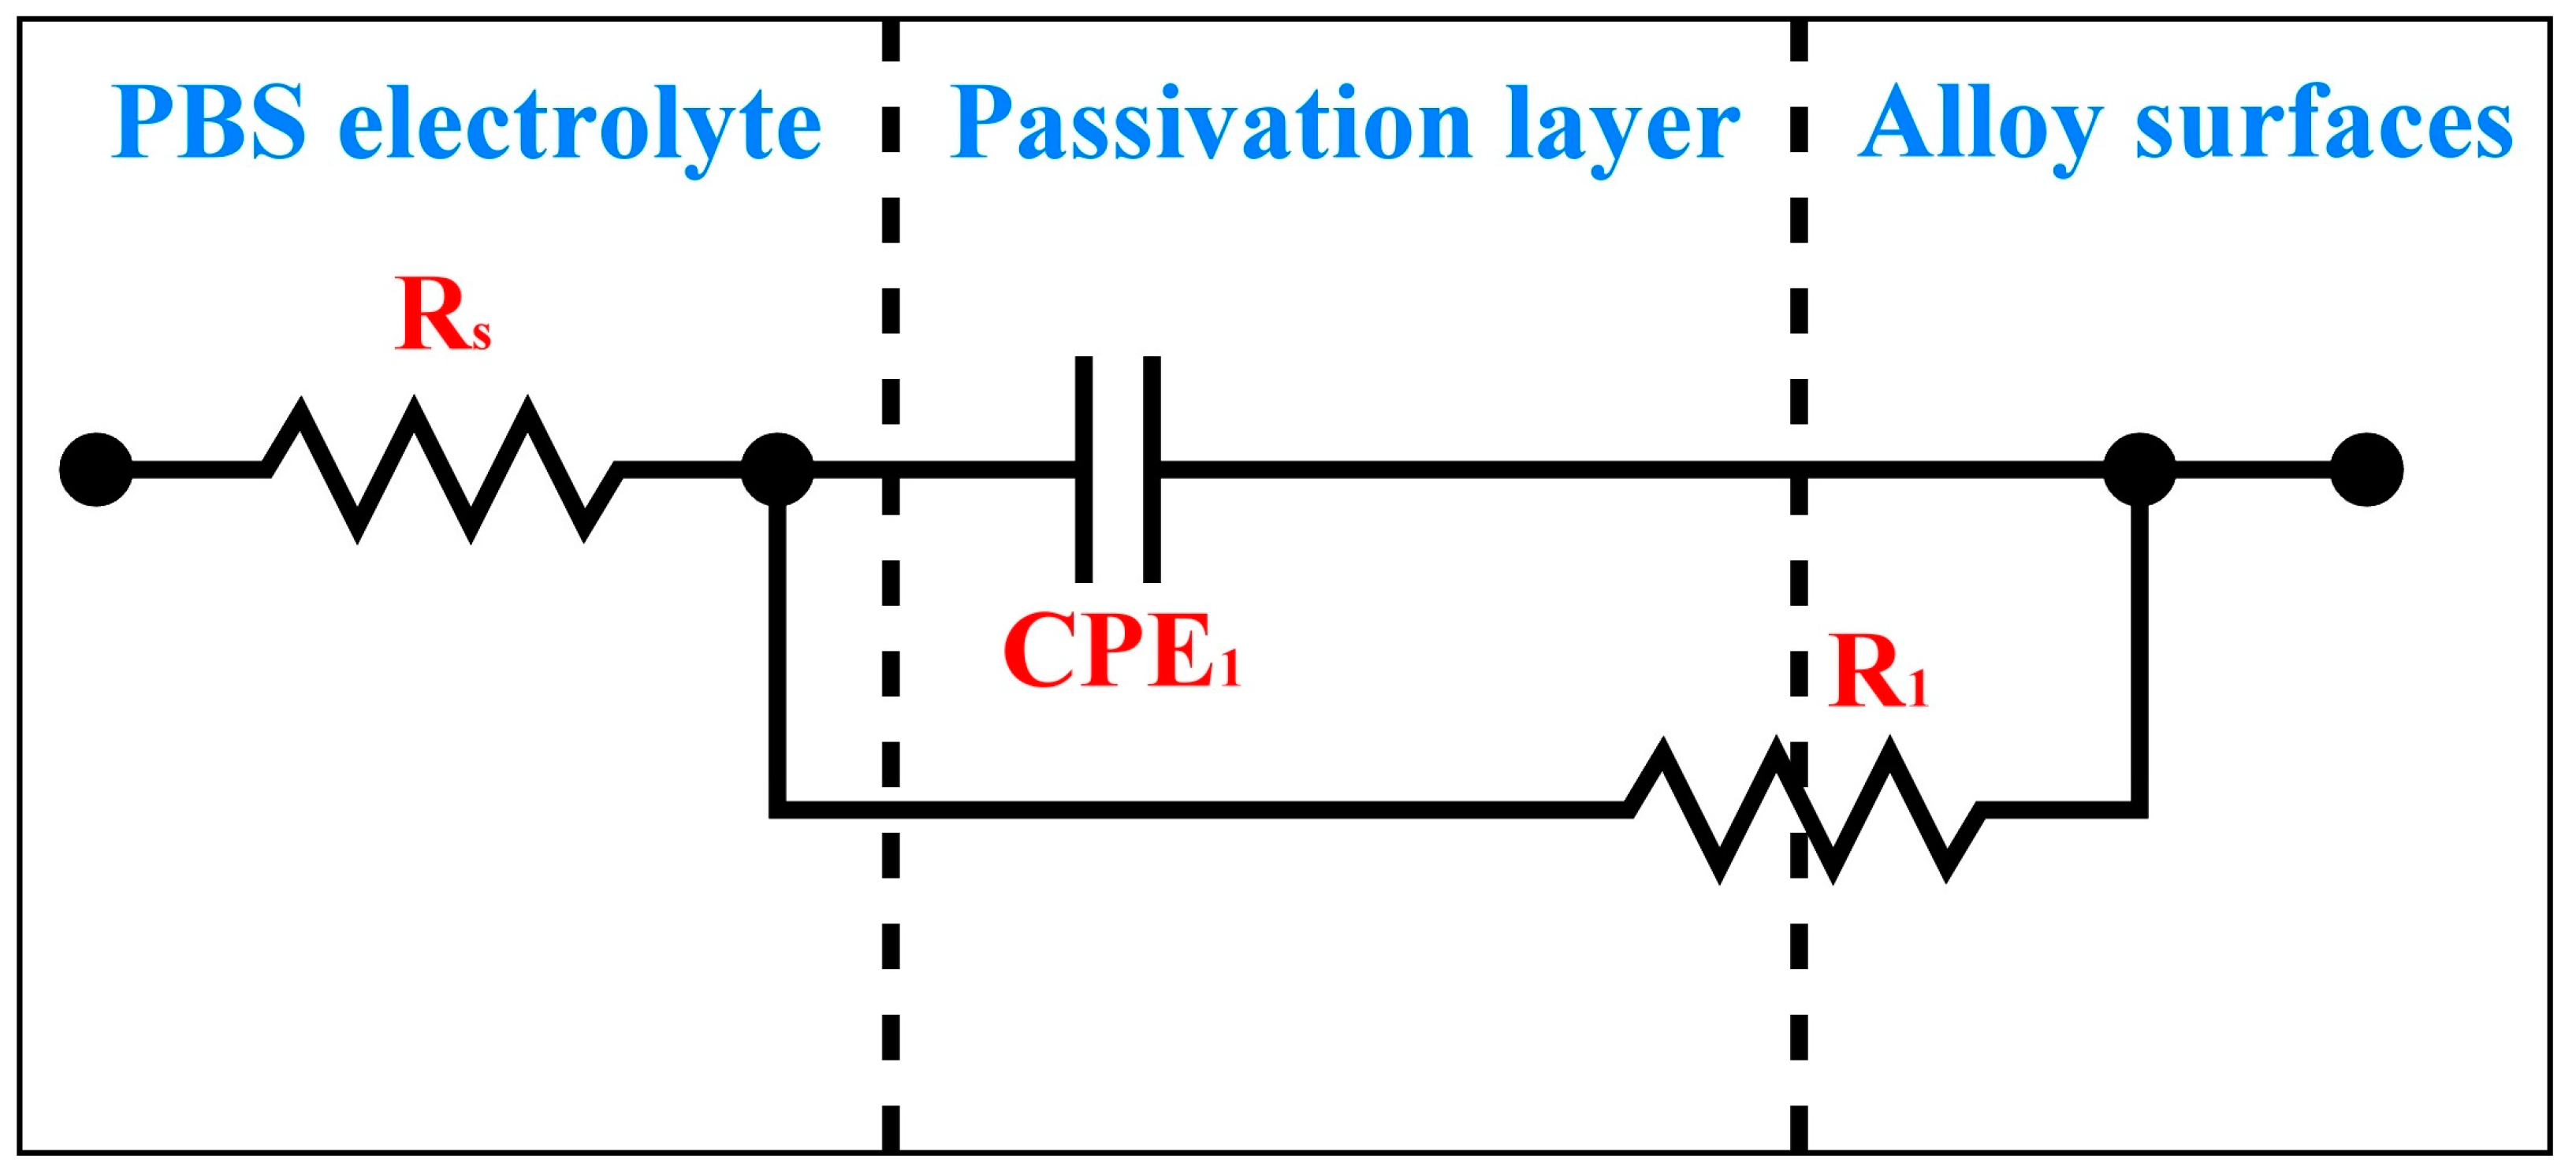
3.3.3. EIS
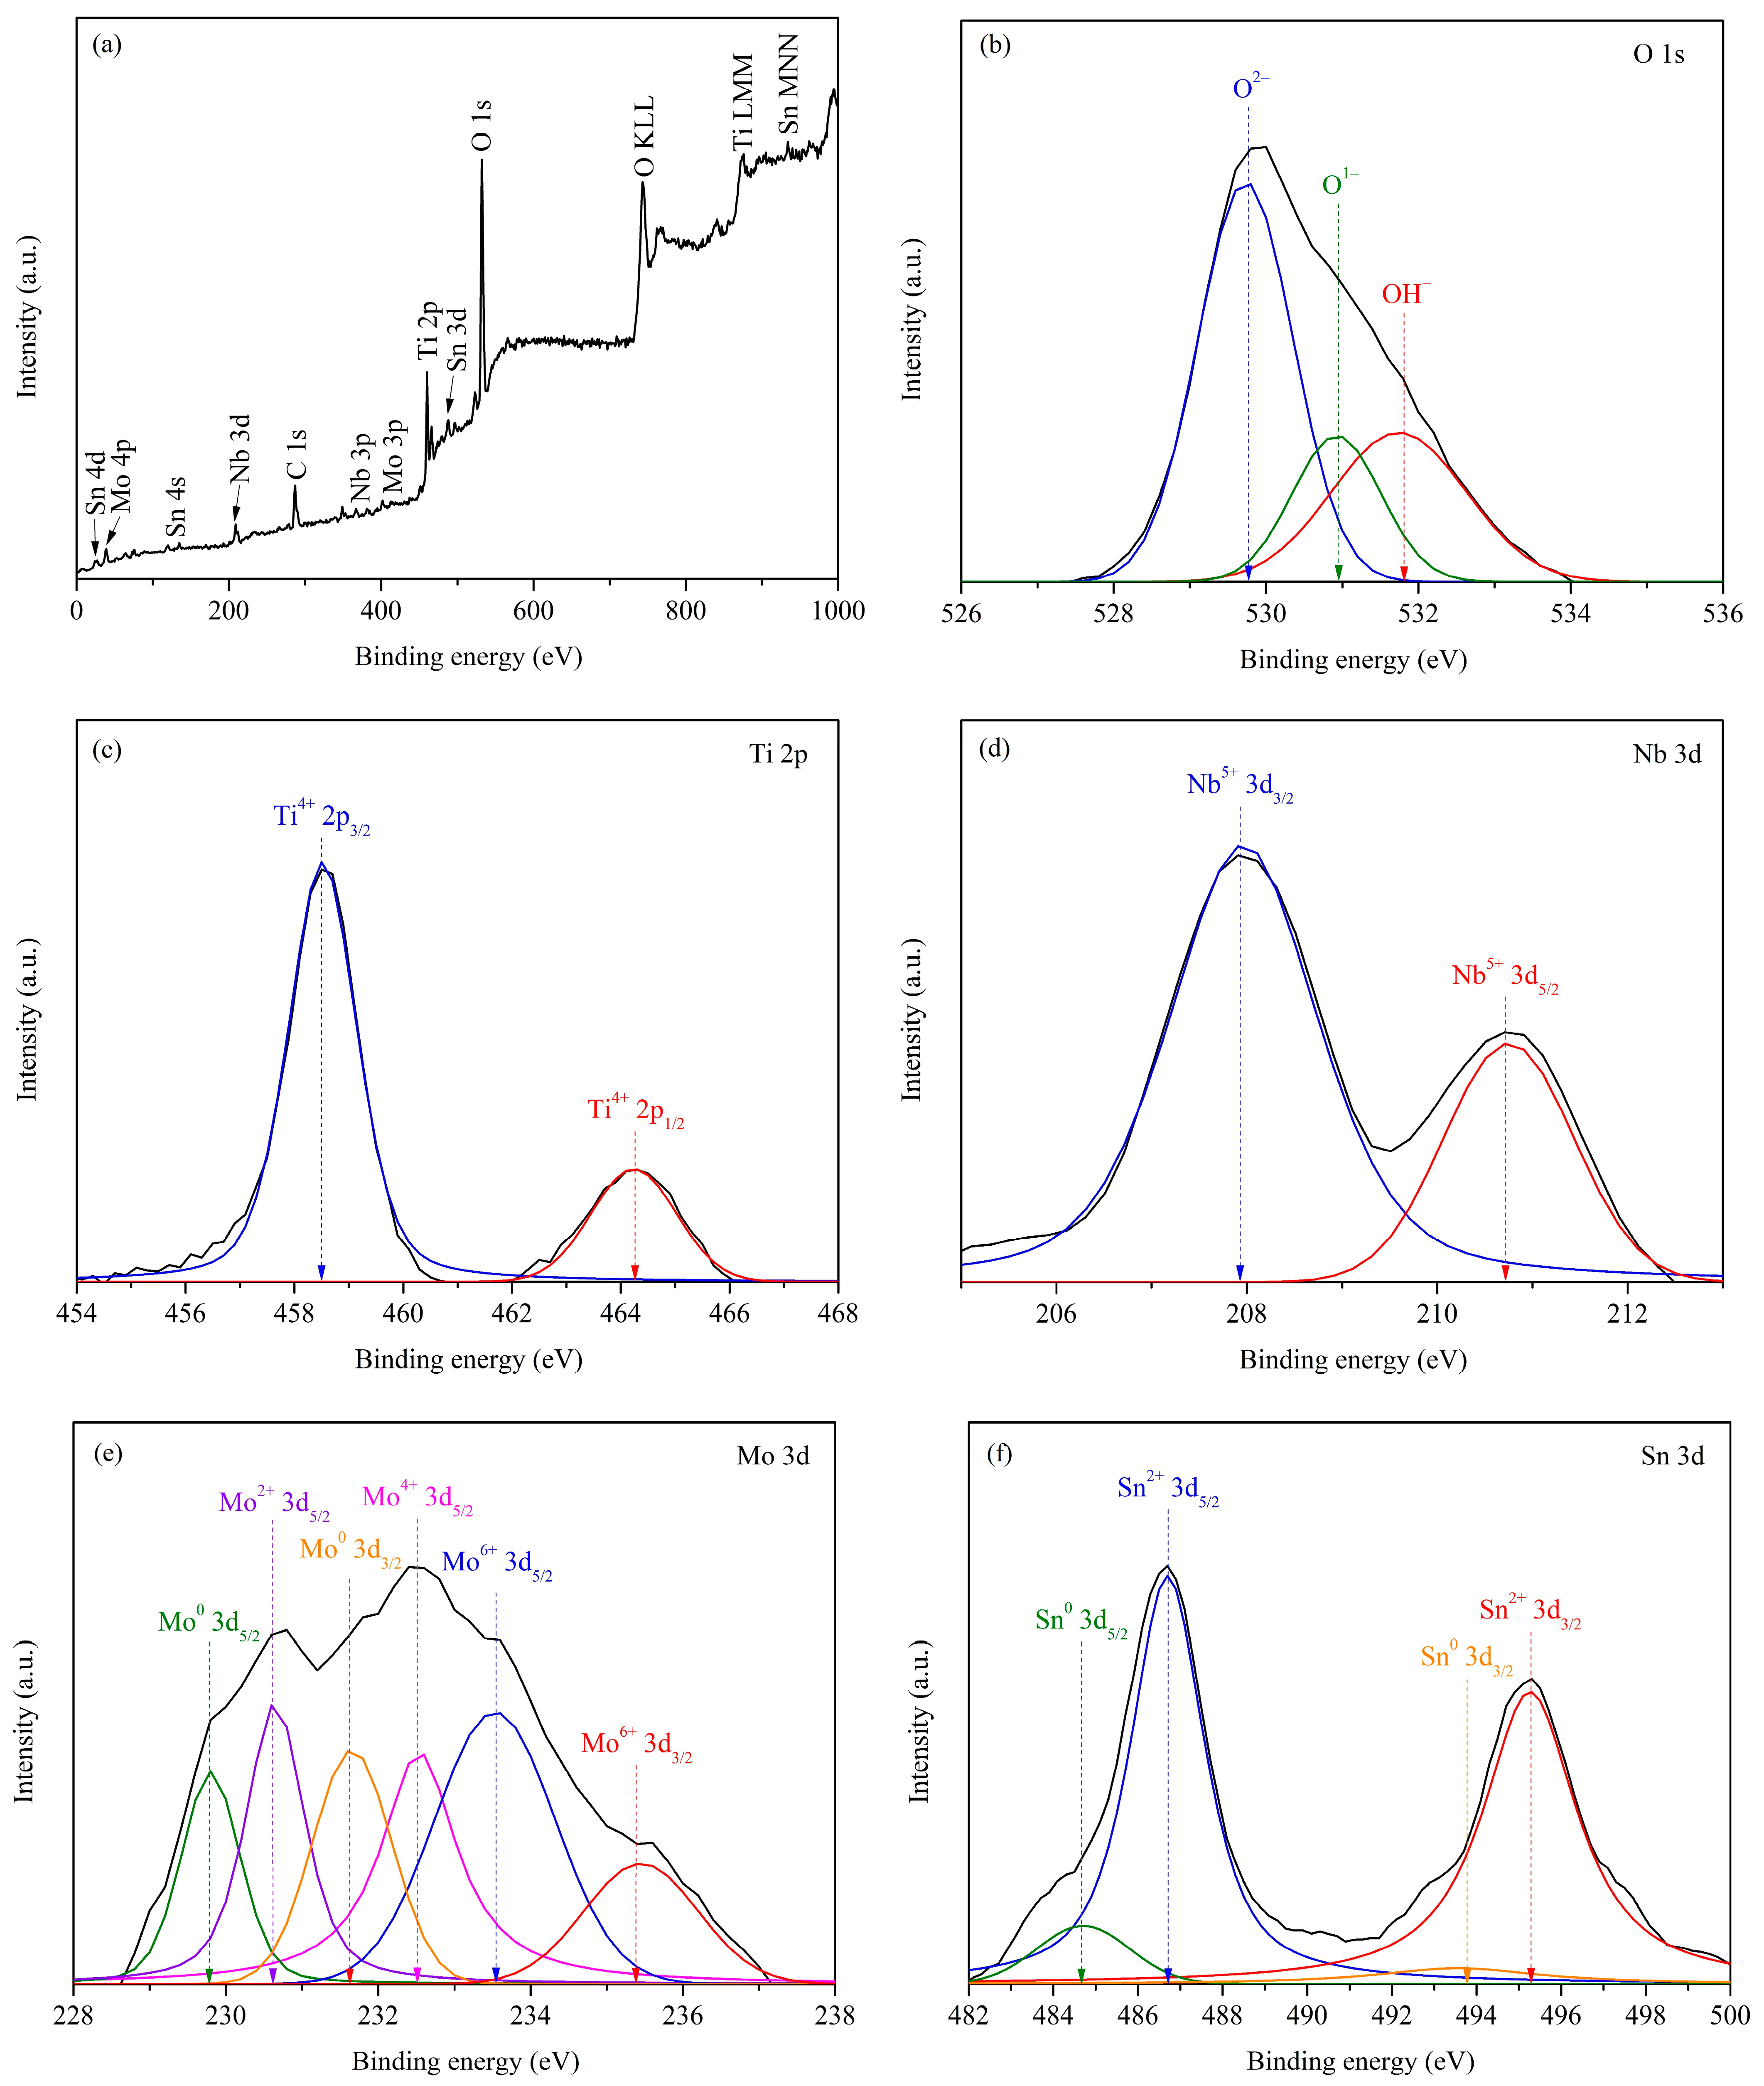
3.3.4. XPS
4. Conclusions
Author Contributions
Funding
Institutional Review Board Statement
Informed Consent Statement
Data Availability Statement
Acknowledgments
Conflicts of Interest
References
- Liu, T.-Y.; Huang, J.-C.; Chuang, W.-S.; Chou, H.-S.; Wei, J.-Y.; Chao, C.-Y.; Liao, Y.-C.; Jang, J.-S.-C. Spinodal Decomposition and Mechanical Response of a Ti–Zr–Nb–Ta High-Entropy Alloy. Materials 2019, 12, 3508. [Google Scholar] [CrossRef] [PubMed]
- Nagase, T.; Mizuuchi, K.; Nakano, T. Solidification Microstructures of the Ingots Obtained by Arc Melting and Cold Crucible Levitation Melting in Ti–Nb–Ta–Zr Medium-Entropy Alloy and Ti–Nb–Ta–Zr–X (X = V, Mo, W) High-Entropy Alloys. Entropy 2019, 21, 483. [Google Scholar] [CrossRef] [PubMed]
- Eleti, R.-R.; Klimova, M.; Tikhonovsky, M.; Stepanov, N.; Zherebtsov, S. Exceptionally high strain-hardening and ductility due to transformation induced plasticity effect in Ti-rich high-entropy alloys. Sci. Rep. 2020, 10, 13293. [Google Scholar] [CrossRef] [PubMed]
- Wong, K.-K.; Hsu, H.-C.; Wu, S.-C.; Hung, T.-L.; Ho, W.-F. Structure, Properties, and Corrosion Behavior of Ti-Rich Ti–Zr–Nb–Ta Medium-Entropy Alloys with β + α″ + α′ for Biomedical Application. Materials 2022, 15, 7953. [Google Scholar] [CrossRef]
- Du, Q.; Wei, D.; Wang, Y.; Li, B.; Zhou, Y. Microstructure and surface performance of hydroxyapatite-modified multilayer amorphous coating on Ti-rich Ti–Nb–Zr–Sn medium entropy alloy: A comparative study. Surf. Interfaces 2023, 41, 103288. [Google Scholar] [CrossRef]
- Ozerov, M.; Yurchenko, N.; Sokolovsky, V.; Nozdracheva, E.; Panina, E.; Nadezhdin, S.; Stepanov, N.; Zherebtsov, S. Microstructure and Mechanical Properties of Biomedical Ti–Zr–Nb–Ta–Sn High-Entropy Alloys. Metals 2023, 13, 353. [Google Scholar] [CrossRef]
- Liang, Z.; Wu, Y.; Miao, Y.; Pan, W.; Zhang, Y. Composition Design and Tensile Properties of Additive Manufactured Low Density Hf–Nb–Ta–Ti–Zr High Entropy Alloys Based on Atomic Simulations. Materials 2023, 16, 4039. [Google Scholar] [CrossRef]
- Akinwekomi, A.; Akhtar, F. Microstructural, Mechanical, and Electrochemical Characterization of Cr–Mo–Nb–Ti–Zr High-Entropy Alloy for Biomedical Application. Materials 2023, 16, 5320. [Google Scholar] [CrossRef]
- Wong, K.-K.; Hsu, H.-C.; Wu, S.-C.; Ho, W.-F. A Review: Design from Beta Titanium Alloys to Medium-Entropy Alloys for Biomedical Applications. Materials 2023, 16, 7046. [Google Scholar] [CrossRef]
- Václavová, K.; Stráský, J.; Polyakova, V.; Stráská, J.; Nejezchlebová, J.; Seiner, H.; Semenova, I.; Janeček, M. Microhardness and microstructure evolution of ultra-fine grained Ti–15Mo and TIMETAL LCB alloys prepared by high pressure torsion. Mater. Sci. Eng. A 2017, 682, 220–228. [Google Scholar] [CrossRef]
- Senkov, O.-N.; Semiatin, S.-L. Microstructure and properties of a refractory high-entropy alloy after cold working. J. Alloys Compd. 2015, 649, 1110–1123. [Google Scholar] [CrossRef]
- Hou, J.; Zhang, M.; Ma, S.; Liaw, P.-K.; Zhang, Y.; Qiao, J. Strengthening in Al0.25–Co–Cr–Fe–Ni high-entropy alloys by cold rolling. Mater. Sci. Eng. A 2017, 707, 593–601. [Google Scholar] [CrossRef]
- Sathiaraj, G.-D.; Skrotzki, W.; Pukenas, A.; Schaarschuch, R.; Immanuel, R.-J.; Panigrahi, S.-K.; Arout Chelvane, J.; Satheesh Kumar, S.-S. Effect of annealing on the microstructure and texture of cold rolled Cr–Co–Ni medium-entropy alloy. Intermetallics 2018, 101, 87–98. [Google Scholar] [CrossRef]
- Zherebtsov, S.; Yurchenko, N.; Panina, E.; Tojibaev, A.; Tikhonovsky, M.; Salishchev, G.; Stepanov, N. Microband-induced plasticity in a Ti-rich high-entropy alloy. J. Alloys Compd. 2020, 842, 155868. [Google Scholar] [CrossRef]
- Liao, Y.-C.; Chen, P.-S.; Tsai, P.-H.; Jang, J.-S.-C.; Hsieh, K.-C.; Chang, H.-W.; Chen, C.-Y.; Huang, J.-C.; Wu, H.-J.; Lo, Y.-C.; et al. Effect of thermomechanical treatment on the microstructure evolution and mechanical properties of lightweight Ti65–(AlCrNb)35 medium-entropy alloy. Intermetallics 2022, 143, 107470. [Google Scholar] [CrossRef]
- Ma, Y.; Sun, L.; Zhang, Y.; Zhang, Z. Achieving excellent strength-ductility synergy via cold rolling-annealing in Al-containing refractory high-entropy alloys. Int. J. Refract. Hard Met. 2023, 114, 106263. [Google Scholar] [CrossRef]
- Hu, N.; Xie, L.; Liao, Q.; Gao, A.; Zheng, Y.; Pan, H.; Tong, L.; Yang, D.; Gao, N.; Starink, M.-J.; et al. A more defective substrate leads to a less defective passive layer: Enhancing the mechanical strength, corrosion resistance and anti-inflammatory response of the low-modulus Ti–45Nb alloy by grain refinement. Acta Biomater. 2021, 126, 524–536. [Google Scholar] [CrossRef] [PubMed]
- Ji, P.; Liu, S.; Shi, C.; Xu, K.; Wang, Z.; Chen, B.; Li, B.; Yang, Y.; Liu, R. Synergistic effect of Zr addition and grain refinement on corrosion resistance and pitting corrosion behavior of single α-phase Ti-Zr-based alloys. J. Alloys Compd. 2022, 896, 163013. [Google Scholar] [CrossRef]
- Wang, L.; Fu, C.; Wu, Y.; Li, R.; Hui, X.; Wang, Y. Superelastic effect in Ti-rich high entropy alloys via stress-induced martensitic transformation. Scr. Mater. 2019, 162, 112–117. [Google Scholar] [CrossRef]
- Liu, J.; Zhang, X.; Yuan, Z. Structures and properties of biocompatible Ti–Zr–Nb–Fe–Mo medium entropy alloys. Mater. Today Commun. 2022, 32, 103808. [Google Scholar] [CrossRef]
- Hsu, H.-C.; Wong, K.-K.; Wu, S.-C.; Jheng, C.-Y.; Ho, W.-F. Structure and properties of metastable Ti–Nb–Sn–Mo alloys. MRS Commun. 2021, 11, 669–674. [Google Scholar] [CrossRef]
- Wang, L.; Lu, W.; Qin, J.; Zhang, F.; Zhang, D. Microstructure and mechanical properties of cold-rolled Ti–Nb–Ta–Zr biomedical β titanium alloy. Mater. Sci. Eng. A 2008, 490, 421–426. [Google Scholar] [CrossRef]
- Chang, L.-L.; Wang, Y.-D.; Ren, Y. In-situ investigation of stress-induced martensitic transformation in Ti–Nb binary alloys with low Young’s modulus. Mater. Sci. Eng. A 2016, 651, 442–448. [Google Scholar] [CrossRef]
- Yumak, N.; Aslantaş, K. A review on heat treatment efficiency in metastable β titanium alloys: The role of treatment process and parameters. J. Mater. Res. Technol. 2020, 9, 15360–15380. [Google Scholar] [CrossRef]
- Yu, Z.; Lin, Y. Achieving High Strength and Good Ductility in a Nb-Containing Co-Cr-Ni-Based High-Entropy Alloy by Grain Boundary and Precipitates Strengthening. Metals 2023, 13, 936. [Google Scholar] [CrossRef]
- Bała, P.; Górecki, K.; Dziurka, R.; Kozieł, T. The Effect of Al and Ti Additions on Solid Solution Strengthening and Precipitation Hardening in Co–Ni–Fe Medium-Entropy Alloys. Materials 2023, 16, 6297. [Google Scholar] [CrossRef] [PubMed]
- Sun, F.; Hao, Y.-L.; Zhang, J.-Y.; Prima, F. Contribution of nano-sized lamellar microstructure on recoverable strain of Ti–24Nb–4Zr–7.9Sn titanium alloy. Mater. Sci. Eng. A 2011, 528, 7811–7815. [Google Scholar] [CrossRef]
- Alaneme, K.-K.; Bodunrin, M.-O. Self-healing using metallic material systems—A review. Appl. Mater. Today 2017, 6, 9–15. [Google Scholar] [CrossRef]
- Parfenov, E.-V.; Kulyasova, O.-B.; Mukaeva, V.-R.; Mingo, B.; Farrakhov, R.-G.; Cherneikina, Y.-V.; Yerokhin, A.; Zheng, Y.-F.; Valiev, R.-Z. Influence of ultra-fine grain structure on corrosion behaviour of biodegradable Mg–1Ca alloy. Corros. Sci. 2020, 163, 108303. [Google Scholar] [CrossRef]
- Gwalani, B.; Wang, T.; Jagetia, A.; Gangireddy, S.; Muskeri, S.; Mukherjee, S.; Lloyd, J.-T.; Banerjee, R.; Mishra, R.-S. Dynamic Shear Deformation of a Precipitation Hardened Al0.7–Co–Cr–Fe–Ni Eutectic High-Entropy Alloy Using Hat-Shaped Specimen Geometry. Entropy 2020, 22, 431. [Google Scholar] [CrossRef]
- Löbel, M.; Lindner, T.; Hunger, R.; Berger, R.; Lampke, T. Precipitation Hardening of the HVOF Sprayed Single-Phase High-Entropy Alloy Cr–Fe–Co–Ni. Coatings 2020, 10, 701. [Google Scholar] [CrossRef]
- Lee, K.; Jung, Y.; Han, J.; Hong, S.-H.; Kim, K.-B.; Liaw, P.-K.; Lee, C.; Song, G. Development of Precipitation-Strengthened Al0.8–Nb–Ti–V–M (M = Co, Ni) Light-Weight Refractory High-Entropy Alloys. Materials 2021, 14, 2085. [Google Scholar] [CrossRef] [PubMed]
- Wong, K.-K.; Hsu, H.-C.; Wu, S.-C.; Ho, W.-F. Structure and properties of Ti-rich Ti–Zr–Nb–Mo medium-entropy alloys. J. Alloys Compd. 2021, 868, 159137. [Google Scholar] [CrossRef]
- Goudoulas, T.-B.; Vanderhaeghen, S.; Germann, N. Micro-dispersed essential oils loaded gelatin hydrogels with antibacterial activity. LWT 2022, 154, 112797. [Google Scholar] [CrossRef]
- Yang, Z.; Banhart, J. Natural and artificial ageing in aluminium alloys—The role of excess vacancies. Acta Mater. 2021, 215, 117014. [Google Scholar] [CrossRef]
- Jordan, J.-L.; Deevi, S.-C. Vacancy formation and effects in Fe–Al. Intermetallics 2003, 11, 507–528. [Google Scholar] [CrossRef]
- Zamani, M.-R.; Mirzadeh, H.; Malekan, M.; Cao, S.-C.; Yeh, J.-W. Grain Growth in High-Entropy Alloys (HEAs): A Review. In High Entropy Alloys & Materials; Springer: Berlin/Heidelberg, Germany, 2022. [Google Scholar] [CrossRef]
- Juan, C.-C.; Tsai, M.-H.; Tsai, C.-W.; Hsu, W.-L.; Lin, C.-M.; Chen, S.-K.; Lin, S.-J.; Yeh, J.-W. Simultaneously increasing the strength and ductility of a refractory high-entropy alloy via grain refining. Mater. Lett. 2016, 184, 200–203. [Google Scholar] [CrossRef]
- Panigrahi, A.; Bönisch, M.; Waitz, T.; Schafler, E.; Calin, M.; Eckert, J.; Skrotzki, W.; Zehetbauer, M. Phase transformations and mechanical properties of biocompatible Ti–16.1Nb processed by severe plastic deformation. J. Alloys Compd. 2015, 628, 434–441. [Google Scholar] [CrossRef]
- Li, Q.; Huang, Q.; Li, J.; He, Q.; Nakai, M.; Zhang, K.; Niinomi, M.; Yamanaka, K.; Chiba, A.; Nakano, T. Microstructure and mechanical properties of Ti–Nb–Fe–Zr alloys with high strength and low elastic modulus. Trans. Nonferrous Met. Soc. China 2022, 32, 503–512. [Google Scholar] [CrossRef]
- Zhou, Y.; Luo, D. Microstructures and mechanical properties of Ti–Mo alloys cold-rolled and heat treated. Mater. Charact. 2011, 62, 931–937. [Google Scholar] [CrossRef]
- Dan, A.; Angelescu, M.-L.; Serban, N.; Cojocaru, E.-M.; Zarnescu-Ivan, N.; Cojocaru, V.-D.; Galbinasu, B.-M. Evolution of Microstructural and Mechanical Properties during Cold-Rolling Deformation of a Biocompatible Ti–Nb–Zr–Ta Alloy. Materials 2022, 15, 3580. [Google Scholar] [CrossRef] [PubMed]
- Lan, C.; Wu, Y.; Guo, L.; Chen, H.; Chen, F. Microstructure, texture evolution and mechanical properties of cold rolled Ti–32.5Nb–6.8Zr–2.7Sn biomedical beta titanium alloy. J. Mater. Sci. Technol. 2018, 34, 788–792. [Google Scholar] [CrossRef]
- Wang, Y.; Zhao, J.; Dai, S.; Chen, F.; Yu, X.; Zhang, Y. Influence of cold rolling and ageing treatment on microstructure and mechanical properties of Ti–30Nb–5Ta–6Zr alloy. J. Mech. Behav. Biomed. Mater. 2013, 27, 33–42. [Google Scholar] [CrossRef] [PubMed]
- Dai, S.; Wang, Y.; Chen, F.; Yu, X.; Zhang, Y. Effects of cold deformation on microstructure and mechanical properties of Ti–35Nb–9Zr–6Mo–4Sn alloy for biomedical applications. Mater. Sci. Eng. A 2013, 575, 35–40. [Google Scholar] [CrossRef]
- Akahori, T.; Niinomi, M.; Fukui, H.; Ogawa, M.; Toda, H. Improvement in fatigue characteristics of newly developed beta type titanium alloy for biomedical applications by thermo-mechanical treatments. Mater. Sci. Eng. C 2005, 25, 248–254. [Google Scholar] [CrossRef]
- Hu, S.; Li, T.; Su, Z.; Meng, S.; Jia, Z.; Liu, D. A novel Ti–Zr–Nb medium entropy alloy (MEA) with appropriate elastic modulus for biocompatible materials. Mater. Sci. Eng. B 2021, 270, 115226. [Google Scholar] [CrossRef]
- Guo, W.-Y.; Sun, J.; Wu, J.-S. Effect of deformation on corrosion behavior of Ti–23Nb–0.7Ta–2Zr–O alloy. Mater. Charact. 2009, 60, 173–177. [Google Scholar] [CrossRef]
- González, M.; Peña, J.; Gil, F.-J.; Manero, J.-M. Low modulus Ti–Nb–Hf alloy for biomedical applications. Mater. Sci. Eng. C 2014, 42, 691–695. [Google Scholar] [CrossRef]
- Tong, X.; Sun, Q.; Zhang, D.; Wang, K.; Dai, Y.; Shi, Z.; Li, Y.; Dargusch, M.; Huang, S.; Ma, J.; et al. Impact of scandium on mechanical properties, corrosion behavior, friction and wear performance, and cytotoxicity of a β-type Ti–24Nb–38Zr–2Mo alloy for orthopedic applications. Acta Biomater. 2021, 134, 791–803. [Google Scholar] [CrossRef]
- Angelescu, M.-L.; Dan, A.; Ungureanu, E.; Zarnescu-Ivan, N.; Galbinasu, B.-M. Effects of Cold Rolling Deformation and Solution Treatment on Microstructural, Mechanical, and Corrosion Properties of a Biocompatible Ti–Nb–Ta–Zr Alloy. Metals 2022, 12, 248. [Google Scholar] [CrossRef]
- Wang, S.-G.; Shen, C.-B.; Long, K.; Yang, H.-Y.; Wang, F.-H.; Zhang, Z.-D. Preparation and Electrochemical Corrosion Behavior of Bulk Nanocrystalline Ingot Iron in HCl Acid Solution. J. Phys. Chem. B 2005, 109, 2499–2503. [Google Scholar] [CrossRef] [PubMed]
- Suresh, K.-S.; Geetha, M.; Richard, C.; Landoulsi, J.; Ramasawmy, H.; Suwas, S.; Asokamani, R. Effect of equal channel angular extrusion on wear and corrosion behavior of the orthopedic Ti–13Nb–13Zr alloy in simulated body fluid. Mater. Sci. Eng. C 2012, 32, 763–771. [Google Scholar] [CrossRef]
- Martin, É.; Azzi, M.; Salishchev, G.A.; Szpunar, J. Influence of microstructure and texture on the corrosion and tribocorrosion behavior of Ti–6Al–4V. Tribol. Int. 2010, 43, 918–924. [Google Scholar] [CrossRef]
- Wang, P.; Ma, L.; Cheng, X.; Li, X. Influence of grain refinement on the corrosion behavior of metallic materials: A review. Int. J. Miner. Metall. Mater. 2021, 28, 1112–1126. [Google Scholar] [CrossRef]
- Mousavi Anijdan, S.-H.; Sadeghi-Nezhad, D.; Lee, H.; Shin, W.; Park, N.; Nayyeri, M.-J.; Jafarian, H.-R.; Eivani, A.-R. TEM study of S’ hardening precipitates in the cold rolled and aged AA2024 aluminum alloy: Influence on the microstructural evolution, tensile properties & electrical conductivity. J. Mater. Res. Technol. 2021, 13, 798–807. [Google Scholar] [CrossRef]
- Ralston, K.-D.; Birbilis, N.; Davies, C.-H.-J. Revealing the relationship between grain size and corrosion rate of metals. Scr. Mater. 2010, 63, 1201–1204. [Google Scholar] [CrossRef]
- Gouda, M.-K.; Salman, S.-A.; Ebied, S. Improvement in the microhardness and corrosion behaviour of Ti–14Mn biomedical alloy by cold working. Mater. Res. Express 2022, 9, 015401. [Google Scholar] [CrossRef]
- Xu, W.; Chen, M.; Lu, X.; Zhang, D.; Singh, H.; Yu, J.; Pan, Y.; Qu, X.; Liu, C. Effects of Mo content on corrosion and tribocorrosion behaviours of Ti–Mo orthopaedic alloys fabricated by powder metallurgy. Corros. Sci. 2020, 168, 108557. [Google Scholar] [CrossRef]
- Yazdi, R.; Ghasemi, H.-M.; Wang, C.; Neville, A. Bio-corrosion behaviour of oxygen diffusion layer on Ti–6Al–4V during tribocorrosion. Corros. Sci. 2017, 128, 23–32. [Google Scholar] [CrossRef]
- Li, H.; Zhang, B.; Jiang, Z.; Zhang, S.; Feng, H.; Han, P.; Dong, N.; Zhang, W.; Li, G.; Fan, G.; et al. A new insight into high-temperature oxidation mechanism of super-austenitic stainless steel S32654 in air. J. Alloys Compd. 2016, 686, 326–338. [Google Scholar] [CrossRef]
- Ouyang, D.; Chen, Z.; Yu, H.; Chan, K.-C.; Liu, L. Oxidation behavior of the Ti38–V15–Nb23–Hf24 refractory high-entropy alloy at elevated temperatures. Corros. Sci. 2022, 198, 110153. [Google Scholar] [CrossRef]
- Afzali, P.; Ghomashchi, R.; Oskouei, R.-H. On the Corrosion Behaviour of Low Modulus Titanium Alloys for Medical Implant Applications: A Review. Metals 2019, 9, 878. [Google Scholar] [CrossRef]


| Alloy | ΔSmix (J/K·mol) | ΔHmix (KJ/mol) | δ | TL (°C) | ρ (g/cm3) | [Mo]eq | VEC |
|---|---|---|---|---|---|---|---|
| Ti80–Nb10–Mo5–Sn5 | 5.89 | –3.11 | 1.53 | 1740.8 | 5.34 | 14.44 | 4.2 |
| Code | Conditions |
|---|---|
| ST | Solution treatment (ST) (900 °C, 15 min) |
| CR50 | ST + 50% cold rolling |
| CR75 | ST + 75% cold rolling |
| P150 | ST + precipitation hardening treatment (150 °C, 15 min) |
| P350 | ST + precipitation hardening treatment (350 °C, 15 min) |
| P550 | ST + precipitation hardening treatment (550 °C, 15 min) |
| P700 | ST + precipitation hardening treatment (700 °C, 15 min) |
| PRT | ST + precipitation hardening treatment (25 °C, 30 day) |
| Ecorr (V) | icorr (nA/cm2) | Epass (V) | ipass (μA/cm2) | Epass–Ecorr (V) | βa (V) | βc (V) | Rp (kΩ·cm2) | |
|---|---|---|---|---|---|---|---|---|
| ST | –0.06 | 9.02 | 0.25 | 1.34 | 0.31 | 0.0132 | 0.0145 | 333.06 |
| CR75 | 0.20 | 131.26 | 0.47 | 4.26 | 0.27 | 0.0072 | 0.0102 | 13.99 |
| P350 | 0.02 | 2.54 | 0.41 | 1.47 | 0.39 | 0.0235 | 0.0351 | 2409.44 |
| Rs (Ω·cm2) | CPE1 (10−5 F·cm2) | R1 (106 Ω·cm2) | n1 | Ceff (10−5 F·cm2) | χ2 (10−4) | |
|---|---|---|---|---|---|---|
| ST | 51.615 | 1.1925 | 3.9566 | 0.923 | 1.6432 | 1.31 |
| CR75 | 56.437 | 1.6504 | 1.4371 | 0.916 | 2.2072 | 2.32 |
| P350 | 57.818 | 1.6527 | 2.2814 | 0.918 | 2.2856 | 2.28 |
Disclaimer/Publisher’s Note: The statements, opinions and data contained in all publications are solely those of the individual author(s) and contributor(s) and not of MDPI and/or the editor(s). MDPI and/or the editor(s) disclaim responsibility for any injury to people or property resulting from any ideas, methods, instructions or products referred to in the content. |
© 2023 by the authors. Licensee MDPI, Basel, Switzerland. This article is an open access article distributed under the terms and conditions of the Creative Commons Attribution (CC BY) license (https://creativecommons.org/licenses/by/4.0/).
Share and Cite
Hsu, H.-C.; Wong, K.-K.; Wu, S.-C.; Huang, C.-Y.; Ho, W.-F. Effects of Cold Rolling or Precipitation Hardening Treatment on the Microstructure, Mechanical Properties, and Corrosion Resistance of Ti-Rich Metastable Medium-Entropy Alloys. Materials 2023, 16, 7561. https://doi.org/10.3390/ma16247561
Hsu H-C, Wong K-K, Wu S-C, Huang C-Y, Ho W-F. Effects of Cold Rolling or Precipitation Hardening Treatment on the Microstructure, Mechanical Properties, and Corrosion Resistance of Ti-Rich Metastable Medium-Entropy Alloys. Materials. 2023; 16(24):7561. https://doi.org/10.3390/ma16247561
Chicago/Turabian StyleHsu, Hsueh-Chuan, Ka-Kin Wong, Shih-Ching Wu, Chun-Yu Huang, and Wen-Fu Ho. 2023. "Effects of Cold Rolling or Precipitation Hardening Treatment on the Microstructure, Mechanical Properties, and Corrosion Resistance of Ti-Rich Metastable Medium-Entropy Alloys" Materials 16, no. 24: 7561. https://doi.org/10.3390/ma16247561