
Experimental Investigation on Strength and Stiffness Properties of Laminated Veneer Lumber (LVL)


Abstract
:1. Introduction
2. Material and Tests Overview
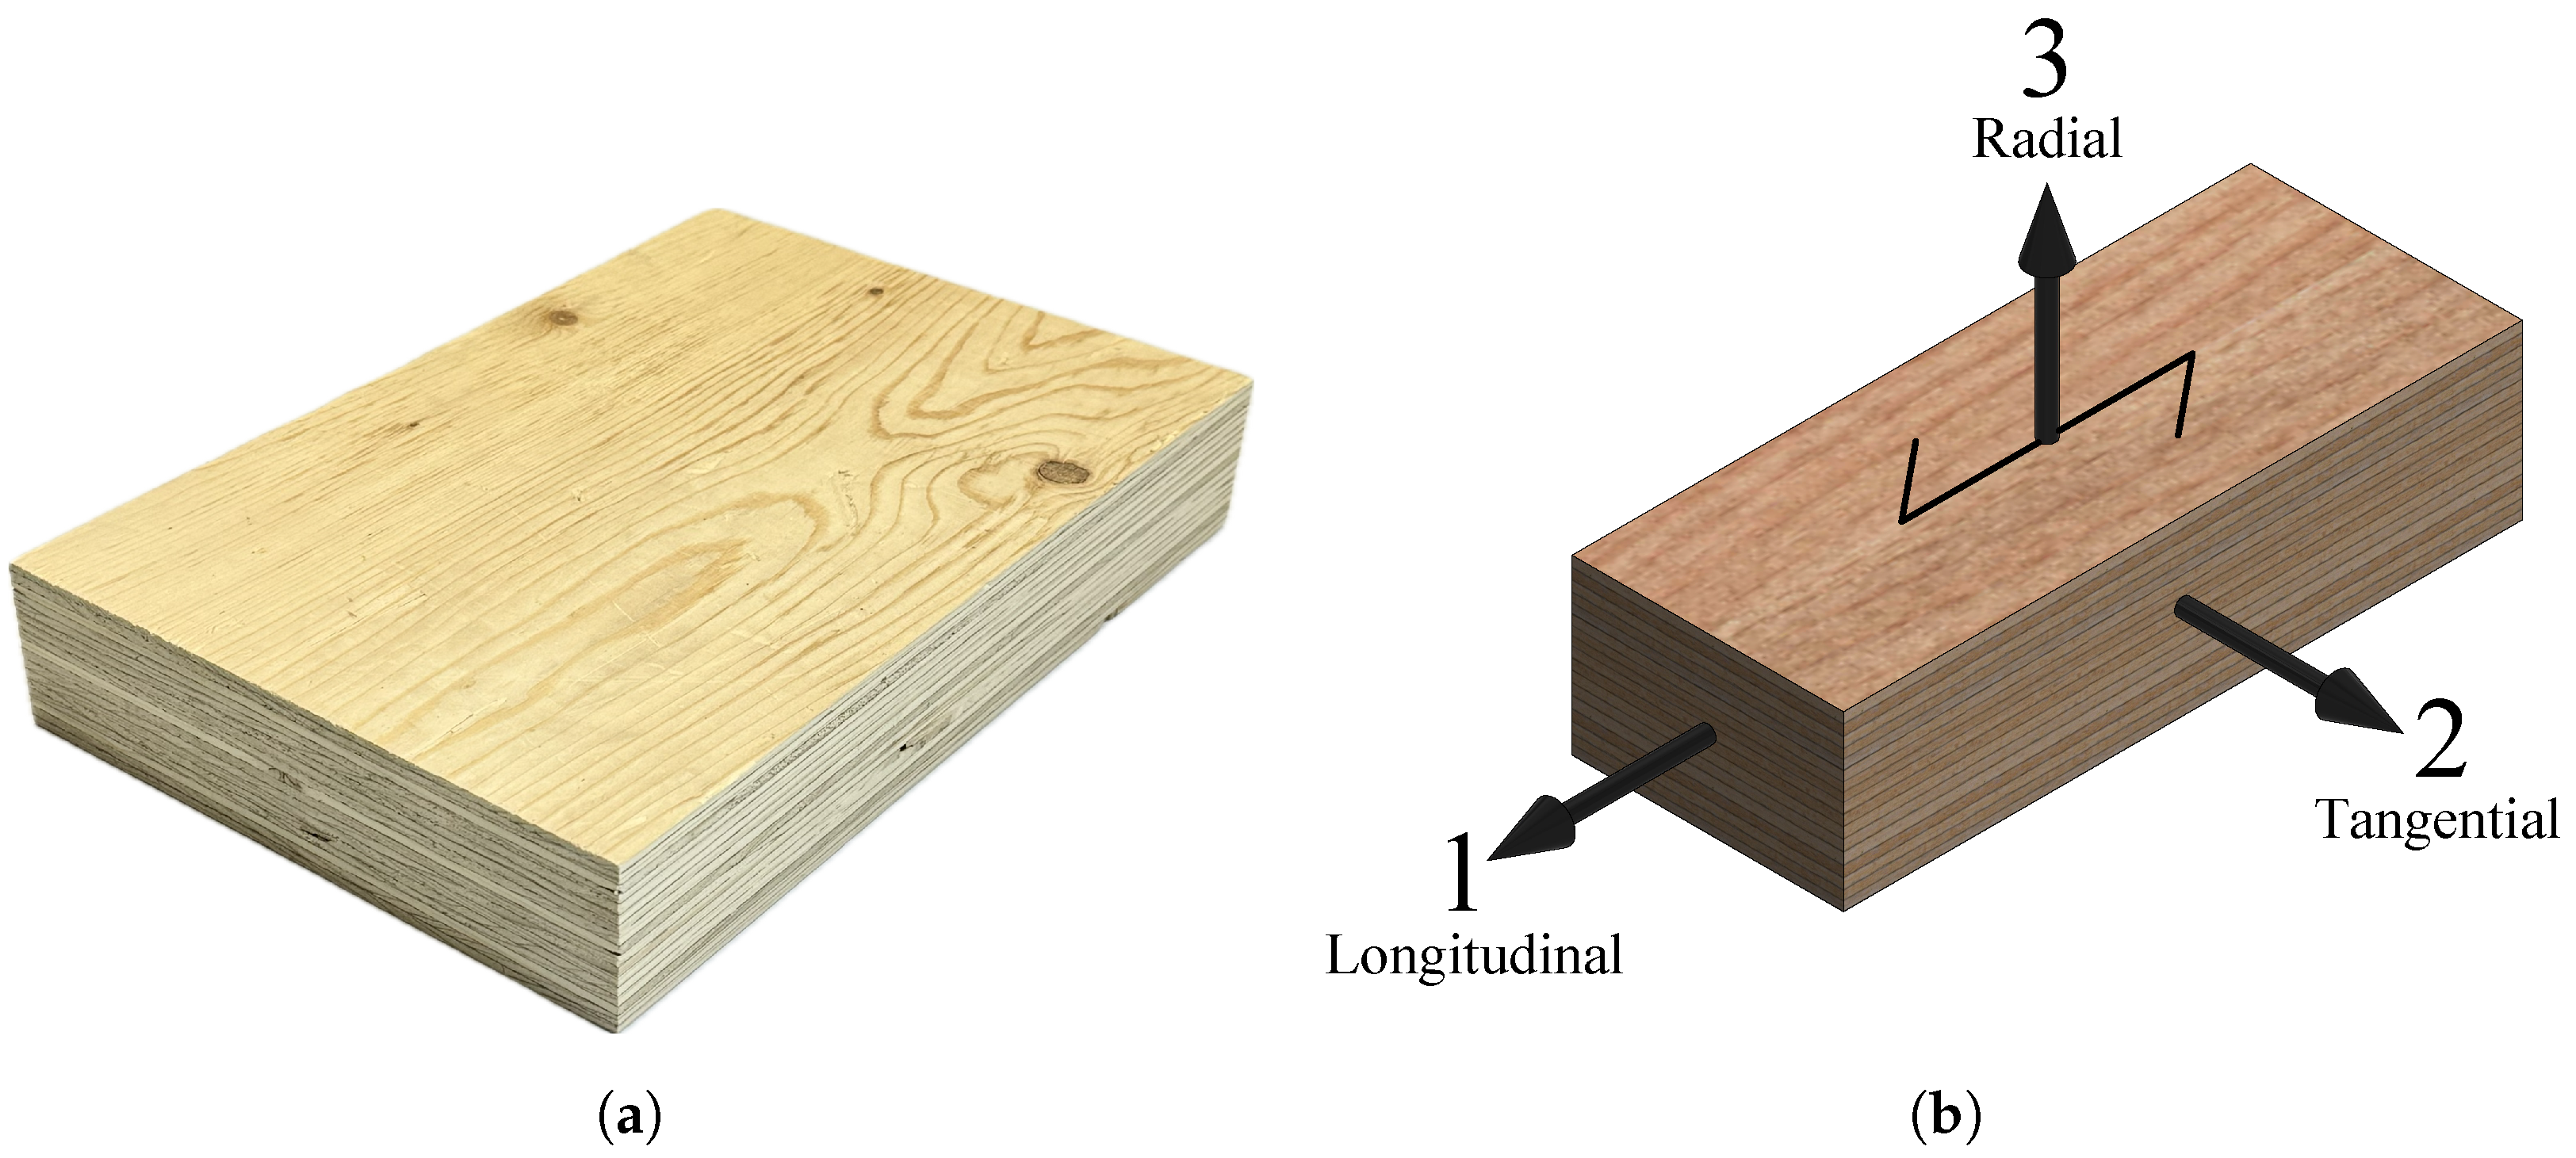
2.1. Material
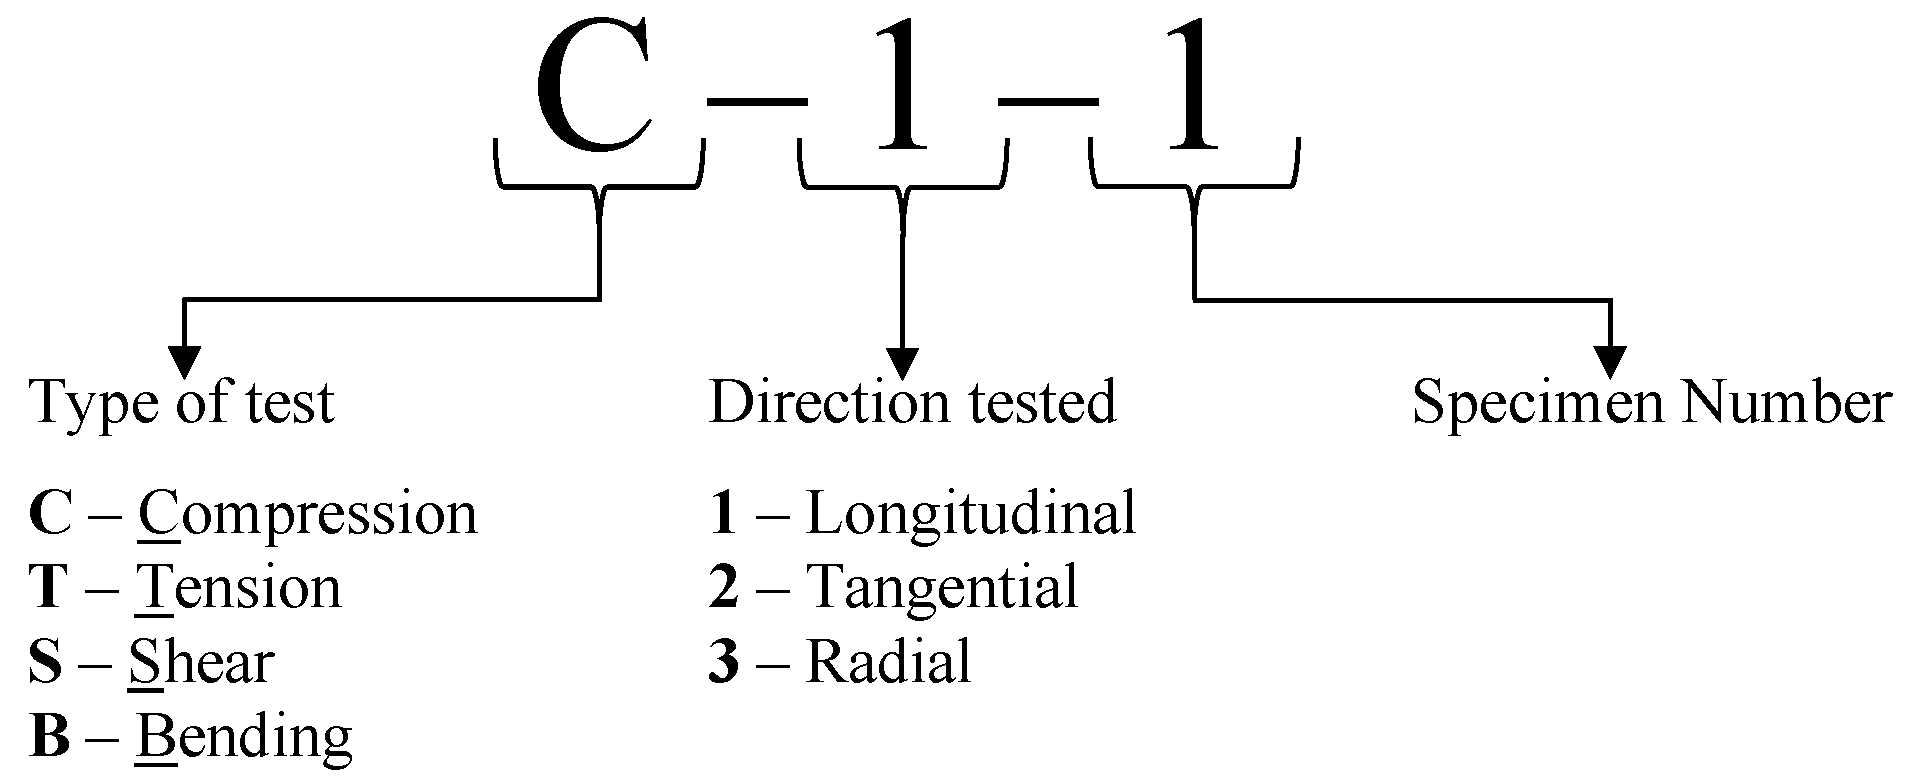
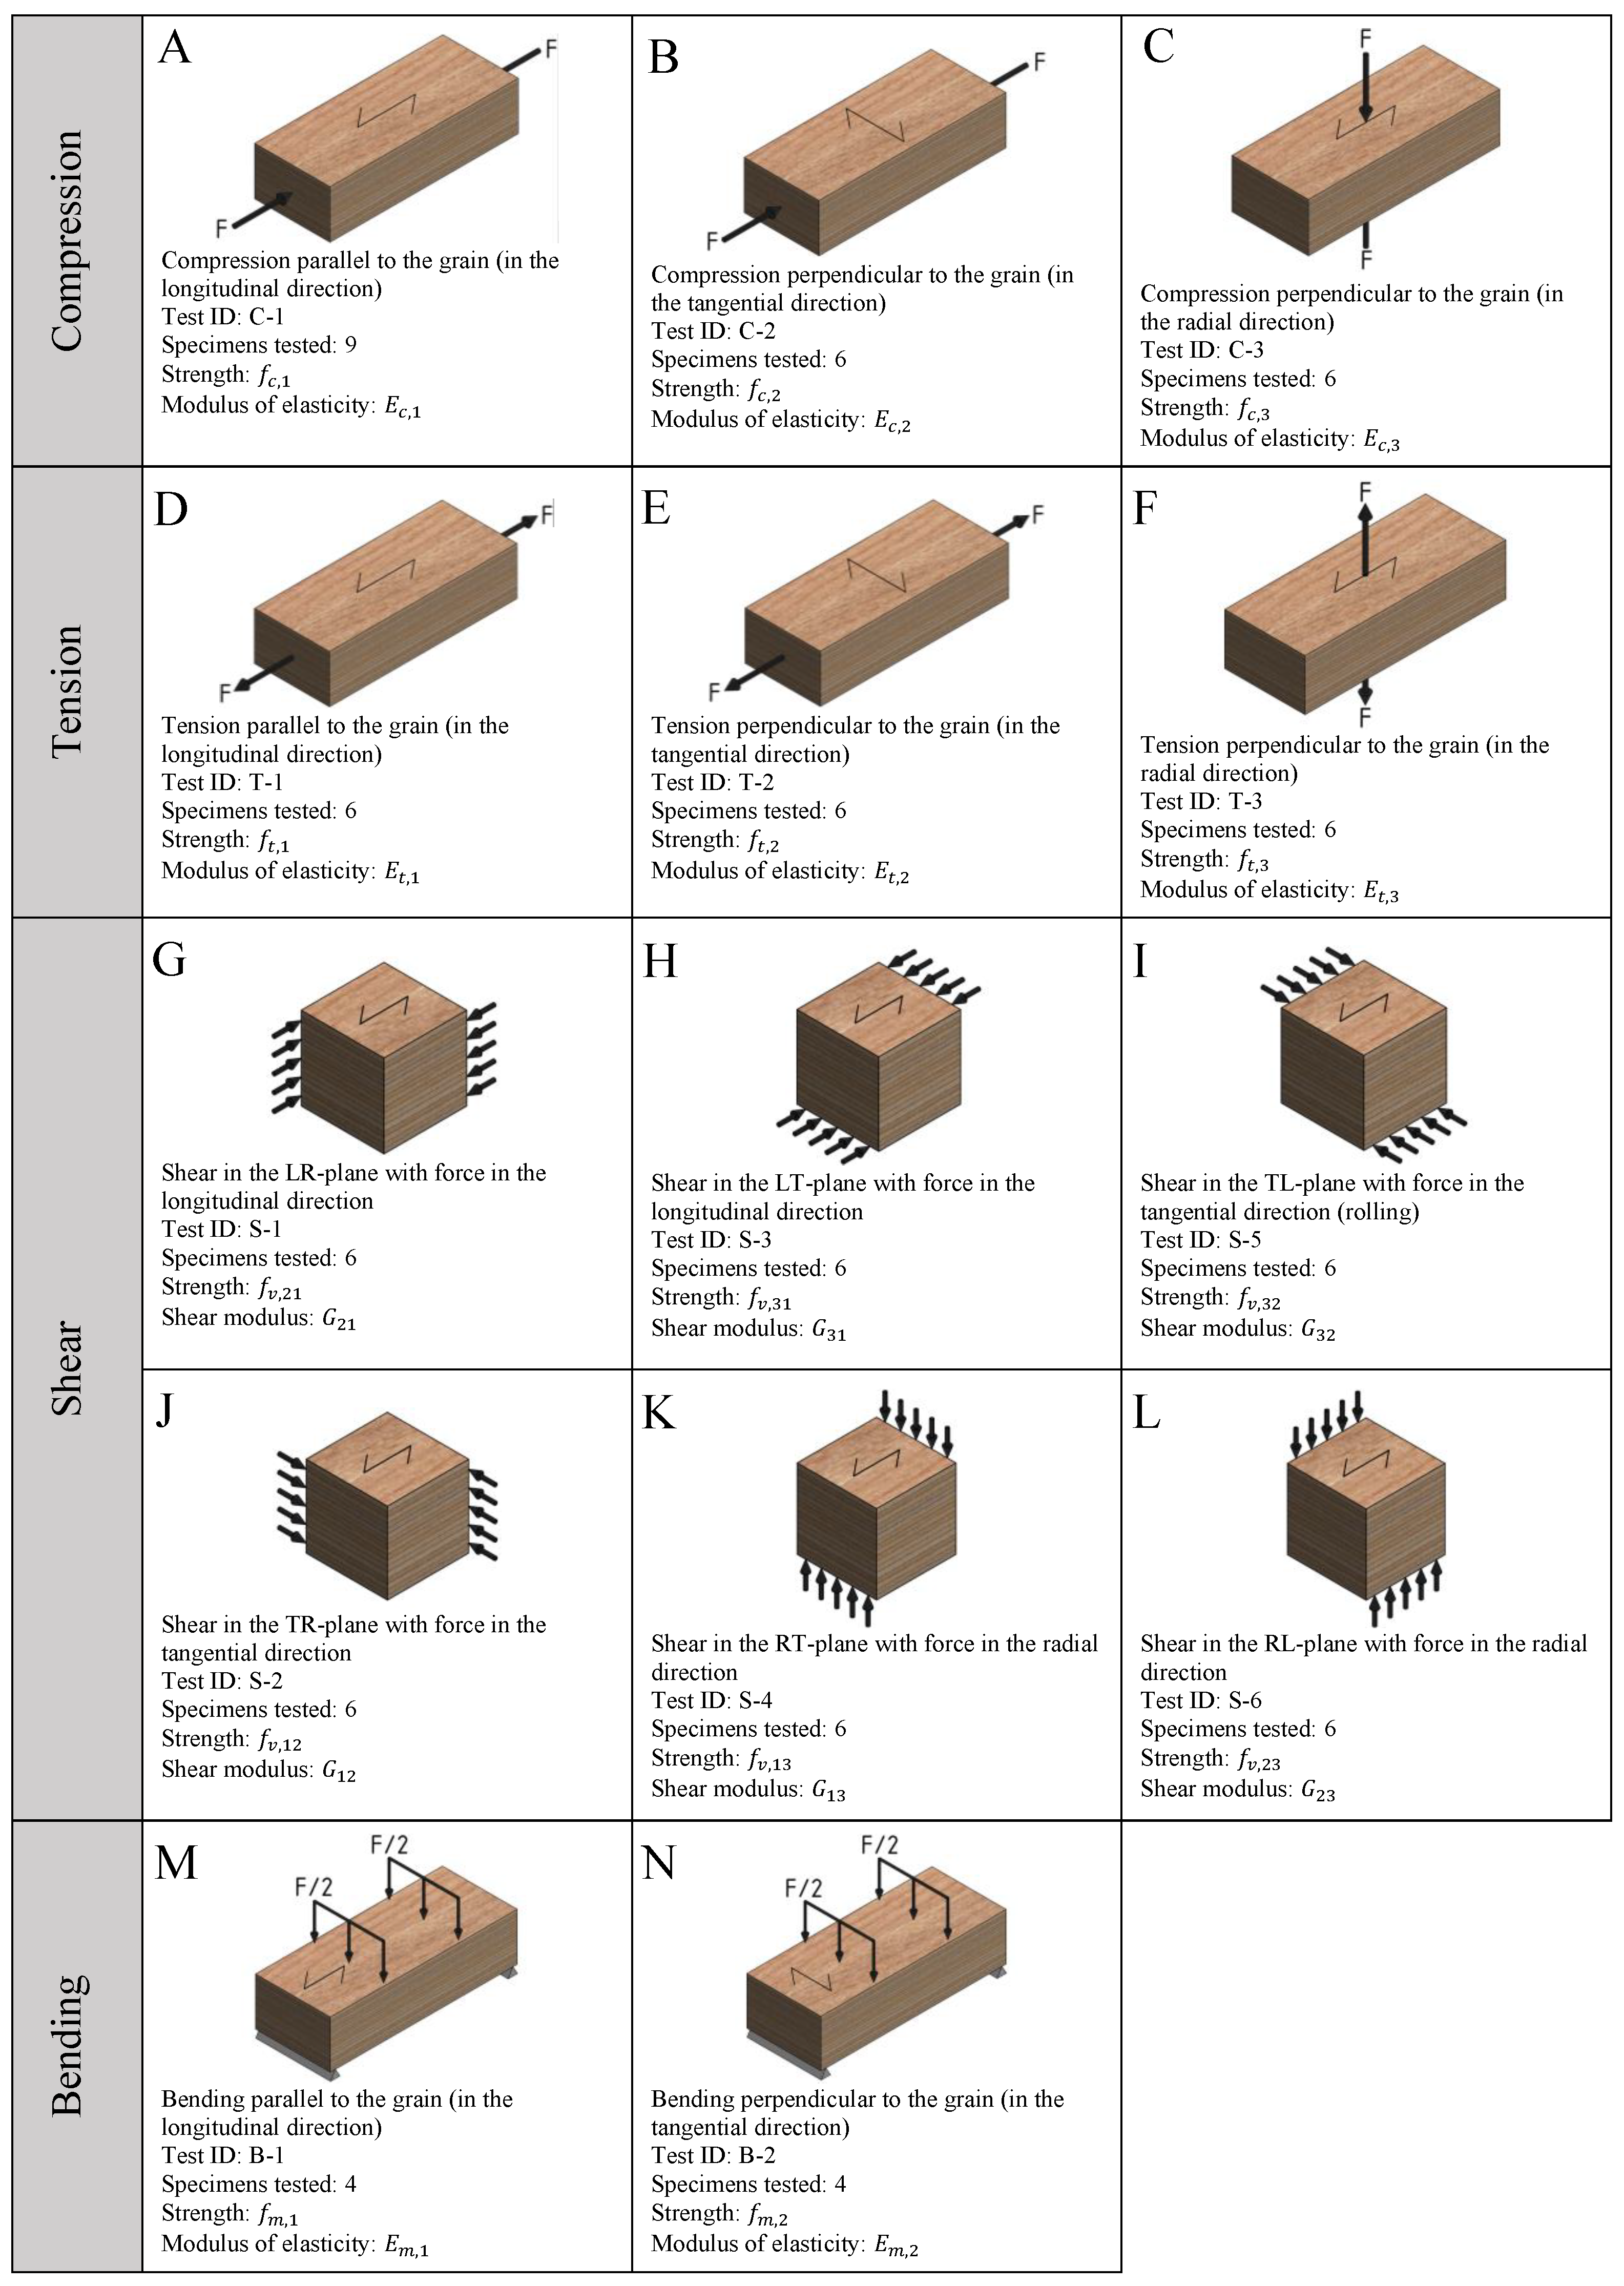
2.2. Tests Overview
3. Methods
3.1. General
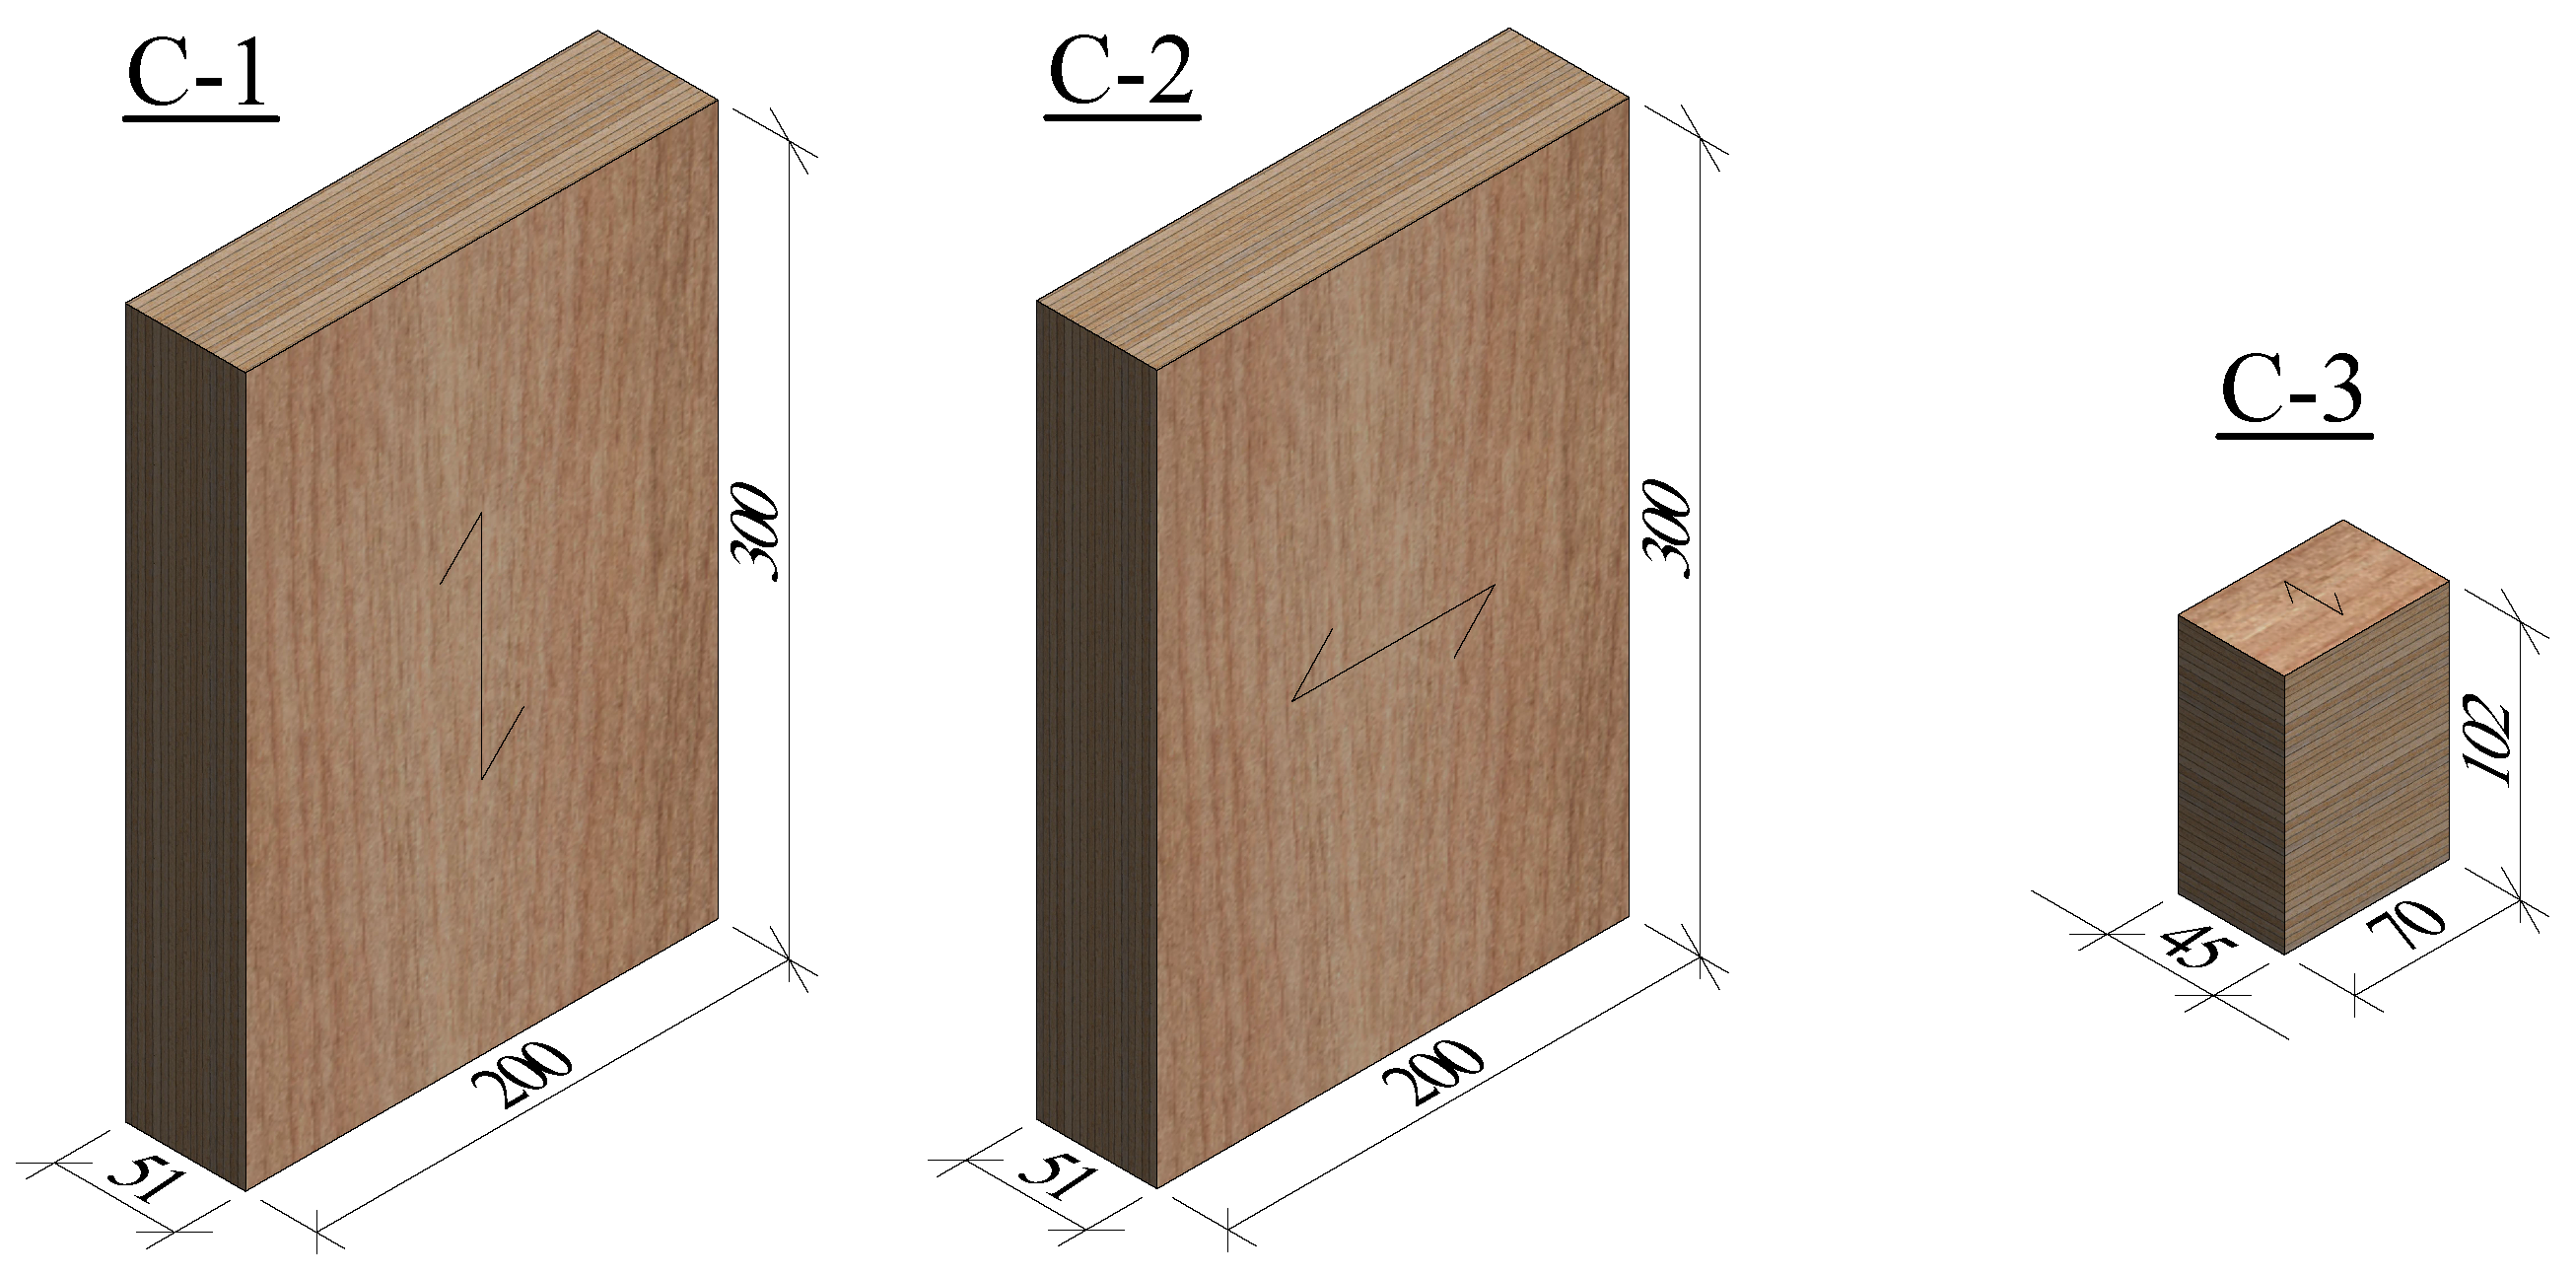
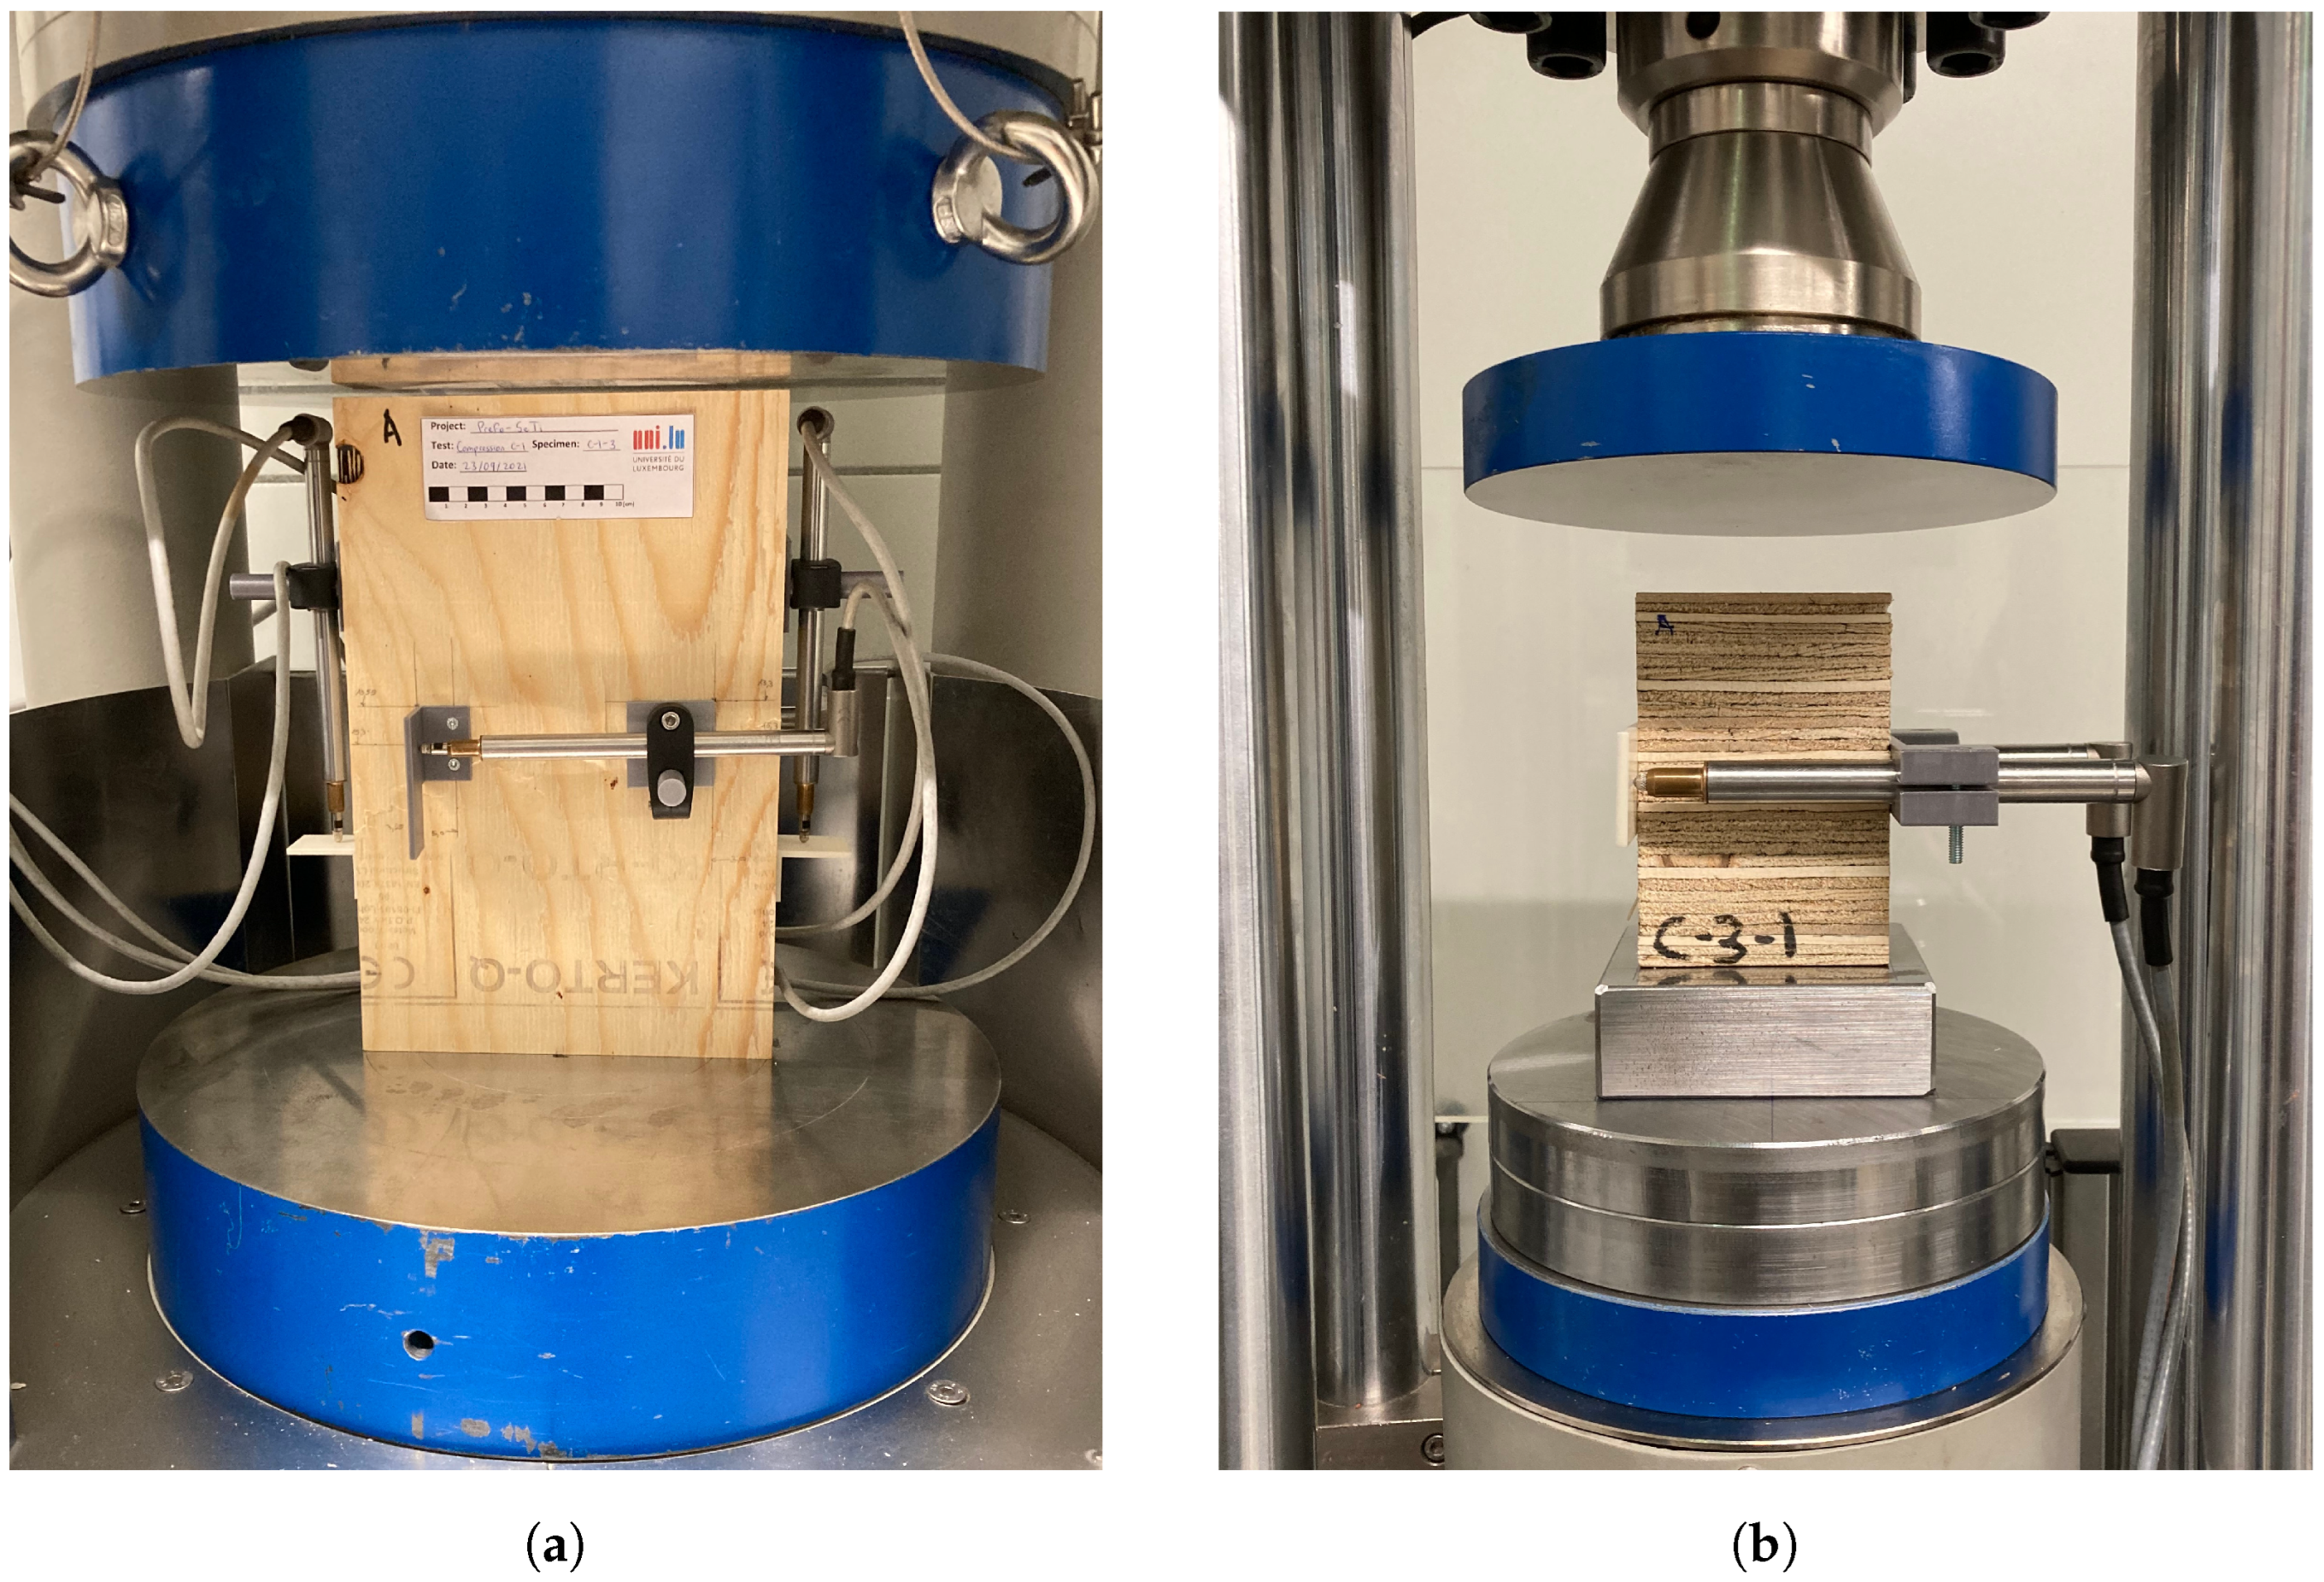
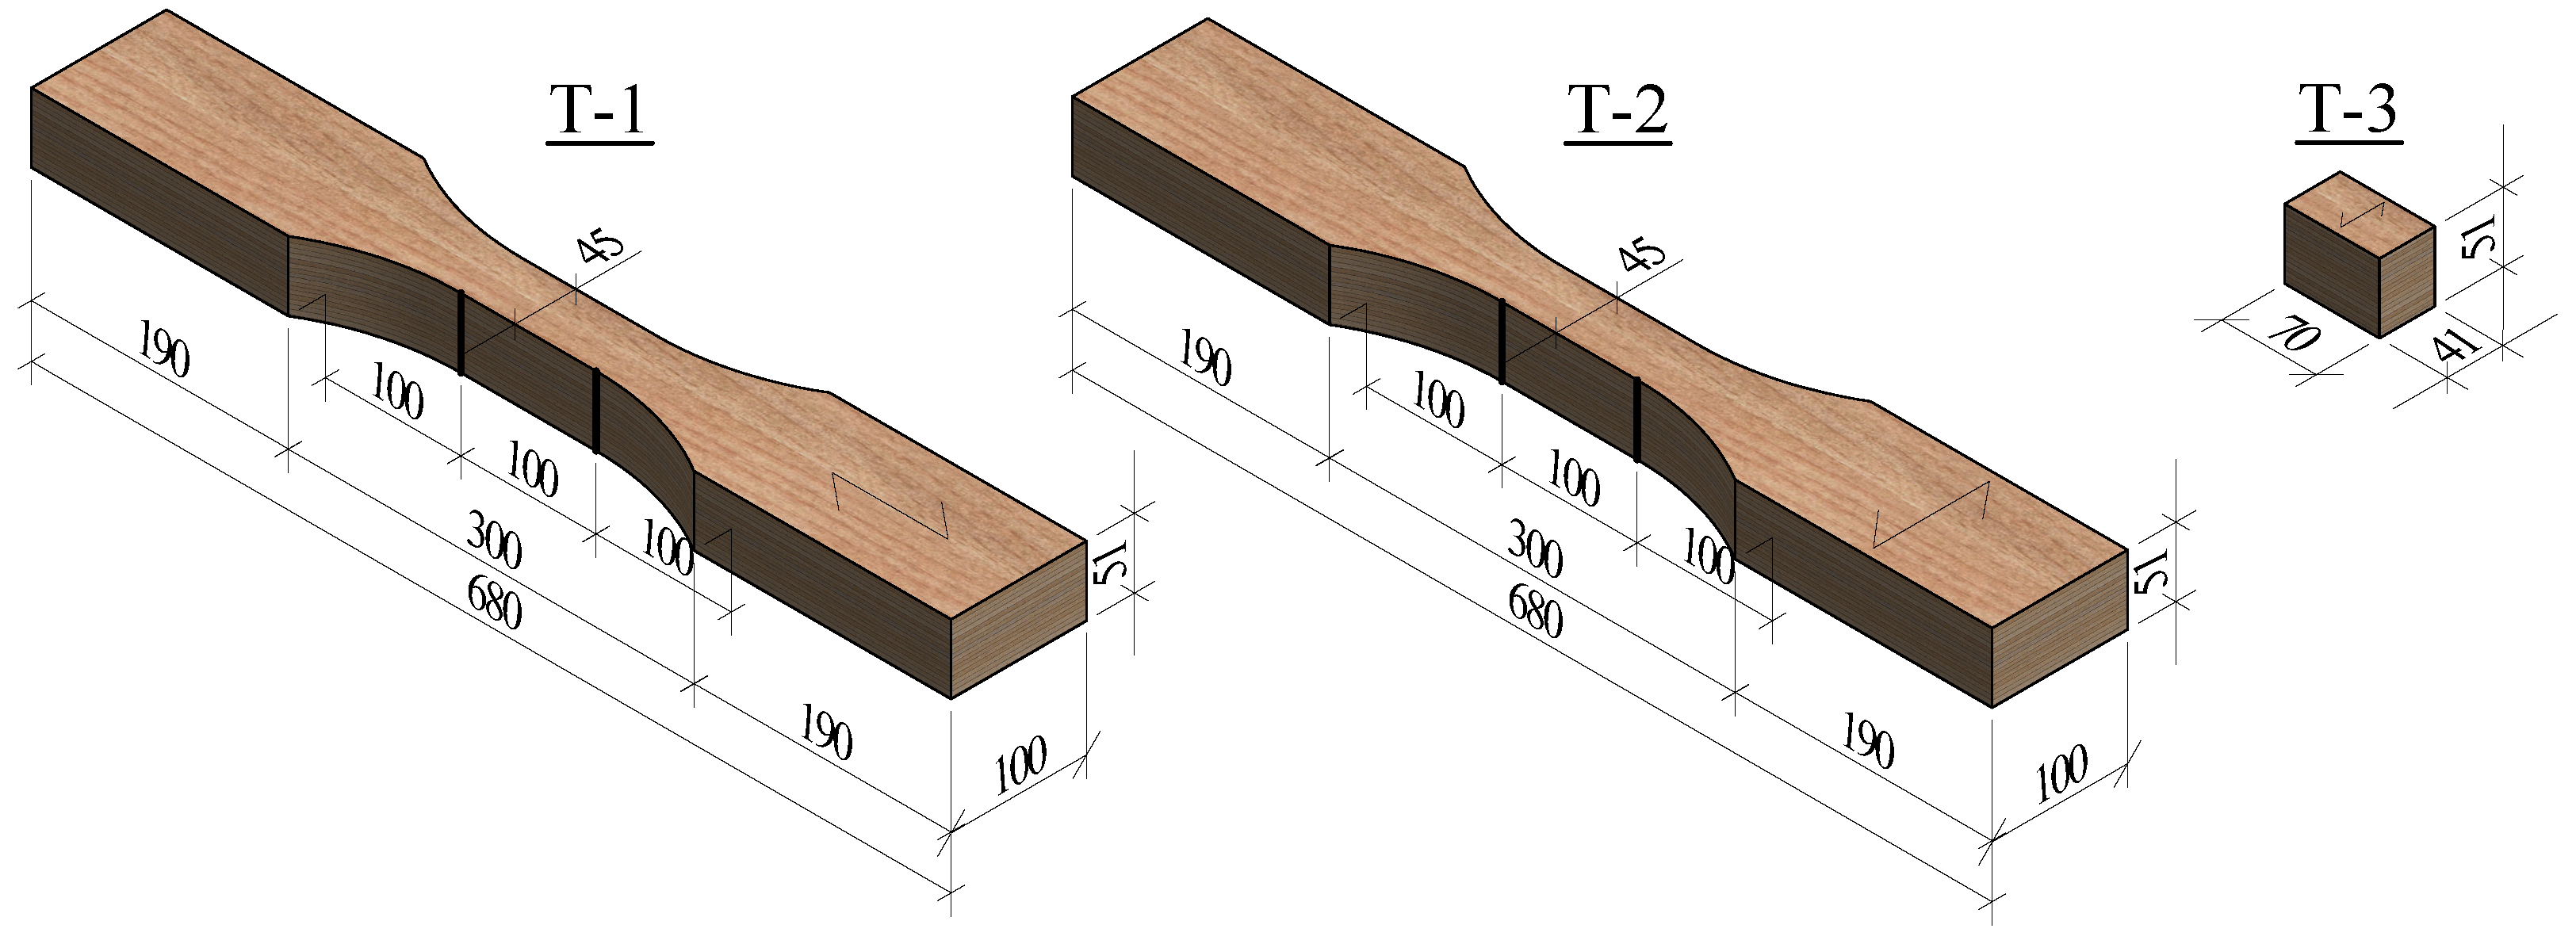
3.2. Compression Tests
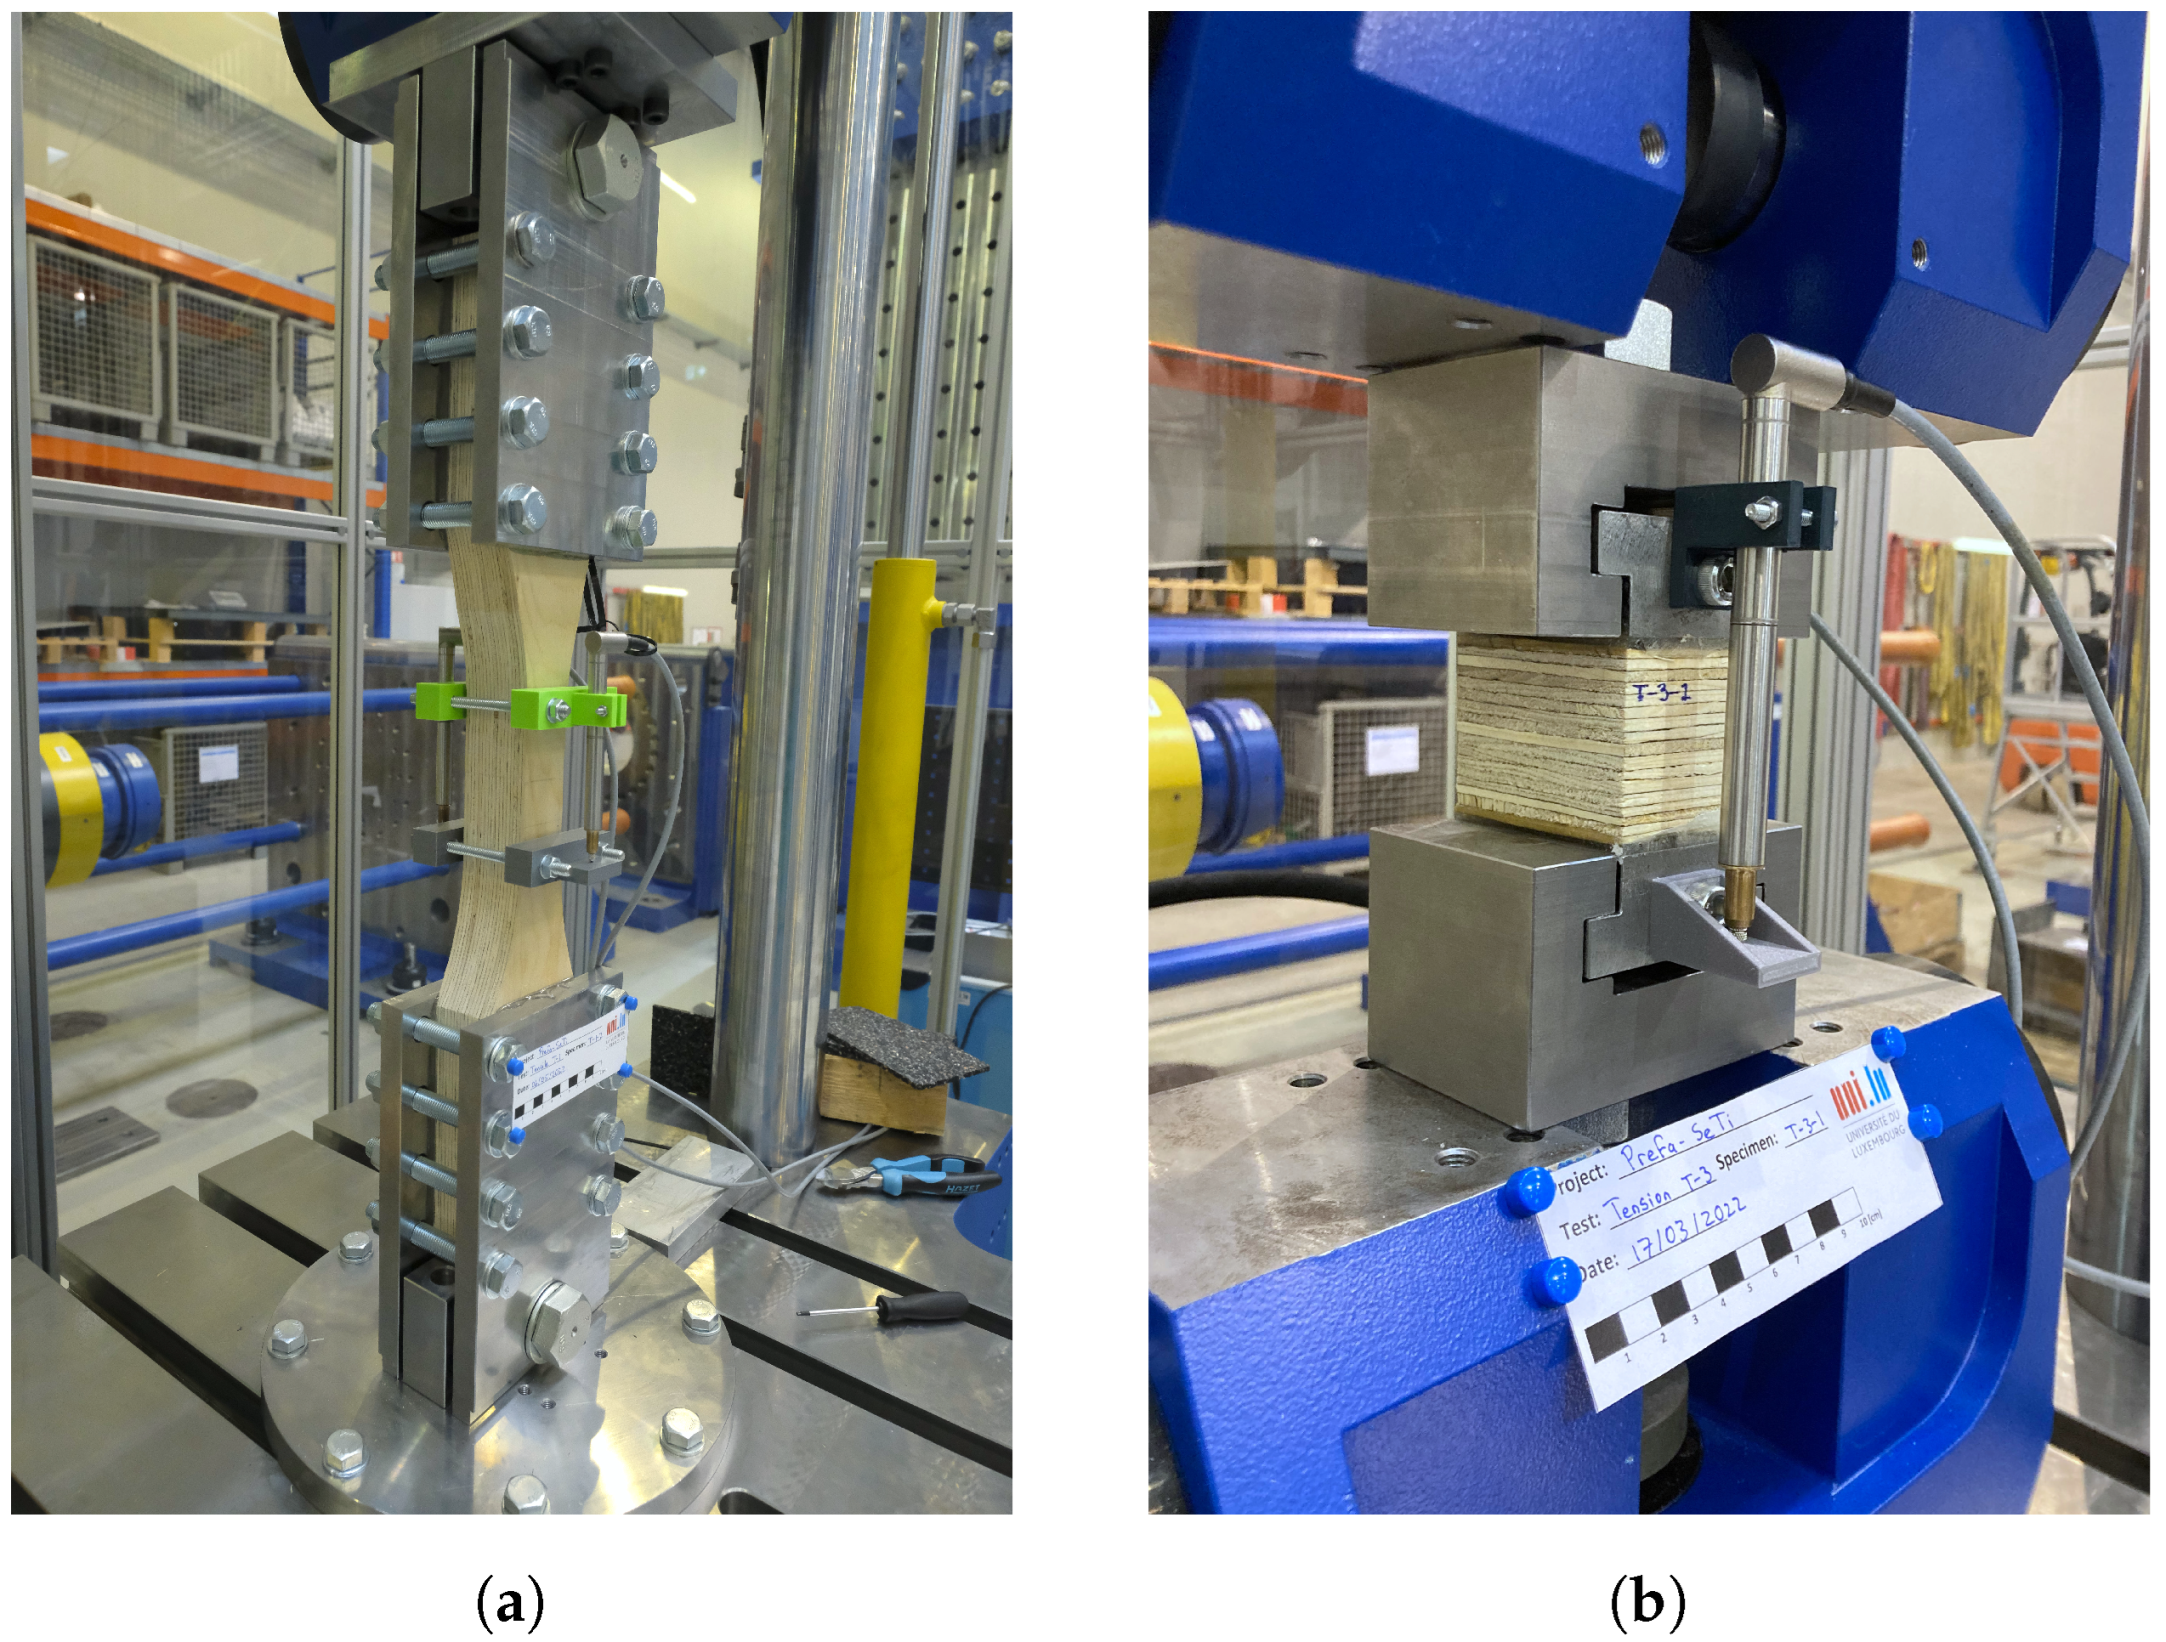
3.3. Tension Tests
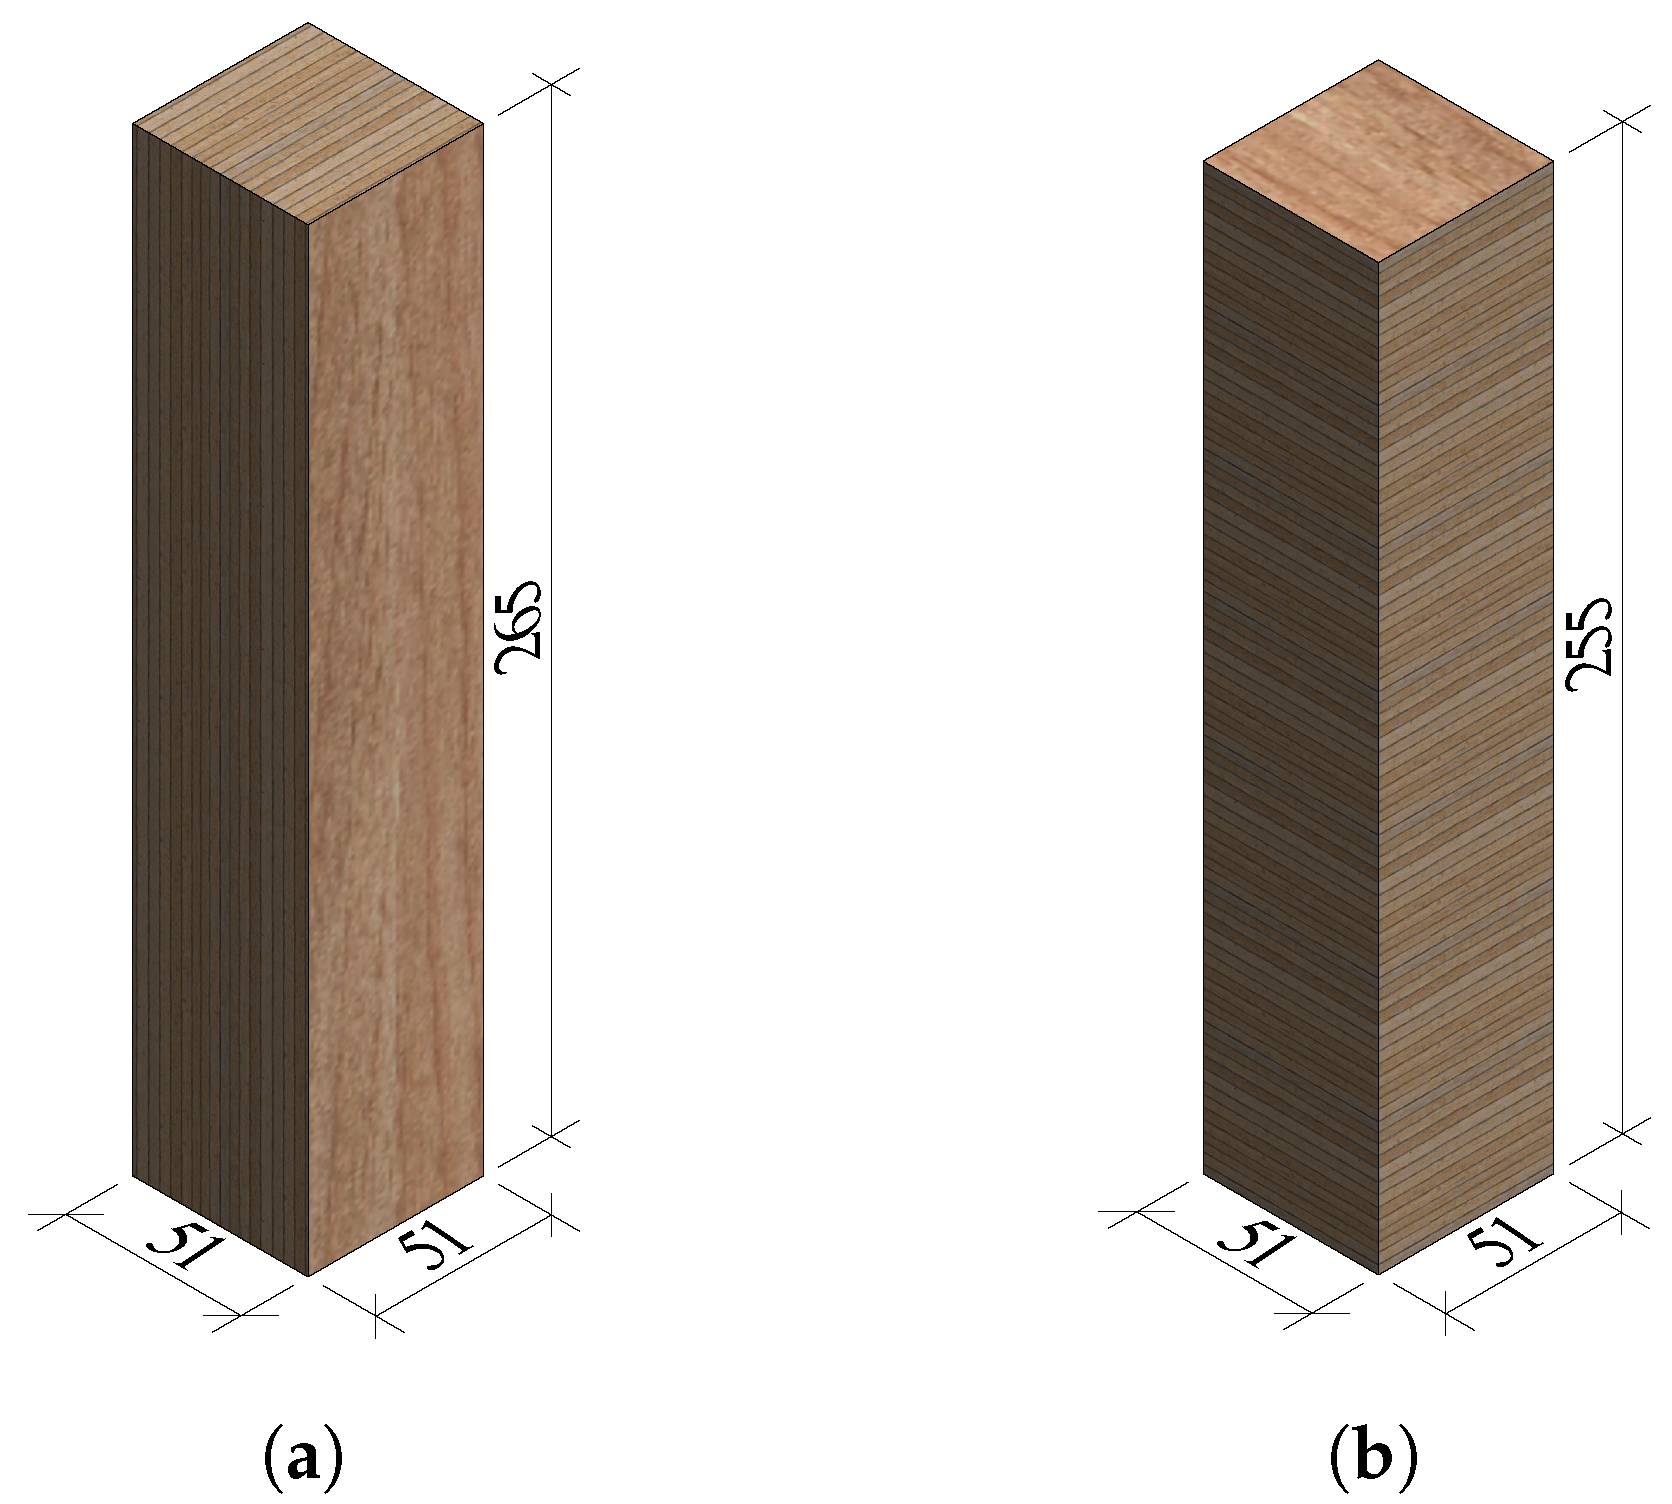
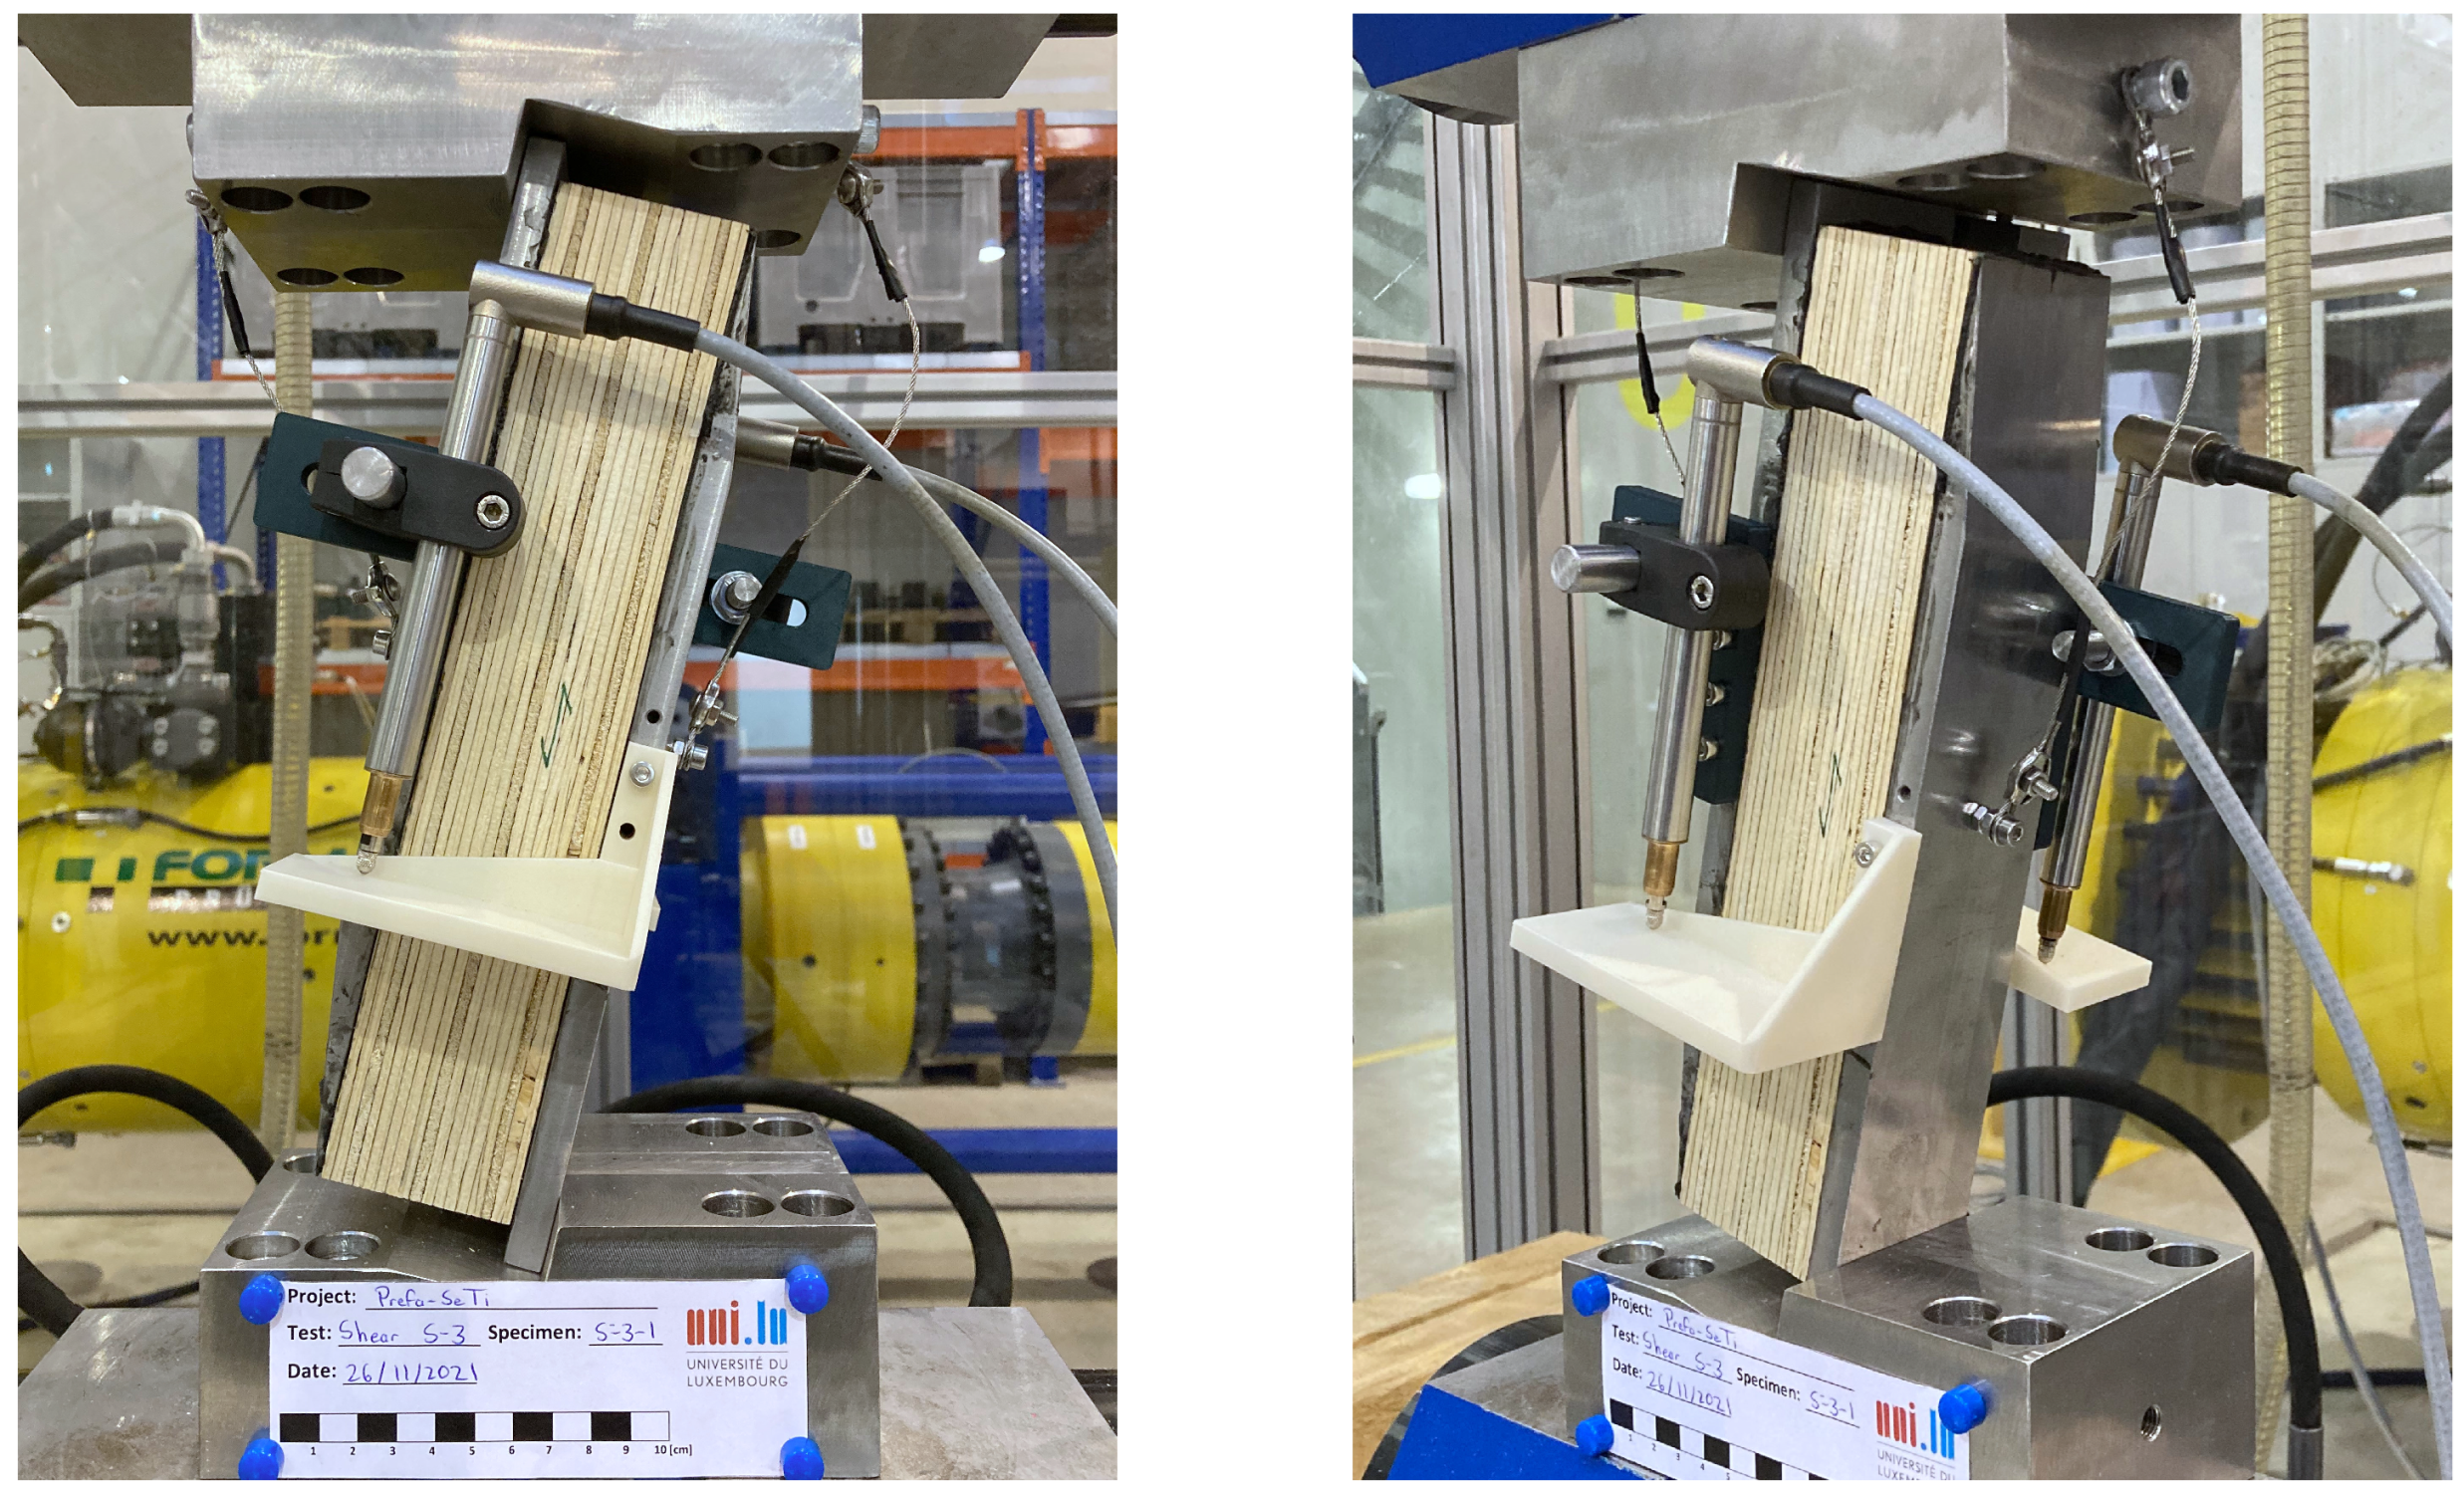
3.4. Shear Tests
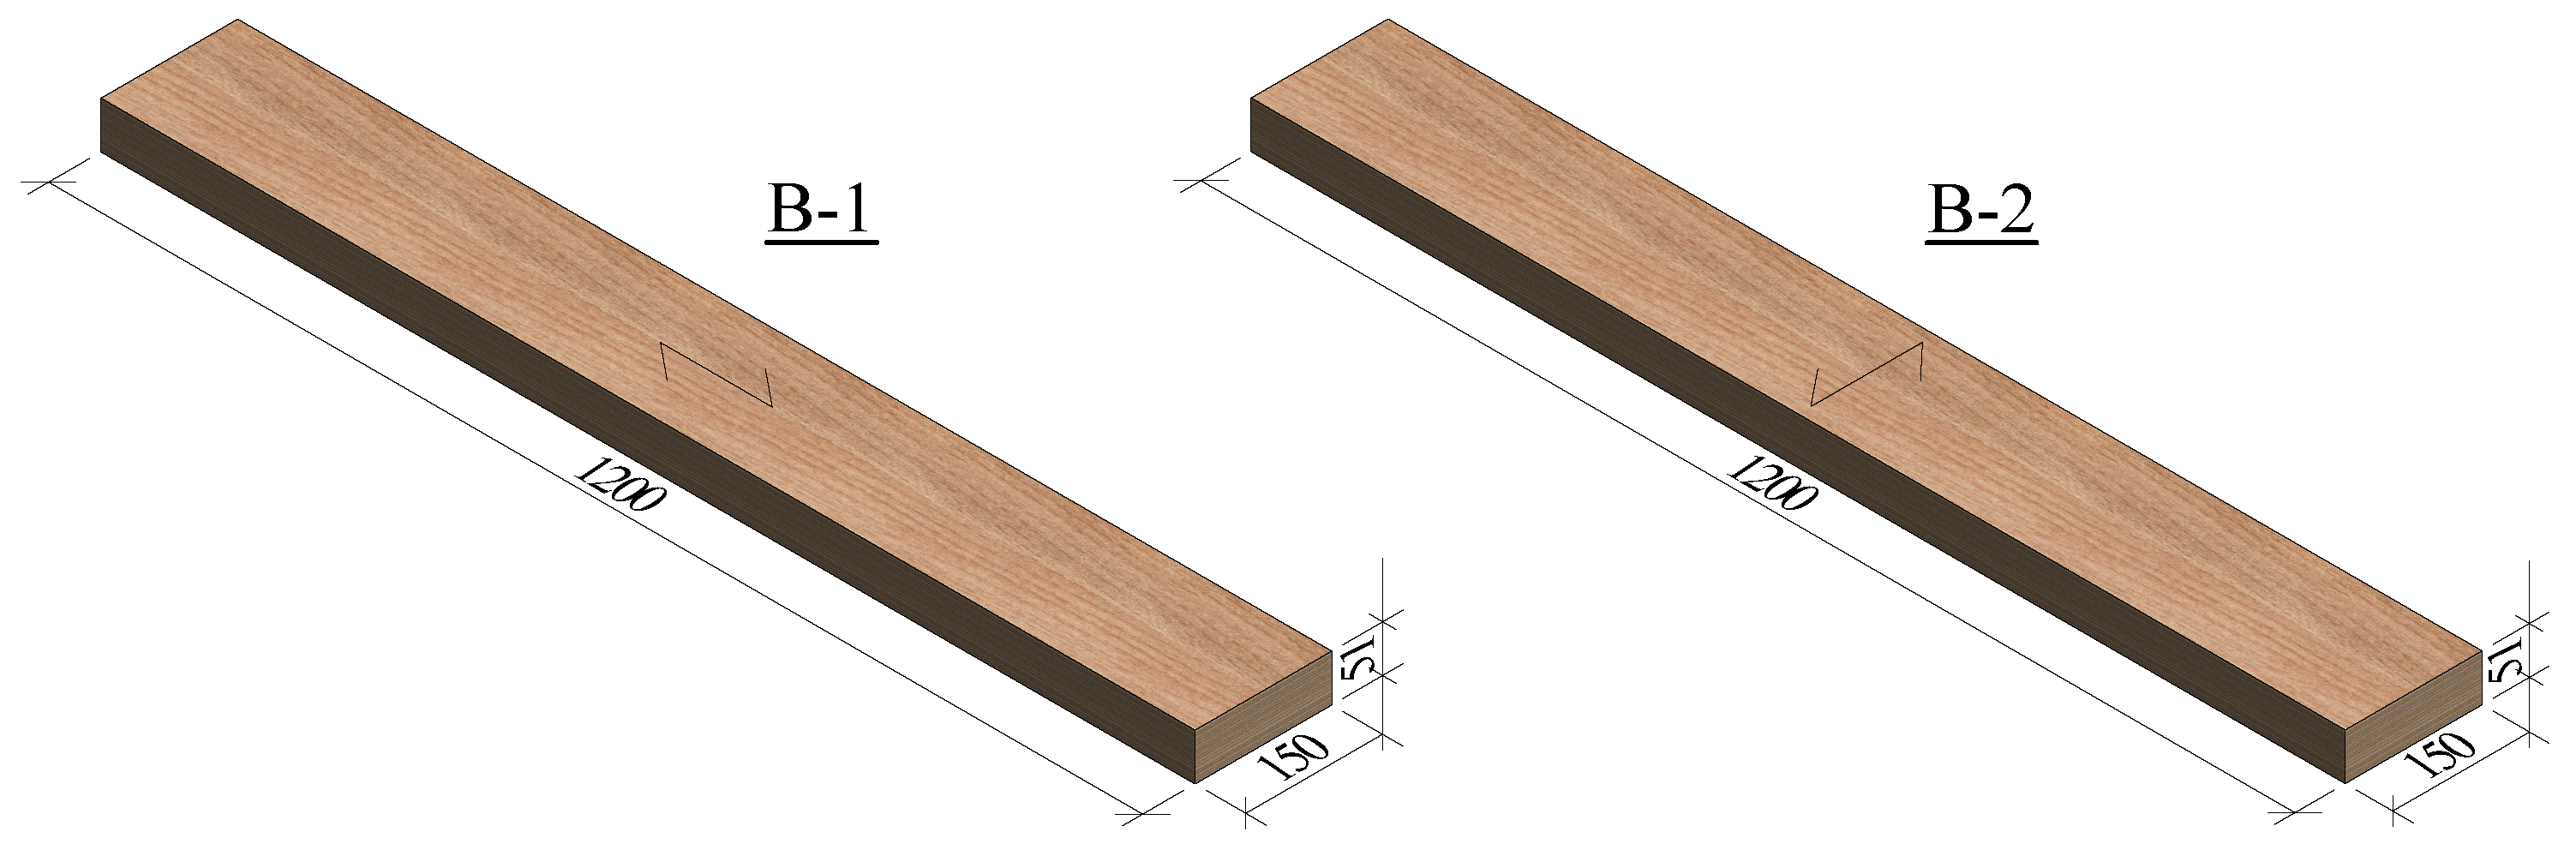
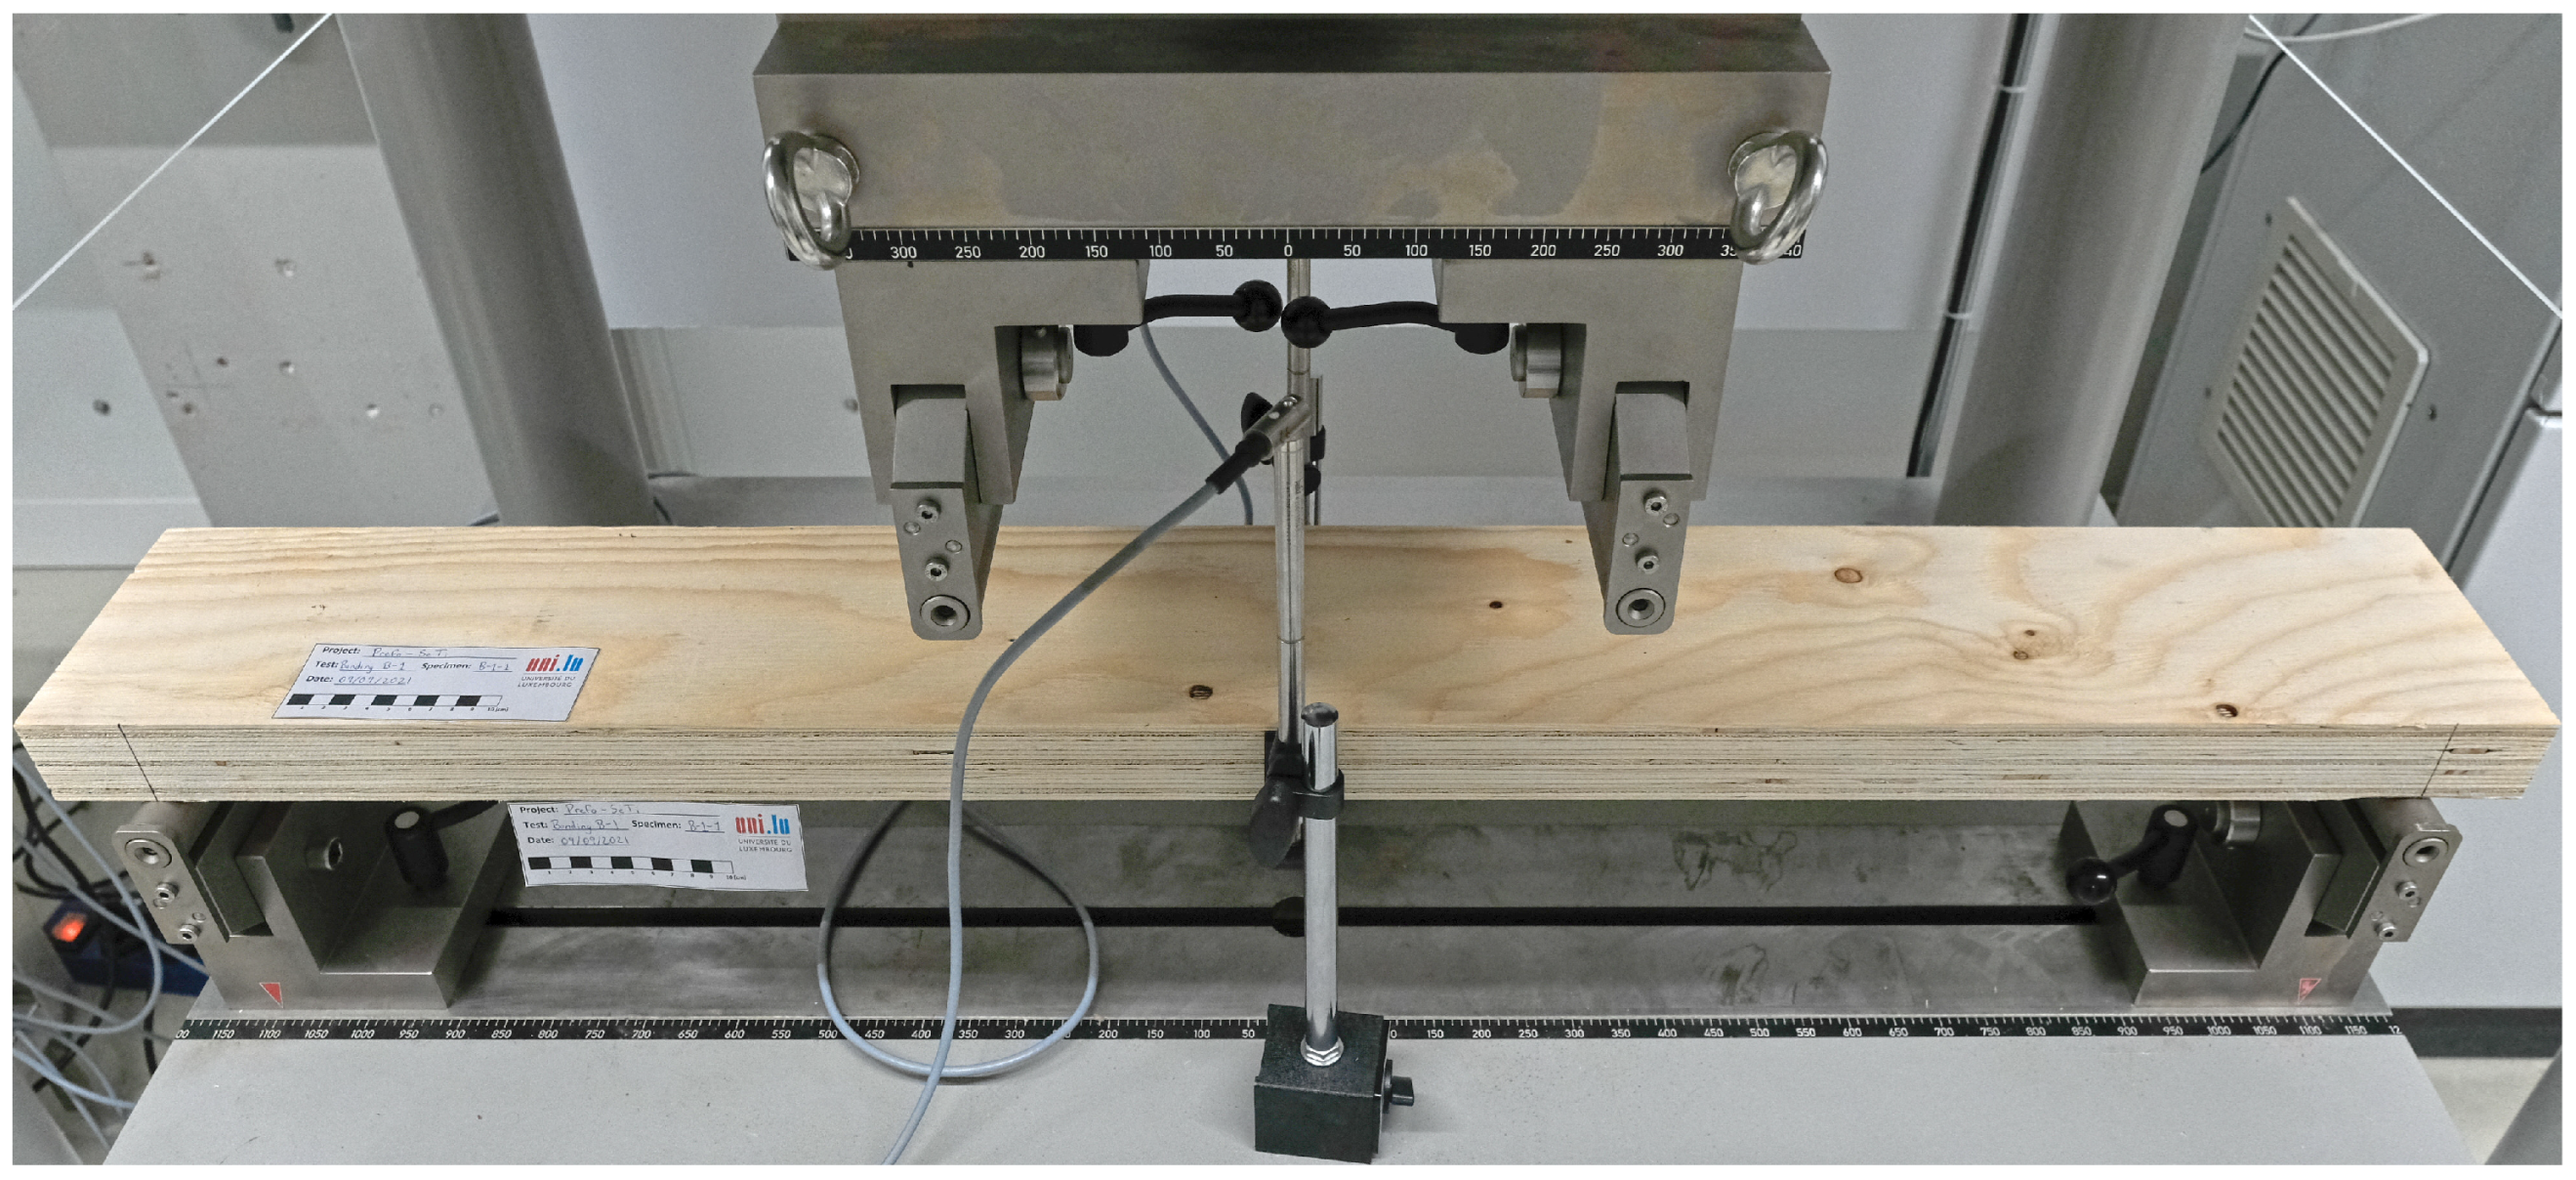
3.5. Bending Tests
4. Results and Discussion
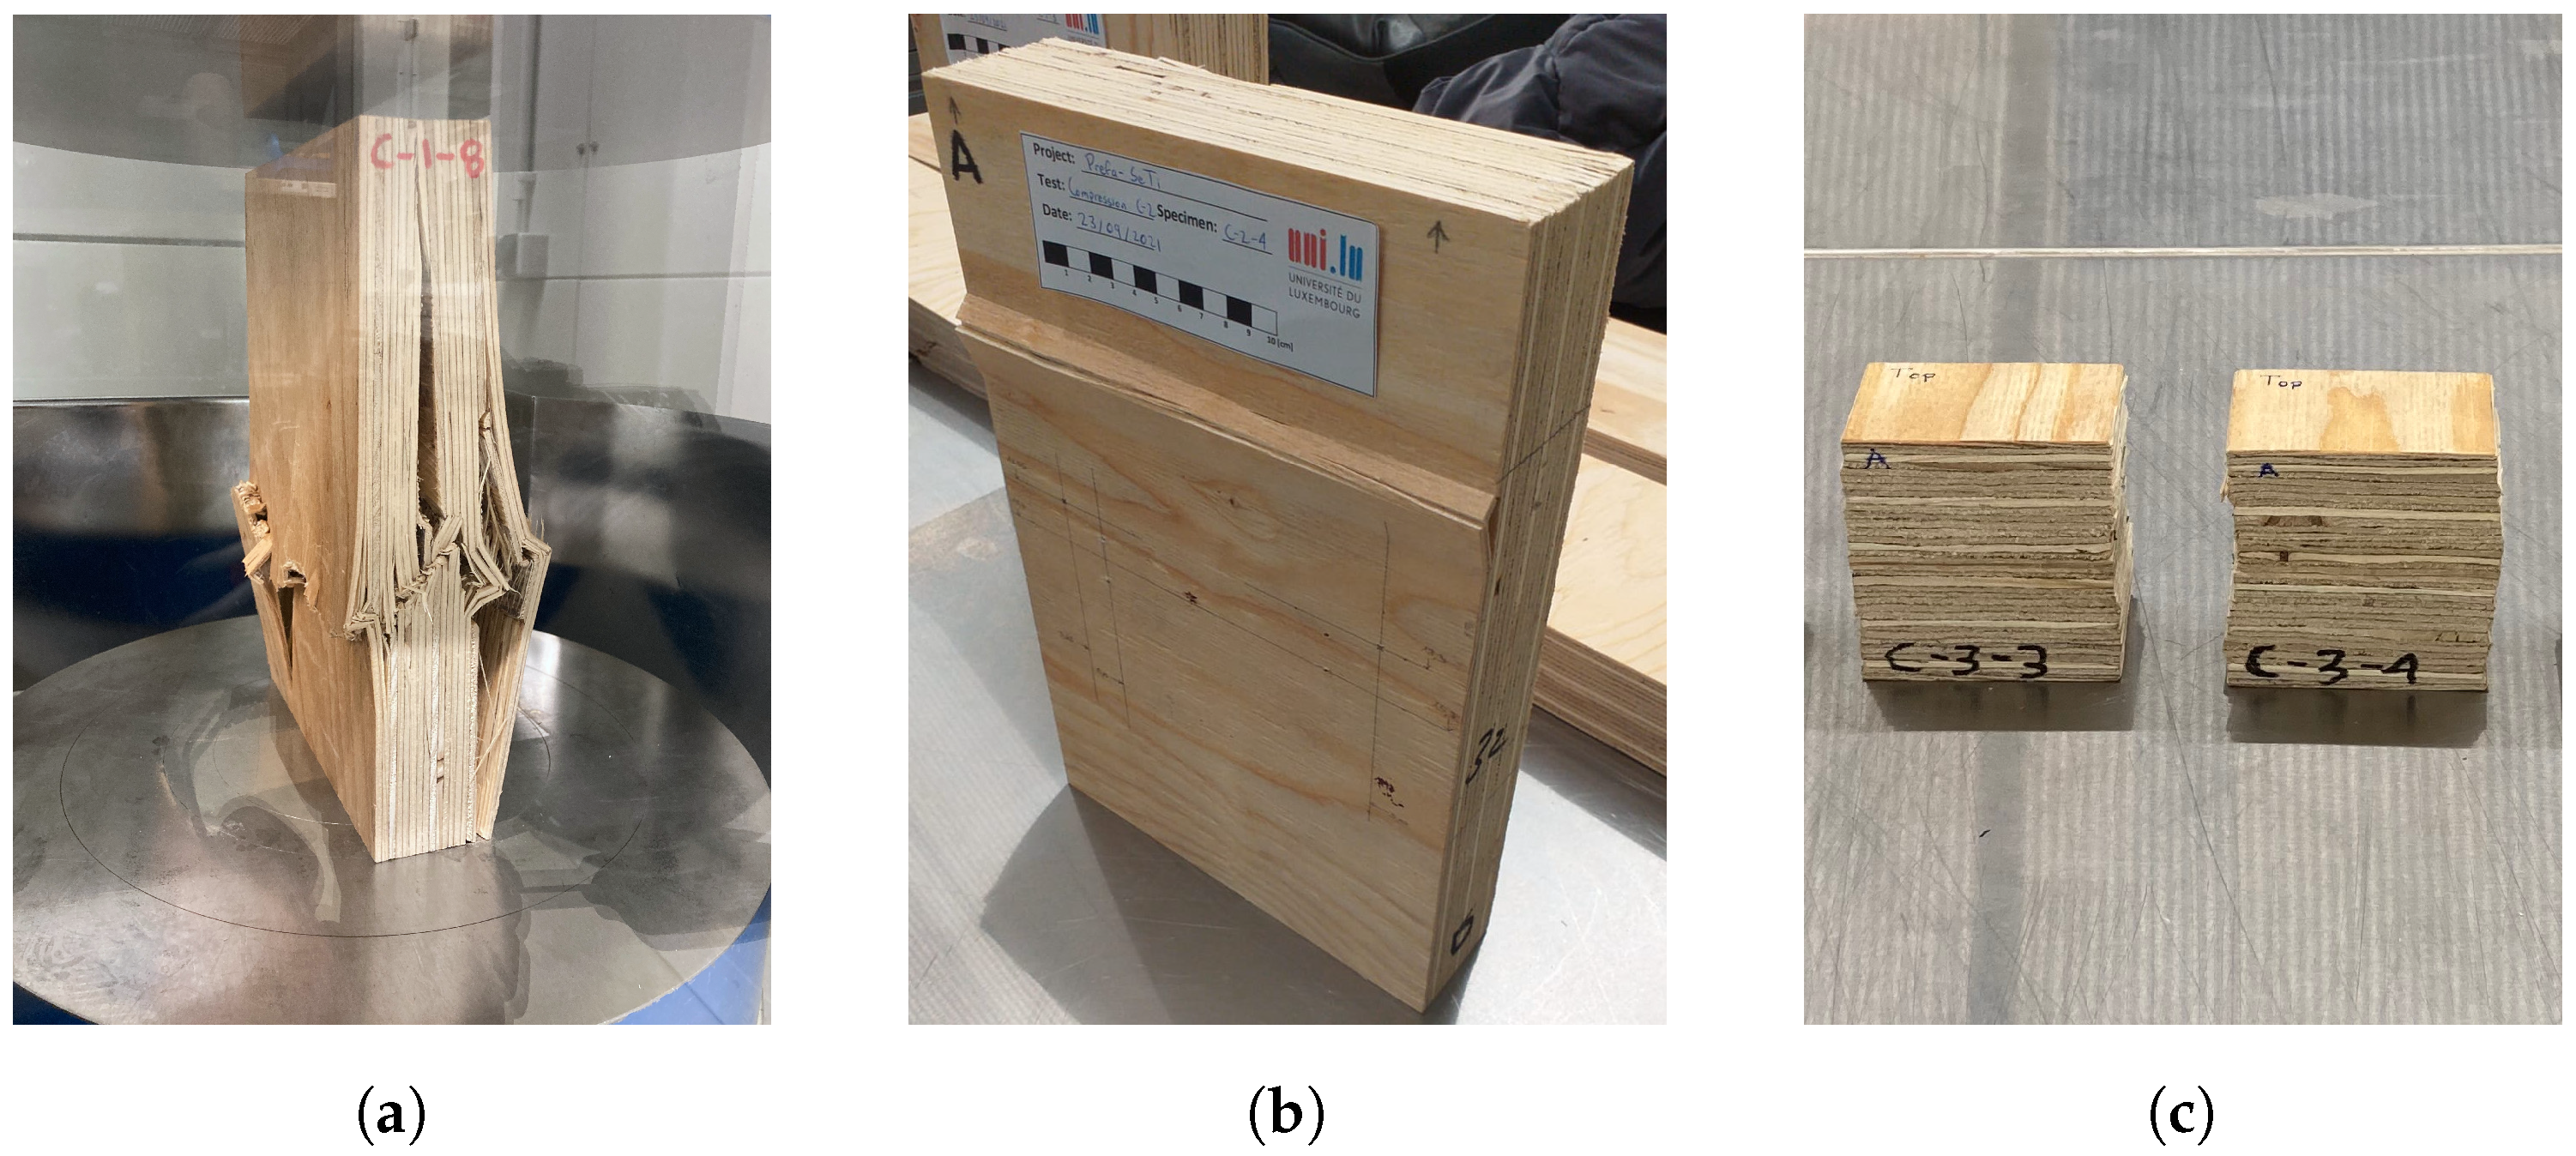
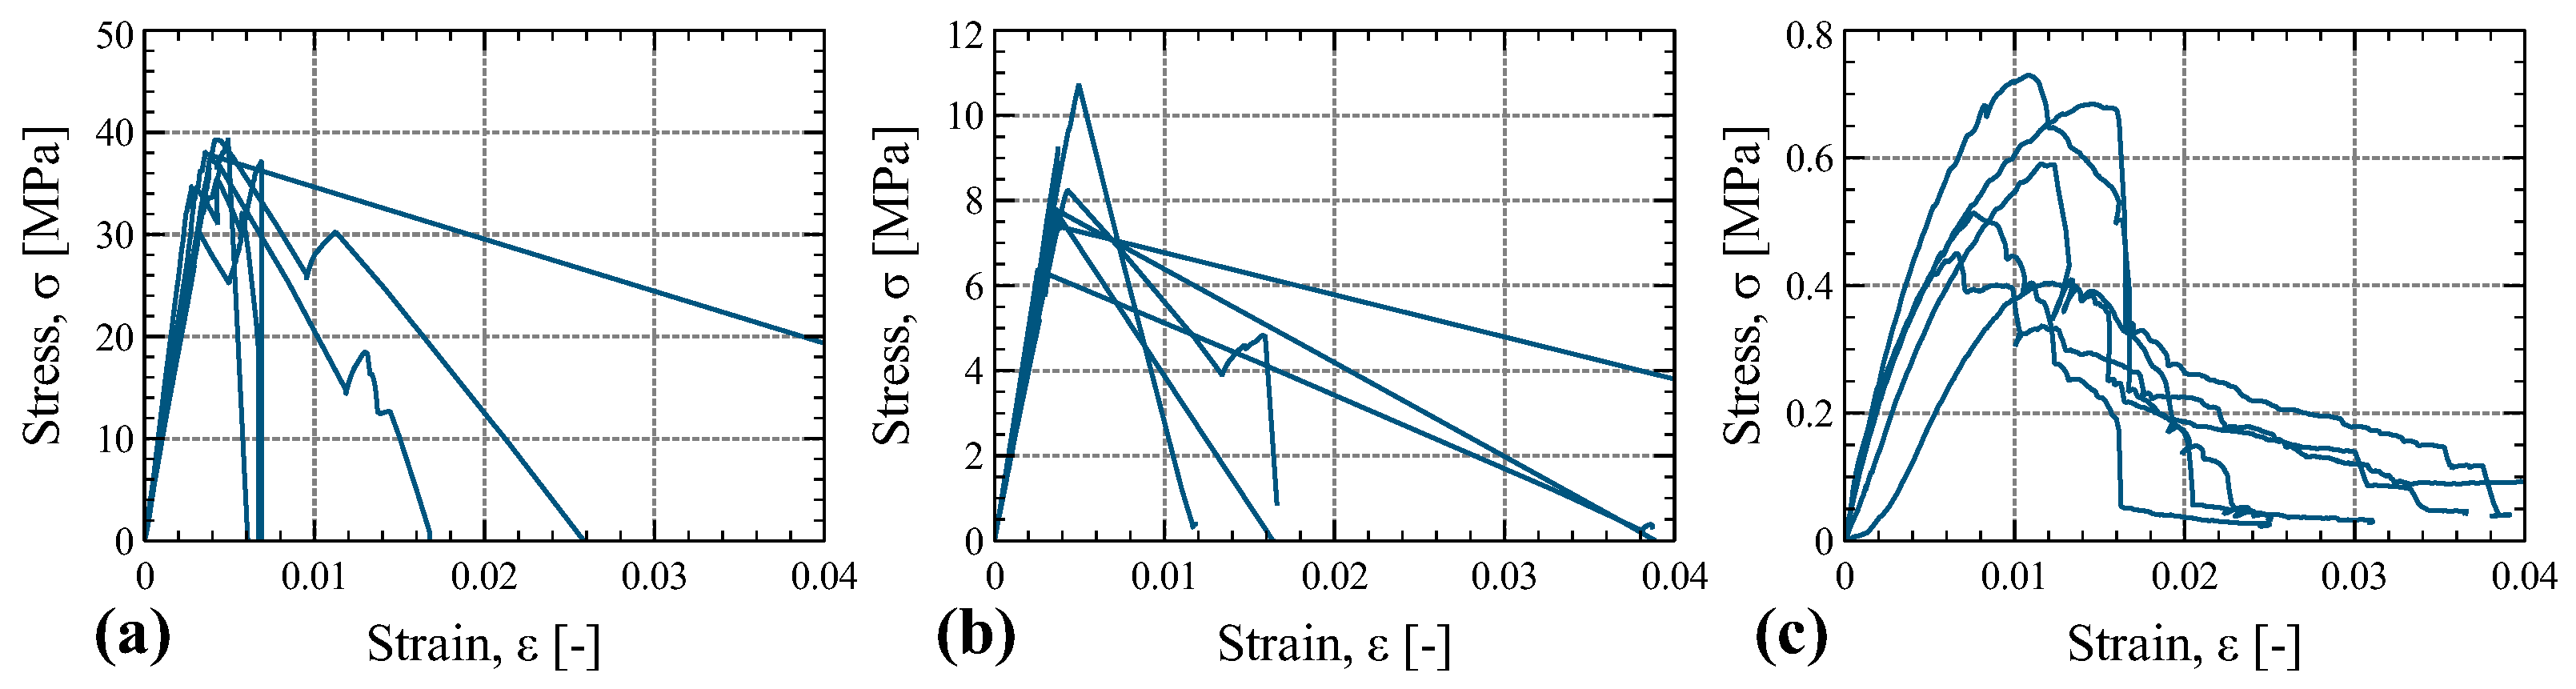
4.1. Compression Tests
4.2. Tension Tests
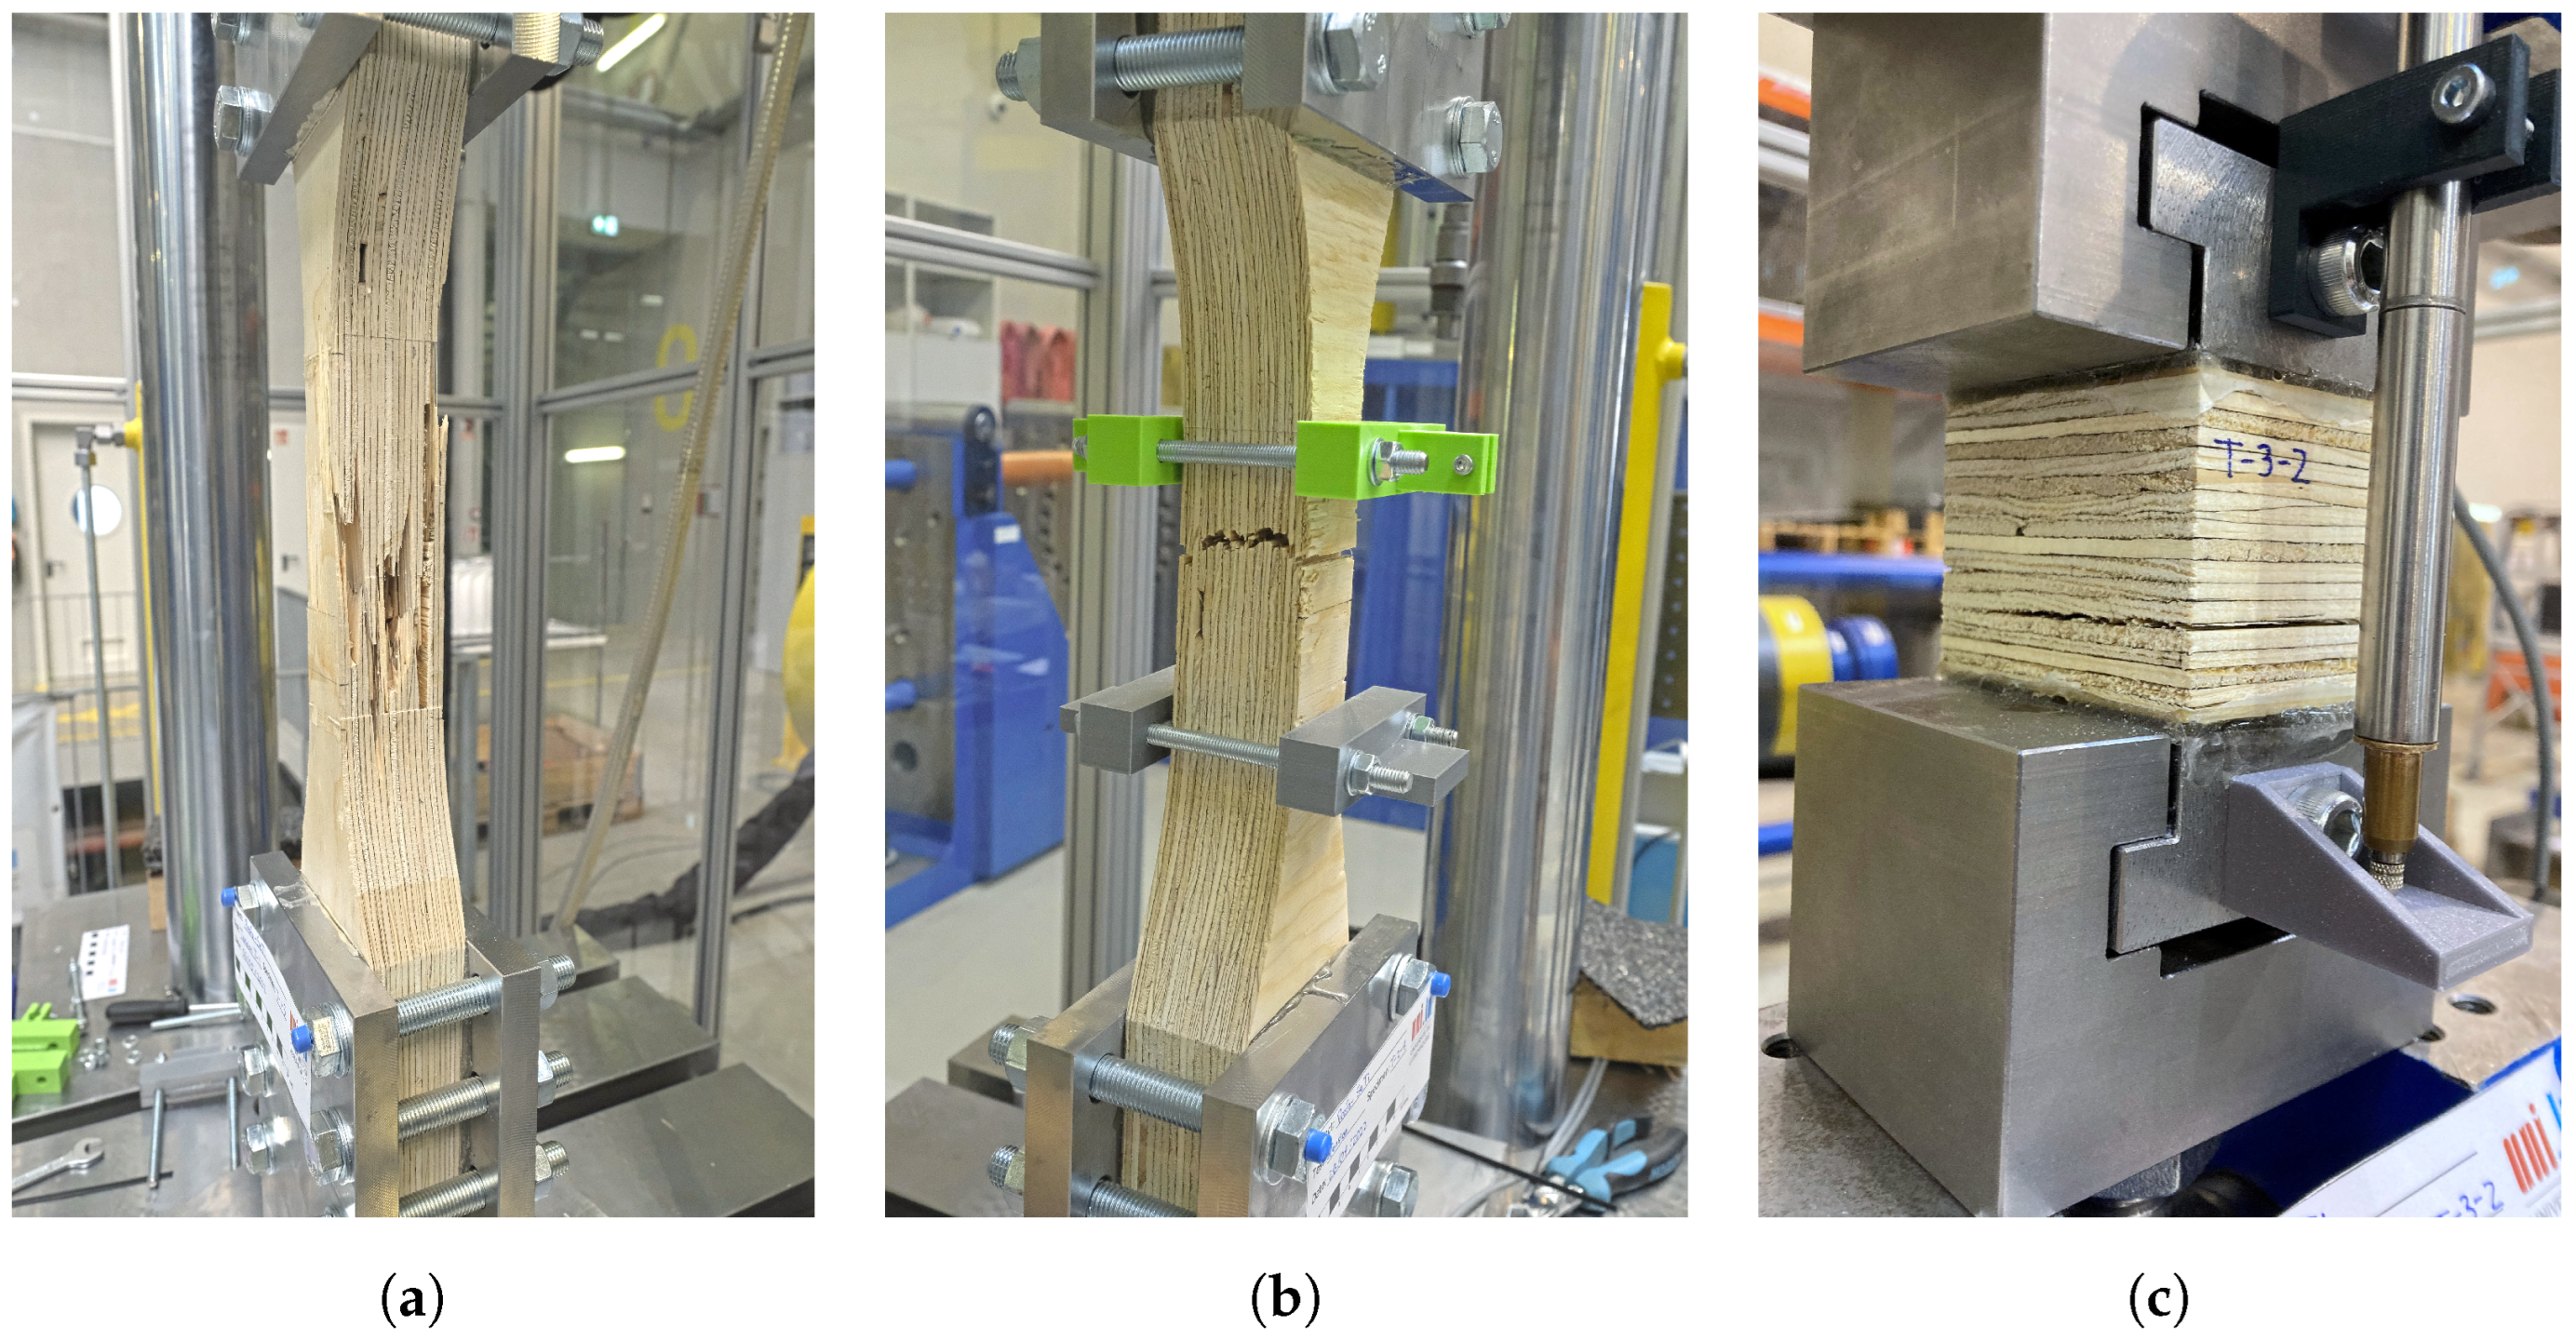
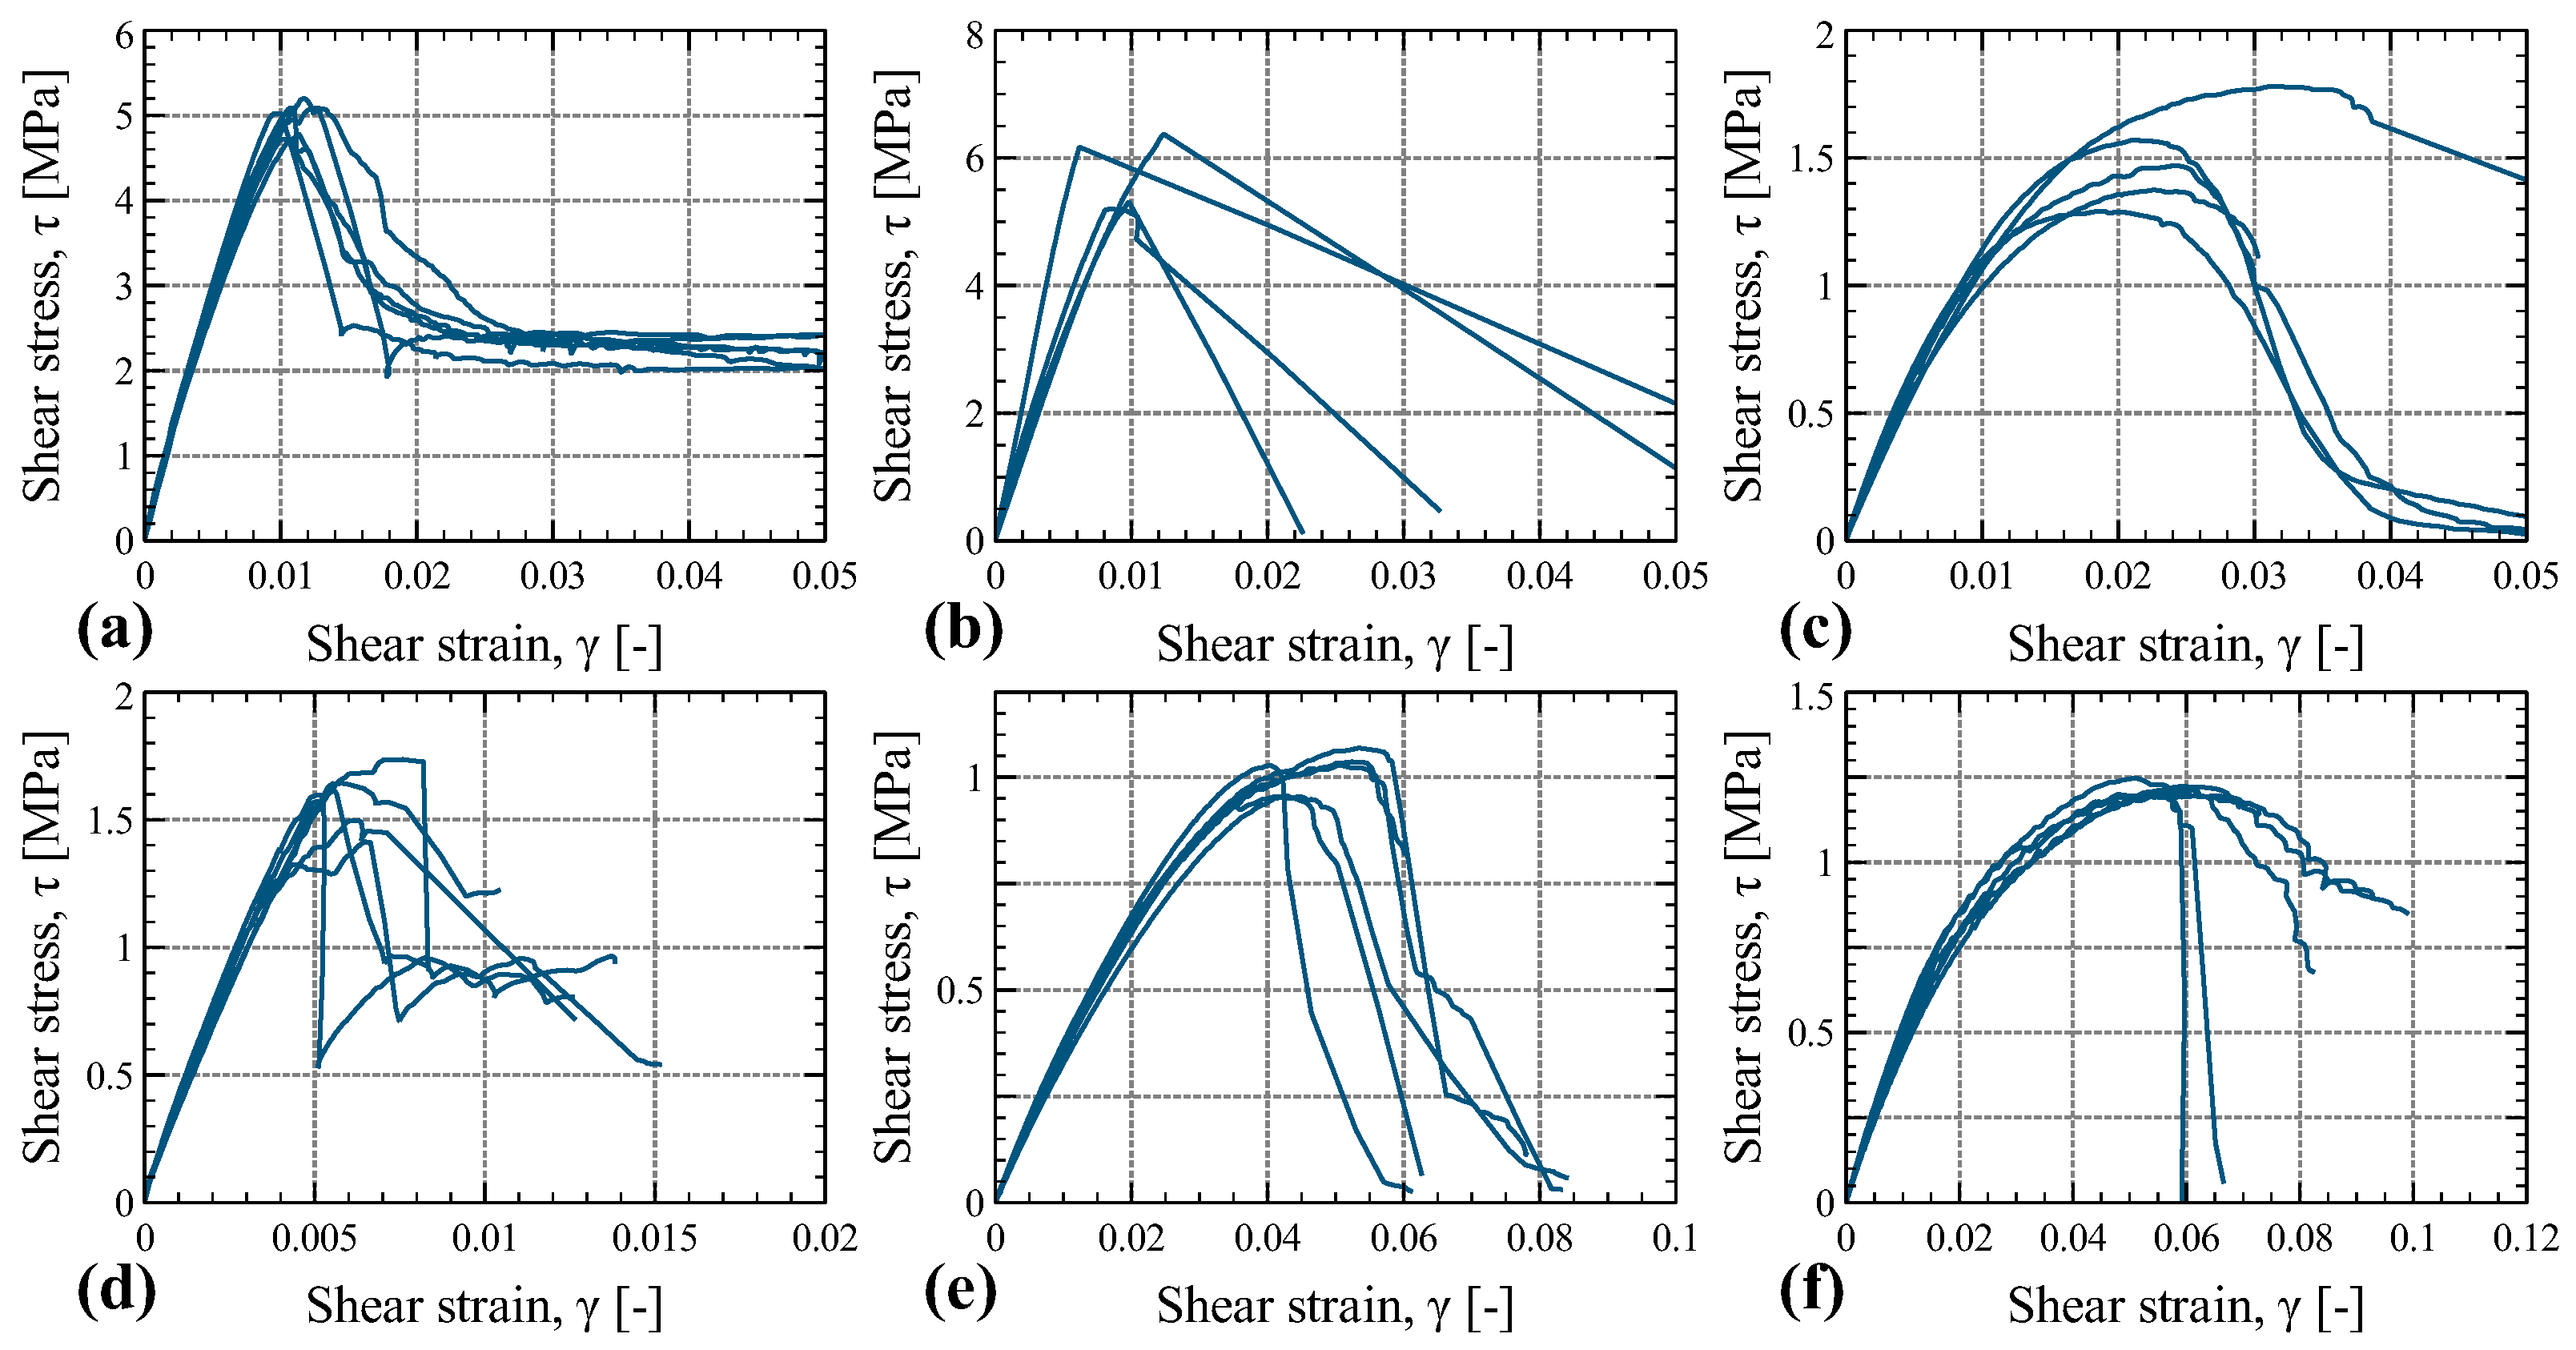
4.3. Shear Tests
4.4. Bending Tests
4.5. Summary of Strength and Stiffness Values
5. Conclusions
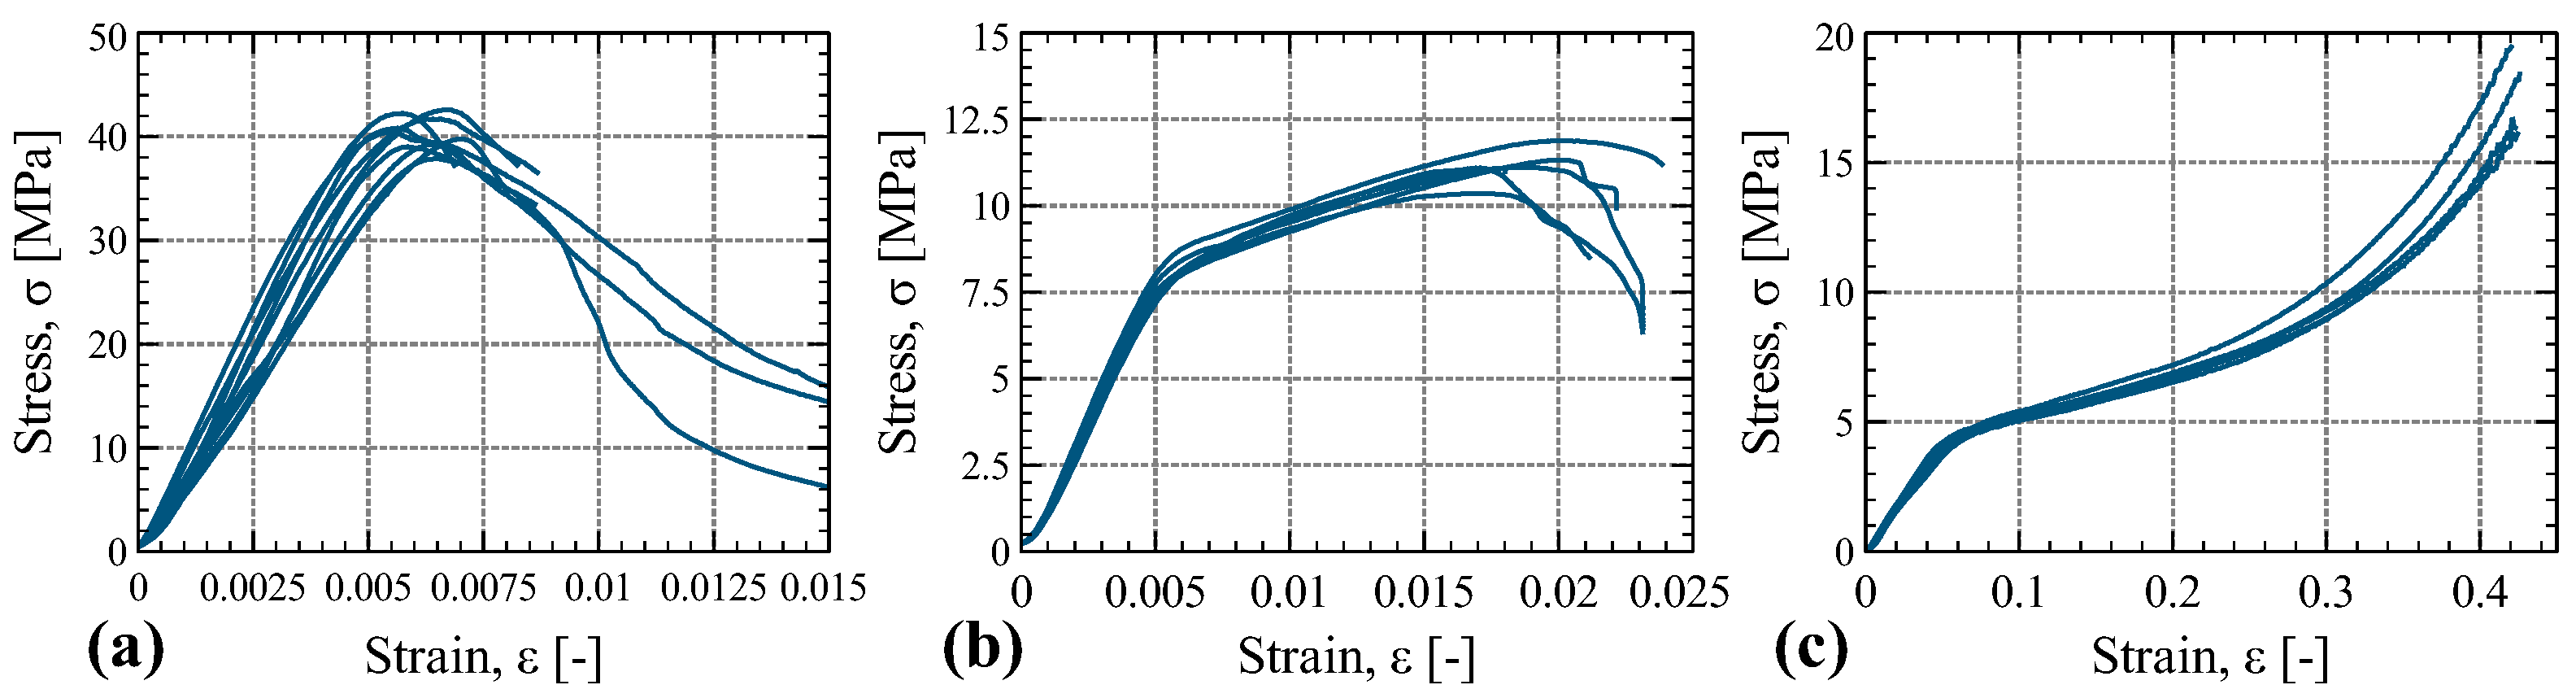
- In compression and tension tests, the longitudinal direction exhibits the highest strength and stiffness, followed by the tangential and radial directions.
- Stress–strain responses in compression differ among the three directions, with the longitudinal direction showing softening after reaching the peak, the tangential direction exhibiting hardening after the proportional limit, and the radial direction demonstrating significant deformation capacity and a hardening branch after the proportional limit.
- Tension tests shows a sharp transition in which the load starts to decrease, which happens when the fibers in the matrix of the specimen fail in tension; however, the failure in some cases is not sudden as the failure is not localized at a specific section but rather in an irregular pattern, and friction remains within the fractured veneers.
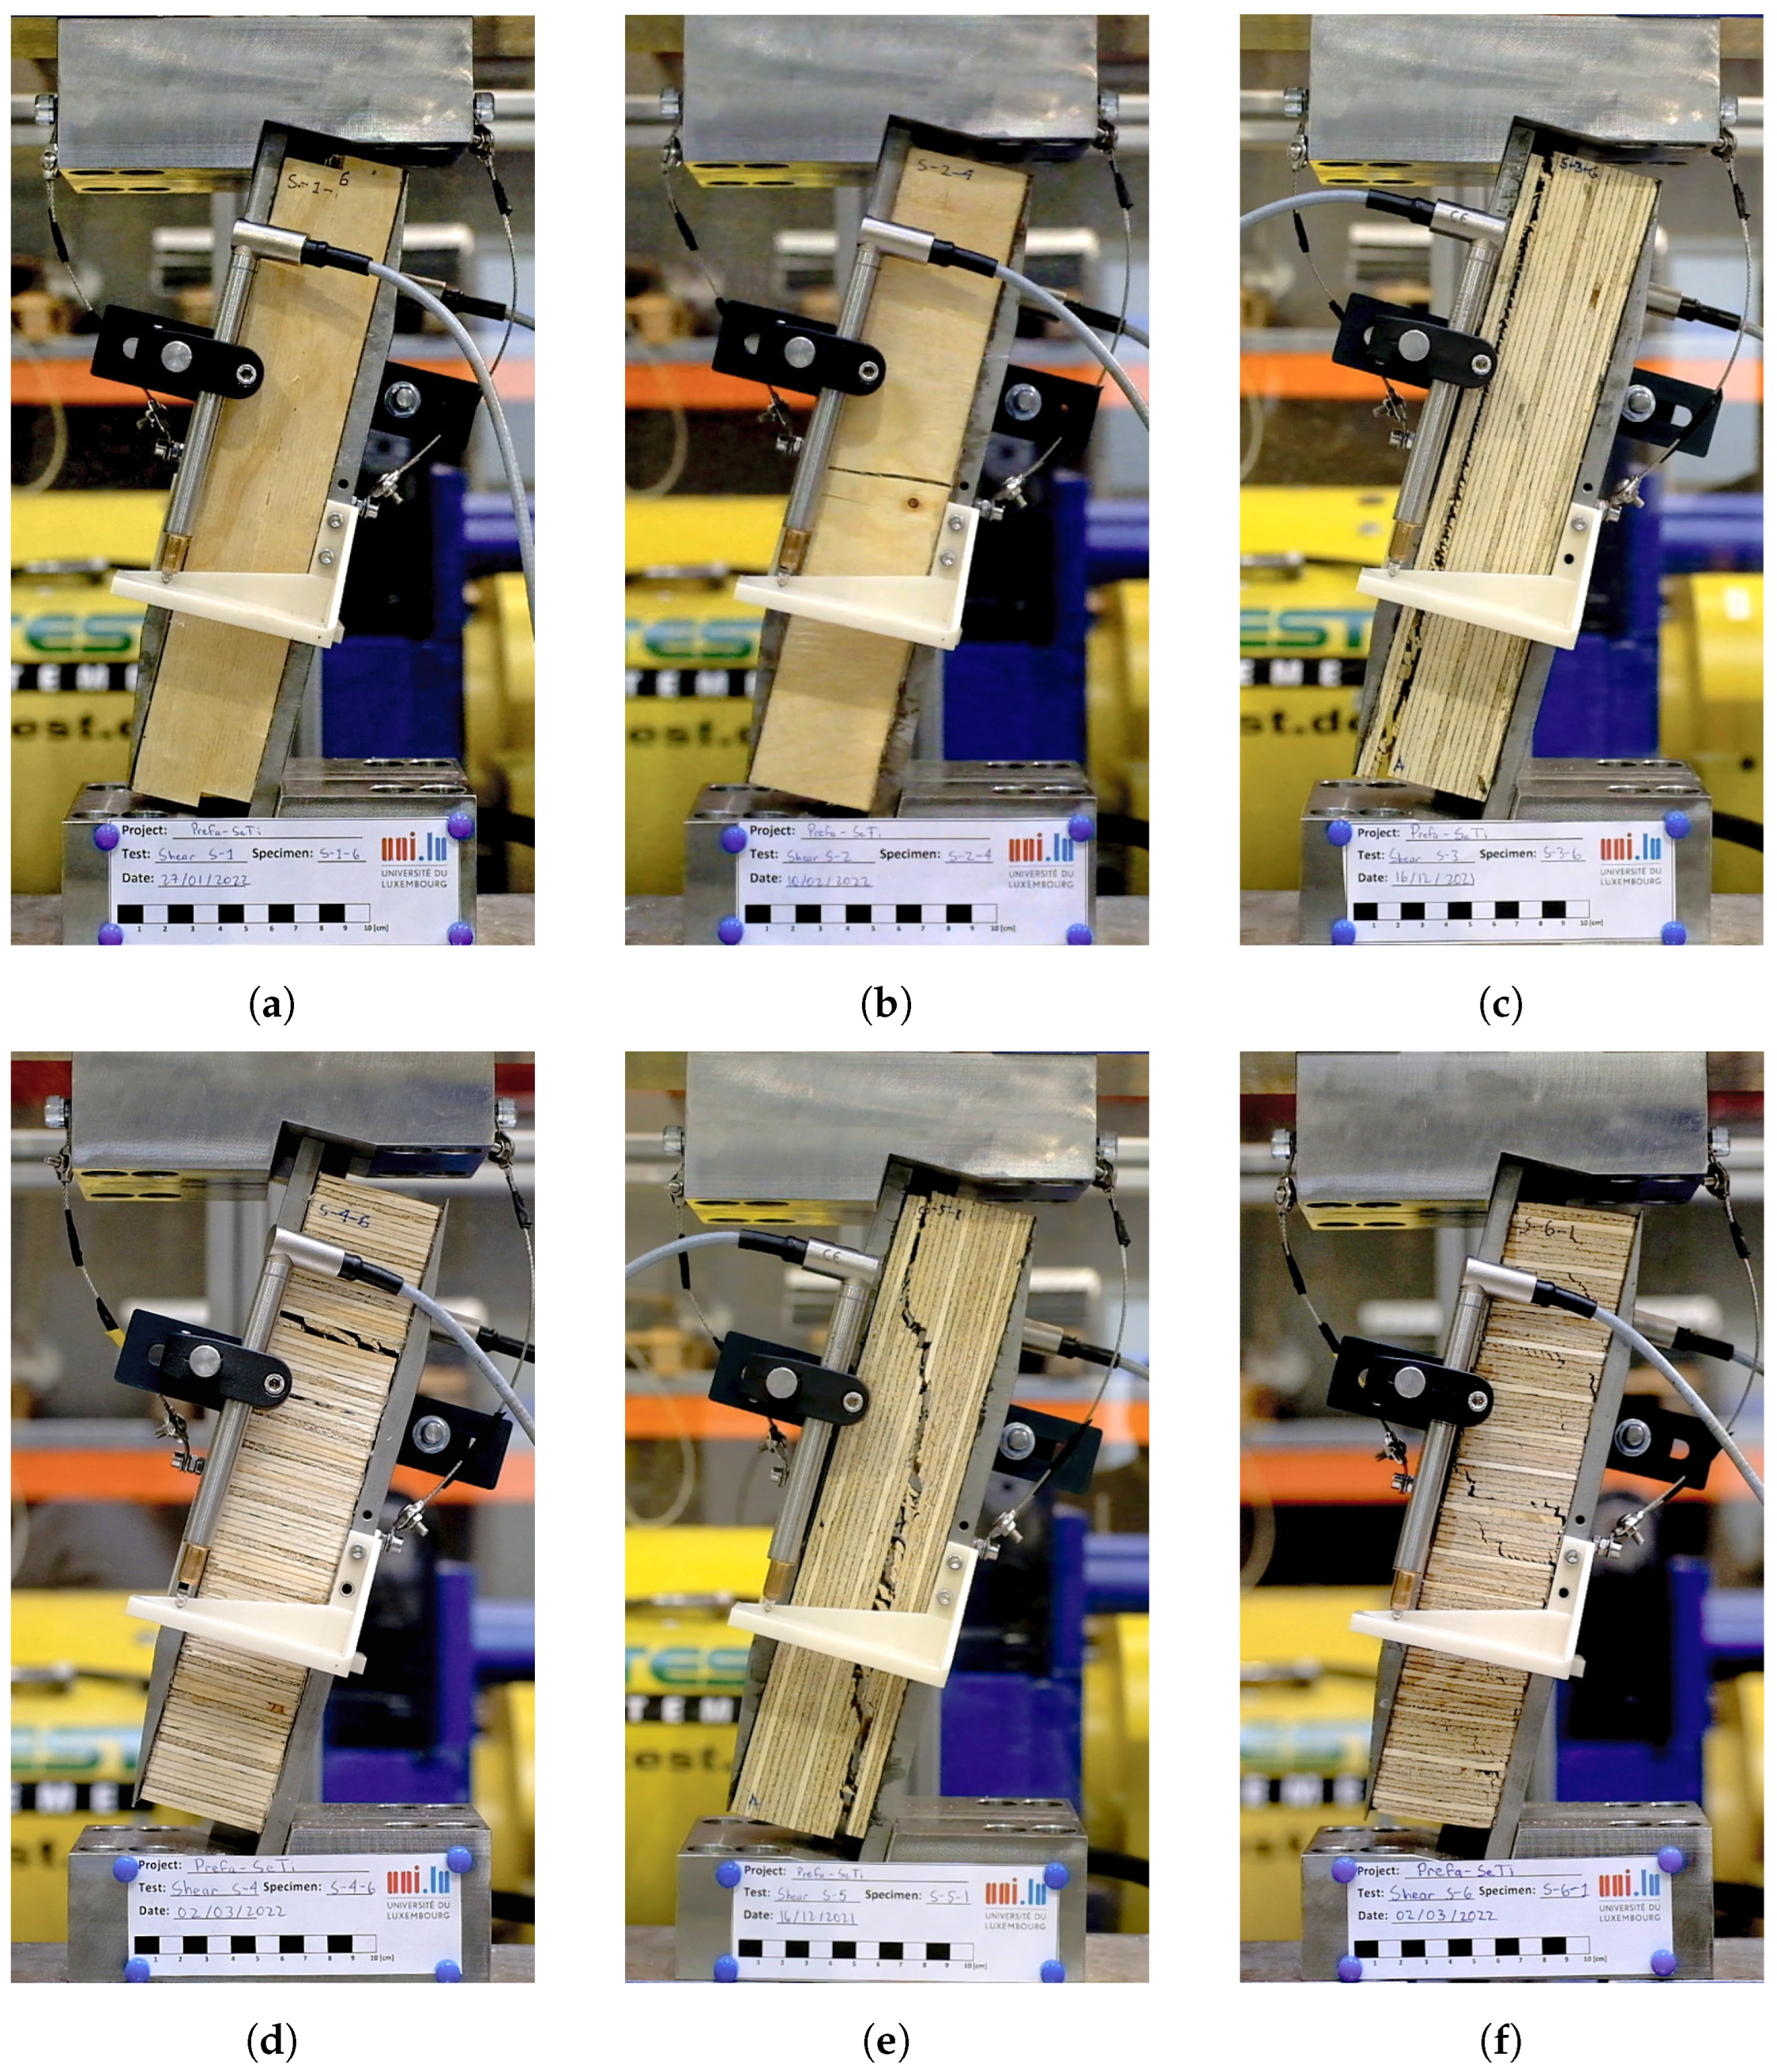
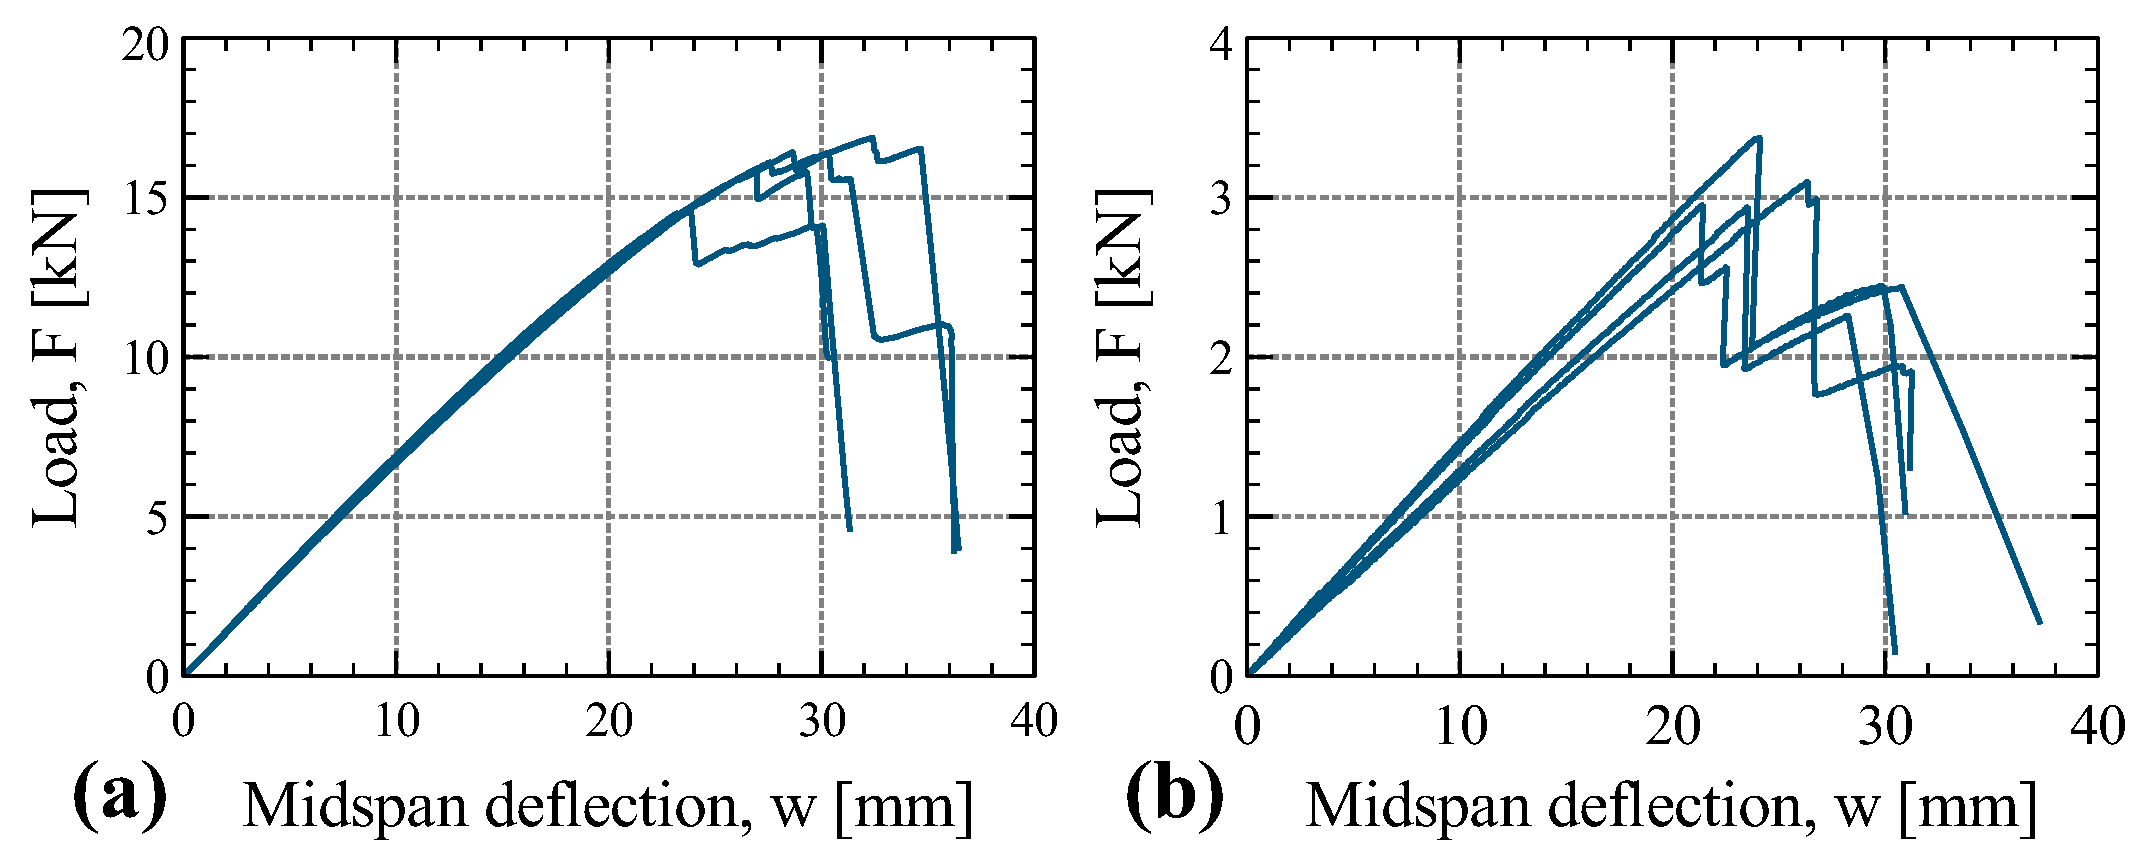
- Shear tests S-3 to S-6 exhibit a near-brittle post-peak response, marked by sudden load drops after reaching the peak. In contrast, shear tests S-1 and S-2 show a post-peak behavior with a gradual load decrease due to ongoing inter-layer friction.
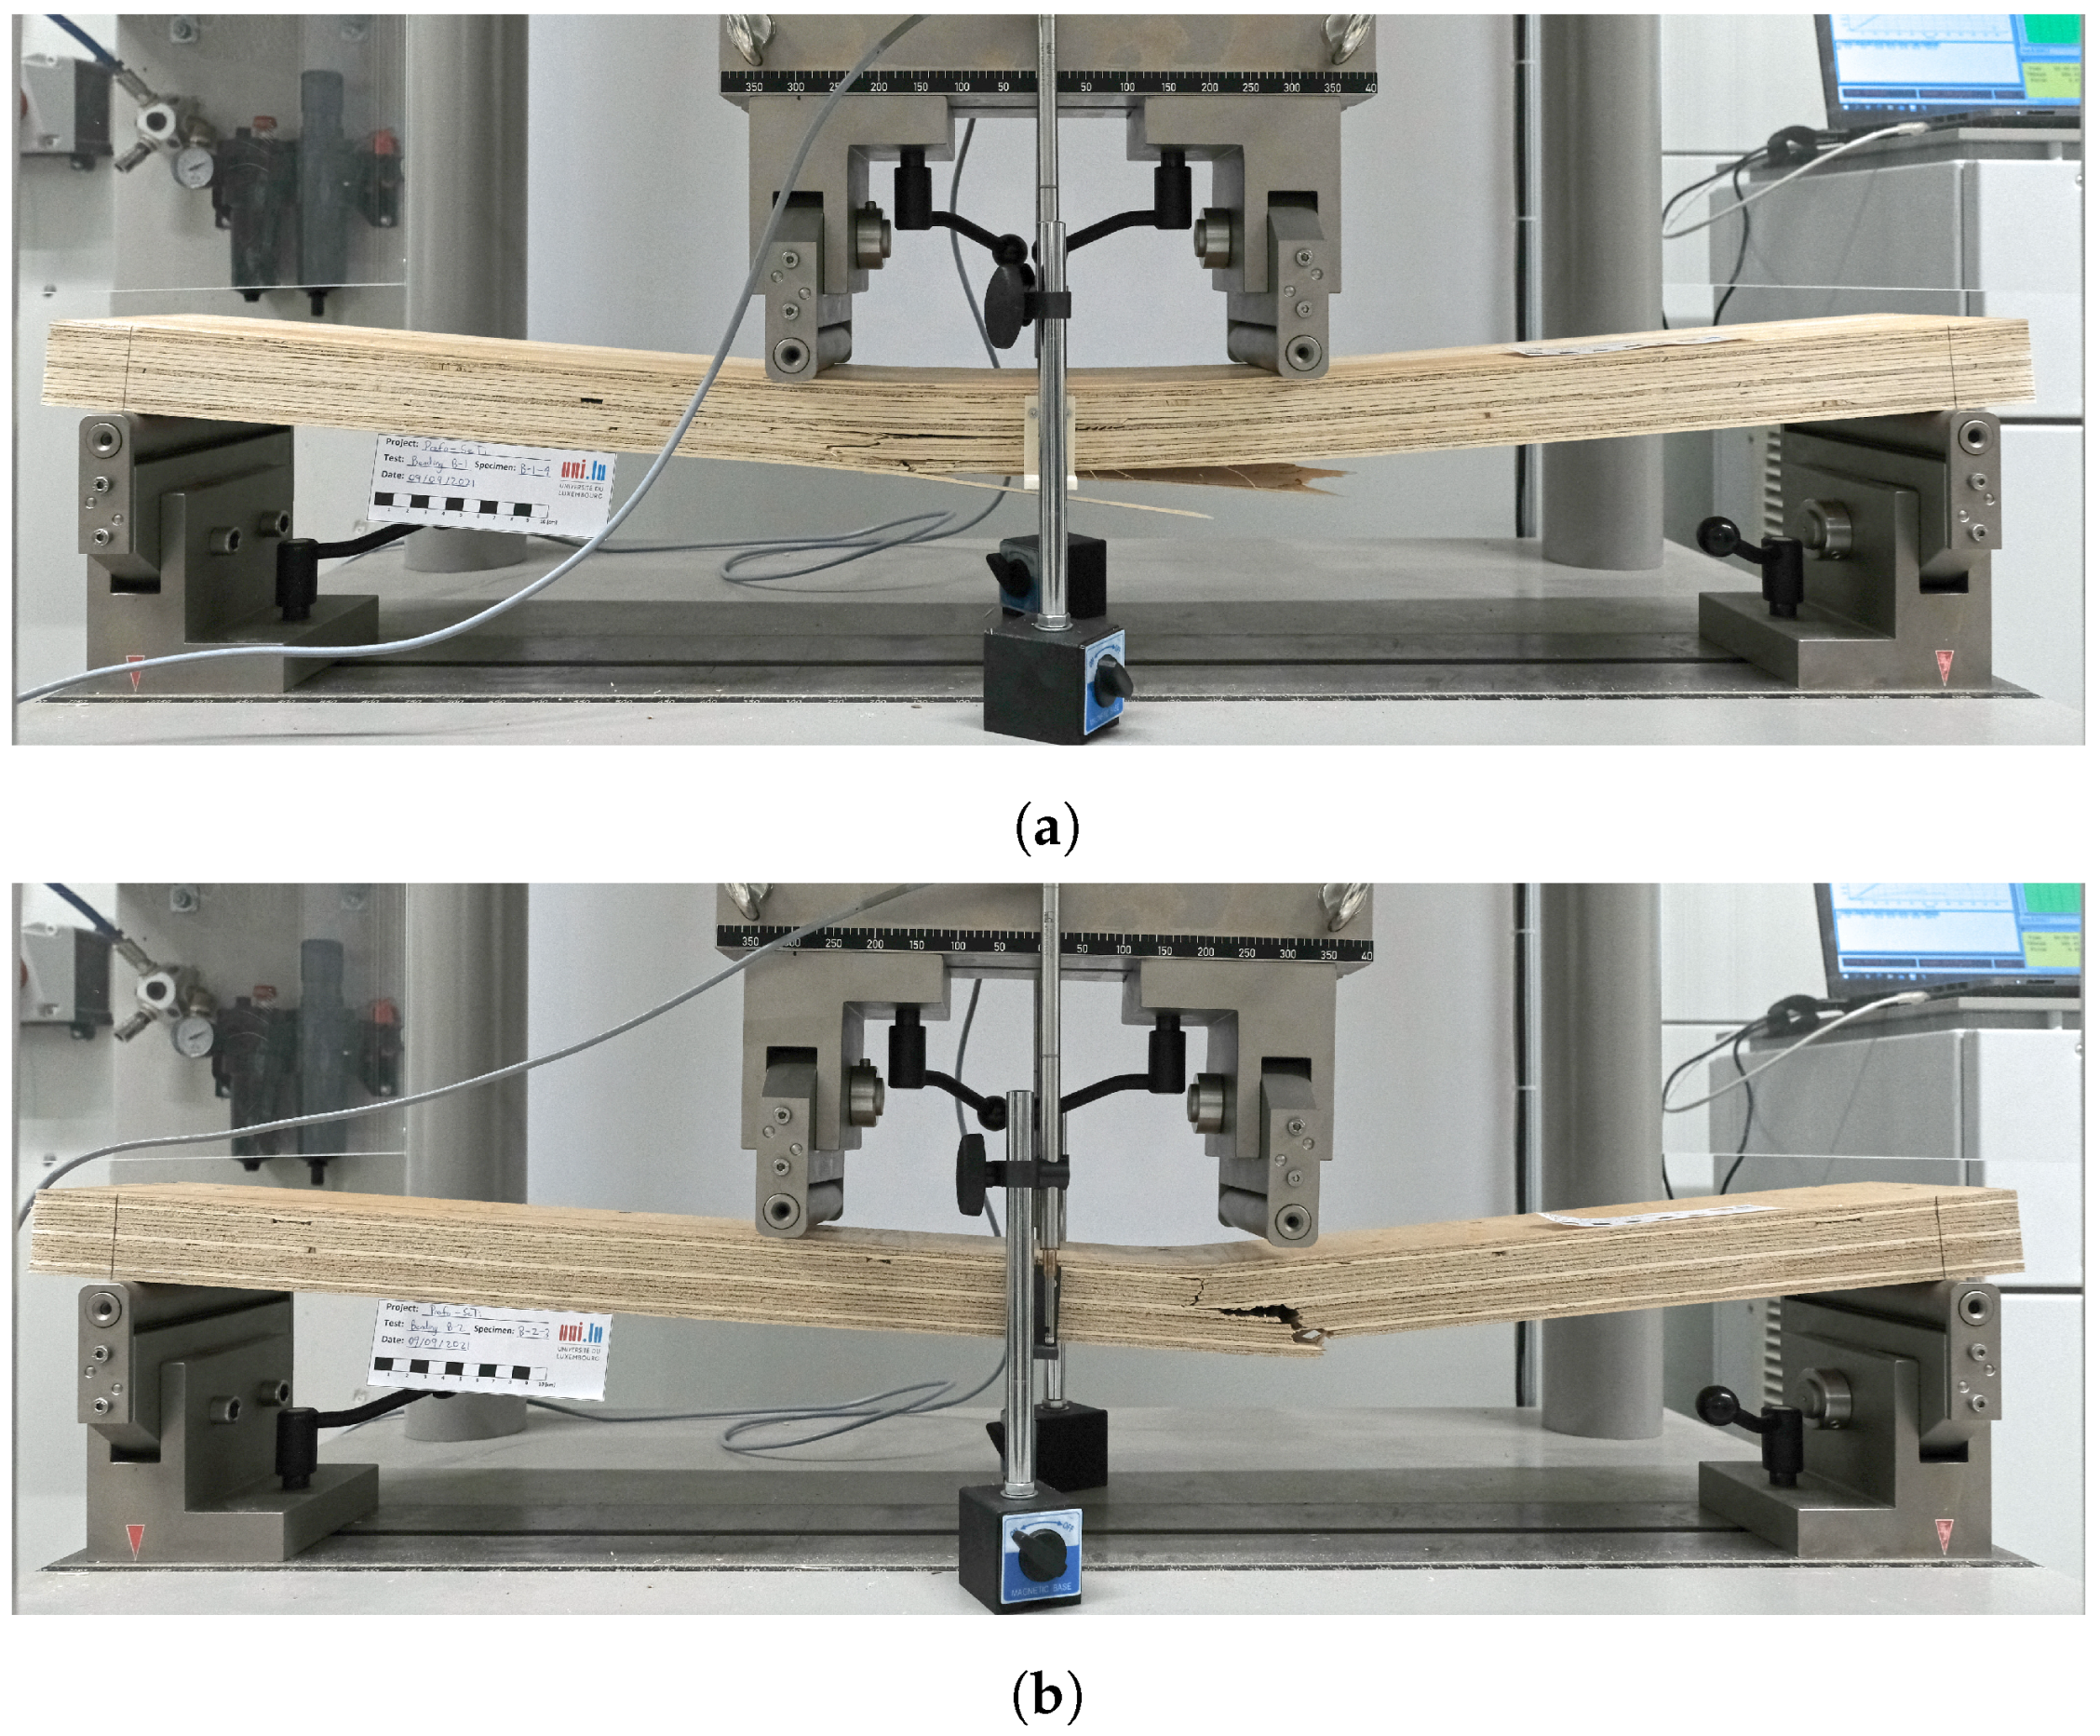
- Bending tests reveal that failure occurs at the soffit. Gradual failure on a layer-by-layer basis is observed, with load drops occurring when the most stressed layers of the soffit fail. Ultimately, a final sudden load drop is associated with the fracture of the matrix.
Author Contributions
Funding
Institutional Review Board Statement
Informed Consent Statement
Data Availability Statement
Acknowledgments
Conflicts of Interest
Appendix A. Calculation Procedures of Strength and Stiffness Properties
Appendix A.1. Compression and Tension Tests
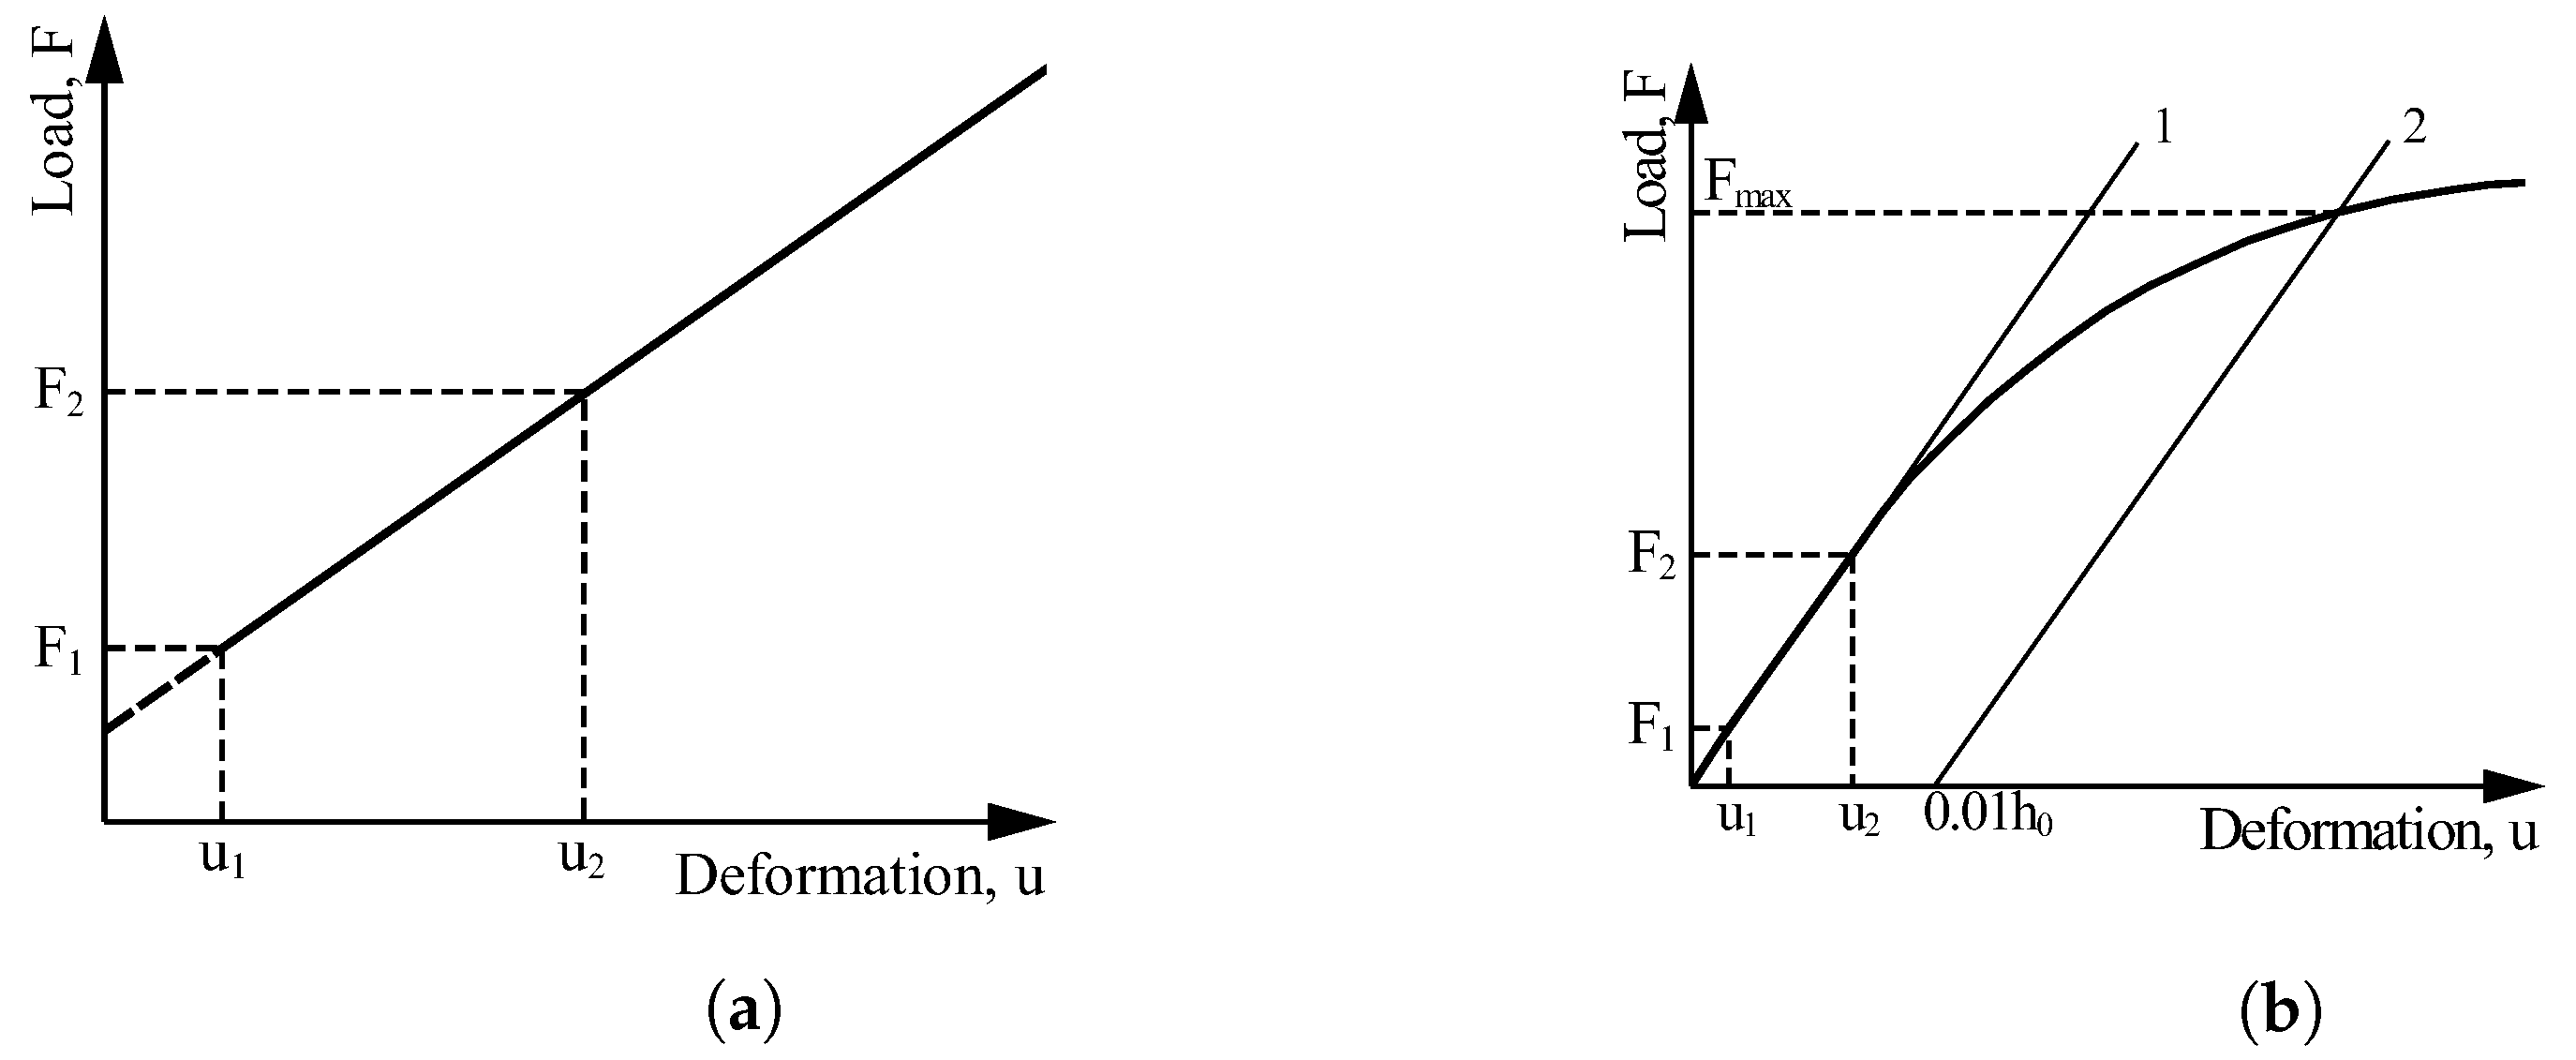
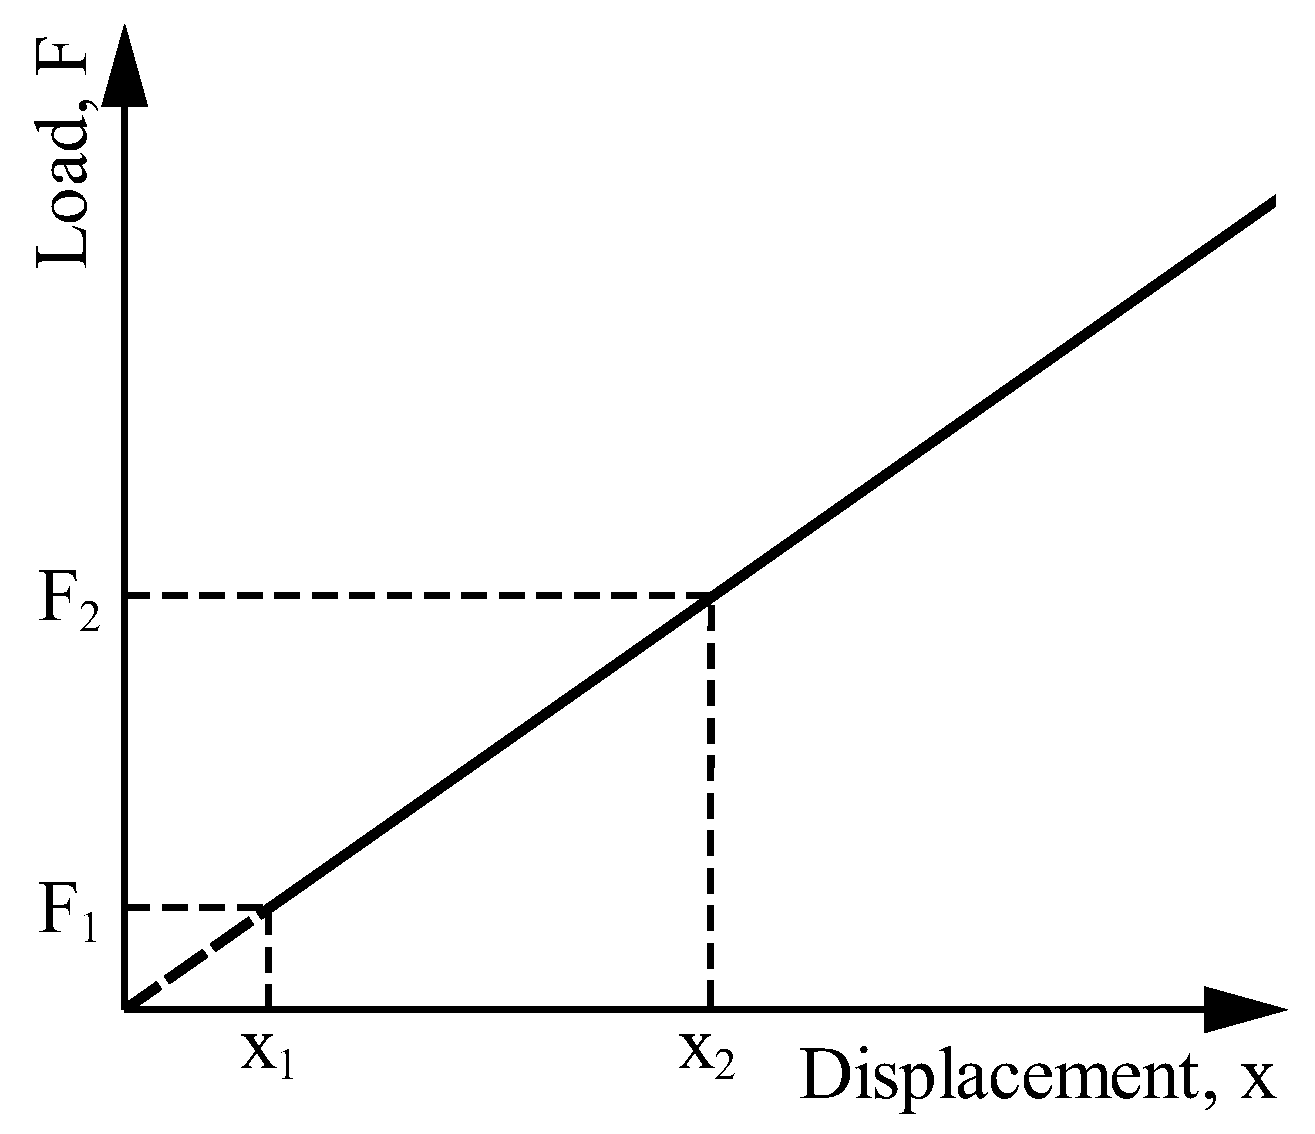
- 1.
- Using the test results, plot the load–deformation curve in the form shown in Figure A1b.
- 2.
- Calculate () and () and determine where these values intersect the load–deformation curve.
- 3.
- Through these two points, draw the straight line 1 as shown in Figure A1b.
- 4.
- Parallel to line 1, draw line 2 having its origin at load and at a distance from it equivalent to a deformation of as shown in Figure A1b, where is the initial height of the specimen.
- 5.
- Where line 2 intersects the curve of the test results is . If the value of as determined is within 5% of the initially value estimated in step 2, then that value may be used to determine the compressive strength; otherwise, repeat the procedure until a value of within that tolerance is obtained.

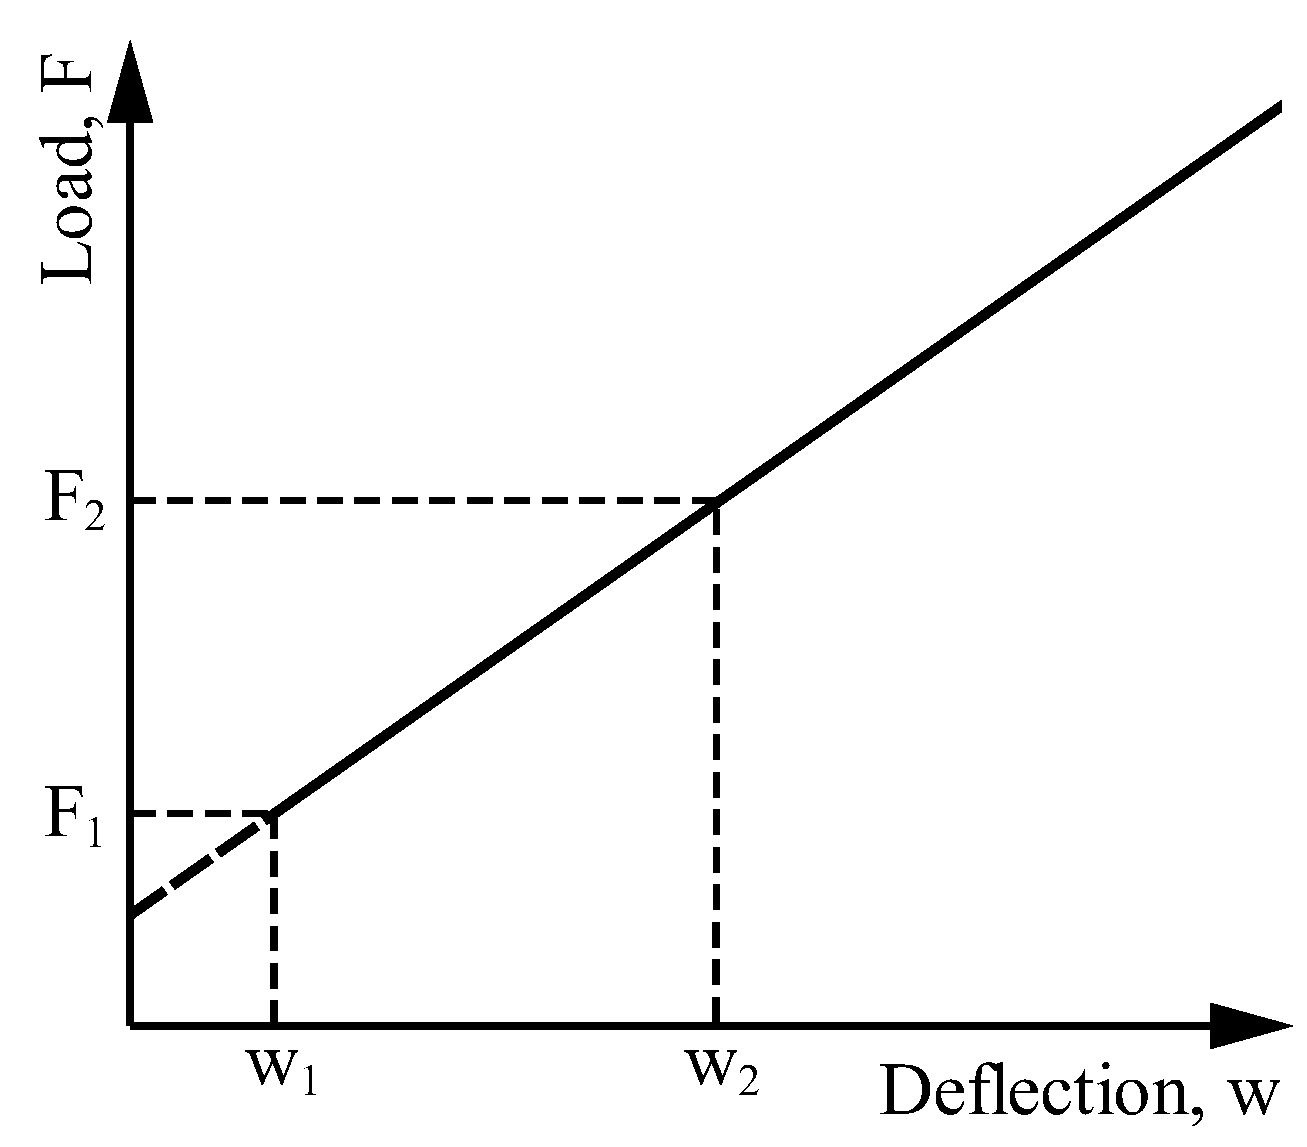
Appendix A.2. Shear Tests

Appendix A.3. Bending Tests

References
- OECD. Global Material Resources Outlook to 2060: Economic Drivers and Environmental Consequences; OECD Publishing: Paris, France, 2019. [Google Scholar] [CrossRef]
- D’Amico, B.; Pomponi, F.; Hart, J. Global potential for material substitution in building construction: The case of cross laminated timber. J. Clean. Prod. 2021, 279, 123487. [Google Scholar] [CrossRef]
- Kuzmanovska, I.; Gasparri, E.; Tapias Monné, D.; Aitchison, M. Tall Timber Buildings: Emerging trends and typologies. In Proceedings of the 2018 World Conference on Timber Engineering, Seoul, Republic of Korea, 20–23 August 2018. [Google Scholar]
- Chiniforush, A.A.; Akbarnezhad, A.; Valipour, H.; Xiao, J. Energy implications of using steel-timber composite (STC) elements in buildings. Energy Build. 2018, 176, 203–215. [Google Scholar] [CrossRef]
- Hassan, O.A.; Öberg, F.; Gezelius, E. Cross-laminated timber flooring and concrete slab flooring: A comparative study of structural design, economic and environmental consequences. J. Build. Eng. 2019, 26, 100881. [Google Scholar] [CrossRef]
- Finnish Woodworking Industries. LVL Handbook; Federation of the Finish Woodworking Industries: Helsinki, Finland, 2019. [Google Scholar]
- Hassanieh, A.; Valipour, H.; Bradford, M. Experimental and numerical study of steel-timber composite (STC) beams. J. Constr. Steel Res. 2016, 122, 367–378. [Google Scholar] [CrossRef]
- Romero, A.; Yang, J.; Hanus, F.; Odenbreit, C. Numerical Investigation of Steel-LVL Timber Composite Beams. ce/Papers 2022, 5, 21–30. [Google Scholar] [CrossRef]
- Romero, A.; Yang, J.; Odenbreit, C. Bending resistance of steel-timber composite (STC) beams: Analytical vs. numerical investigations. ce/Papers 2023, 6, 59–64. [Google Scholar] [CrossRef]
- Chybinski, M.; Polus, L. Experimental and numerical investigations of laminated veneer lumber panels. Arch. Civ. Eng. 2021, 67, 351–372. [Google Scholar] [CrossRef]
- Van Beerschoten, W.A. Structural Performance of Post-Tensioned Timber Frames under Gravity Loading. Ph.D. Thesis, University of Canterbury, Canterbury, New Zealand, 2013. [Google Scholar]
- Ardalany, M.; Deam, B.; Fragiacomo, M. Experimental results of fracture energy and fracture toughness of Radiata Pine laminated veneer lumber (LVL) in mode I (opening). Mater. Struct. 2012, 45, 1189–1205. [Google Scholar] [CrossRef]
- Ardalany, M.; Deam, B.; Fragiacomo, M.; Crews, K. Tension perpendicular to grain strength of wood, Laminated Veneer Lumber (LVL) and Cross-Banded LVL (LVL-C). In Incorporating Sustainable Practice in Mechanics and Structures of Materials; CRC Press: London, UK, 2010. [Google Scholar] [CrossRef]
- Franke, B.; Quenneville, P. Analysis of the fracture behavior of Radiata Pine timber and Laminated Veneer Lumber. Eng. Fract. Mech. 2014, 116, 1–12. [Google Scholar] [CrossRef]
- Bal, B.C. Some physical and mechanical properties of reinforced laminated veneer lumber. Constr. Build. Mater. 2014, 68, 120–126. [Google Scholar] [CrossRef]
- Sokolović, N.M.; Gavrilović-Grmuša, I.; Zdravković, V.; Ivanović-Šekularac, J.; Pavićević, D.; Šekularac, N. Flexural Properties in Edgewise Bending of LVL Reinforced with Woven Carbon Fibers. Materials 2023, 16, 3346. [Google Scholar] [CrossRef] [PubMed]
- Bakalarz, M.M.; Kossakowski, P.G. Strengthening of Full-Scale Laminated Veneer Lumber Beams with CFRP Sheets. Materials 2022, 15, 6526. [Google Scholar] [CrossRef] [PubMed]
- EN 408:2010; Timbe Structures—Structural Timber and Glued Laminated Timber—Determination of Some Physical and Mechanical Properties. CEN: Brussels, Belgium, 2012.
- EN 789; Timber Structures—Test Methods—Determination of Mechanical Properties of Wood Based Panels. CEN: Brussels, Belgium, 2014.
- EN 14358; Timber Structures—Calculation and Verification of Characteristic Values. CEN: Brussels, Belgium, 2015.


| Strength Property | Notation | From Figure 3 | Strength [MPa] | ||
|---|---|---|---|---|---|
| Mean * | 5th P * | CV * [%] | |||
| Compression strength parallel to the grain, edgewise (in the longitudinal direction) | A | 40.41 | 36.11 | 3.91 | |
| Compression strength perpendicular to the grain, edgewise (in the tangential direction) | B | 11.14 | 9.83 | 4.44 | |
| Compression strength perpendicular to the grain, flatwise (in the radial direction) | C | 3.99 | 2.99 | 10.64 | |
| Tension strength parallel to the grain, edgewise (in the longitudinal direction) | D | 37.76 | 34.10 | 4.11 | |
| Tension strength perpendicular to the grain, edgewise (in the tangential direction) | E | 8.33 | 5.47 | 17.68 | |
| Tension strength perpendicular to the grain, flatwise (in the radial direction) | F | 0.56 | 0.31 | 23.04 | |
| Shear in the LR-plane with force in the longitudinal direction (edgewise shear parallel to the grain) | G | 4.98 | 4.40 | 3.79 | |
| Shear in the LT-plane with force in the longitudinal direction (flatwise shear parallel to the grain) | H | 1.50 | 1.03 | 12.69 | |
| Shear in the TL-plane with force in the tangential direction (flatwise shear perpendicular to the grain) | I | 1.01 | 0.89 | 4.57 | |
| Shear in the TR-plane with force in the tangential direction (edgewise shear perpendicular to the grain) | J | 5.76 | 4.16 | 10.28 | |
| Shear in the RT-plane with force in the radial direction (edgewise shear perpendicular to the grain) | K | 1.58 | 1.32 | 7.17 | |
| Shear in the RL-plane with force in the radial direction (edgewise shear perpendicular to the grain) | L | 1.21 | 1.07 | 1.51 | |
| Bending parallel to the grain in the longitudinal direction (flatwise bending parallel to the grain) | M | 49.01 | 40.82 | 6.16 | |
| Bending perpendicular to the grain in the tangential direction (flatwise bending perpendicular to the grain) | N | 9.51 | 7.83 | 6.53 | |
| Stiffness Property | Notation | From Figure 3 | Stiffness [MPa] | ||
|---|---|---|---|---|---|
| Mean * | 5th P * | CV * [%] | |||
| MoE in compression parallel to the grain, edgewise (in the longitudinal direction) | A | 7 917.08 | 7 626.51 | 17.29 | |
| MoE in compression perpendicular to the grain, edgewise (in the tangential direction) | B | 1 764.47 | 1 737.85 | 4.44 | |
| MoE in compression perpendicular to the grain, flatwise (in the radial direction) | C | 95.49 | 93.83 | 5.74 | |
| MoE in tension parallel to the grain, edgewise (in the longitudinal direction) | D | 10 680.01 | 10 174.84 | 15.67 | |
| MoE in tension perpendicular to the grain, edgewise (in the tangential direction) | E | 2 199.90 | 2 140.77 | 8.91 | |
| MoE in tension perpendicular to the grain, flatwise (in the radial direction) | F | 92.05 | 84.30 | 27.88 | |
| Shear modulus in the LR-plane with force in the longitudinal direction (edgewise shear parallel to the grain) | G | 582.82 | 573.59 | 5.25 | |
| Shear modulus in the LT-plane with force in the longitudinal direction (flatwise shear parallel to the grain) | H | 123.26 | 119.48 | 9.23 | |
| Shear modulus in the TL-plane with force in the tangential direction (flatwise shear perpendicular to the grain) | I | 34.27 | 33.75 | 4.86 | |
| Shear modulus in the TR-plane with force in the tangential direction (edgewise shear perpendicular to the grain) | J | 765.22 | 691.18 | 25.87 | |
| Shear modulus in the RT-plane with force in the radial direction (edgewise shear perpendicular to the grain) | K | 342.96 | 336.90 | 5.86 | |
| Shear modulus in the RL-plane with force in the radial direction (edgewise shear perpendicular to the grain) | L | 49.09 | 44.99 | 7.90 | |
| Global MoE in bending parallel to the grain in the longitudinal direction (flatwise bending parallel to the grain) | M | 10 193.74 | 10 003.05 | 1.84 | |
| Global MoE in bending perpendicular to the grain in the tangential direction (flatwise bending perpendicular to the grain) | N | 2 004.94 | 1 944.65 | 8.04 | |
Disclaimer/Publisher’s Note: The statements, opinions and data contained in all publications are solely those of the individual author(s) and contributor(s) and not of MDPI and/or the editor(s). MDPI and/or the editor(s) disclaim responsibility for any injury to people or property resulting from any ideas, methods, instructions or products referred to in the content. |
© 2023 by the authors. Licensee MDPI, Basel, Switzerland. This article is an open access article distributed under the terms and conditions of the Creative Commons Attribution (CC BY) license (https://creativecommons.org/licenses/by/4.0/).
Share and Cite
Romero, A.; Odenbreit, C. Experimental Investigation on Strength and Stiffness Properties of Laminated Veneer Lumber (LVL). Materials 2023, 16, 7194. https://doi.org/10.3390/ma16227194
Romero A, Odenbreit C. Experimental Investigation on Strength and Stiffness Properties of Laminated Veneer Lumber (LVL). Materials. 2023; 16(22):7194. https://doi.org/10.3390/ma16227194
Chicago/Turabian StyleRomero, Alfredo, and Christoph Odenbreit. 2023. "Experimental Investigation on Strength and Stiffness Properties of Laminated Veneer Lumber (LVL)" Materials 16, no. 22: 7194. https://doi.org/10.3390/ma16227194