1. Introduction
With the rapid development of the economy and continuous optimisation of the building structure, the performance requirements of concrete are improving [
1]. Rubber concrete (RC) refers to concrete with rubber particles as concrete components, and the study of rubber aggregate concrete began in the 1990s and has achieved certain results. Xue Gang et al. [
2] studied the effect of rubber powder admixture on the compressive properties of RC, in which 5%, 10%, 15%, and 20% of rubber were admixed into the concrete to make 100 mm × 100 mm × 300 mm prismatic specimens, and it was found that the ductility of RC was greatly enhanced and the energy dissipation was significantly increased compared with that of ordinary concrete. Su-Rong Luo et al. [
3] measured the load–displacement curves and crack opening displacements of three-point bending and tensile specimens and applied the double-K model of fracture mechanics to calculate the fracture energy and fracture toughness, and the results showed that the fracture toughness of RC was significantly improved, and in addition to the rubber particle size and admixture amount, the treatment of the rubber surface would also have an effect on the concrete toughness. Fu Qian et al. [
4] conducted uniaxial compression tests of RC with water–cement ratio, rubber admixture, rubber particle size, and fly ash admixture as the influencing factors and found that the whole damage process of RC was more moderate than that of ordinary concrete. Meanwhile, the strength of the concrete was reduced due to the addition of rubber particles, but the ductility, toughness, and energy dissipation capacity were improved. Mezidi Ama et al. [
5] studied the compressive strength of RC with rubber replacement rates of 1%, 2%, 3%, 4%, and 5% and obtained that the concrete with 3% rubber admixture performed better in terms of compressive strength. Ayman Abdelmonem et al. [
6] conducted an in-depth study on RC slump, compressive strength, tensile strength, and flexural strength using rubber with 0%, 10%, 20%, and 30% partial substitution of fine aggregate volume and obtained that the addition of rubber changed the concrete compatibility, but as the rubber admixture reached 30%, the concrete compressive and tensile strength values of the concrete showed a significant decrease of 50%. According to a large number of scholars at home and abroad on the physical and mechanical properties of RC [
7,
8,
9,
10,
11], found that compared with ordinary concrete, RC has good elasticity, toughness, freeze–thaw resistance, superior deformation properties, and crack resistance; these properties could make up for the poor elastic deformation of ordinary concrete, lack of fatigue resistance, poor impact resistance, and other defects. In addition, RC is used in civil construction because of its superior ductility, toughness, impact resistance, and other properties, and it also has a wide application space in airport runways, impact-resistant guardrails, and some military buildings. At the same time, RC has become one of the most important ways to reuse waste rubber tires, which not only can reduce the environmental pollution problem caused by waste rubber tires but also improve the performance of concrete [
12].
In recent years, expansion agents and retarders have been widely used in various fields of practical engineering. Expansion agents play an important role in both compensating shrinkage and generating self-stress; compensating shrinkage could reduce or even avoid the cracking of concrete due to volume deformation, and adding expansion agents to concrete shows good durability performance [
13]. The retarders could significantly delay the exothermic rate of cement hydration reaction, thus reducing the temperature cracks in concrete due to concentrated exothermic hydration and possibly effectively extending the setting time of concrete and improving the efficiency of concrete use [
14,
15,
16]. Many scholars have conducted a lot of research based on this. Chen Bo et al. [
17] studied the compound effect of an internal curing and expansion agent using the temperature test method and found that the compound effect of an internal curing agent and expansion agent is significant for improving the crack resistance of concrete. Shen Dejian et al. [
18] studied the effect of the MgO compound expansion agent (MCEA) on the early cracking damage behaviour of concrete. Litina Chrysoula et al. [
19] evaluated the effectiveness of the proposed test method applicable to self-healing concrete doped with expansive minerals. Jinjun Guo et al. [
20] investigated the effect of the combined expansive agent (UEA) and MgO expansive agent on the fracture performance of concrete through a three-point bending test. Hao Lei et al. [
21] found that the ability of the expander to enhance the plastic cracking resistance of concrete was related to the water–cement ratio of concrete, and the effect of the expander to enhance the plastic cracking resistance of concrete decreased with the decrease in the water–cement ratio and even had a negative effect. A.W. Otunyo et al. [
22] investigated the application of urea fertiliser (UF) as a slow setting admixture in plain concrete. Sutarto Tommy Ekamitra et al. [
23] experimentally evaluated the performance of sucrose and lignosulfonic acid as concrete retarders and obtained the initial and final setting times of concrete with different admixture doses. In addition, the effect of retarders on the compressive strength of concrete was also explored. Wang Lijiu et al. [
24] used the absolute warming method to determine the exothermic process of the new super retarder on the heat of the hydration of bulk concrete and discussed the hydration kinetics and the effect on early thermal cracking. Xu Changwei et al. [
25] used three retarders, borax, citric acid, and sodium gluconate, to study the effect of different retarders on C50 low-chloride concrete and found that the addition of retarders could effectively reduce the time-loss of concrete, while reducing the early volume deformation of concrete, and had no adverse effect on the later strength.
In order to save time, cost, and improve material performance, researchers have predicted the strength of materials based on different machine learning models; the most commonly used method is the back propagation neural network (BPNN). The most important features of artificial neural networks are collective computing, adaptive, excellent fitting ability to highly nonlinear insinuations, and fault tolerance to sample learning. The network can make full use of state information and train the information from different states one by one to obtain balanced convergence weights, which represent the nonlinear mapping relationship of the network. Therefore, it could well find the intrinsic relationship between influencing factors. Han et al. [
26] used the BPNN to analyse the effect of different admixtures of waste fly ash on the compressive strength of high-performance concrete, and the results showed that the BPNN has high accuracy in predicting the compressive strength of waste fly ash concrete. Du Huanhuan et al. [
27] established a three-dimensional finite element numerical analysis model for the flexural performance of prestressed steel–concrete continuous composite beams and simulated the whole process of the test based on the BPNN. Cao et al. [
28] proposed a fully convolutional neural network to automatically identify and detect cracks by constructing a framework for learning concrete cracks and performing semantic segmentation to achieve crack identification. The method was found to be able to accurately identify crack paths and crack density variations through validation. Liu Zhenhua et al. [
29] proposed a novel method for predicting roadbed settlement by combining fuzzy neural networks and wavelet packet decomposition to establish a settlement prediction model by using the powerful memory of fuzzy neural networks for the temporal and accidental nature of displacement settlement sequences. Sadrmomtazi et al. [
30] compared the accuracy of predicting concrete strength using regression analysis, the neural network model, and fuzzy algorithm, and the results showed that the neural network model has a higher accuracy and generalisation ability.
In summary, there have been a large number of studies on RC, concrete mixed with expanders and retarders, but there are very few studies on the compound effect of adding expanders and retarders to RC, and the prediction of RC using the BPNN is less common in studies on RC. Therefore, this paper investigates the strength of plain concrete, rubber aggregate concrete, rubber aggregate concrete with expander and retarder, and the cracking resistance of plain mortar, rubber aggregate mortar, and rubber aggregate mortar with expander and retarder. Meanwhile, the prediction models of compressive strength, flexural strength, and cracking resistance of rubber aggregate mortar with multiple parameters such as cement, sand, and stone acting simultaneously were established by combining the BPNN approach in order to provide theoretical support for the subsequent research on RC.
5. BPNN Prediction Model
5.1. Modelling
The BPNN is a multilayer perceptron based on error back propagation and usually consist of an input layer, an implicit layer, and an output layer substructure [
35]. In this study, cement, sand, gravel, water, rubber, expander, retarder, and RC compressive strength, flexural strength, and mortar cracking time were selected as input vectors and test values to establish an RC strength prediction model based on the BPNN.
MATLAB is a language software based on network theory, and its main function is to deal with problems between data computation and computer simulation, where the neural network toolbox is a typical network tool function. It is extremely easy and fast to build neural networks using MATLAB [
36]. The BPNN prediction model was established in this study with the help of the neural network toolbox provided by MATLABR2018b, and the establishment process is as follows:
- (1)
Identify the input, implicit, and output layers.
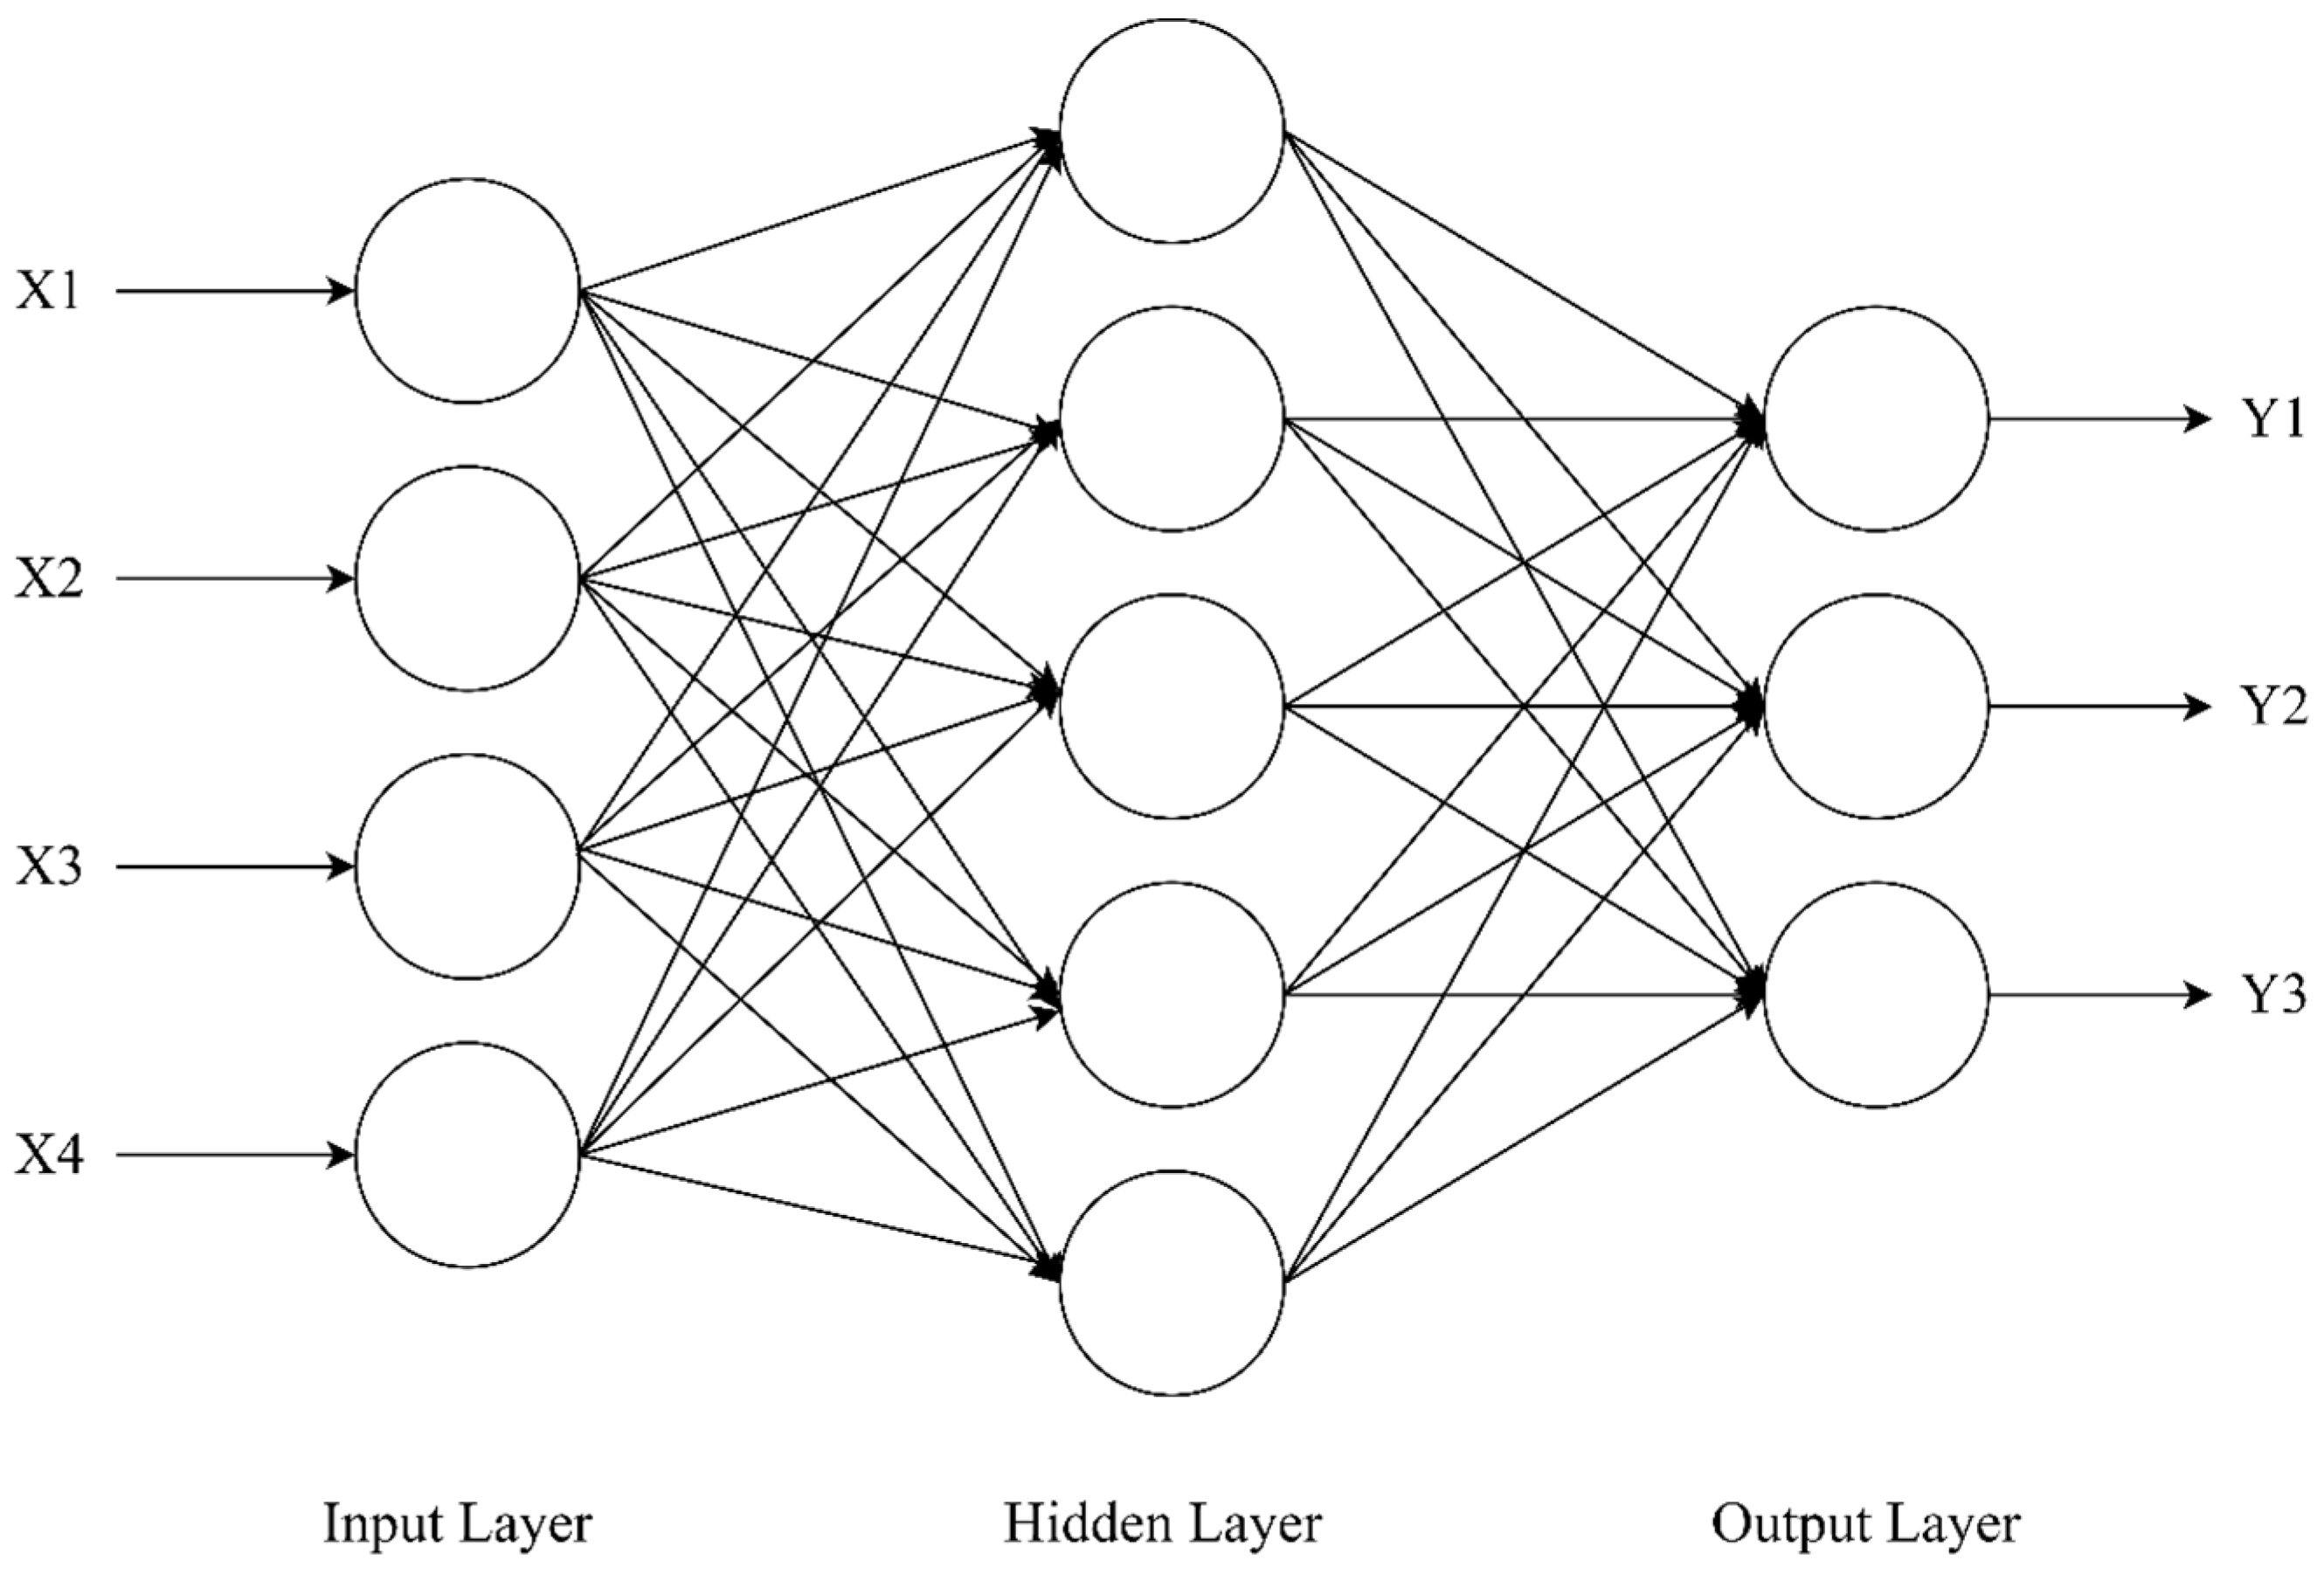
The typical structural composition of the BPNN consists of three layers: the input layer, the hidden layer, and the output layer. The structure is shown in
Figure 5.
The input vectors were fed through the input layer and then processed by the implicit layer and passed out through the output layer [
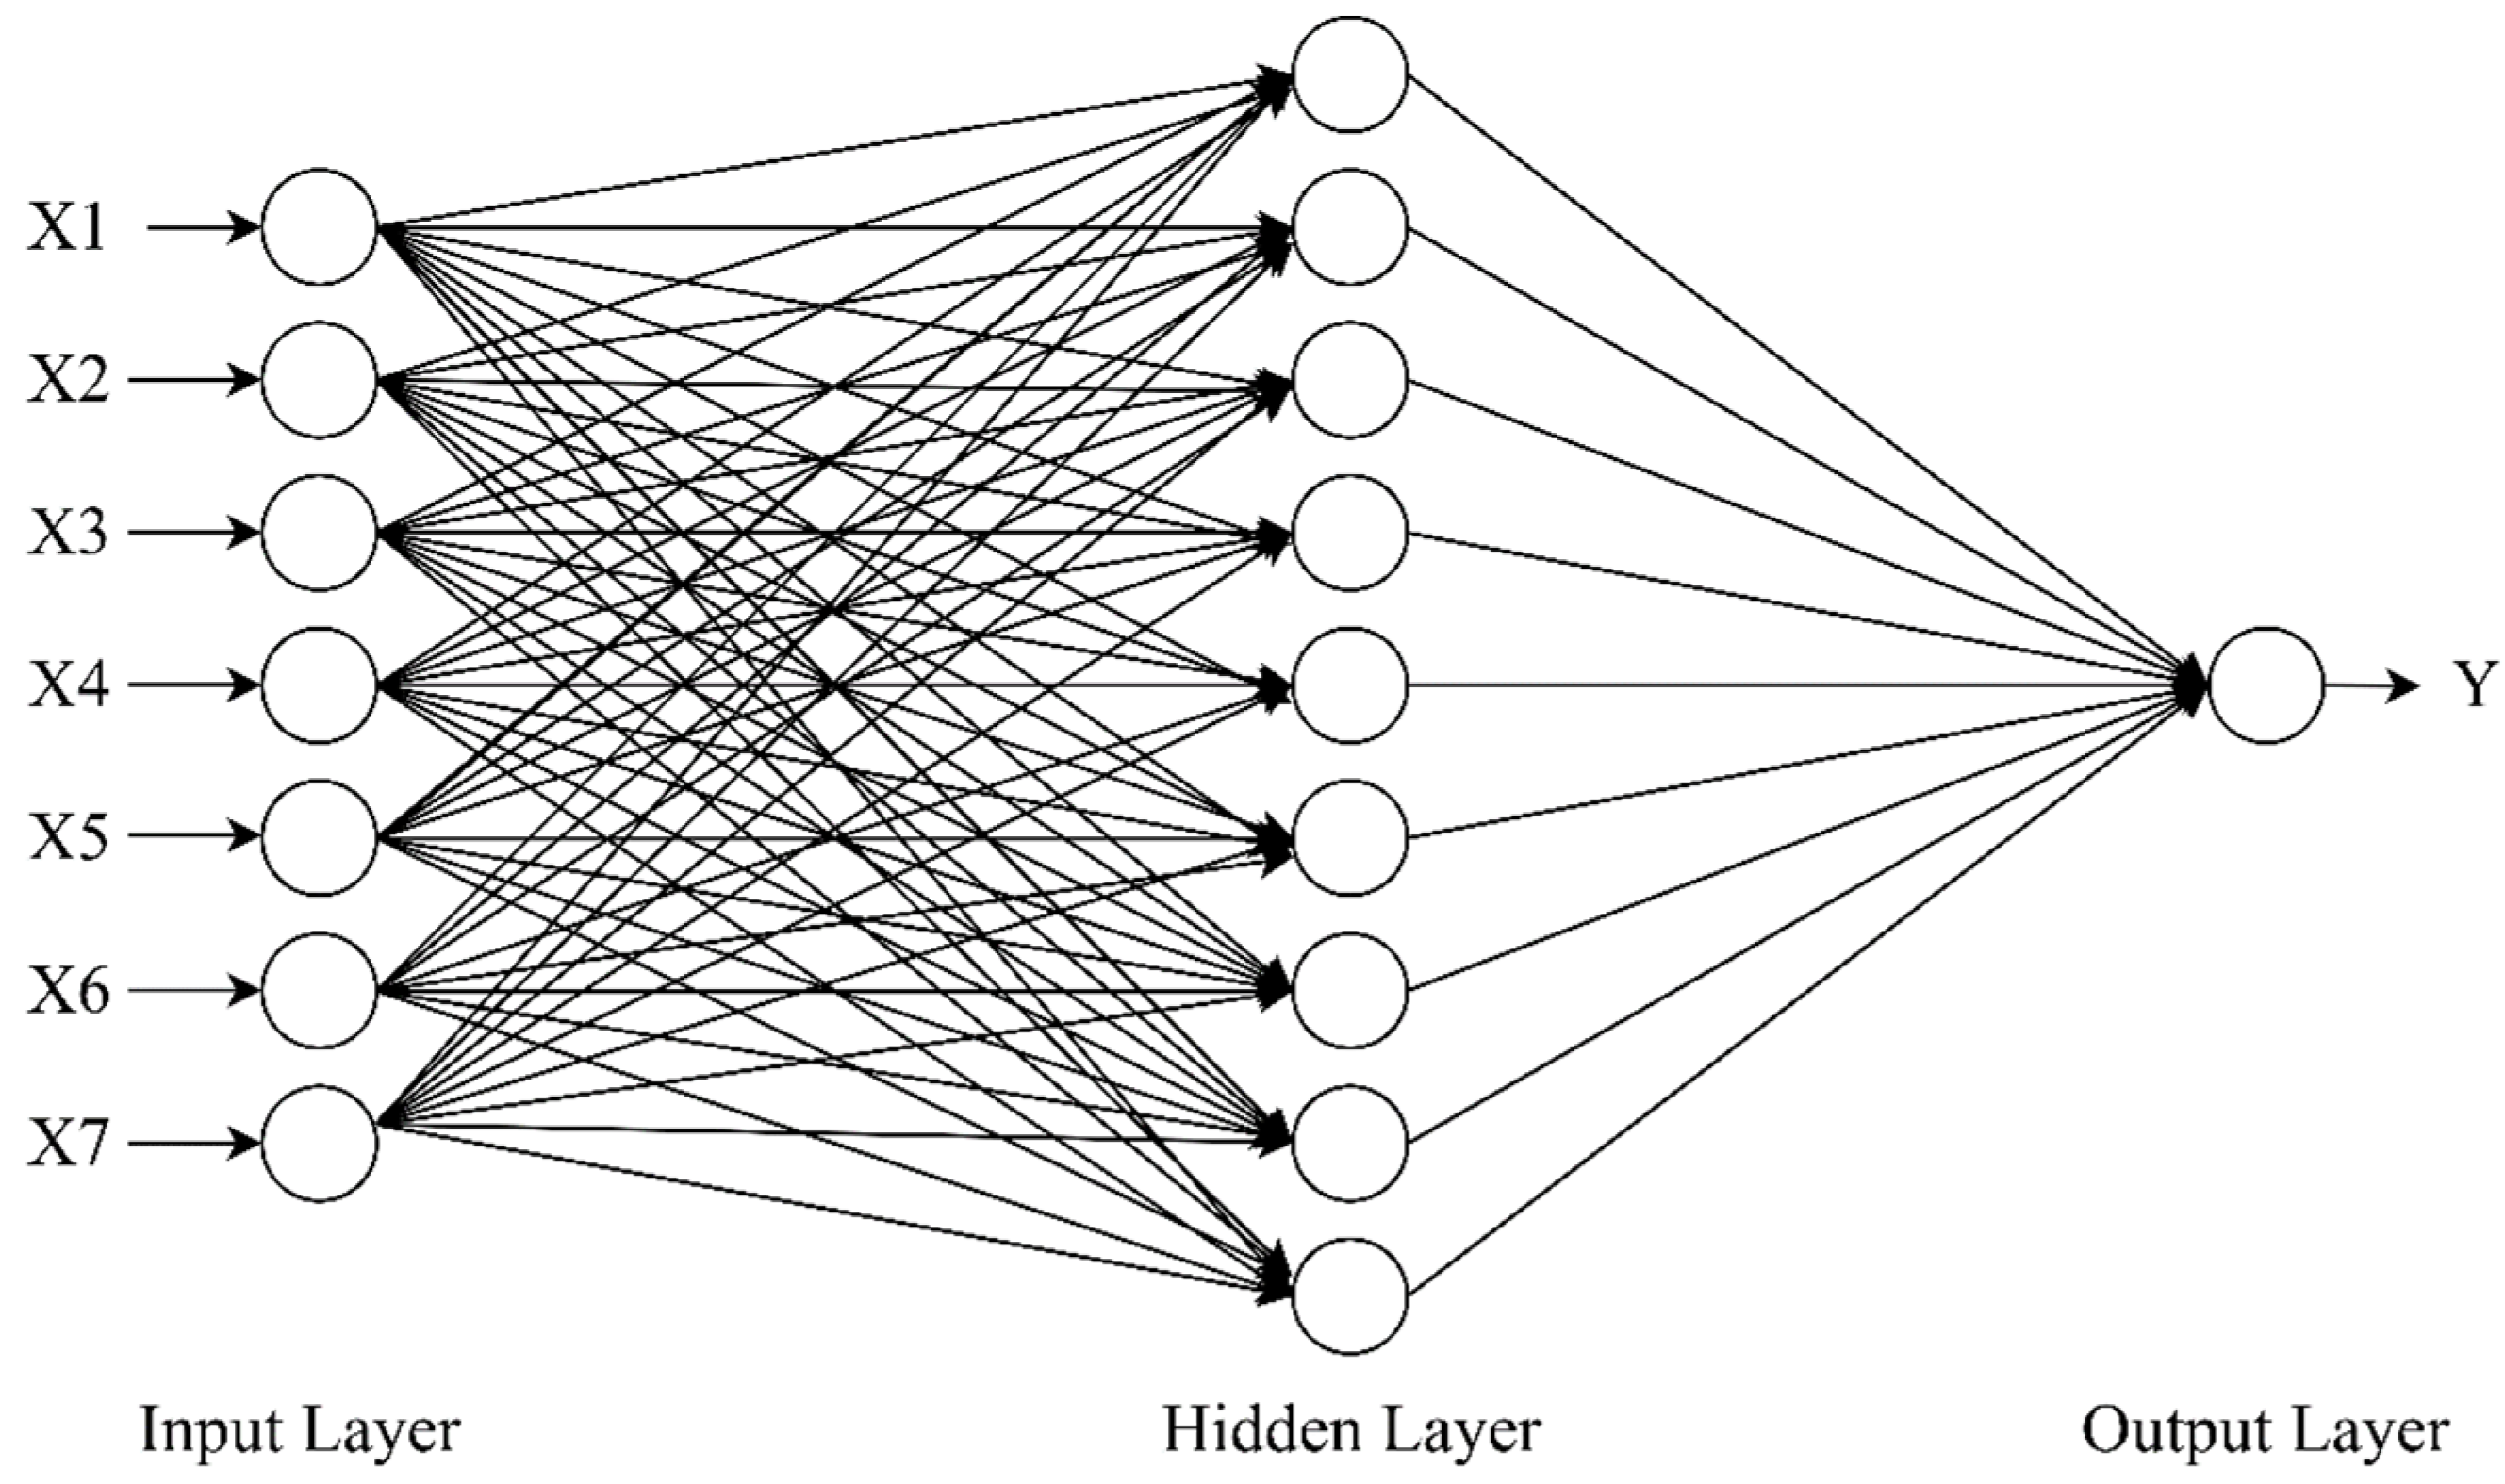
36]. The structure of the BPNN prediction model established in this study was 7-9-1, where 7 indicated that the number of nodes in the input layer was 7, 9 indicated that the number of nodes in the hidden layer was 9, and 1 indicated that the number of nodes in the output layer was 1. The structure diagram of the BPNN model is as follows (
Figure 6):
- (2)
Selection of samples and normalisation of sample data.
The samples in this study were selected from the data obtained from the previous tests on the compressive strength of RC, flexural strength, and rubber mortar cracking time. In order to obtain accurate simulation results, 100% of the sample data were selected as the training sample as well as the test sample. The sample data were normalised to map the sample data to the interval of [0,1] or [−1,1] or other intervals to accelerate the convergence of the neural network and reduce the training time. The data normalisation algorithm is as follows:
- (3)
Establishing the BPNN. The two focal functions in the establishment process are:
The mapminmax processes matrices by normalizing the minimum and maximum values of each row to [YMIN, YMAX]. Then, [Y, PS] = mapminmax (X, YMIN, YMAX) takes X and optional parameters. Then, X means N-by-Q matrix, YMIN means Minimum value for each row if Y (default is −1), and YMAX means Maximum value for each row of Y (default is +1).
- b.
newff, creating a feed forward back propagation network with the following function expression:
TFi means the Transfer function of the ith layer. Default is ‘tansig’ for hidden layers, and ‘purelin’ for output layer. BTF means Backprop network training function, default = ‘trainlm’. BLF means Backprop weight/bias learning function, default = ‘learngdm’. PF means Performance function, default = ‘mse’. IPF means Row cell array of input processing functions. Default is {‘fixunknowns’, ‘remconstantrows’, ‘mapminmax’}. OPF—Row cell array of output processing functions. Default is {‘remconstantrows’, ‘mapminmax’}. DDF means Data division function, default = ‘dividerand’.
- (4)
BPNN parameters setting. In this study, the number of iterations of the designed neural network was 0–1000; the training target error was set to 10-4; and the learning rate was set to 0.01.
In this study, the evaluation of the prediction results of the BPNN model relies on the relative error and the coefficient of determination R
2. The relative error (error) values and the coefficient of determination R
2 calculated from the BPNN model are shown in
Table 6,
Table 7 and
Table 8. The formula for calculating the relative error is as follows:
R
2 was calculated as follows:
Among them, , L = T_test.
Table 6.
Predicted values of compressive strength of concrete and evaluation coefficients calculated by BPNN model.
Table 6.
Predicted values of compressive strength of concrete and evaluation coefficients calculated by BPNN model.
| 7-Day Compressive Strength, R2 = 0.9944 | 28-Day Compressive Strength, R2 = 0.9877 |
|---|
| T_sim | T_test | Error% | T_sim | T_test | Error% |
|---|
| 35.79 | 35.8 | 0.0004 | 48.98 | 49.5 | 0.0106 |
| 30.00 | 30.9 | 0.0290 | 39.00 | 39.0 | 0.0001 |
| 22.27 | 21.5 | 0.0356 | 27.90 | 27.9 | 0.0002 |
| 14.85 | 14.9 | 0.0031 | 19.41 | 19.4 | 0.0005 |
| 31.54 | 31.3 | 0.0076 | 40.39 | 40.4 | 0.0001 |
| 19.86 | 19.5 | 0.0186 | 30.42 | 28.3 | 0.0750 |
| 15.28 | 15.3 | 0.0012 | 22.60 | 22.6 | 0.0000 |
| 31.26 | 31.2 | 0.0020 | 43.50 | 43.5 | 0.0000 |
| 22.37 | 22.6 | 0.0101 | 32.83 | 29.1 | 0.1283 |
| 16.52 | 15.0 | 0.1014 | 21.26 | 21.2 | 0.0029 |
| Average Error/% | 0.0209 | Average Error/% | 0.0218 |
Table 7.
Predicted values of flexural strength of concrete and evaluation coefficients calculated by BPNN model.
Table 7.
Predicted values of flexural strength of concrete and evaluation coefficients calculated by BPNN model.
| Day Break off Strength, R2 = 0.9863 | 28-Day Break off Strength, R2 = 0.9792 |
|---|
| T_sim | T_test | Error% | T_sim | T_test | Error% |
|---|
| 5.56 | 5.56 | 0.0008 | 6.32 | 6.32 | 0.0002 |
| 4.63 | 4.46 | 0.0382 | 4.46 | 5.00 | 0.0001 |
| 3.94 | 3.92 | 0.0043 | 3.94 | 4.82 | 0.0049 |
| 3.28 | 3.19 | 0.0280 | 3.46 | 3.60 | 0.0857 |
| 4.57 | 4.54 | 0.0057 | 5.14 | 5.14 | 0.0001 |
| 3.73 | 3.70 | 0.0085 | 4.64 | 4.83 | 0.0397 |
| 3.35 | 3.36 | 0.0038 | 4.02 | 4.02 | 0.0006 |
| 4.73 | 4.60 | 0.0284 | 5.03 | 5.28 | 0.0480 |
| 3.95 | 3.93 | 0.0046 | 4.78 | 4.78 | 0.0001 |
| 3.02 | 3.22 | 0.0622 | 4.21 | 4.21 | 0.0002 |
| Average Error/% | 0.0184 | Average Error/% | 0.0180 |
Table 8.
Predicted values of mortar cracking time and evaluation coefficients calculated after BPNN model.
Table 8.
Predicted values of mortar cracking time and evaluation coefficients calculated after BPNN model.
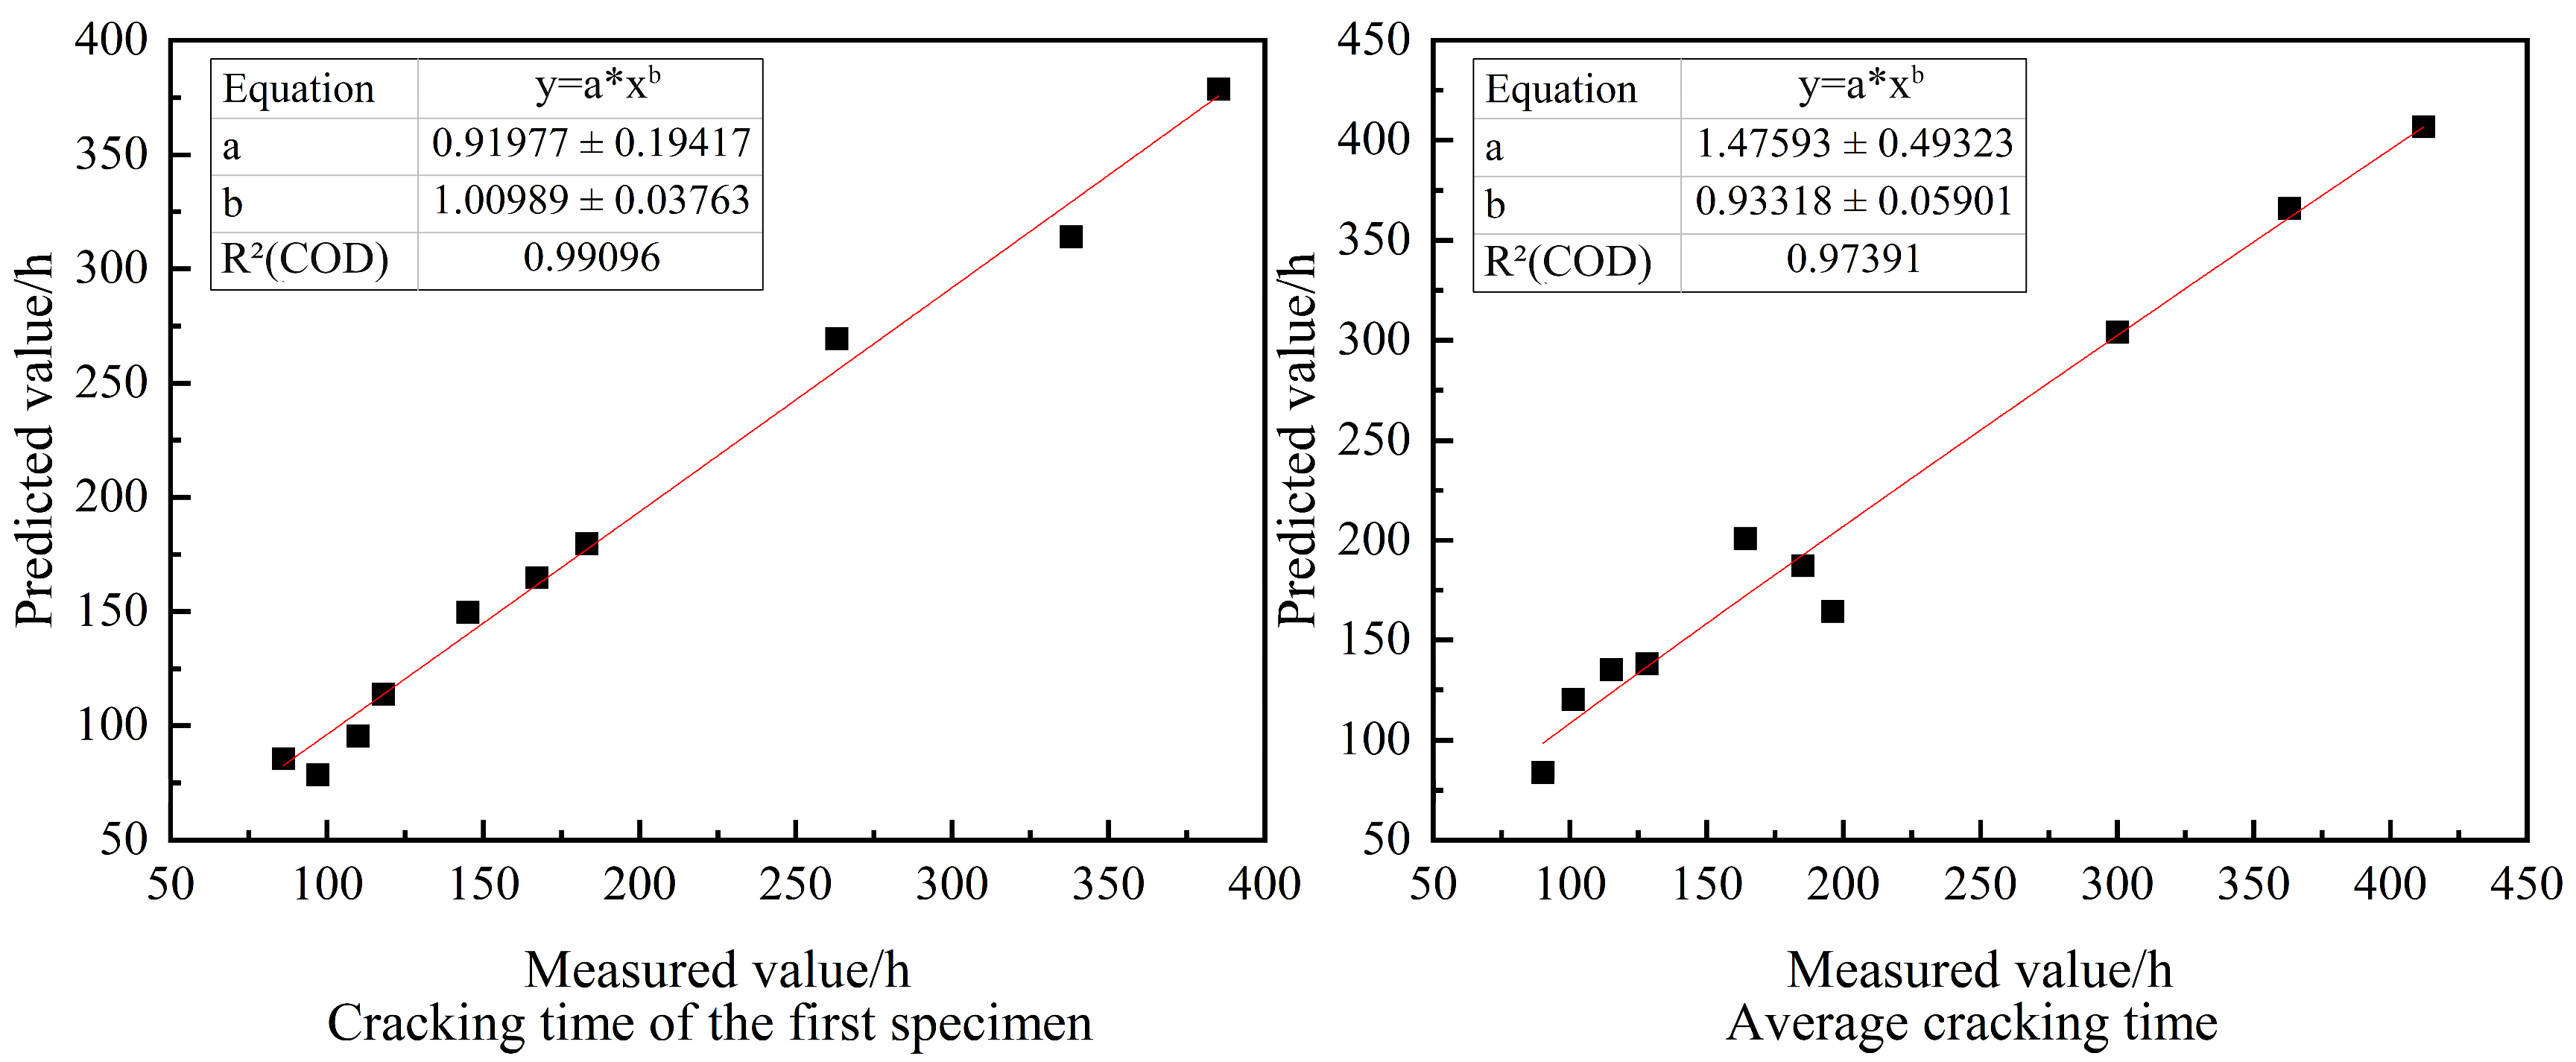
| Cracking Time of Initial Cracking Specimen/h, R2 = 0.9912 | Average Cracking Time/h R2 = 0.9743 |
|---|
| T_sim | T_test | Error% | T_sim | T_test | Error% |
|---|
| 85.69 | 86 | 0.0036 | 83.93 | 90 | 0.0675 |
| 78.60 | 97 | 0.1897 | 120.56 | 101 | 0.1937 |
| 95.66 | 110 | 0.1304 | 135.37 | 115 | 0.1771 |
| 114.10 | 118 | 0.0330 | 138.27 | 128 | 0.0802 |
| 269.66 | 263 | 0.0253 | 304.30 | 300 | 0.0143 |
| 314.24 | 338 | 0.0703 | 366.17 | 363 | 0.0087 |
| 378.73 | 385 | 0.0163 | 406.94 | 412 | 0.0123 |
| 149.73 | 145 | 0.0326 | 200.95 | 164 | 0.2253 |
| 164.86 | 167 | 0.0128 | 187.56 | 185 | 0.0138 |
| 179.99 | 183 | 0.0165 | 164.58 | 196 | 0.1603 |
| Average Error/% | 0.0530 | Average Error/% | 0.0953 |
5.2. Analysis of Prediction Results
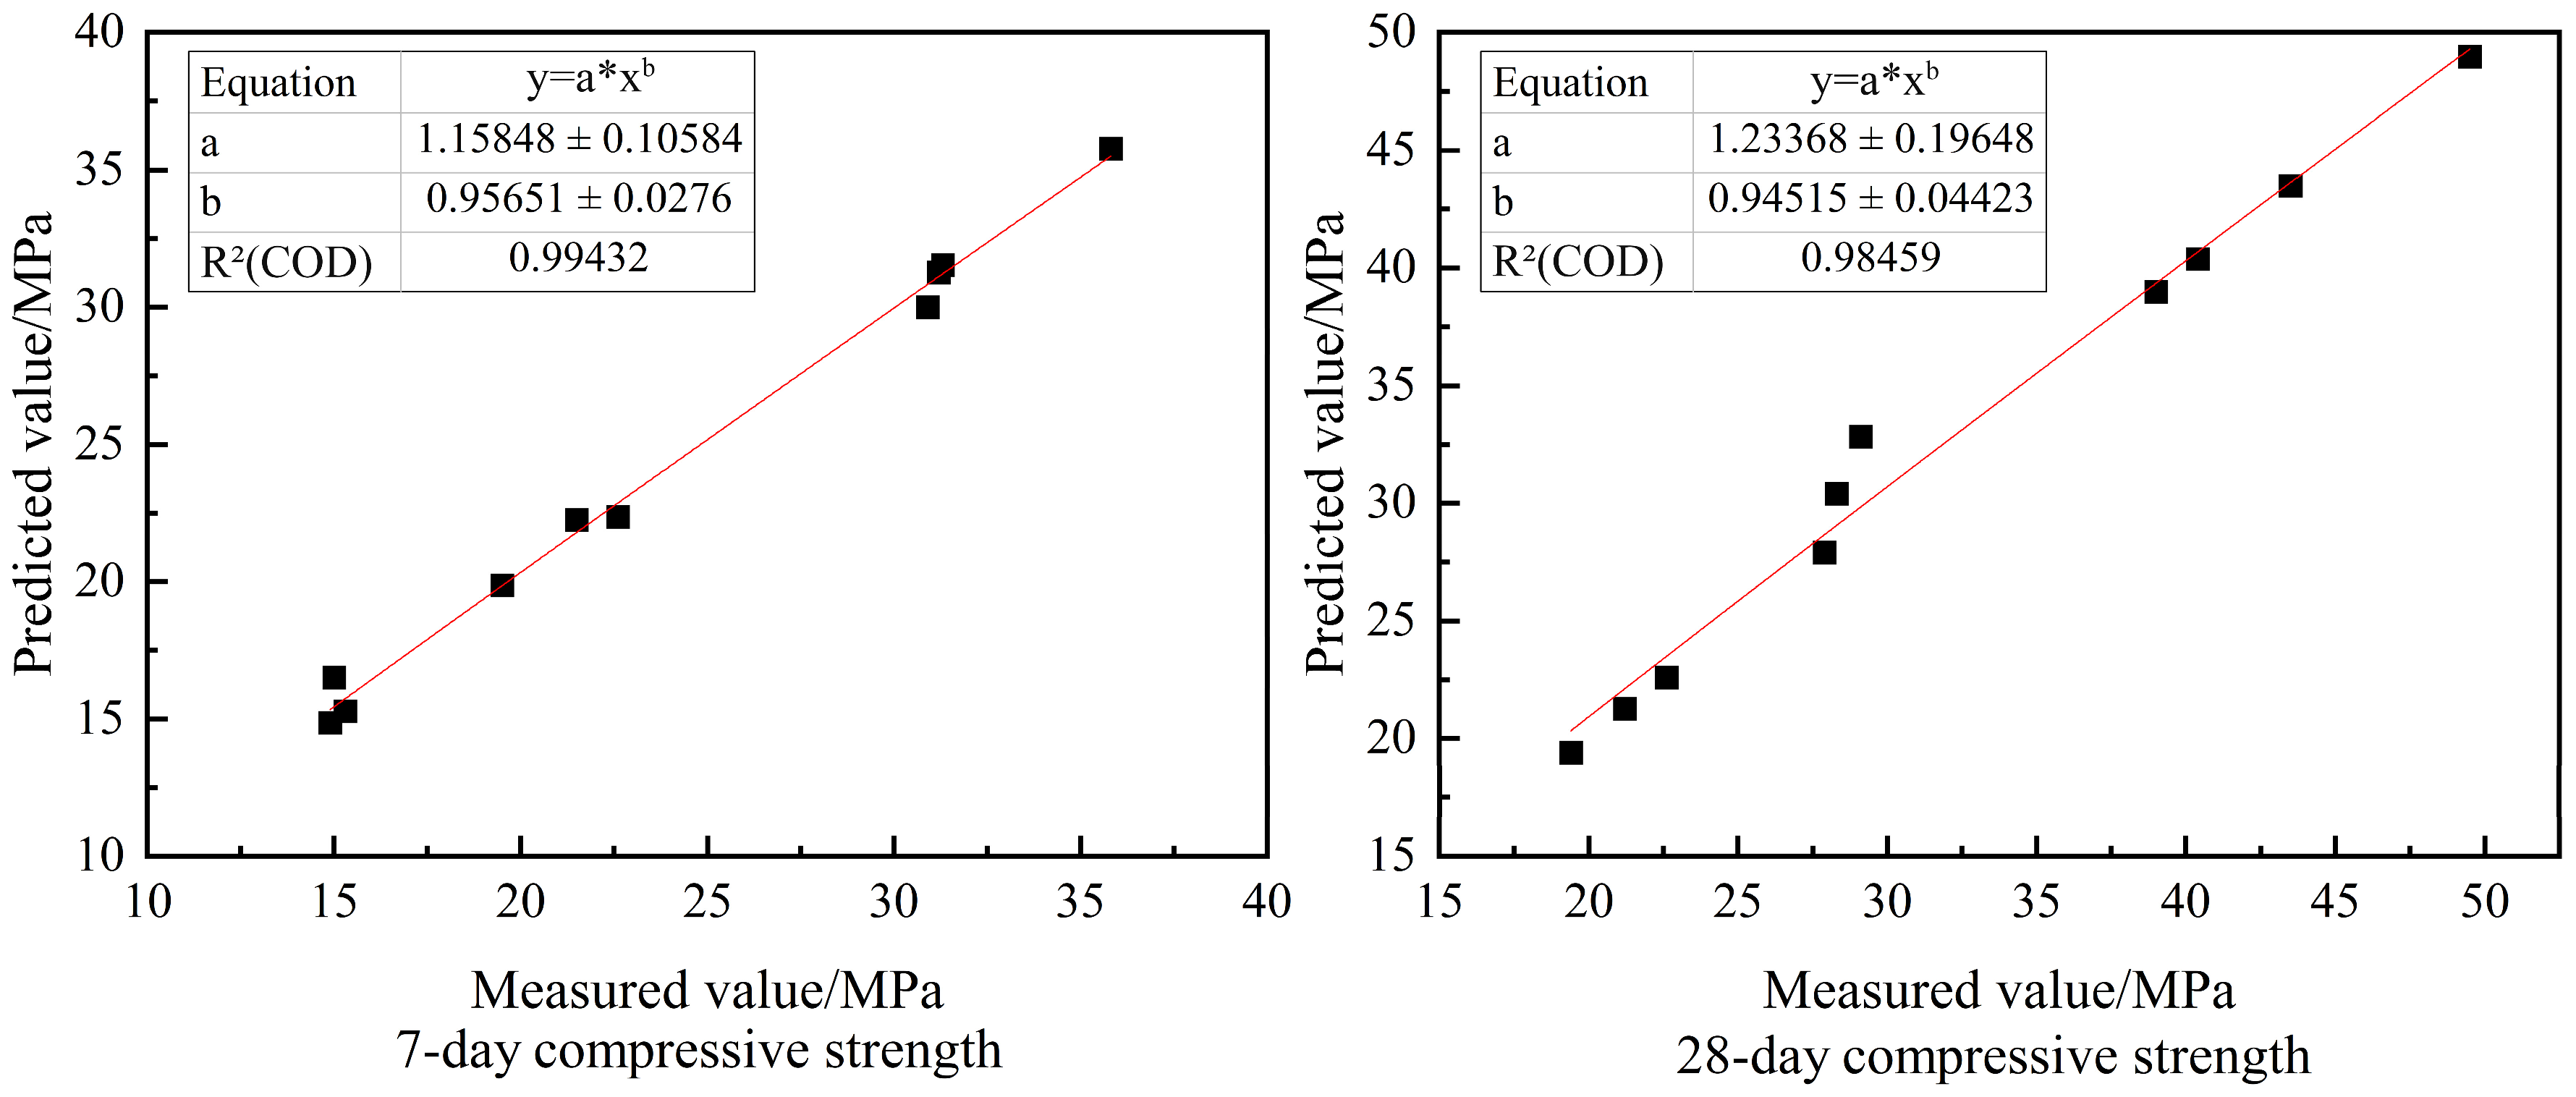
The predicted values of 7-day and 28-day compressive strength of RC were obtained according to the results of the BPNN model operation, and the predicted values were compared with the measured values measured by the test; the errors between the predicted values of 7-day and 28-day compressive strength and the real values were concentrated within 2%, and the prediction accuracy was high. The two were fitted, as shown in
Figure 7. The R
2 values of both reached 0.98, which showed a good fitting effect.
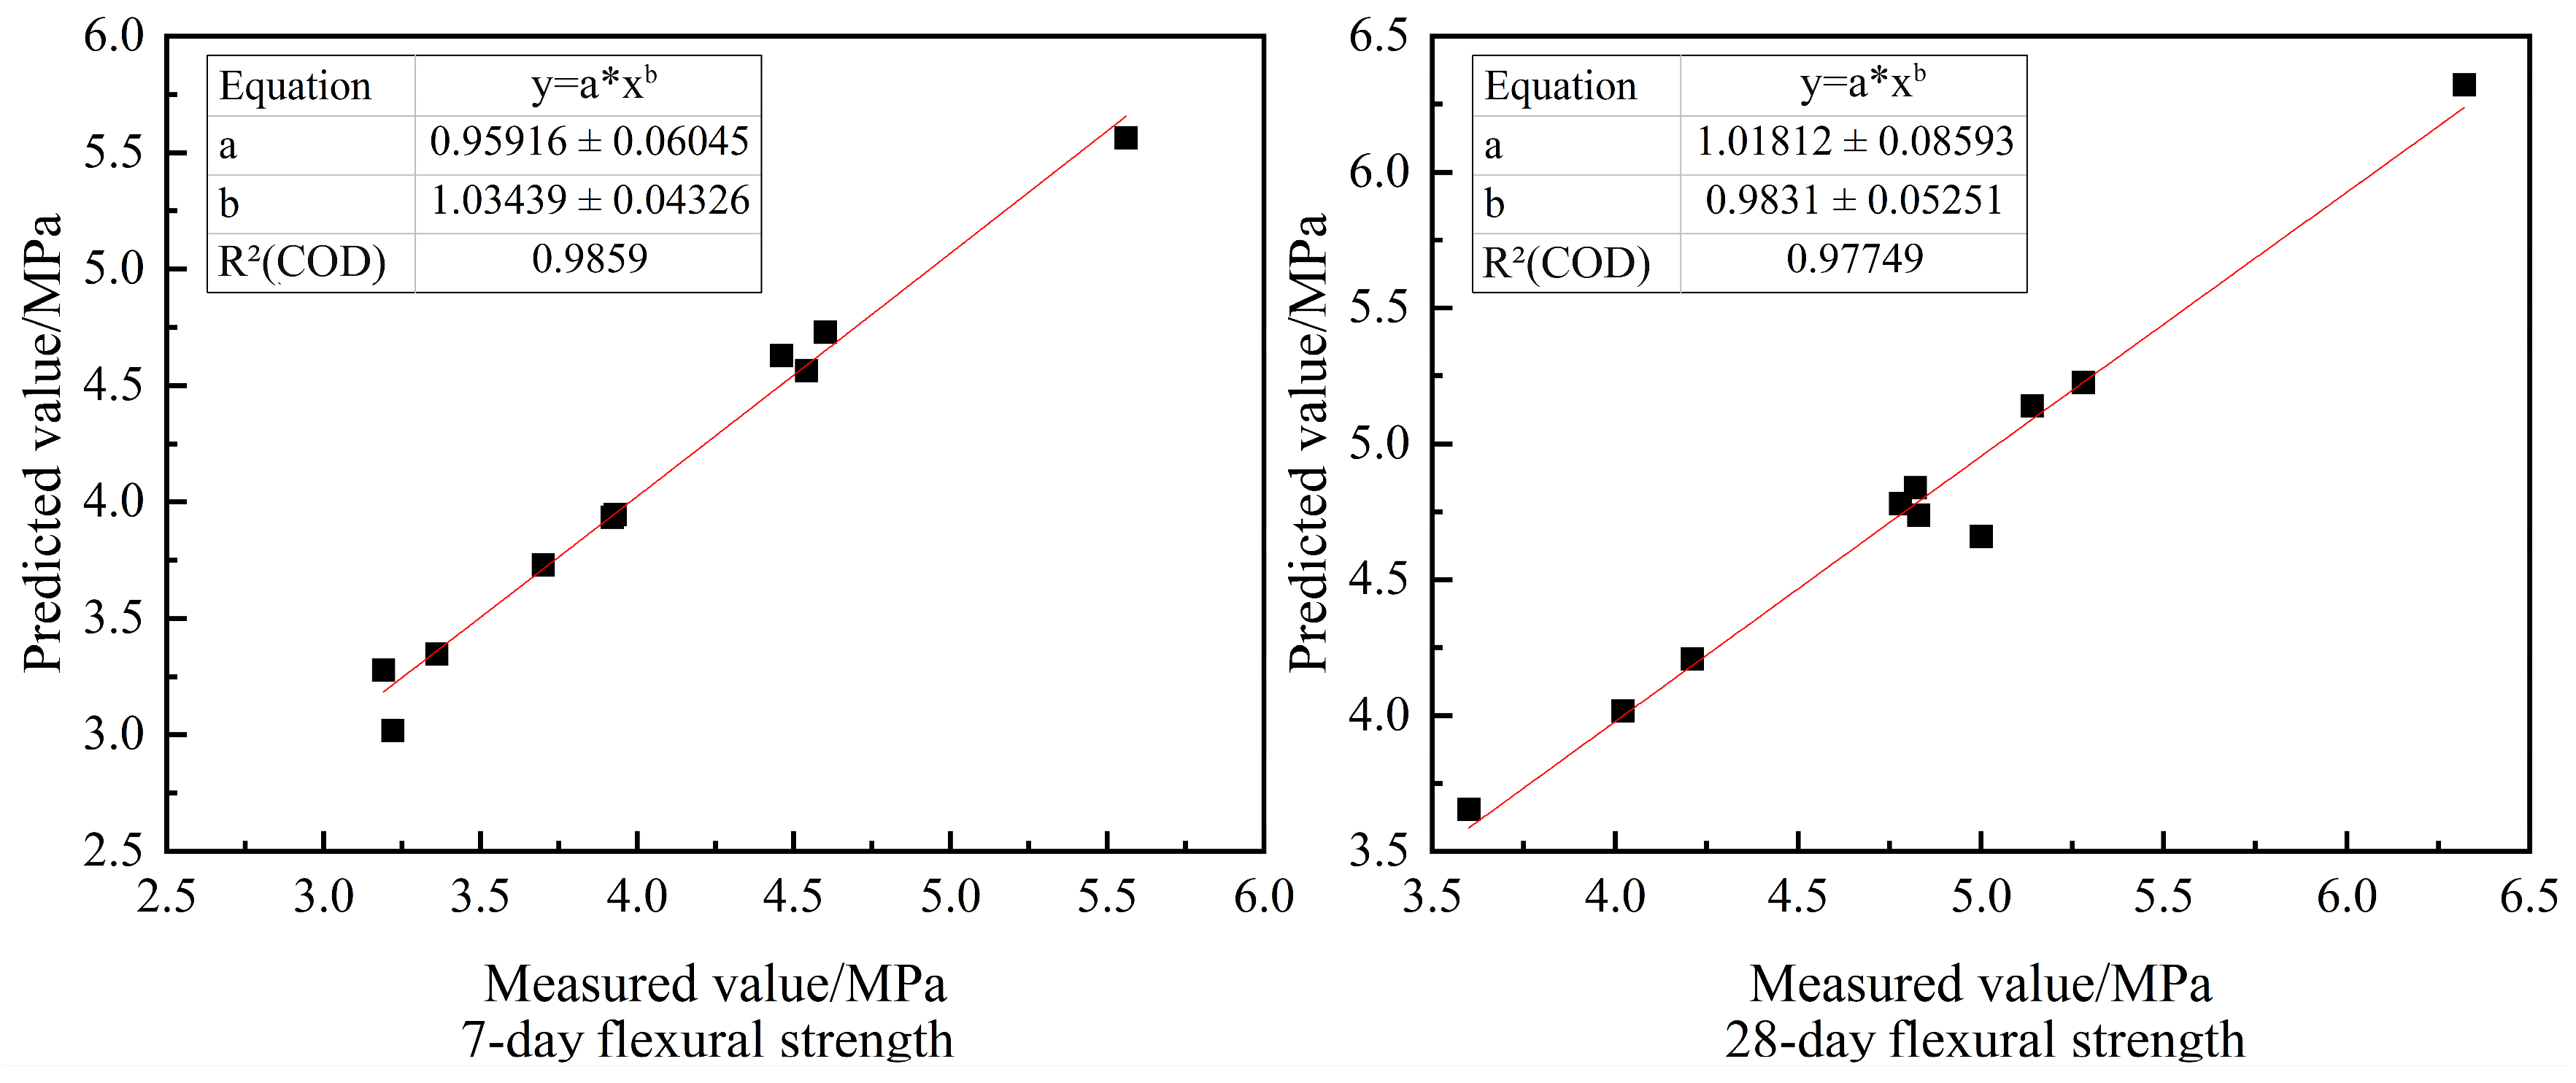
The predicted values of the 7-day and 28-day flexural strength of RC were obtained according to the results of the BPNN model operation, and the predicted values were compared with the measured values measured in the test. The 7-day and 28-day flexural predicted values were concentrated within 2% error from the real values, and the prediction accuracy was high. The two were fitted as shown in
Figure 8. The R
2 values of both reached 0.97, showing a good fitting effect.
The predicted values of cracking time and average cracking time of the first specimen of rubber mortar were obtained according to the results of the BPNN model run, and the predicted values were compared with the actual values measured by the test; the errors of the predicted values of cracking time and average cracking time of the first specimen and the real values were concentrated within 10%, and the prediction accuracy was high. The two were fitted as shown in
Figure 9. Both R
2 values reached 0.97, which shows a good fitting effect.
The prediction model established by the BPNN is much better than the previous prediction by fitting the traditional empirical formula and again verifies the high accuracy of the artificial neural network prediction model, which has established a relationship between the amount of cement, sand, stone, water, rubber, expander, retarder admixture, and the compressive strength, flexural strength, and cracking time coefficient of rubber mortar. Given the amount of cement, sand, gravel, water, rubber, expander, and retarder, the compressive strength, flexural strength, and cracking time of the formulated RC could be predicted by substituting the artificial neural network. The use of neural network to predict the compressive strength, flexural strength, and cracking time of RC was not only efficient, but it also avoids the waste of human, material, and financial resources caused by conventional formulation tests.


