Article

Selective Laser Spectroscopy of the Bixbyite-Type Yttrium Scandate Doped by Rare-Earth Ions

Prokhorov General Physics Institute of the Russian Academy of Sciences, 119991 Moscow, Russia
*
Author to whom correspondence should be addressed.
Materials 2023, 16(21), 6829; https://doi.org/10.3390/ma16216829
Submission received: 8 September 2023 / Revised: 20 October 2023 / Accepted: 21 October 2023 / Published: 24 October 2023
(This article belongs to the Special Issue Feature Paper in Optical and Photonic Materials)

Abstract

:
Yttrium scandate crystals doped by Nd3+ and Tm3+ ions have been successfully grown in the form of fibers using the laser-heated pedestal growth (LHPG) technique. The selective laser spectroscopy methods have identified and distinguished three distinct types of optically active centers associated with Nd3+ and Tm3+ ions. The substitution of Y3+ and Sc3+ for rare-earth ions in the C2 structural site leads to the formation of two distinct basic long-time centers. In Nd3+:YScO3, another type of center (a short-lifetime one) is formed known as the Nd3+–Nd3+ aggregate pair. This center arises from the substitution of Y3+ or Sc3+ for Nd3+ cation in the adjacent MO6 polyhedra that share an edge. In Tm3+:YScO3, the third optical center is formed as a result of the substitution of Y3+ or Sc3+ for Tm3+ in the MO6 octahedra with the C3i site symmetry. The fluorescence decay lifetimes of Nd3+ and Tm3+ ions in the YScO3 crystal structure have been accurately measured and estimated. A Stark level diagram illustrating the splitting of 4F3/2, 4I11/2, and 4I9/2 multiplets of Nd3+ ions has been constructed to show features of the active optical centers with the C2 site symmetry.

1. Introduction

Rare-earth (RE3+)-doped Sc2O3 and Y2O3 sesquioxides exhibit high thermal conductivity, approximately twice that of yttrium aluminum (YAG) [1], and have a wide transparency range from 0.25 μm to 9.6 μm [2]. These materials have demonstrated excellent potential for high-power solid-state lasers [3,4,5,6,7,8], particularly in the infrared (IR) spectral region. They could serve as a viable alternative to the well-established YAG crystals. RE3+-doped sesquioxide materials show strong potential for a variety of applications, including solid-state light-emitting devices [9,10,11], high-efficiency luminescent materials [12,13], rare-earth magnets [14,15], magneto-optical recording materials [16,17], and so on.
Both Y2O3 and Sc2O3 are categorized as a cubic bixbyite-type structure [18,19,20,21,22], where there are one position for the oxygen ion and two symmetrically independent positions for cations: the 8b site with C3i symmetry and 24d site with C2 symmetry. The unit cell contains three cations occupying the the C2 site and one cation in the C3i site. Two types of 6-vertex polyhedra share corners and edges to form a chessboard packing derived from the fluorite structure type [23].
Extensive research has been carried out on rare-earth dopants in Y2O3 crystals, revealing that RE3+ ions have the capability to occupy Y3+ sites [24,25,26,27,28,29,30,31]. However, due to inversion symmetry, the electric dipole–dipole transitions within the 4f-configuration are forbidden for the Kramers RE3+ ions (which have an odd number of 4f-electrons) occupying the C3i sites. Consequently, all electron transitions observed in the fluorescence spectra of these ions should be assigned to electronic transitions in active optical centers located in the C2 sites. Sc2O3 is also a promising host material as it exhibits a strong crystal field effect, primarily caused by the lattice distortions resulting from the substitution of Sc3+ for RE3+ ions of larger size [4,32,33]. Moreover, Tm3+-doped Sc2O3 and Y2O3 have extraordinary broad gain spectra around 2 μm. In comparison to YAG, the peak emission cross-section of the Tm3+ ion at 2 μm is four times greater in both Sc2O3 and Y2O3 [32].
Yttrium scandate (YScO3) has a polymorphic nature, implying that the laser properties can be varied depending on the host crystal structure and the type of rare-earth ions. Additionally, mixed sesquioxides demonstrate notably lower melting temperatures compared to yttria and scandia. Mixed sesquioxides hold great promise for the generation and amplification of ultrashort pulses [6,34,35]. This is due to their inhomogeneously broadened gain spectra, which is a result of the intrinsic disorder in the crystal structure [35]. Nd lasers have been realized successfully in the YScO3 and isostructural (Lu1−xScx)2O3 mixed seqioxides [36]. The high-temperature modification of YscO3 belongs to the bixbyite-type structure [18,20,37,38] similar to yttria (Y2O3) [21] and scandia (Sc2O3) [22]. It can be “frozen” during the crystal growth process, and the synthesis method used plays a critical role. The features of the laser-heated pedestal growth (LHPG) technique are high temperature of heating under laser irradiation followed by rapid cooling. The method allows one to obtain crystals in the form of fibers [39,40].
There is a high probability that certain rare-earth optical centers will be formed in the disordered structure. Selective laser spectroscopy methods are particularly suitable for studying optical properties of rare-earth-doped laser active media such as yttrium scandate.
We have conducted a comprehensive spectral–kinetic analysis of both Nd3+:YScO3 and Tm3+:YScO3 crystal fibers using the methods of selective laser spectroscopy.

2. Materials and Methods

Crystals of 0.1 at. % Nd3+:YScO3 and 0.1 at. % Tm3+:YScO3 have been obtained using the laser-heated pedestal growth (LHPG) technique. Commercial powders of Y2O3 and Sc2O3 (purity > 99.999%, Sigma Aldrich, Burlington, MA, USA) were used as precursors, while Nd2O3 and Tm2O3 powders (purity > 99.999%, Sigma Aldrich, Burlington, MA, USA) were used as activators. Both Nd3+:YScO3 and Tm3+:YScO3 crystals have been grown in the form of fibers with a diameter of 0.6 mm and a length of 50 mm.
The structural characteristics of the Nd3+- and Tm3+-doped YScO3 crystal fibers have been described in our earlier works [18,37,38]. The X-ray pattern of YScO3 includes good narrow peaks, which points to a high degree of crystallinity. According to X-ray data, the YScO3 crystal fiber is homogeneous and belongs to the bixbyite structural type (space group Ia3).
Time-resolved luminescence and excitation spectra and kinetics of luminescence decay of both Nd3+ and Tm3+ ions in YScO3 crystal fiber were measured on the MDR-23 monochromator (LOMO, Saint-Petersburg, Russia) at temperatures of 77 and 300 K. The Solar LP-604 parametric generator (Solar LS, Minsk, Belarus) was used as a source of excitation. The luminescence excitation spectra were measured by scanning the irradiation of the Solar LP-604 tunable parametric generator across the absorption bands of both Nd3+ and Tm3+ ions while keeping the absorption intensity of the laser emission on the studied transitions constant (λdet. = const). The decay kinetics of luminescence was measured using the double selection method (based on luminescence spectrum and excitation). The luminescence from the studied samples was focused into the slit of the monochromator using a condenser, and the signal was subsequently detected using the FEU-83 and Hamamatsu R5108 photomultipliers (Hamamatsu Photonics, Sendai City, Japan) and a PbS photosensitive resistor. The signal from the detectors was fed into the Tektronix–TDS3052B wideband (0–500 MHz) oscilloscope (Tektronix, Beaverton, OR, USA) connected to a computer.
All measurements were carried out at temperatures of 77 and 300 K. The width of the spectral lines depends on the value of an electron—the phono interaction of the impurity center with the phonon field of the crystal lattice. In spectroscopy, this parameter is characterized by homogeneous broadening. At 77 K, phonons are frozen up to the energy of kT = 51 cm−1, resulting in the narrowing of luminescence lines and a decrease in the value of homogeneous linewidth. At 300 K, phonons with energy up to kT = 210 cm−1 are involved, resulting in an increase in nonradiative relaxation channels, leading to broadening of luminescence lines. This effect is especially pronounced for lines in the long-wavelength region of the luminescence spectrum where inter-Stark transitions of both Nd3+ and Tm3+ ion levels are involved in nonradiative relaxation processes.

3. Results and Discussion

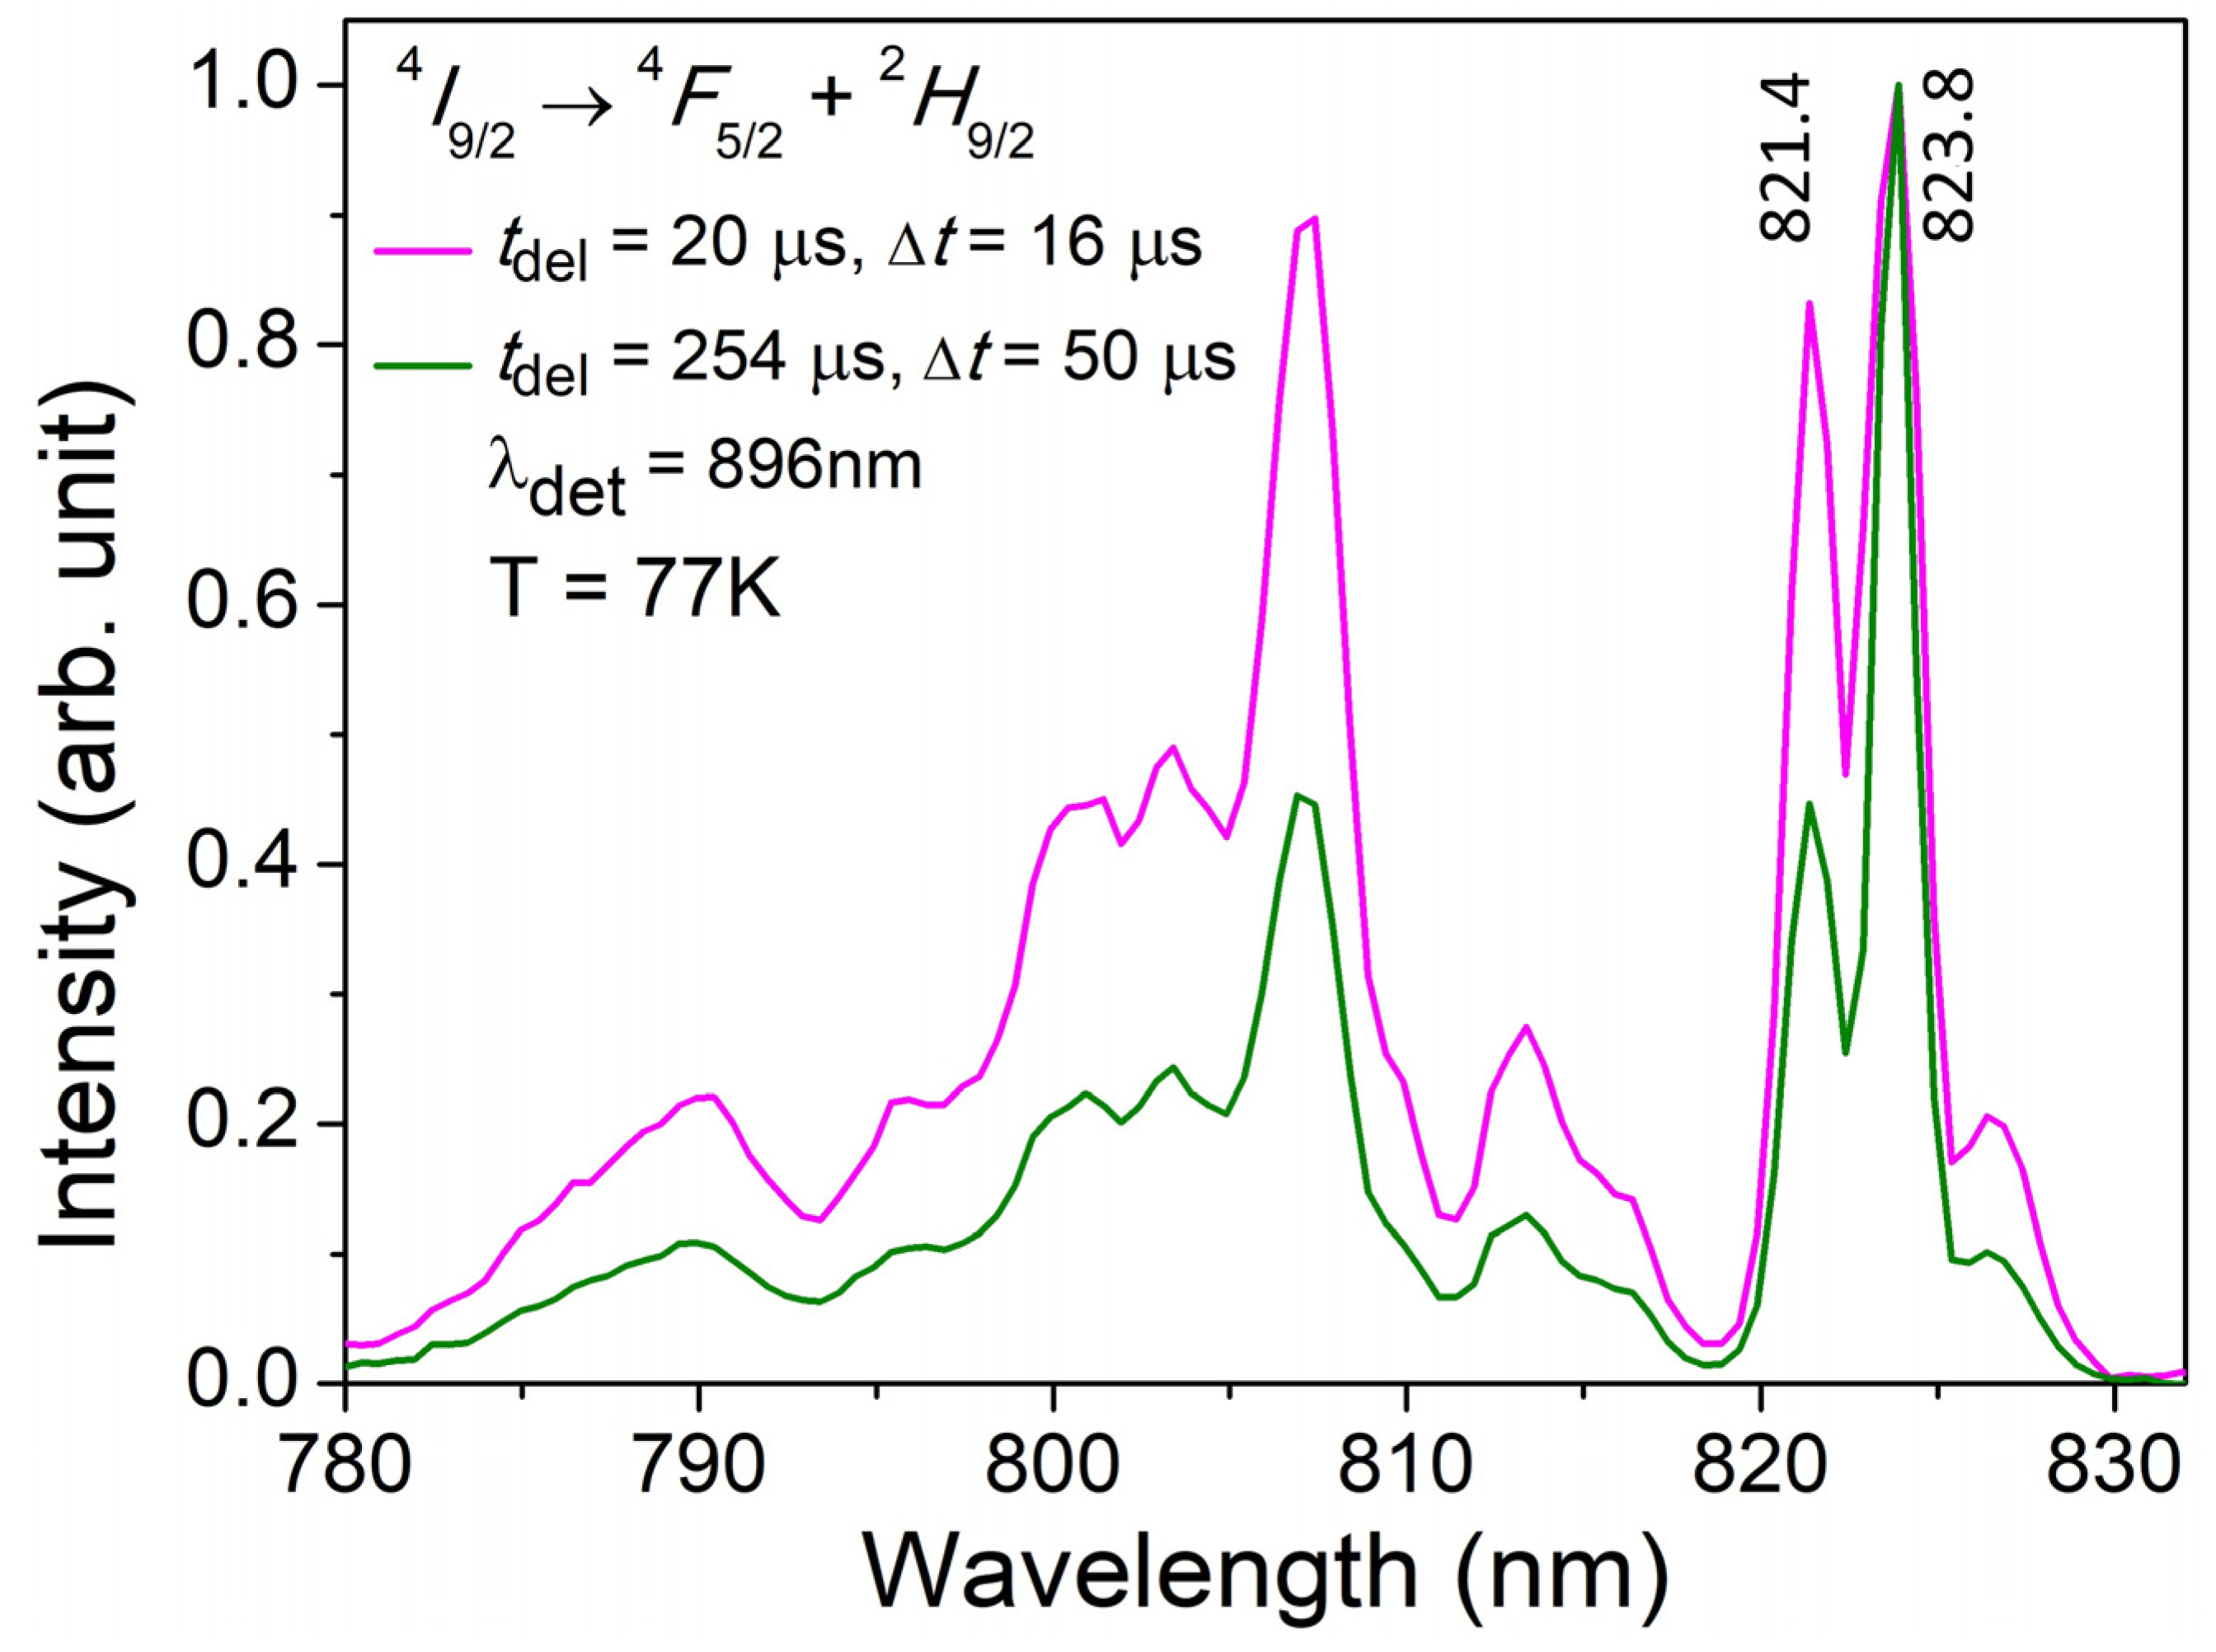
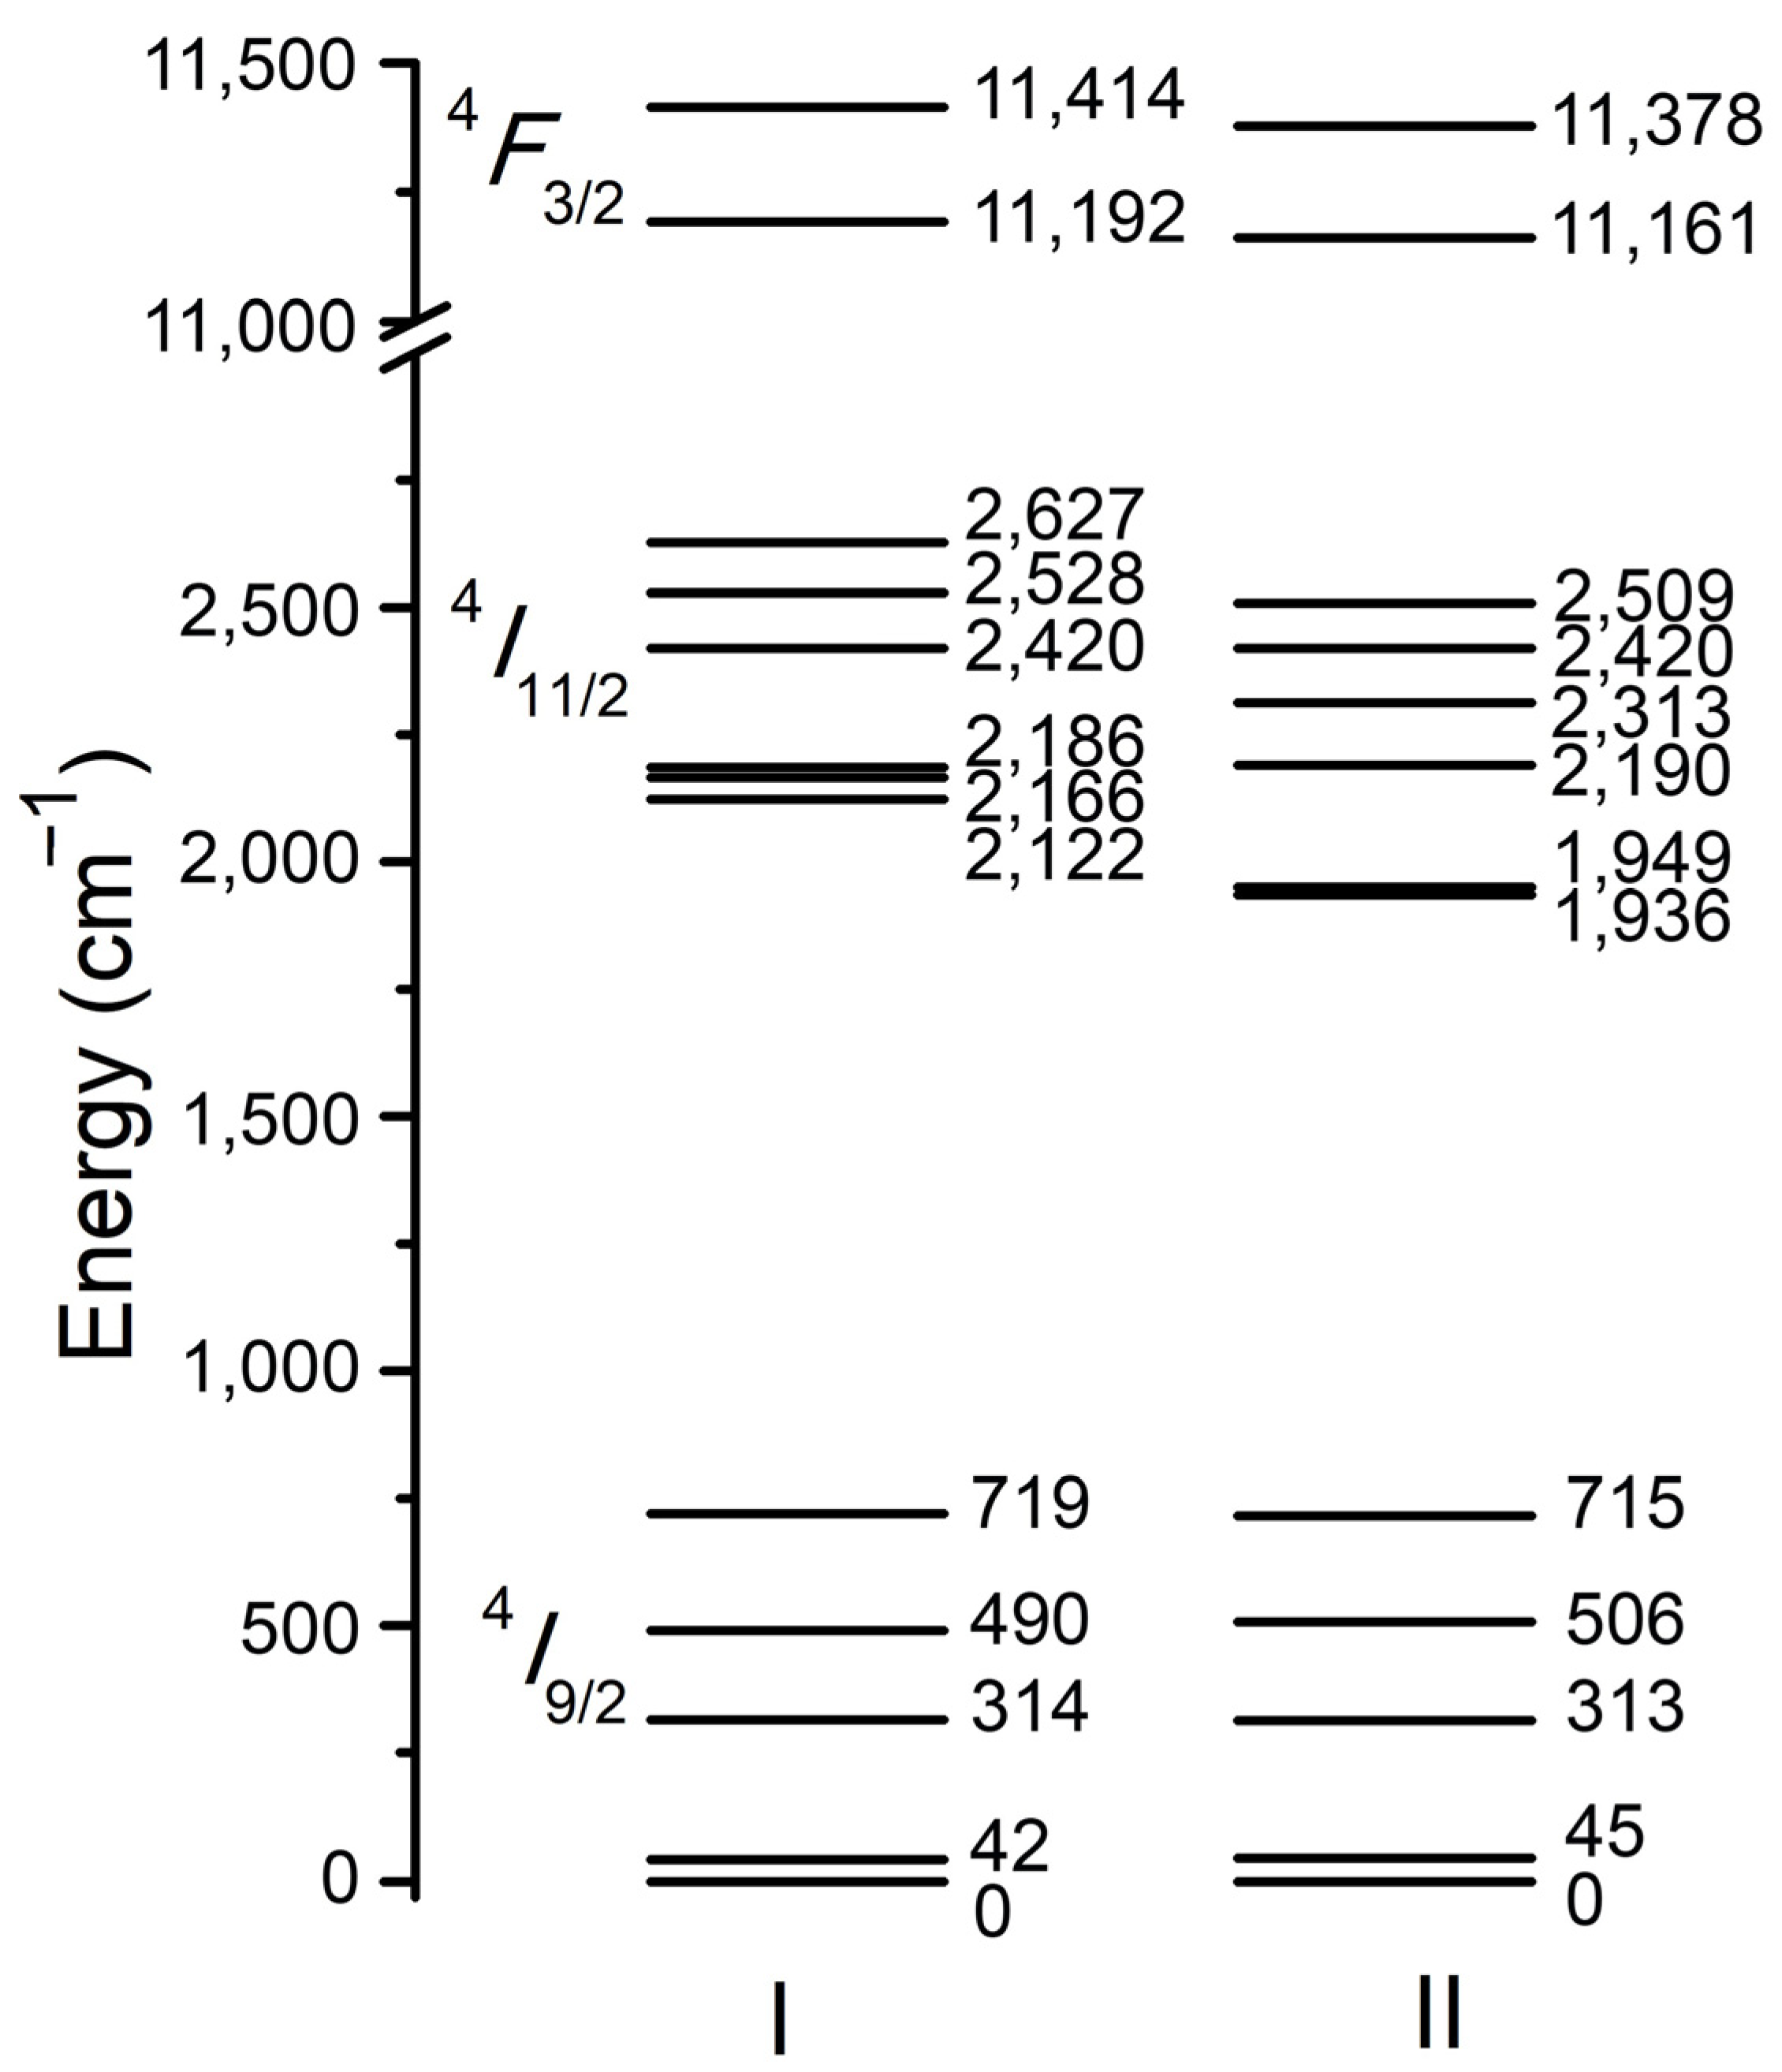
3.1. Spectroscopy of Nd3+:YScO3

Normalized time-resolved luminescence excitation spectra of Nd3+ ions in the YScO3 host were recorded at a temperature of 77 K, as shown in Figure 1. The spectra have been measured in the spectral range of 780–850 nm. Luminescence excitation spectra have been obtained through the scanning of parametric laser radiation on the 4I9/24F5/2 + 2H9/2 electron transitions and selective detection of luminescence on the 4F3/24I9/2 (λdet. = 896 nm). The luminescence excitation spectra are modified and intensities between spectral lines, in particular 821.4 and 823.8 nm, are redistributed with changes in delay times of 20 μs to 254 μs relative to the moment of laser excitation. Analysis of the changes in luminescence excitation spectra allows us to assume that two types of Nd3+ optical centers exist in the YScO3 host.
Time-resolved luminescence spectra of Nd3+ ion in the YScO3 crystal fiber have been measured on the 4F3/24I9/2,11/2 electron transitions at 77 and 300 K. Nd3+ ions have been excited at 823.8 and 821.4 nm on the 4I9/24F5/2 + 2H9/2 electron transitions. Figure 2a,c show luminescence spectra of Nd3+ on the 4F3/24I9/2 electron transition being measured at excitation of 823.8 and 821.4 nm, respectively. Luminescence spectra of Nd3+ ions change with the excitation wavelength. Double selection for excitation wavelength and time leads to shifting luminescence lines. Double selection shows that luminescence spectra of Nd3+ ions change with the excitation wavelength and delay times relative to the moment of laser excitation. Analysis of luminescence spectra of Nd3+ ions allows us to determine the number of spectral lines being recorded at two different excitation wavelengths. In both cases, the spectra of Nd3+ on the 4F3/24I9/2 electron transition includes five Stark components (T = 77 K) that correspond to the number of lines (2J + 1)/2 being predicted by theory. This points to complete removal of degeneration of the electron transitions.
So, the 4I9/2 electron level splits into five components. 4F3/2 and 4I11/2 split into two and six Stark components, respectively, at each excitation wavelength. Spectral lines are shifting with excitation wavelength, but its number remains the same. This fact points to the presence of two types of Nd3+ optical centers. The number of Stark components and values of splitting allow us to conclude that both centers have low site symmetry of C2.
Normalized luminescence spectra of Nd3+ ions in YScO3 have been measured on the 3F3/24I11/2 electron transition at excitation of 823.8 and 821.4 nm and temperatures of 77 and 300 K (Figure 3a,b). Analysis of luminescence spectra of the 3F3/24I11/2 shows that the increase in time delay relative to the moment of laser excitation leads to a shift of spectral lines and redistribution of their intensities on the 3F3/24I9/2 electron transition. The changes in luminescence spectra allow us to identify spectral lines of Nd3+ ions and distinguish two group of lines and hence two types of Nd3+ optical centers in the YScO3 host.
Figure 4a,b show luminescence decay kinetics of Nd3+:YSO3 being measured at excitation of 823.8 and 821.4 nm (4F9/24F5/2 + 2H9/2 electron transition) and temperatures of 77 and 300 K. The LP-604 (Solar LS) parametric generator has been used as an excitation source. The luminescence kinetics have been recorded on the 4F3/24I9/2 electron transition. Approximation of luminescence decay curves of Nd3+:YScO3 being measured at excitation of λexc = 823.8 nm, detection of λdet = 896.0 nm, and temperatures of 77 and 300 K shows that each of the decay curves is described by two exponential models, with lifetimes of τ1(300 K) = 100/250 μs; τ1(77 K) = 130/290 μs (Figure 4a). At excitation of λexc = 821.4 nm and detection of λdet = 893.5 nm, luminescence decay curves consist of two exponents with lifetimes of τ2(300 K) = 100/240 μs and τ2(77 K) = 130/250 μs (Figure 4b).
Total intensity of luminescence decay kinetics of Nd3+:YScO3 is determined by the long-lifetime center (intensity ratio I1/I2 of 0.78/0.22, Figure 4a). The short-lifetime center is formed less effectively and its contribution to the total intensity is insignificant (intensity ratio I1/I2 of 0.94/0.06, Figure 4b). Figure 4a,b show that the lifetime of both centers is increasing with decreasing temperature down to 77 K. Decreasing temperature probably leads to decreasing electron–phonon interaction and intracenter nonradiative relaxation of the excitation energy.
The crystal structure of Nd3+:YScO3 has been described previously [18]. It was shown that neodymium ions can substitute basic ions of yttrium and scandium. The relation between ionic radii of yttrium (0.9 Å), scandium (0.83 Å), and neodymium (0.98 Å) is near the Goldschmidt criterion. Substitution of yttrium and scandium ions by neodymium does not require charge compensation in YScO3. This leads to the formation of two basic types of optical center of Nd3+ activators with the local symmetry of C2. However, a slight difference between cation radii leads to a local distortion in octahedra occupied by Nd3+. The selective laser spectroscopy method is sensitive to these changes, and local distortion in the ion activator surrounding affects the spectral–kinetic characteristics of neodymium ion.
The third optical center with a short lifetime is probably the pair aggregate (Nd3+–Nd3+) one. The Nd3+–Nd3+ center is formed in the neighboring MO6 polyhedra sharing the O2−–O2− edge, where Nd3+ substitutes basic ions Y3+ and Sc3+. The multipole interaction of Nd3+ ions in the pair (Nd3+–Nd3+) leads to luminescence quenching and hence decreasing lifetime of the Nd3+ activator. The effect of this interaction depends on activator concentration as well as Nd3+–Nd3+ distance. This is one of the reasons for the non-exponential character of kinetics at the beginning state of the luminescence quenching.
Spectral lines of the Nd3+ ion occupying the C3i site are not observed because electro-dipole transitions are forbidden in rare-earth ions occupying centro-symmetric positions.
Analysis of luminescence excitation (4I 9/24F5/2 + 2H9/2 transitions) and luminescence spectra (4F3/24I9/2, 4I11/2 transitions) allows us to build the scheme of 4I9/2,4I11/2, and 4F3/2 Stark levels of Nd3+ ions, which occupy two positions with the site symmetry of C2 in the YScO3 crystal structure. Figure 5 shows the Stark energy for each of two basic Nd3+ optical centers with site symmetry of C2. The first center C2 (I) is formed in the result of substitution of Y3+ by Nd3+, and the second center C2 (II) is a result of the substitution of Sc3+ by Nd3+.
Both Nd3+ optical centers have a site symmetry of C2 but depend on Nd–O distance in a structural polyhedra where Nd3+ substitutes Y3+ (center I) or Sc3+ (center II). Isomorphic substitution of basic structural cations (Y3+ and Sc3+) by Nd3+ in a local position leads to changes in the crystal field around Nd3+ ions, but the type of local symmetry remains C2. So, we can distinguish two different optical centers C2 (I) and C2 (II) with almost equal lifetimes and values of Stark splitting of 4I 9/2, 4I 11/2, and 4F3/2 levels (Figure 4 and Figure 5).

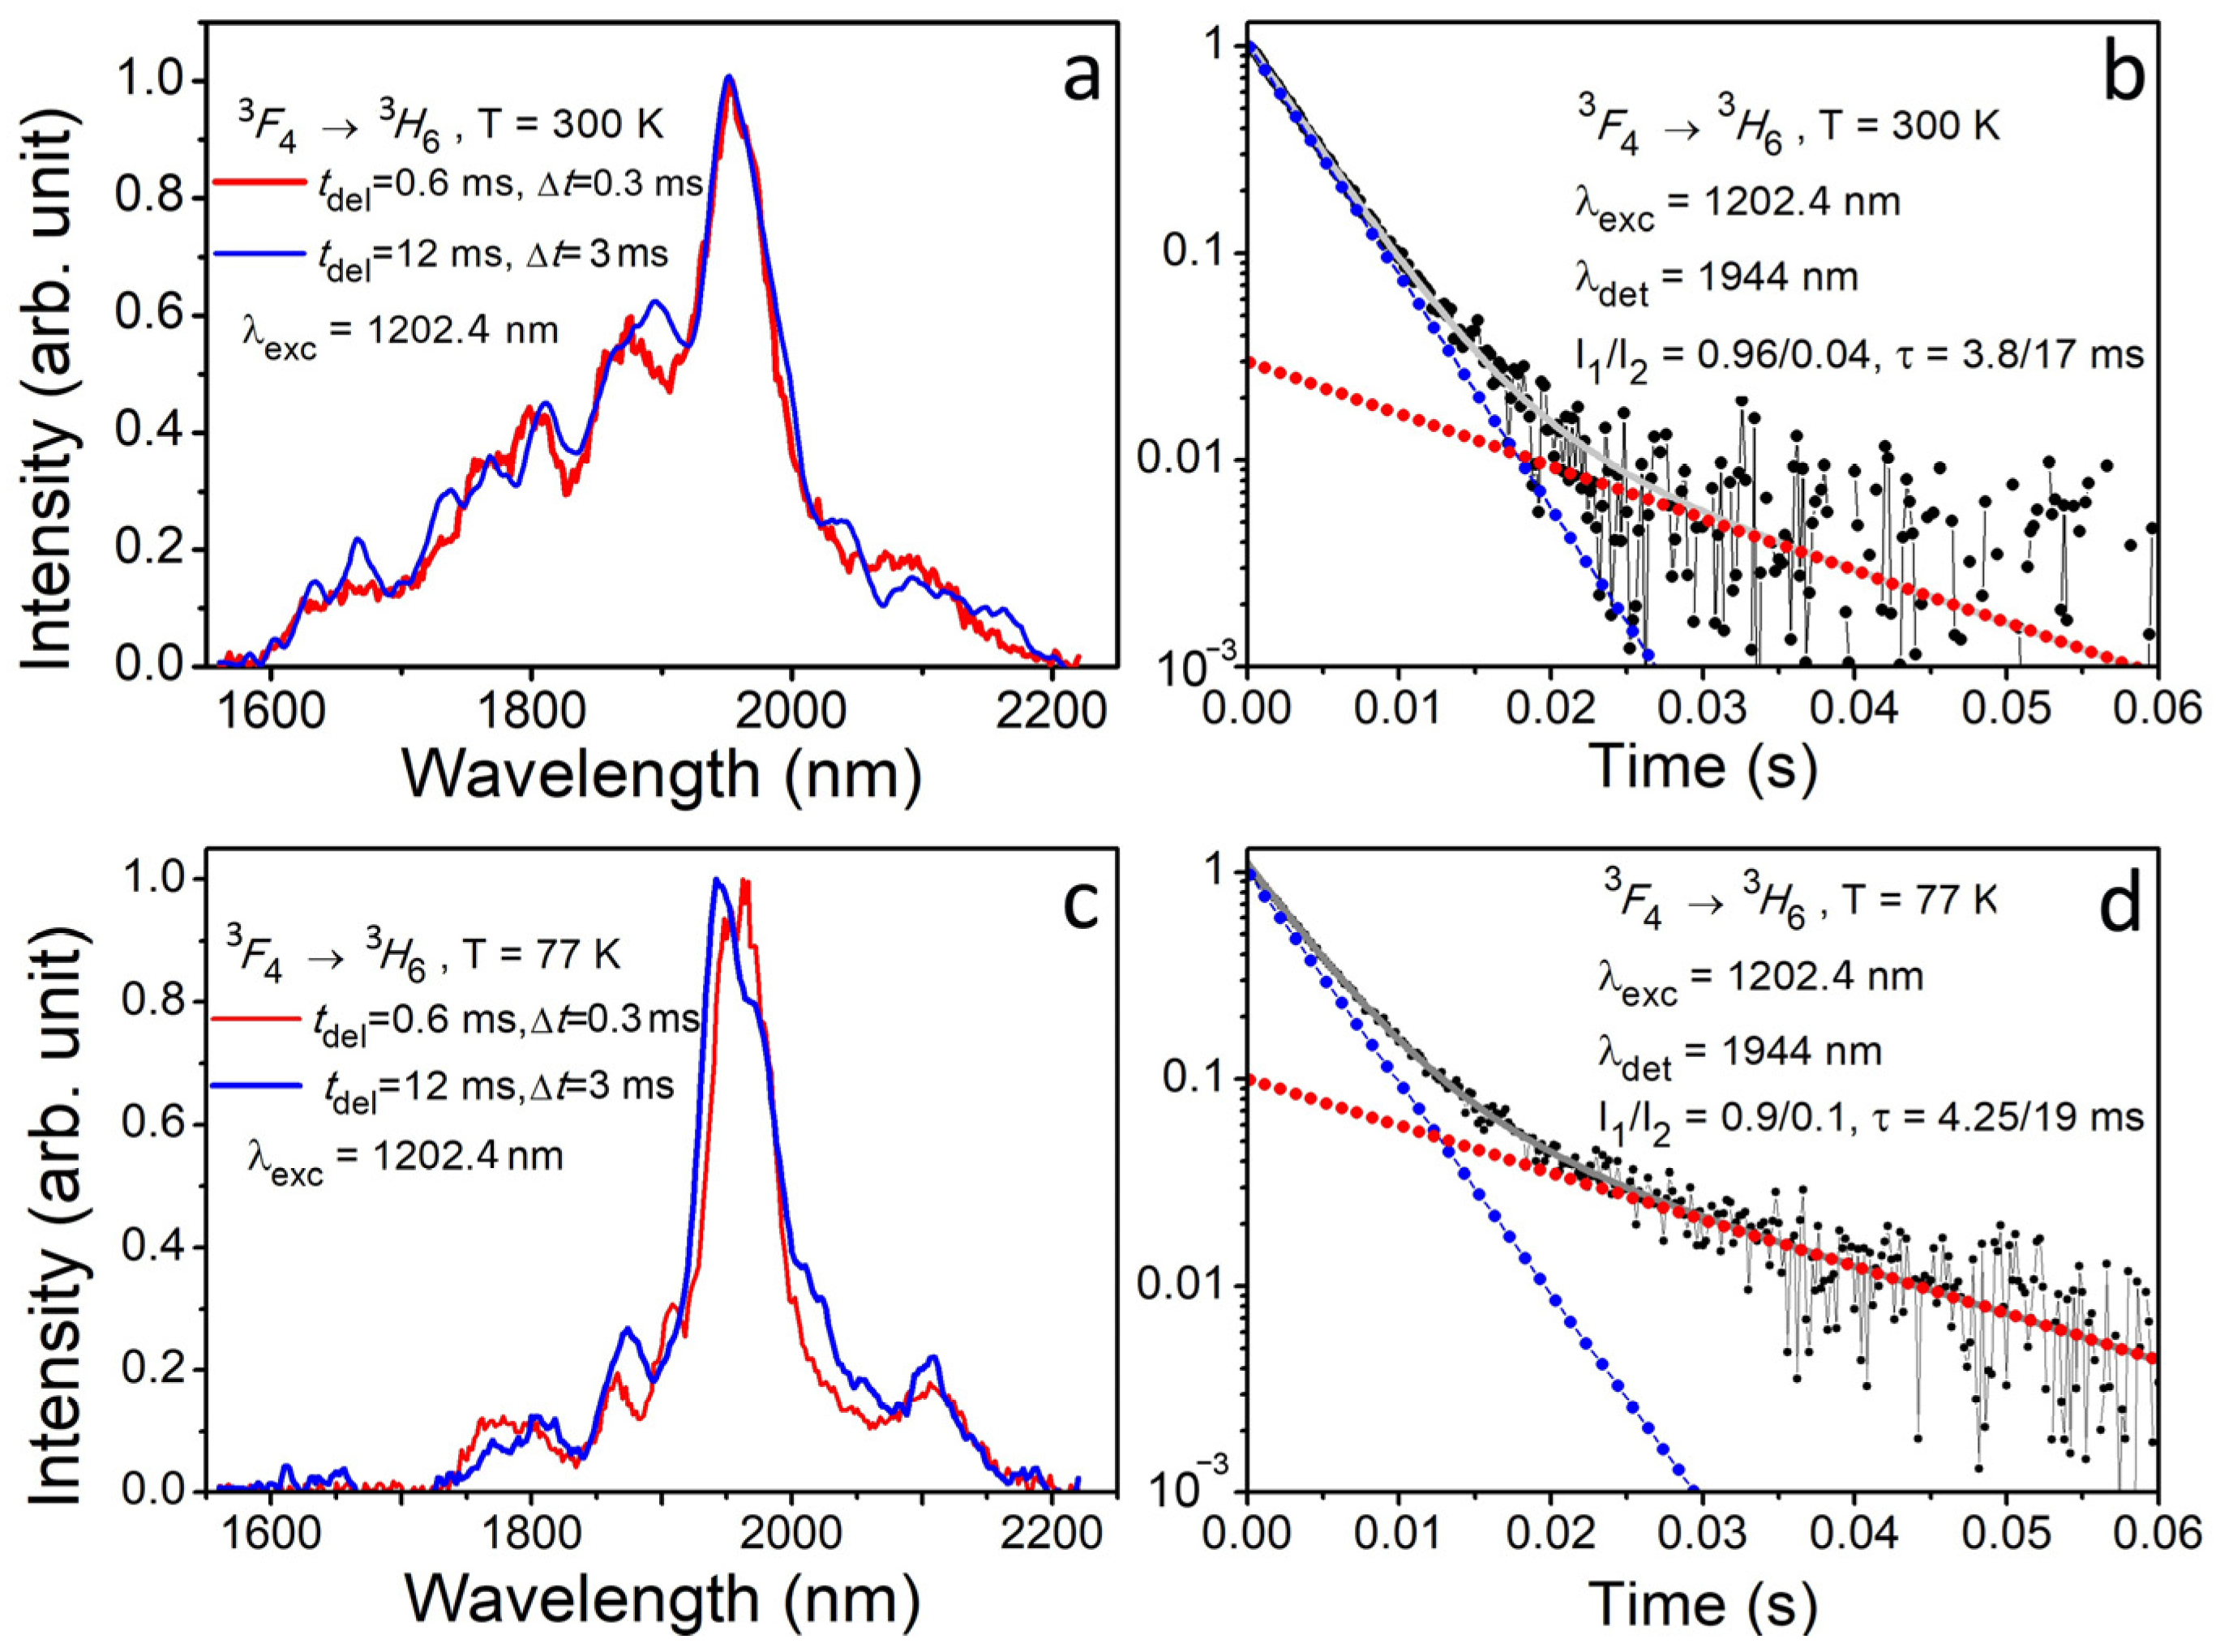
3.2. Spectroscopy of Tm3+:YScO3

Figure 6 shows low-temperature (T = 77 K) time-resolved luminescence excitation spectra of the 0.1 at. % Tm3+:YScO3 crystal fiber. The luminescence excitation spectra have been recorded at the LP-604 parametric laser radiation in the spectral range of 1160 to 1230 nm (3H6  3H5 transition) and registration of luminescence at 1945.6 nm (3F43H6 transition).
Changes in time delay of 0.6 ms to 12 ms relative to the moment of laser excitation lead to changes in luminescence excitation spectra, intensity redistribution between spectral lines of 1202.4 and 1209.4 nm. Changes being observed in luminescence excitation spectra allow us to assume that two types of optical centers of Tm3+ ions exist in the YScO3 crystal structure.
The luminescence of Tm3+:YScO3 has been measured on the 3F43H6 electron transition (spectral range of 1600–2240 nm) at selective laser excitation of 1202.4 and 1209.4 nm (3H6  3H5 electron transition). Figure 7a,c show time-resolved luminescence spectra of Tm3+:YSO3 being measured at temperatures of 77 and 300 K and laser excitation of 1202.35 nm. The luminescence spectra of Tm3+ ions show slight changes in spectral line profile. The luminescence line intensities are redistributing, depending on the time delay relative to the moment of laser excitation (0.6 to 12 ms). However, the Stark structure is poorly resolved. The low-temperature (77 K) luminescence spectra being measured on the 3F43H6 electron transition are non-structured (Figure 7c), as are the room-temperature (300 K) ones. To identify and assign the luminescence lines to specific optical centers has become a difficult task. First, the luminescence spectra of the Tm3+ ion include many Stark components of 3F4 (9 ones) and 3H6 (13 ones), and the mean values of Stark splitting are sufficiently low. Second, the spectral lines of the Tm3+ ion are broadened and overlapped due to high values of electron–phonon interaction.
Figure 7b,d show luminescence quenching kinetics of Tm3+:YScO3 being measured at excitation of 1202.4 nm (3H6  3H5 electron transition) and registration on 1944 nm in the 3F43H6 electron transition at temperatures of 300 and 77 K. Each luminescence quenching curve is described by two exponential models with lifetimes of τ (300 K) = 3.8/17 ms (I1/I2 = 0.96/0.04) and τ (77 K) = 4.25/19 ms (I1/I2 = 0.9/0.1). Short-time exponents (τ (300 K) = 3.8 and τ (77 K) = 4.25 ms) make a major contribution to luminescence quenching kinetics of the Tm3+ ion. Decreasing temperature down to 77 K leads to increasing the lifetime of the Tm3+ ion up to 11%. The contribution of the long-time component in the total intensity of luminescence quenching kinetics is low.
Figure 8a,c show normalized time-resolved luminescence spectra of Tm3+:YScO3 being measured at excitation of 1209.4 nm (3H6  3H5 electron transition) and temperatures of 77 and 300 K. The luminescence spectra are modified, and the line intensities are redistributed with time delay. Decreasing the temperature down to 77 K does not improve structurization of luminescence spectra in the 3F43H6 electron transition in the Tm3+ ion (Figure 8c). Due to the poorly resolved Stark structure, identifying and assigning lines to specific centers is difficult. This is the result of the high value of electron–phonon interaction, overlapping spectral lines, and low values of splitting of 3F4 and 3H6 Stark levels.
Figure 8b,d show luminescence quenching kinetics in Tm3+:YScO3 at excitation of 1209.4 nm (3H6  3H5 electron transition) and registration of luminescence at 1944 nm (3F43H6 electron transition) at temperatures of 77 and 300 K. The luminescence quenching curves are described by a single exponent law with lifetimes of τ (300 K) = 3.2 and τ (77 K) = 3.7 ms at temperatures of 300 and 77 K, respectively. The difference in lifetime can be explained by the decrease in the intercenteral relaxation with temperature (down to 77 K).
Analysis of luminescence quenching kinetics of Tm3+:YScO3 (Figure 7b,d and Figure 8b,d) shows three types of Tm3+ optical centers in the crystal structure. Two of them are basic with short lifetimes of τ1 (300 K) = 3.2 ms, τ1 (77 K) = 3.7 ms and τ2 (300 K) = 3.8 ms, τ2 (77 K) = 4.25 ms. These centers belong to the low local symmetry of C2. One of them is formed as the result of the local substitution of Y3+ by Tm3+ and another one is due to the local substitution of Sc3+ by Tm3+. The third one has a local site of C3i and lifetimes of τ3 (300 K) = 17 ms (I = 0.04) and τ3 (77 K) = 19 ms (I = 0.1) at 300 and 77 K, respectively. The third center has longer lifetime and higher local symmetry (C3i).

4. Conclusions

The substitution of Y3+ and Sc3+ by Nd3+ ions in the crystal structure of the YScO3 crystal fiber leads to the formation of three types of Nd3+ optical centers. Two of these dominate and exhibit a local symmetry of C2. The lifetimes of the Nd3+ optical centers in the YScO3 crystal fiber were determined at two different temperatures. For the center I, the lifetimes were measured to be τ1(300 K) = 250 μs and τ1(77 K) = 290 μs. For the center II, the lifetimes were determined to be τ2(300 K) = 240 μs and τ2(77 K) = 250 μs. In addition to the two dominant optical centers, a third optical center with shorter lifetimes has been observed in the YScO3 crystal fiber. The third center, likely a Nd3+–Nd3+ aggregate pair, exhibits lifetimes of τ3(300 K) = 100 μs and τ3(77 K) = 130 μs. This aggregate pair is believed to form as a result of the local substitution of Nd3+ for the basic structural cation (Y3+ and Sc3+) in the neighboring octahedra that share an edge. The quenching of Nd3+ luminescence is primarily ascribed to a combination of interaction between neighboring Nd3+ ions and the process of nonradiative relaxation of the excitation energy. The Stark component scheme for 4F3/2, 4I11/2, and 4I9/2 electron levels in the Nd3+ ion has been built for both basic optical centers with the local symmetry of C2.
Two short-lifetime optical centers of Tm3+ ions with the local symmetry of C2 are formed in the YScO3 crystal fiber through the substitution of Y3+ and Sc3+ with Tm3+ ions. The lifetimes of these optical centers have been estimated as τ1 (300 K) = 3.8 ms and τ1(77 K) = 4.25 ms for center I, and τ2 (300 K) = 3.2 ms and τ2 (77 K) = 3.7 ms for center II. The third center with long lifetimes of τ3 (300 K) = 17 ms and τ3 (77 K) = 19 ms has a local symmetry classified as C3i.

Author Contributions

Conceptualization, V.T. and E.D.; methodology, O.A. and S.R.; validation, O.A. and E.D.; formal analysis, O.A. and E.D.; investigation, O.A. and E.D.; resources, V.K.; data curation, O.A. and E.D.; writing—original draft preparation, E.D. and O.A.; writing—review and editing, E.D., O.A. and V.T.; visualization, E.D. and O.A.; supervision, E.D. and V.T.; funding acquisition, E.D. and V.T. All authors have read and agreed to the published version of the manuscript.

Funding

This research was funded by the Russian Science Foundation, grant number 22-22-00968.

Institutional Review Board Statement

Not applicable.

Informed Consent Statement

Not applicable.

Data Availability Statement

Data sharing is not applicable for this article.

Conflicts of Interest

The authors declare no conflict of interest.

References

  1. Klein, P.H.; Croft, W.J. Thermal Conductivity, Diffusivity, and Expansion of Y2O3, Y3Al5O12, and LaF3 in the Range 77°–300° K. J. Appl. Phys. 1967, 38, 1603. [Google Scholar] [CrossRef]
  2. Nigara, Y. Measurement of the Optical Constants of Yttrium Oxide. Jpn. J. Appl. Phys. 1968, 7, 404. [Google Scholar] [CrossRef]
  3. Petermann, K. Oxide Laser Crystals Doped with Rare Earth and Transition Metal Ions. In Handbook of Solid-State Lasers: Materials, Systems and Applications; Elsevier: Amsterdam, The Netherlands, 2013; pp. 3–27. [Google Scholar]
  4. Fornasiero, L.; Mix, E.; Peters, V.; Petermann, K.; Huber, G. New Oxide Crystals for Solid State Lasers. Cryst. Res. Technol. 1999, 34, 255–260. [Google Scholar] [CrossRef]
  5. Zhou, Z.; Guan, X.; Huang, X.; Xu, B.; Xu, H.; Cai, Z.; Xu, X.; Liu, P.; Li, D.; Zhang, J.; et al. Tm3+-Doped LuYO3 Mixed Sesquioxide Ceramic Laser: Effective 205 Μm Source Operating in Continuous-Wave and Passive Q-Switching Regimes. Opt. Lett. 2017, 42, 3781. [Google Scholar] [CrossRef]
  6. Liu, W.; Lu, D.; Guo, R.; Wu, K.; Pan, S.; Hang, Y.; Sun, D.; Yu, H.; Zhang, H.; Wang, J. Broadening of the Fluorescence Spectra of Sesquioxide Crystals for Ultrafast Lasers. Cryst. Growth Des. 2020, 20, 4678–4685. [Google Scholar] [CrossRef]
  7. Moncorgé, R.; Guyot, Y.; Kränkel, C.; Lebbou, K.; Yoshikawa, A. Mid-Infrared Emission Properties of the Tm3+-Doped Sesquioxide Crystals Y2O3, Lu2O3, Sc2O3 and Mixed Compounds (Y,Lu,Sc)2O3 around 1.5-, 2- and 2.3-Μm. J. Lumin. 2022, 241, 118537. [Google Scholar] [CrossRef]
  8. Li, S.; Zhang, L.; Tan, X.; Deng, W.; He, M.; Chen, G.; Xu, M.; Yang, Y.; Zhang, S.; Zhang, P.; et al. Growth, Structure, and Spectroscopic Properties of a Tm3+, Ho3+ Co-Doped Lu2O3 Crystal for ~2.1 Μm Lasers. Opt. Mater. 2019, 96, 109277. [Google Scholar] [CrossRef]
  9. Antoinette, M.M.; Israel, S.; Berchmans, J.L.; Manoj, G.J. Enhanced Photoluminescence and Charge Density Studies of Novel (Sm1−xGdx)2O3 Nanophosphors for WLED Applications. J. Mater. Sci. Mater. Electron. 2018, 29, 19368–19381. [Google Scholar] [CrossRef]
  10. Reenabati Devi, K.; Dorendrajit Singh, S.; David Singh, T. Photoluminescence Properties of White Light Emitting La2O3:Dy3+ Nanocrystals. Indian J. Phys. 2018, 92, 725–730. [Google Scholar] [CrossRef]
  11. Antoinette, M.M.; Israel, S.; Amali, A.J.; Berchmans, J.L.; Kumar, B.S.; Manoj, G.J.; Usmaniya, U.M. A Novel Synthesis of Orange-Red Emitting (Sm1−xCex)2O3 Nanophosphors for UV LEDs. Nano-Struct. Nano-Objects 2018, 13, 51–58. [Google Scholar] [CrossRef]
  12. Barrera, E.W.; Cascales, C.; Pujol, M.C.; Park, K.H.; Choi, S.B.; Rotermund, F.; Carvajal, J.J.; Mateos, X.; Aguiló, M.; Díaz, F. Synthesis of Tm:Lu2O3 Nanocrystals for Phosphor Blue Applications. Phys. Proced. 2010, 8, 142–150. [Google Scholar] [CrossRef]
  13. Kumar, A.; Tiwari, S.P.; Kumar, K.; Rai, V.K. Structural and Optical Properties of Thermal Decomposition Assisted Gd2O3:Ho3+/Yb3+ Upconversion Phosphor Annealed at Different Temperatures. Spectrochim. Acta A Mol. Biomol. Spectrosc. 2016, 167, 134–141. [Google Scholar] [CrossRef] [PubMed]
  14. Tseng, K.P.; Yang, Q.; McCormack, S.J.; Kriven, W.M. High-Entropy, Phase-Constrained, Lanthanide Sesquioxide. J. Am. Ceram. Soc. 2020, 103, 569–576. [Google Scholar] [CrossRef]
  15. El-Kelany, K.E.; Ravoux, C.; Desmarais, J.K.; Cortona, P.; Pan, Y.; Tse, J.S.; Erba, A. Spin Localization, Magnetic Ordering, and Electronic Properties of Strongly Correlated Ln2O3 Sesquioxides (Ln = La, Ce, Pr, Nd). Phys. Rev. B 2018, 97, 245118. [Google Scholar] [CrossRef]
  16. Balabanov, S.; Demidova, K.; Filofeev, S.; Ivanov, M.; Kuznetsov, D.; Li, J.; Permin, D.; Rostokina, E. Influence of Lanthanum Concentration on Microstructure of (Ho1–XLax)2O3 Magneto-Optical Ceramics. Phys. Status Solidi B Basic. Res. 2020, 257, 1900500. [Google Scholar] [CrossRef]
  17. Balabanov, S.S.; Filofeev, S.V.; Ivanov, M.G.; Kalinina, E.G.; Kuznetsov, D.K.; Permin, D.A.; Rostokina, E.Y. Self-Propagating High-Temperature Synthesis of (Ho1−XLax)2O3 Nanopowders for Magneto-Optical Ceramics. Heliyon 2019, 5, e01519. [Google Scholar] [CrossRef]
  18. Alimov, O.; Dobretsova, E.; Guryev, D.; Kashin, V.; Kiriukhina, G.; Kutovoi, S.; Rusanov, S.; Simonov, S.; Tsvetkov, V.; Vlasov, V.; et al. Growth and Characterization of Neodymium-Doped Yttrium Scandate Crystal Fiber with a Bixbyite-Type Crystal Structure. Cryst. Growth Des. 2020, 20, 4593–4599. [Google Scholar] [CrossRef]
  19. Pauling, L.; Shappell, M.D. The Crystal Structure of Bixbyite and the C-Modification of the Sesquioxides. Z. Krist. Cryst. Mater. 1930, 75, 128–142. [Google Scholar] [CrossRef]
  20. Clark, J.B.; Richter, P.W.; Toit, L. du High-Pressure Synthesis of YScO3, HoScO3, ErScO3, and TmScO3, and a Reevaluation of the Lattice Constants of the Rare Earth Scandates. J. Solid. State Chem. 1978, 23, 129–134. [Google Scholar] [CrossRef]
  21. Hanic, F.; Hartmanová, M.; Knab, G.G.; Urusovskaya, A.A.; Bagdasarov, K.S. Real Structure of Undoped Y2O3 Single Crystals. Acta Crystallogr. Sect. B 1984, 40, 76–82. [Google Scholar] [CrossRef]
  22. Geller, S.; Romo, P.; Remeika, J.P. Refinement of the Structure of Scandium Sesquioxide. Z. Fur Krist.—New Cryst. Struct. 1967, 124, 136–142. [Google Scholar] [CrossRef]
  23. Moore, P.B.; Araki, T. Braunite: Its Structure and Relationship Insights on the Genealogy of to Bixbyite, and Some Fluorite Derivative Structures. Am. Mineral. 1976, 61, 1226–1240. [Google Scholar]
  24. Kitazawa, K.; Fueki, K. Effect of Point Defects on Laser Oscillation Properties of Nd-Doped Y2O3. Jpn. J. Appl. Phys. 1982, 21, 1017. [Google Scholar] [CrossRef]
  25. Stone, J.; Burrus, C.A. Nd:Y2O3 Single-Crystal Fiber Laser: Room-Temperature Cw Operation at 1.07- and 1.35-Μm Wavelength. J. Appl. Phys. 1978, 49, 2281. [Google Scholar] [CrossRef]
  26. Chang, N.C.; Gruber, J.B.; Leavitt, R.P.; Morrison, C.A. Optical Spectra, Energy Levels, and Crystal-Field Analysis of Tripositive Rare Earth Ions in Y2O3. I. Kramers Ions in C2 Sites. J. Chem. Phys. 1982, 76, 3877–3889. [Google Scholar] [CrossRef]
  27. Leavitt, R.P.; Gruber, J.B.; Chang, N.C.; Morrison, C.A. Optical Spectra, Energy Levels, and Crystal-Field Analysis of Tripositive Rare-Earth Ions in Y2O3. II. Non-Kramers Ions in C2 Sites. J. Chem. Phys. 1982, 76, 4775–4788. [Google Scholar] [CrossRef]
  28. Morrison, C.A.; Leavitt, R.P.; Gruber, J.B.; Chang, N.C. Optical Spectra, Energy Levels, and Crystal-Field Analysis of Tripositive Rare-Earth Ions in Y2O3. III. Intensities and g Values for C2 Sites. J. Chem. Phys. 1983, 79, 4758–4763. [Google Scholar] [CrossRef]
  29. Gruber, J.B.; Leavitt, R.P.; Morrison, C.A.; Chang, N.C. Optical Spectra, Energy Levels, and Crystal-Field Analysis of Tripositive Rare-Earth Ions in Y2O3. IV. C3i Sites. J. Chem. Phys. 1985, 82, 5373–5378. [Google Scholar] [CrossRef]
  30. Gruber, J.B.; Krupke, W.F.; Poindexter, J.M. Crystal-Field Splitting of Trivalent Thulium and Erbium J Levels in Yttrium Oxide. J. Chem. Phys. 1964, 41, 3363. [Google Scholar] [CrossRef]
  31. Mandel, M. Paramagnetic Resonance of Yb3+ in Yttrium Oxide. Appl. Phys. Lett. 1963, 2, 197. [Google Scholar] [CrossRef]
  32. Fornasiero, L.; Berner, N.; Dicks, B.-M.; Mix, E.; Peters, V.; Petermann, K.; Huber, G. Broadly Tunable Laser Emission from Tm:Y2O3 and Tm:Sc2O3 at 2 μm. In Proceedings of the Advanced Solid State Lasers, Boston, MA, USA, 31 January–3 February 1999; p. WD5. [Google Scholar]
  33. Fornasiero, L.; Mix, E.; Peters, V.; Heumann, E.; Petermann, K.; Huber, G. Efficient Laser Operation of Nd:Sc2O3 at 966 nm, 1082 nm and 1486 nm. In Proceedings of the Advanced Solid State Lasers, Boston, MA, USA, 31 January–3 February 1999; p. MC6. [Google Scholar]
  34. Liu, W.; Lu, D.; Pan, S.; Xu, M.; Hang, Y.; Yu, H.; Zhang, H.; Wang, J. Ligand Engineering for Broadening Infrared Luminescence of Kramers Ytterbium Ions in Disordered Sesquioxides. Cryst. Growth Des. 2019, 19, 3704–3713. [Google Scholar] [CrossRef]
  35. Kränkel, C.; Uvarova, A.; Guguschev, C.; Kalusniak, S.; Hülshoff, L.; Tanaka, H.; Klimm, D. Rare-Earth Doped Mixed Sesquioxides for Ultrafast Lasers [Invited]. Opt. Mater. Express 2022, 12, 1074–1091. [Google Scholar] [CrossRef]
  36. Reichert, F.; Fechner, M.; Koopmann, P.; Brandt, C.; Petermann, K.; Huber, G. Spectroscopy and Laser Operation of Nd-Doped Mixed Sesquioxides (Lu1−xScx)2O3. Appl. Phys. B 2012, 108, 475–478. [Google Scholar] [CrossRef]
  37. Dobretsova, E.A.; Alimov, O.K.; Rusanov, S.Y.a.; Kashin, V.V.; Voronov, V.V.; Guryev, D.A.; Kutovoi, S.A.; Vlasov, V.I.; Tsvetkov, V.B. Spectroscopy of the Yttrium Scandate Doped by Thulium Ions. Phys. Solid State 2022, 64, 2238. [Google Scholar] [CrossRef]
  38. Dobretsova, E.; Alimov, O.; Guryev, D.; Voronov, V.; Rusanov, S.; Kashin, V.; Kutovoy, S.; Vlasov, V.; Badyanova, L.; Novikov, I.; et al. Structural and Spectroscopic Features of the Bixbyite-Type Yttrium Scandate Doped by Rare-Earth Ions. Crystals 2022, 12, 1745. [Google Scholar] [CrossRef]
  39. Feigelson, R.S. Pulling Optical Fibers. J. Cryst. Growth 1986, 79, 669–680. [Google Scholar] [CrossRef]
  40. Bufetova, G.A.; Kashin, V.V.; Nikolaev, D.A.; Rusanov, S.Y.; Seregin, V.F.; Tsvetkov, V.B.; Shcherbakov, I.A.; Yakovlev, A.A. Neodymium-Doped Graded-Index Single-Crystal Fibre Lasers. Quantum Elec. 2006, 36, 616. [Google Scholar] [CrossRef]
Figure 1. Low-temperature (77 K) time-resolved luminescence excitation spectra of Nd3+ ion in YScO3 host being measured in the 4I9/24F5/2 + 2H9/2 electron transitions. A delay time and a gate used were tdel(1) = 20 μs and Δt(1) = 16 μs, respectively; tdel(2) = 254 μs and Δt(2) = 50 μs, respectively.
Materials 16 06829 g001
Figure 2. (a,c) Low-temperature time-resolved luminescence spectra of Nd3+ ions in YScO3 being measured on the 4F3/24I9/2 electron transition at excitation of 823.8 nm (center I) and 821.4 nm (center II), respectively. (b,d) Luminescence excitation spectra of Nd3+ ions being measured on the 4I9/24F5/2 + 2H9/2 electron transitions at detection on 1080.4 nm (center I) and 1076.4 nm (center II), respectively. For all spectra, a delay time and a gate used were tdel = 10 μs and Δt = 6 μs, respectively.
Materials 16 06829 g002
Figure 3. (a) Luminescence spectrum of Nd3+ ions in YScO3 crystal fiber being measured on the 4F3/24I11/2 at an excitation of 823.8 nm (4I9/24F5/2 + 2H9/2 electron transition, center I), a delay time of 10 μs, a gate of 6 μs, and a temperature of 77 K. (b) Luminescence spectra of Nd3+ ions in YScO3 crystal fiber being measured on the 4F3/24I11/2 at excitation of 821.4 nm (4I9/24F5/2 + 2H9/2 electron transition, center II), a delay time of 10 μs, a gate of 6 μs, and a temperature of 77 and 300 K.
Materials 16 06829 g003
Figure 4. (a) Luminescence quenching kinetics of Nd 3+:YSO3 being recorded at excitation of 823.8 nm (4I9/24F5/2 + 2H9/2), detection wavelength of 896.0 nm (4F3/2 4I11/2 electron transition), and temperatures of 77 and 300 K. (b) Luminescence quenching kinetics of Nd 3+:YSO3 being recorded at excitation of 821.4 nm (4I9/24F5/2 + 2H9/2), detection wavelength of 893.5 nm (4F3/2 4I11/2 electron transition), and temperatures of 77 and 300 K.
Materials 16 06829 g004
Figure 5. Scheme of 4I9/2,4I11/2, and 4F3/2 Stark levels for two types of Nd3+ centers with a site symmetry of C2 (I) and C2 (II) in YScO3 crystal structure.
Materials 16 06829 g005
Figure 6. Normalized time-resolved luminescence excitation spectra of Tm3+:YScO3 being measured on the 3H6  3H5 transition at 77 K. Registration wavelength was 1945.6 nm. Delay times used were 0.6 ms, 6 ms, 10 ms and 12 ms.
Materials 16 06829 g006
Figure 7. (a) Time-resolved luminescence spectra of Tm3+:YScO3 crystal fiber being measured on the 3F43H6 electron transition at excitation of 1202.4 nm (3H6  3H5 electron transition) and a temperature of 300 K. (b) Luminescence quenching kinetics of Tm3+:YScO3 being measured at excitation of 1202.4 nm and detection wavelengths of 1944 nm at 300 K. (c) Low-temperature (77 K) time-resolved luminescence spectra of Tm3+:YScO3 being measured at excitation of 1202.4 nm (3H6  3H5 electron transition). (d) Luminescence quenching kinetics of Tm3+:YScO3 being measured on the 3F43H6 electron transition at excitation of 1202.4 nm and detection wavelengths of 1944 nm at 77 K. For all spectra, a delay time and a gate used were tdel(1) = 0.6 ms and Δt(1) = 0.3 ms, respectively; tdel(2) = 12 ms and Δt(2) = 3 ms, respectively.
Materials 16 06829 g007
Figure 8. (a) Time-resolved luminescence spectra of Tm3+:YScO3 ion (3F43H6 electron transition) being measured at an excitation of 1209.4 nm (3H6  3H5 electron transition) at a temperature of 300 K. A delay time and a gate used were tdel(1) = 0.3 ms and Δt(1) = 0.16 ms, respectively; tdel(2) = 6 ms and Δt(2) = 1.96 ms, respectively. (b) Luminescence quenching kinetics of Tm3+ ion being measured at an excitation of 1209.4 nm and detection wavelengths of 1944 nm. (c) Time-resolved luminescence spectra of Tm3+:YScO3 being measured on the 3H6  3H5 electron transition at an excitation of 1209.4 nm and a temperature of 77 K. A delay time and a gate used were tdel(1) = 0.6 ms and Δt(1) = 0.24 ms, respectively; tdel(2) = 12 ms and Δt(2) = 3 ms, respectively. (d) Luminescence quenching kinetics of Tm3+:YScO3 being measured on the 3F43H6 electron transition at an excitation of 1209.4 nm and a detection of 1944 nm at 77 K.
Materials 16 06829 g008
Disclaimer/Publisher’s Note: The statements, opinions and data contained in all publications are solely those of the individual author(s) and contributor(s) and not of MDPI and/or the editor(s). MDPI and/or the editor(s) disclaim responsibility for any injury to people or property resulting from any ideas, methods, instructions or products referred to in the content.

