
Ce/Mn/Cr: (Re,Y)3Al5O12 Phosphor Ceramics (Re = Gd, Tb and Lu) for White LED Lighting with Significant Spectral Redshift and Improved Color-Rendering Index

Abstract
:1. Introduction
2. Experimental
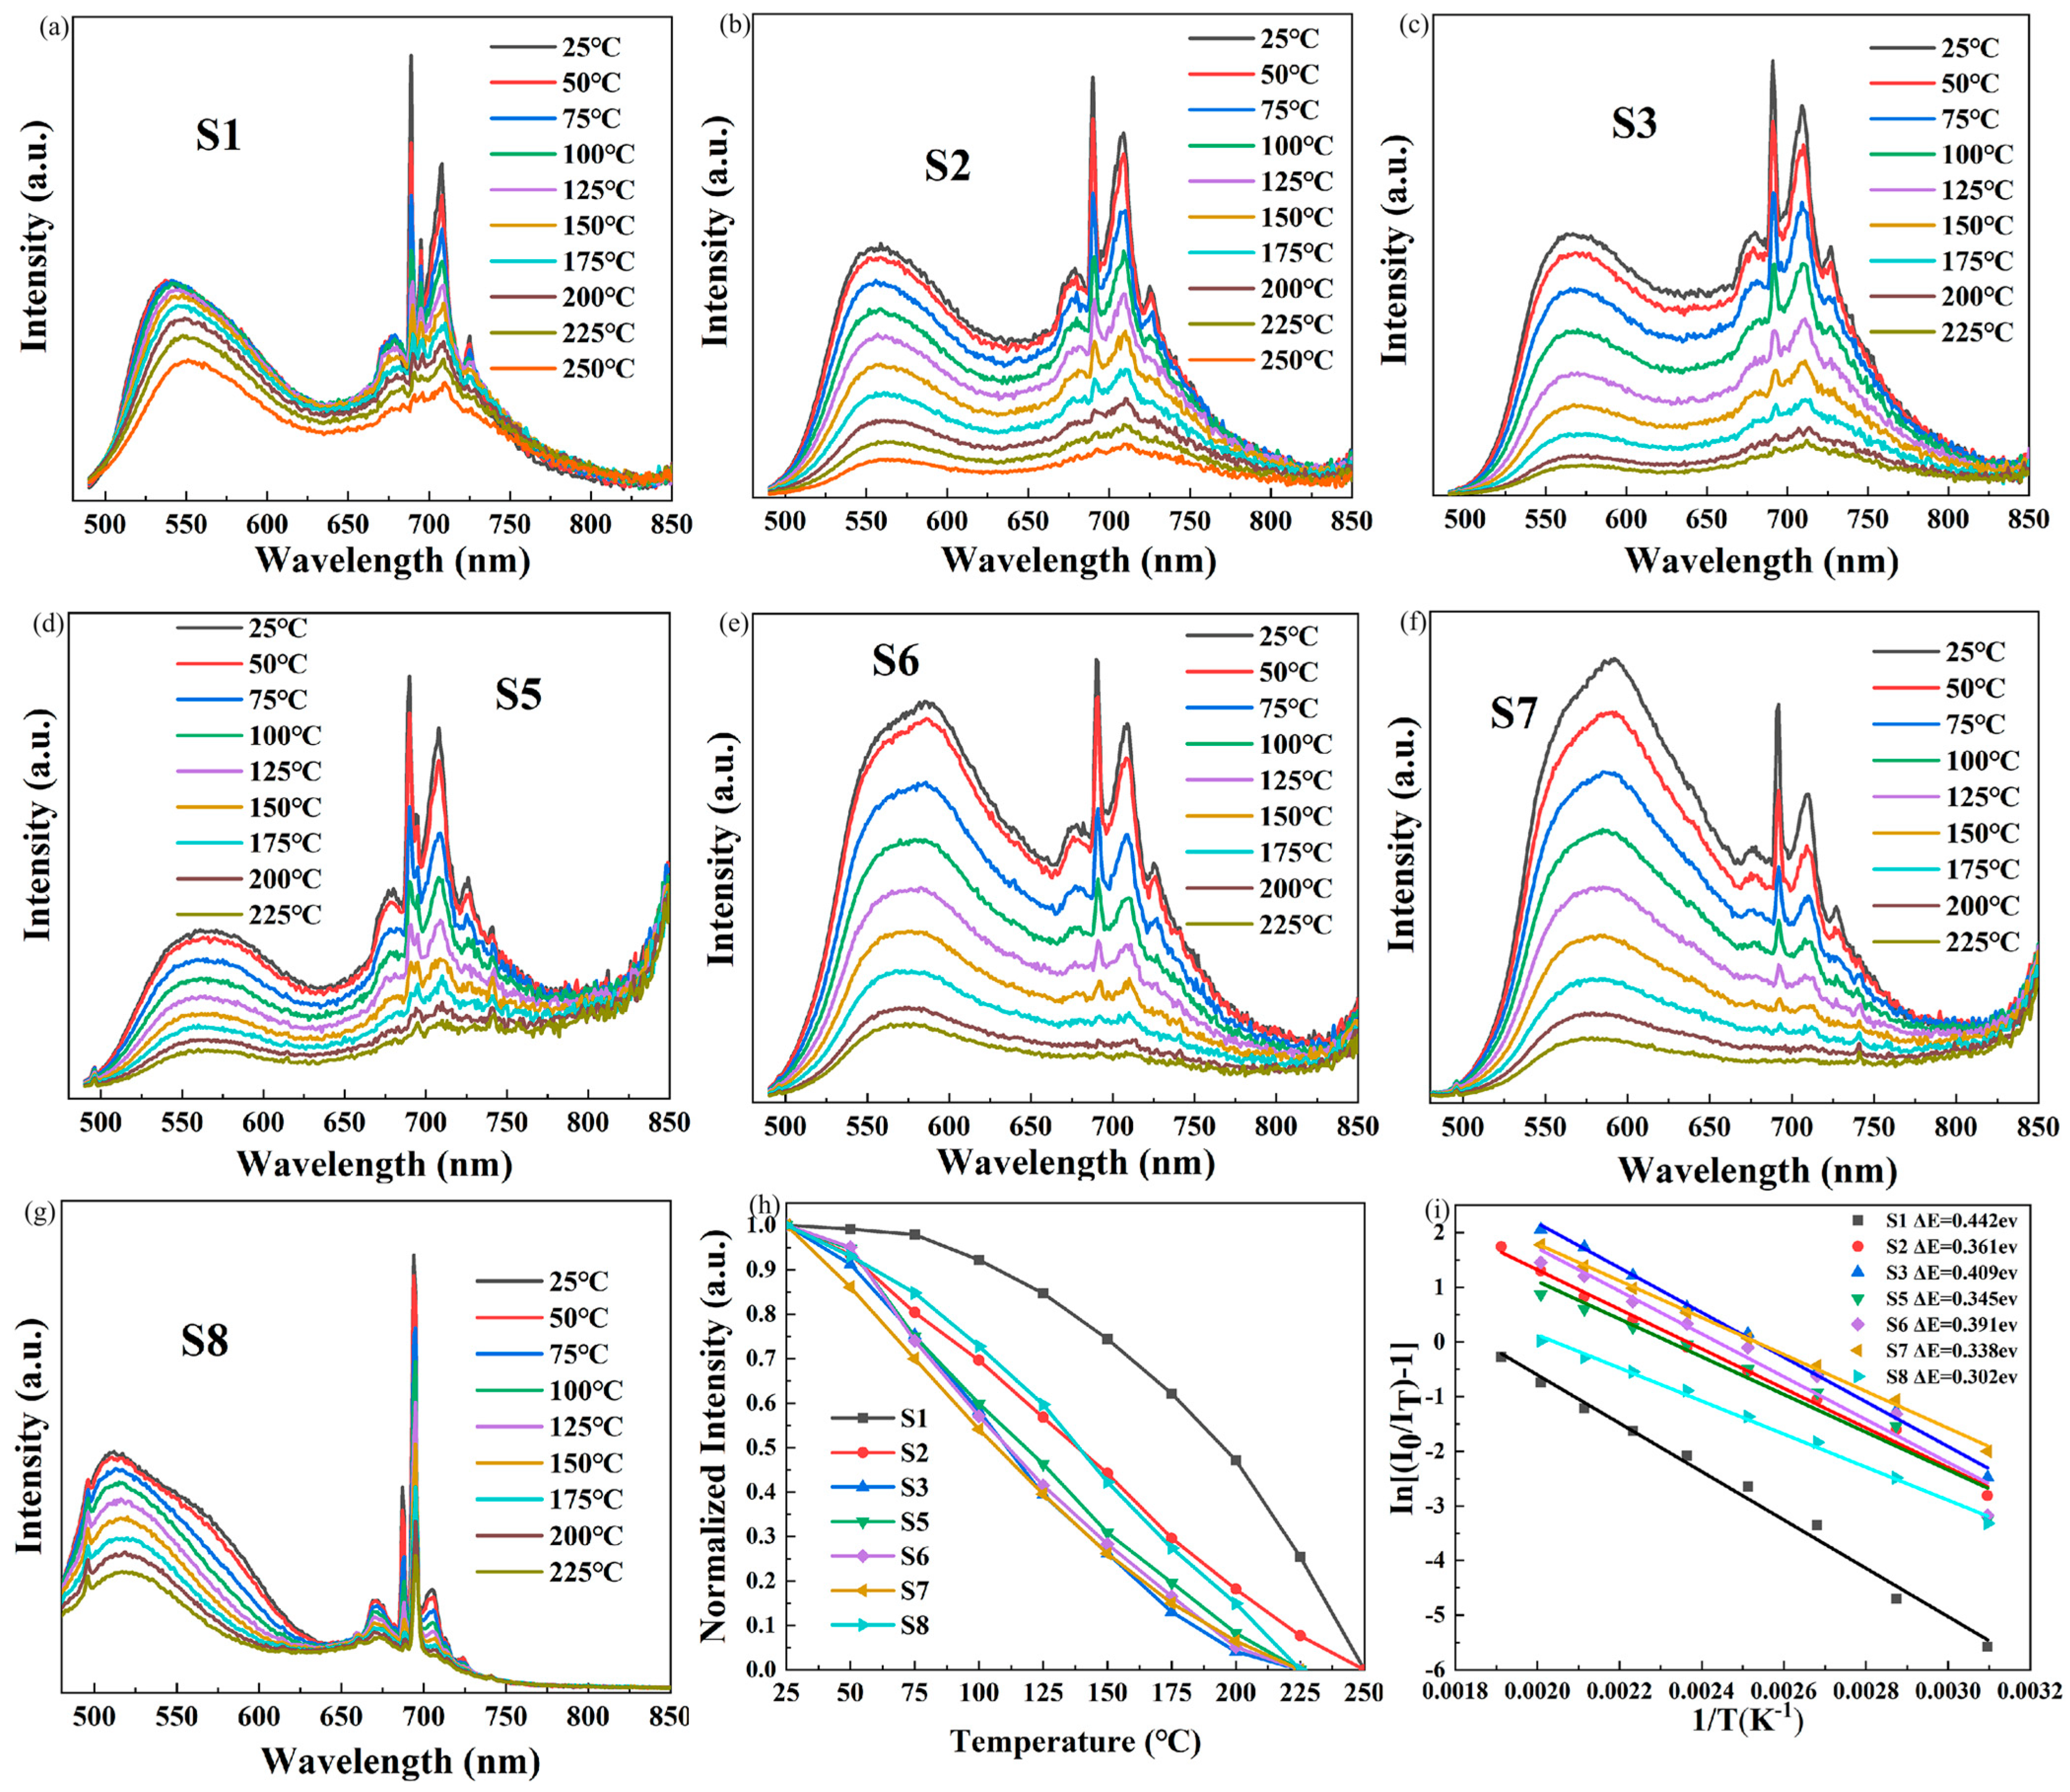
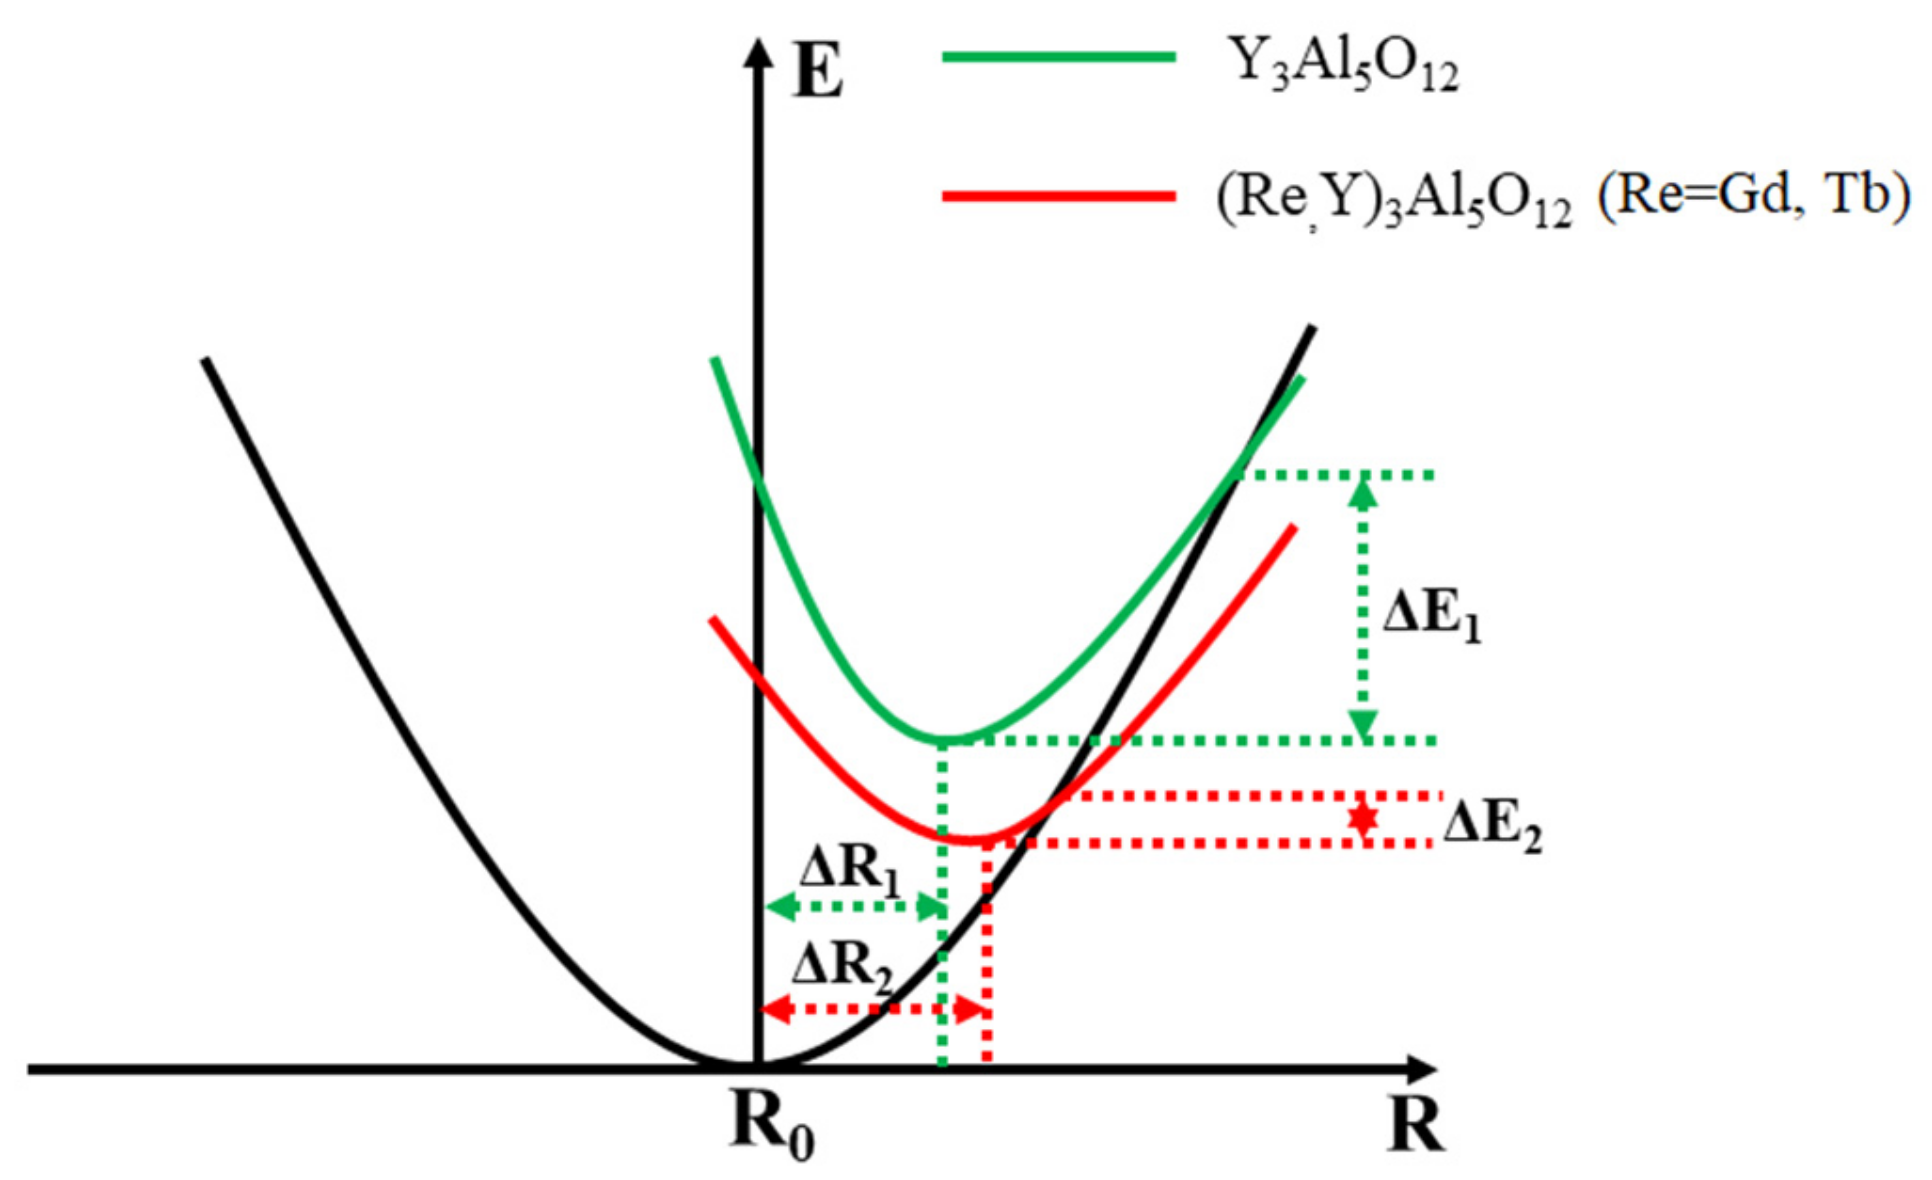
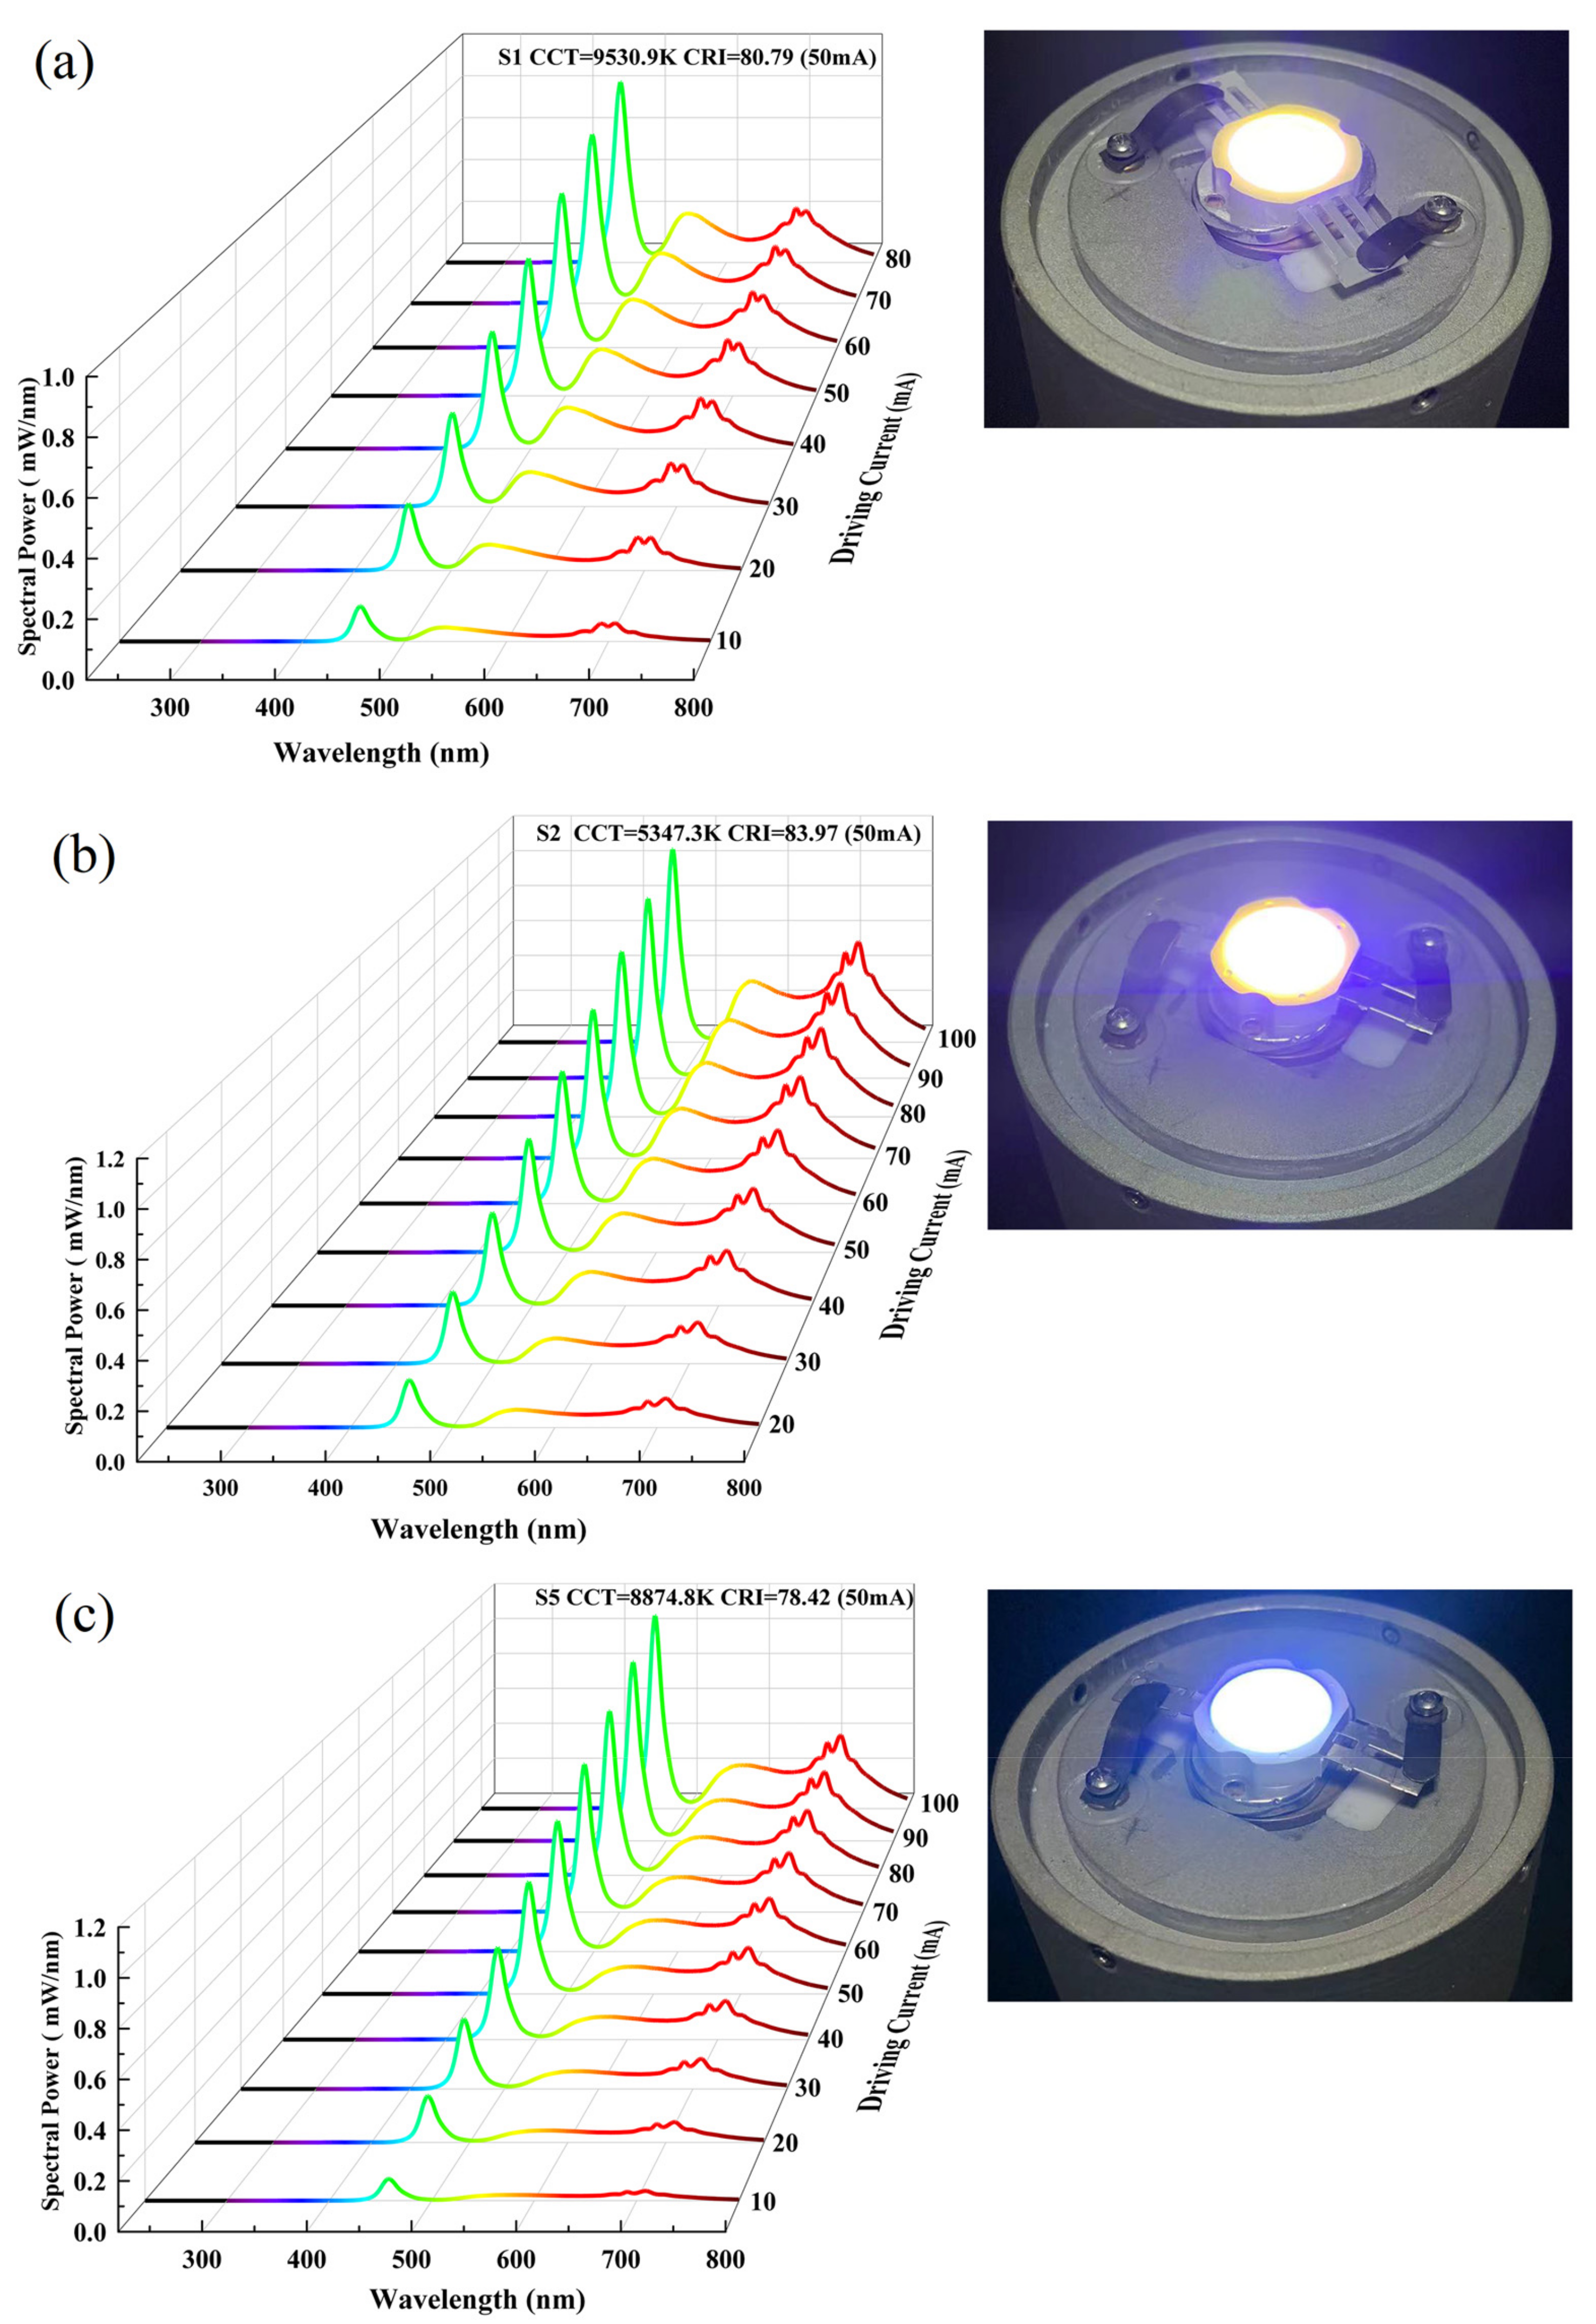
3. Results and Discussions
4. Conclusions
Author Contributions
Funding
Institutional Review Board Statement
Informed Consent Statement
Data Availability Statement
Conflicts of Interest
References
- Wang, S.F.; Zhang, J.; Luo, D.W.; Gu, F.; Tang, D.Y.; Dong, Z.L.; Tan, G.E.B.; Que, W.X.; Zhang, T.S.; Li, S.; et al. Transparent Ceramics: Processing, Materials and Applications. Prog. Solid. State Chem. 2013, 41, 20–54. [Google Scholar] [CrossRef]
- Chen, D.; Xiang, W.; Liang, X.; Zhong, J.; Yu, H.; Ding, M.; Lu, H.; Ji, Z. Advances in Transparent Glass-Ceramic Phosphors for White Light-Emitting Diodes-A Review. J. Eur. Ceram. Soc. 2015, 35, 859–869. [Google Scholar] [CrossRef]
- Nishiura, S.; Tanabe, S.; Fujioka, K.; Fujimoto, Y. Properties of Transparent Ce:YAG Ceramic Phosphors for White LED. Opt. Mater. 2011, 33, 688–691. [Google Scholar] [CrossRef]
- Yao, Q.; Hu, P.; Sun, P.; Liu, M.; Dong, R.; Chao, K.; Liu, Y.; Jiang, J.; Jiang, H. YAG:Ce3+ Transparent Ceramic Phosphors Brighten the Next-Generation Laser-Driven Lighting. Adv. Mater. 2020, 32, 1907888. [Google Scholar] [CrossRef] [PubMed]
- Ye, S.; Li, Y.; Qiang, M.; Lou, W.; Dai, B.; Lin, H.; Han, Z.; Hong, R.; Zhang, D. Color Tunable Composite Phosphor Ceramics Based on SrAlSiN3:Eu2+/Lu3Al5O12:Ce3+ for High-Power and High-Color-Rendering-Index White LEDs/LDs Lighting. Materials 2023, 16, 6007. [Google Scholar] [CrossRef] [PubMed]
- Qiang, M.; Yin, X.; Lin, H.; Hong, R.; Zhang, D.; Zhang, Z.; Zhou, S.; Chen, J.; Tian, Y.; Zheng, G.; et al. ZnAl2O4:Cr3+ Translucent Ceramic Phosphor with Thermally Stable Far-Red Luminescence. Opt. Mater. 2022, 133, 112887. [Google Scholar] [CrossRef]
- Li, X.; Zhang, C.; Chen, J.; Liu, Q.; Bai, Z.; Liu, X.; Mi, X. Cr3+ Ions Improving the Spectral Properties of YAG: Ce3+ Luminescent Ceramics for White LD Lighting. Ceram. Int. 2023, 49, 5489–5495. [Google Scholar] [CrossRef]
- Sun, B.; Jiang, B.; Fan, J.; Zhang, L.; Zhang, L. Mn Ions-Activated Gd3(Al,Ga)5O12 Garnet Solid-Solution Ceramics: Cation Substitution for Dual Wavelength Red-Emission. J. Am. Ceram. Soc. 2023, 106, 513–526. [Google Scholar] [CrossRef]
- Li, X.; Yang, C.; Qiu, L.; Wang, S.; Chen, Y.; Yin, M.; Chen, D. NaAlSiO4: Eu2+ Glass Ceramics: Self-Reduced In Situ Growth and High-Power LED/LD Lighting. Laser Photon Rev. 2022, 16, 2100346. [Google Scholar] [CrossRef]
- Yao, Q.; Pan, X.; Tian, J.; Chen, Z.; Ji, H.; Wang, Y. (Sr, Ca)AlSiN3:Eu2+ Phosphor-Doped YAG:Ce3+ Transparent Ceramics as Novel Green-Light-Emitting Materials for White LEDs. Materials 2023, 16, 730. [Google Scholar] [CrossRef]
- Liu, W.; Shen, J.; Pang, Q.; Wang, T.; Han, X. Optical Properties of YMASG:Ce Fluorescent Ceramics Prepared by Hot-Pressure Sintering. Ceram. Int. 2023, 49, 21941–21946. [Google Scholar] [CrossRef]
- Gomaji Chaudhary, R.; Chouke, P.B.; Bagade, R.D.; Potbhare, A.K.; Dadure, K.M. Molecular Docking and Antioxidant Activity of Cleome Simplicifolia Assisted Synthesis of Cerium Oxide Nanoparticles. Mater. Today Proc. 2020, 29, 1085–1910. [Google Scholar] [CrossRef]
- Sun, P.; Hu, P.; Liu, Y.; Liu, S.; Dong, R.; Jiang, J.; Jiang, H. Broadband Emissions from Lu2Mg2Al2Si2O12:Ce3+ Plate Ceramic Phosphors Enable a High Color-Rendering Index for Laser-Driven Lighting. J. Mater. Chem. C Mater. 2020, 8, 1405–1412. [Google Scholar] [CrossRef]
- Chen, J.; Tang, Y.; Yi, X.; Tian, Y.; Ao, G.; Hao, D.; Lin, Y.; Zhou, S. Fabrication of (Tb,Gd)3Al5O12:Ce3+ Phosphor Ceramics for Warm White Light-Emitting Diodes Application. Opt. Mater. Express 2019, 9, 3333. [Google Scholar] [CrossRef]
- Xu, J.; Wang, J.; Gong, Y.; Ruan, X.; Liu, Z.; Hu, B.; Liu, B.; Li, H.; Wang, X.; Du, B. Investigation of an LuAG:Ce Translucent Ceramic Synthesized via Spark Plasma Sintering: Towards a Facile Synthetic Route, Robust Thermal Performance, and High-Power Solid State Laser Lighting. J. Eur. Ceram. Soc. 2018, 38, 343–347. [Google Scholar] [CrossRef]
- Xie, R.J.; Hirosaki, N.; Suehiro, T.; Xu, F.F.; Mitomo, M. A Simple, Efficient Synthetic Route to Sr2Si5N8:Eu2+-Based Red Phosphors for White Light-Emitting Diodes. Chem. Mater. 2006, 18, 5578–5583. [Google Scholar] [CrossRef]
- Brinkley, S.E.; Pfaff, N.; Denault, K.A.; Zhang, Z.; Hintzen, H.T.; Seshadri, R.; Nakamura, S.; Denbaars, S.P. Robust Thermal Performance of Sr2Si5N8:Eu2+: An Efficient Red Emitting Phosphor for Light Emitting Diode Based White Lighting. Appl. Phys. Lett. 2011, 99, 241106. [Google Scholar] [CrossRef]
- Pust, P.; Weiler, V.; Hecht, C.; Tücks, A.; Wochnik, A.S.; Henß, A.K.; Wiechert, D.; Scheu, C.; Schmidt, P.J.; Schnick, W. Narrow-Band Red-Emitting Sr[LiAl3N4]:Eu2+ as a next-Generation LED-Phosphor Material. Nat. Mater. 2014, 13, 891–896. [Google Scholar] [CrossRef]
- Hoerder, G.J.; Seibald, M.; Baumann, D.; Schröder, T.; Peschke, S.; Schmid, P.C.; Tyborski, T.; Pust, P.; Stoll, I.; Bergler, M.; et al. Sr[Li2Al2O2N2]:Eu2+ —A High Performance Red Phosphor to Brighten the Future. Nat. Commun. 2019, 10, 1824. [Google Scholar] [CrossRef]
- Li, Y.Q.; Hirosaki, N.; Xie, R.J.; Takeda, T.; Mitomo, M. Yellow-Orange-Emitting CaAlSiN3:Ce3+ Phosphor: Structure, Photoluminescence, and Application in White LEDs. Chem. Mater. 2008, 20, 6704–6714. [Google Scholar] [CrossRef]
- Uheda, K.; Hirosaki, N.; Yamamoto, Y.; Naito, A.; Nakajima, T.; Yamamoto, H. Luminescence Properties of a Red Phosphor, CaAlSiN3:Eu2+, for White Light-Emitting Diodes. Electrochem. Solid-State Lett. 2006, 9, H22–H25. [Google Scholar] [CrossRef]
- Piao, X.; Machida, K.I.; Horikawa, T.; Hanzawa, H.; Shimomura, Y.; Kijima, N. Preparation of CaAlSiN3:Eu2+ Phosphors by the Self-Propagating High-Temperature Synthesis and Their Luminescent Properties. Chem. Mater. 2007, 19, 4592–4599. [Google Scholar] [CrossRef]
- Song, E.H.; Wang, J.Q.; Ye, S.; Jiang, X.F.; Peng, M.Y.; Zhang, Q.Y. Room-Temperature Synthesis and Warm-White LED Applications of Mn4+ Ion Doped Fluoroaluminate Red Phosphor Na3AlF6:Mn4+. J. Mater. Chem. C Mater. 2016, 4, 2480–2487. [Google Scholar] [CrossRef]
- Zhou, Q.; Zhou, Y.; Liu, Y.; Luo, L.; Wang, Z.; Peng, J.; Yan, J.; Wu, M. A New Red Phosphor BaGeF6:Mn4+: Hydrothermal Synthesis, Photo-Luminescence Properties, and Its Application in Warm White LED Devices. J. Mater. Chem. C Mater. 2015, 3, 3055–3059. [Google Scholar] [CrossRef]
- Feng, S.; Qin, H.; Wu, G.; Jiang, H.; Zhao, J.; Liu, Y.; Luo, Z.; Qiao, J.; Jiang, J. Spectrum Regulation of YAG:Ce Transparent Ceramics with Pr, Cr Doping for White Light Emitting Diodes Application. J. Eur. Ceram. Soc. 2017, 37, 3403–3409. [Google Scholar] [CrossRef]
- Ao, G.; Tang, Y.; Yi, X.; Tian, Y.; Chen, J.; Hao, D.; Lin, Y.; Zhou, S. Red Emission Generation in Ce3+/Mn2+ Co-Doping Y3Al5O12 Phosphor Ceramics for Warm White Lighting Emitting Diodes. J. Alloys Compd. 2019, 798, 695–699. [Google Scholar] [CrossRef]
- Chen, D.; Xu, W.; Zhou, Y.; Zhong, J.; Li, S. Color Tunable Dual-Phase Transparent Glass Ceramics for Warm White Light-Emitting Diodes. J. Mater. Chem. C Mater. 2017, 5, 738–746. [Google Scholar] [CrossRef]
- Zhao, C.; Duan, Y.; Lin, H.; Zhang, D.; Hong, R.; Tao, C.; Han, Z.; Zhou, S. Synthesis and Luminescence Properties of Color-Tunable Ce, Mn Co-Doped LuAG Transparent Ceramics by Sintering under Atmospheric Pressure. Ceram. Int. 2021, 47, 9156–9163. [Google Scholar] [CrossRef]
- Hua, H.; Wang, X.; Ding, H.; Du, Q.; Feng, S.; Jiang, H.; Jiang, J.; Jiang, H.; Zhang, Z.; Qin, H. Preparation and Luminescent Properties of Highly Transparent Y3Ga5O12:M3+ (M=Dy, Cr) Ceramics. J. Eur. Ceram. Soc. 2019, 39, 5345–5349. [Google Scholar] [CrossRef]
- Tang, Y.; Zhou, S.; Yi, X.; Zhang, S.; Hao, D.; Shao, X. The Cr-Doping Effect on White Light Emitting Properties of Ce:YAG Phosphor Ceramics. J. Am. Ceram. Soc. 2017, 100, 2590–2595. [Google Scholar] [CrossRef]
- Zhong, J.; Chen, D.; Zhao, W.; Zhou, Y.; Yu, H.; Chen, L.; Ji, Z. Garnet-Based Li6CaLa2Sb2O12:Eu3+ Red Phosphors: A Potential Color-Converting Material for Warm White Light-Emitting Diodes. J. Mater. Chem. C Mater. 2015, 3, 4500–4510. [Google Scholar] [CrossRef]
- Sakuma, K.; Hirosaki, N.; Xie, R.J. Red-Shift of Emission Wavelength Caused by Reabsorption Mechanism of Europium Activated Ca-α-SiAlON Ceramic Phosphors. J. Lumin. 2007, 126, 843–852. [Google Scholar] [CrossRef]
- Janulevicius, M.; Marmokas, P.; Misevicius, M.; Grigorjevaite, J.; Mikoliunaite, L.; Sakirzanovas, S.; Katelnikovas, A. Luminescence and Luminescence Quenching of Highly Efficient Y2Mo4O15:Eu3+ Phosphors and Ceramics. Sci. Rep. 2016, 6, 26098. [Google Scholar] [CrossRef] [PubMed]
- Li, Y.; Liu, Y.; Luo, Z.; Liu, Z.; Hanson, S.; Pang, C.; Lin, H.; Qin, H.; Jiang, J. Ce/Mn/Cr: Y3Al5O12 Phosphor Ceramics for White LED and LD Lighting with a High Color Rendering Index. Ceram. Int. 2023, 49, 24703–24711. [Google Scholar] [CrossRef]
- Liu, Y.; Liu, S.; Sun, P.; Du, Y.; Lin, S.; Xie, R.J.; Dong, R.; Jiang, J.; Jiang, H. Transparent Ceramics Enabling High Luminous Flux and Efficacy for the Next-Generation High-Power LED Light. ACS Appl. Mater. Interfaces 2019, 11, 21697–21701. [Google Scholar] [CrossRef] [PubMed]
- Bi, J.; Li, J.G.; Zhu, Q.; Chen, J.; Li, X.; Sun, X.; Kim, B.N.; Sakka, Y. Yellow-Emitting (Tb1−xCex)3Al5O12 Phosphor Powder and Ceramic (0≤x≤0.05): Phase Evolution, Photoluminescence, and the Process of Energy Transfer. Ceram. Int. 2017, 43, 8163–8170. [Google Scholar] [CrossRef]
- Lorbeer, C.; Behrends, F.; Cybinska, J.; Eckert, H.; Mudring, A.V. Charge Compensation in RE3+ (RE = Eu, Gd) and M+ (M = Li, Na, K) Co-Doped Alkaline Earth Nanofluorides Obtained by Microwave Reaction with Reactive Ionic Liquids Leading to Improved Optical Properties. J. Mater. Chem. C Mater. 2014, 2, 9439–9450. [Google Scholar] [CrossRef]
- Li, J.; Li, J.G.; Li, X.; Sun, X. Tb3+/Eu3+codoping of Lu3+-Stabilized Gd3Al5O12 for Tunable Photoluminescence via Efficient Energy Transfer. J. Alloys Compd. 2016, 670, 161–169. [Google Scholar] [CrossRef]
- Bachmann, V.; Ronda, C.; Meijerink, A. Temperature Quenching of Yellow Ce3+ Luminescence in YAG:Ce. Chem. Mater. 2009, 21, 2077–2084. [Google Scholar] [CrossRef]
- Samuel, P.; Kumar, G.A.; Takagimi, Y.; Hideki, Y.; Ken, I.U.; Moorthy Babu, S. Efficient Energy Transfer between Ce3+/Cr3+ and Nd3+ Ions in Transparent Nd/Ce/Cr:YAG Ceramics. Opt Mater 2011, 34, 303–307. [Google Scholar] [CrossRef]
- Zorenko, Y.; Gorbenko, V.; Voznyak, T.; Zorenko, T.; Kuklinski, B.; Turos-Matysyak, R.; Grinberg, M. Luminescence Properties of Phosphors Based on Tb3Al5O12 (TbAG) Terbium-Aluminum Garnet. Opt. Spectrosc. 2009, 106, 365–374. [Google Scholar] [CrossRef]
- Xiang, W.; Zhong, J.; Zhao, Y.; Zhao, B.; Liang, X.; Dong, Y.; Zhang, Z.; Chen, Z.; Liu, B. Growth and Characterization of Air Annealing Mn-Doped YAG:Ce Single Crystal for LED. J. Alloys Compd. 2012, 542, 218–221. [Google Scholar] [CrossRef]
- Li, X.; Li, J.G.; Xiu, Z.; Huo, D.; Sun, X. Effects of Gd3+ Substitution on the Fabrication of Transparent (Y1-XGdx)3Al5O12 Ceramics. J. Am. Ceram. Soc. 2010, 93, 2229–2235. [Google Scholar] [CrossRef]
- Tian, Y.; Chen, J.; Yi, X.; Jiang, R.; Lin, H.; Tang, Y.; Zhou, S. Emission-Enhanced High-Performance Al2O3–Ce: (Y, Tb)AG Composite Ceramic Phosphors for High-Brightness White LED/LD Illumination. Ceram. Int. 2023, 49, 2698–2704. [Google Scholar] [CrossRef]
- Song, Z.; Xia, Z.; Liu, Q. Insight into the Relationship between Crystal Structure and Crystal-Field Splitting of Ce3+ Doped Garnet Compounds. J. Phys. Chem. C 2018, 122, 3567–3574. [Google Scholar] [CrossRef]
- Xia, Z.; Meijerink, A. Ce3+-Doped Garnet Phosphors: Composition Modification, Luminescence Properties and Applications. Chem. Soc. Rev. 2017, 46, 275–299. [Google Scholar] [CrossRef] [PubMed]
- Wang, Z.; Lin, H.; Zhang, D.; Shen, Y.; Li, Y.; Hong, R.; Tao, C.; Han, Z.; Chen, L.; Zhou, S. Deep-Red Emitting Mg2TiO4:Mn4+ Phosphor Ceramics for Plant Lighting. J. Adv. Ceram. 2021, 10, 88–97. [Google Scholar] [CrossRef]
- Wang, Y.; Ding, J.; Zhou, X.; Wang, Y. Promotion of Efficiency and Thermal Stability by Restraining Dynamic Energy Migration Based on the Highly Symmetric Rigid Structure in the N-UV Excitation Green Emission Garnet Phosphors. Chem. Eng. J. 2020, 381, 122528. [Google Scholar] [CrossRef]
- Liu, Y.; Silver, J.; Xie, R.J.; Zhang, J.; Xu, H.; Shao, H.; Jiang, J.; Jiang, H. An Excellent Cyan-Emitting Orthosilicate Phosphor for NUV-Pumped White LED Application. J. Mater. Chem. C Mater. 2017, 5, 12365–12377. [Google Scholar] [CrossRef]
- Mollajafari, M. An Efficient Lightweight Algorithm for Scheduling Tasks onto Dynamically Reconfigurable Hardware Using Graph-Oriented Simulated Annealing. Neural Comput. Appl. 2023, 35, 18035–18057. [Google Scholar] [CrossRef]


| Sample No | Stoichiometry | Chemical Formula |
|---|---|---|
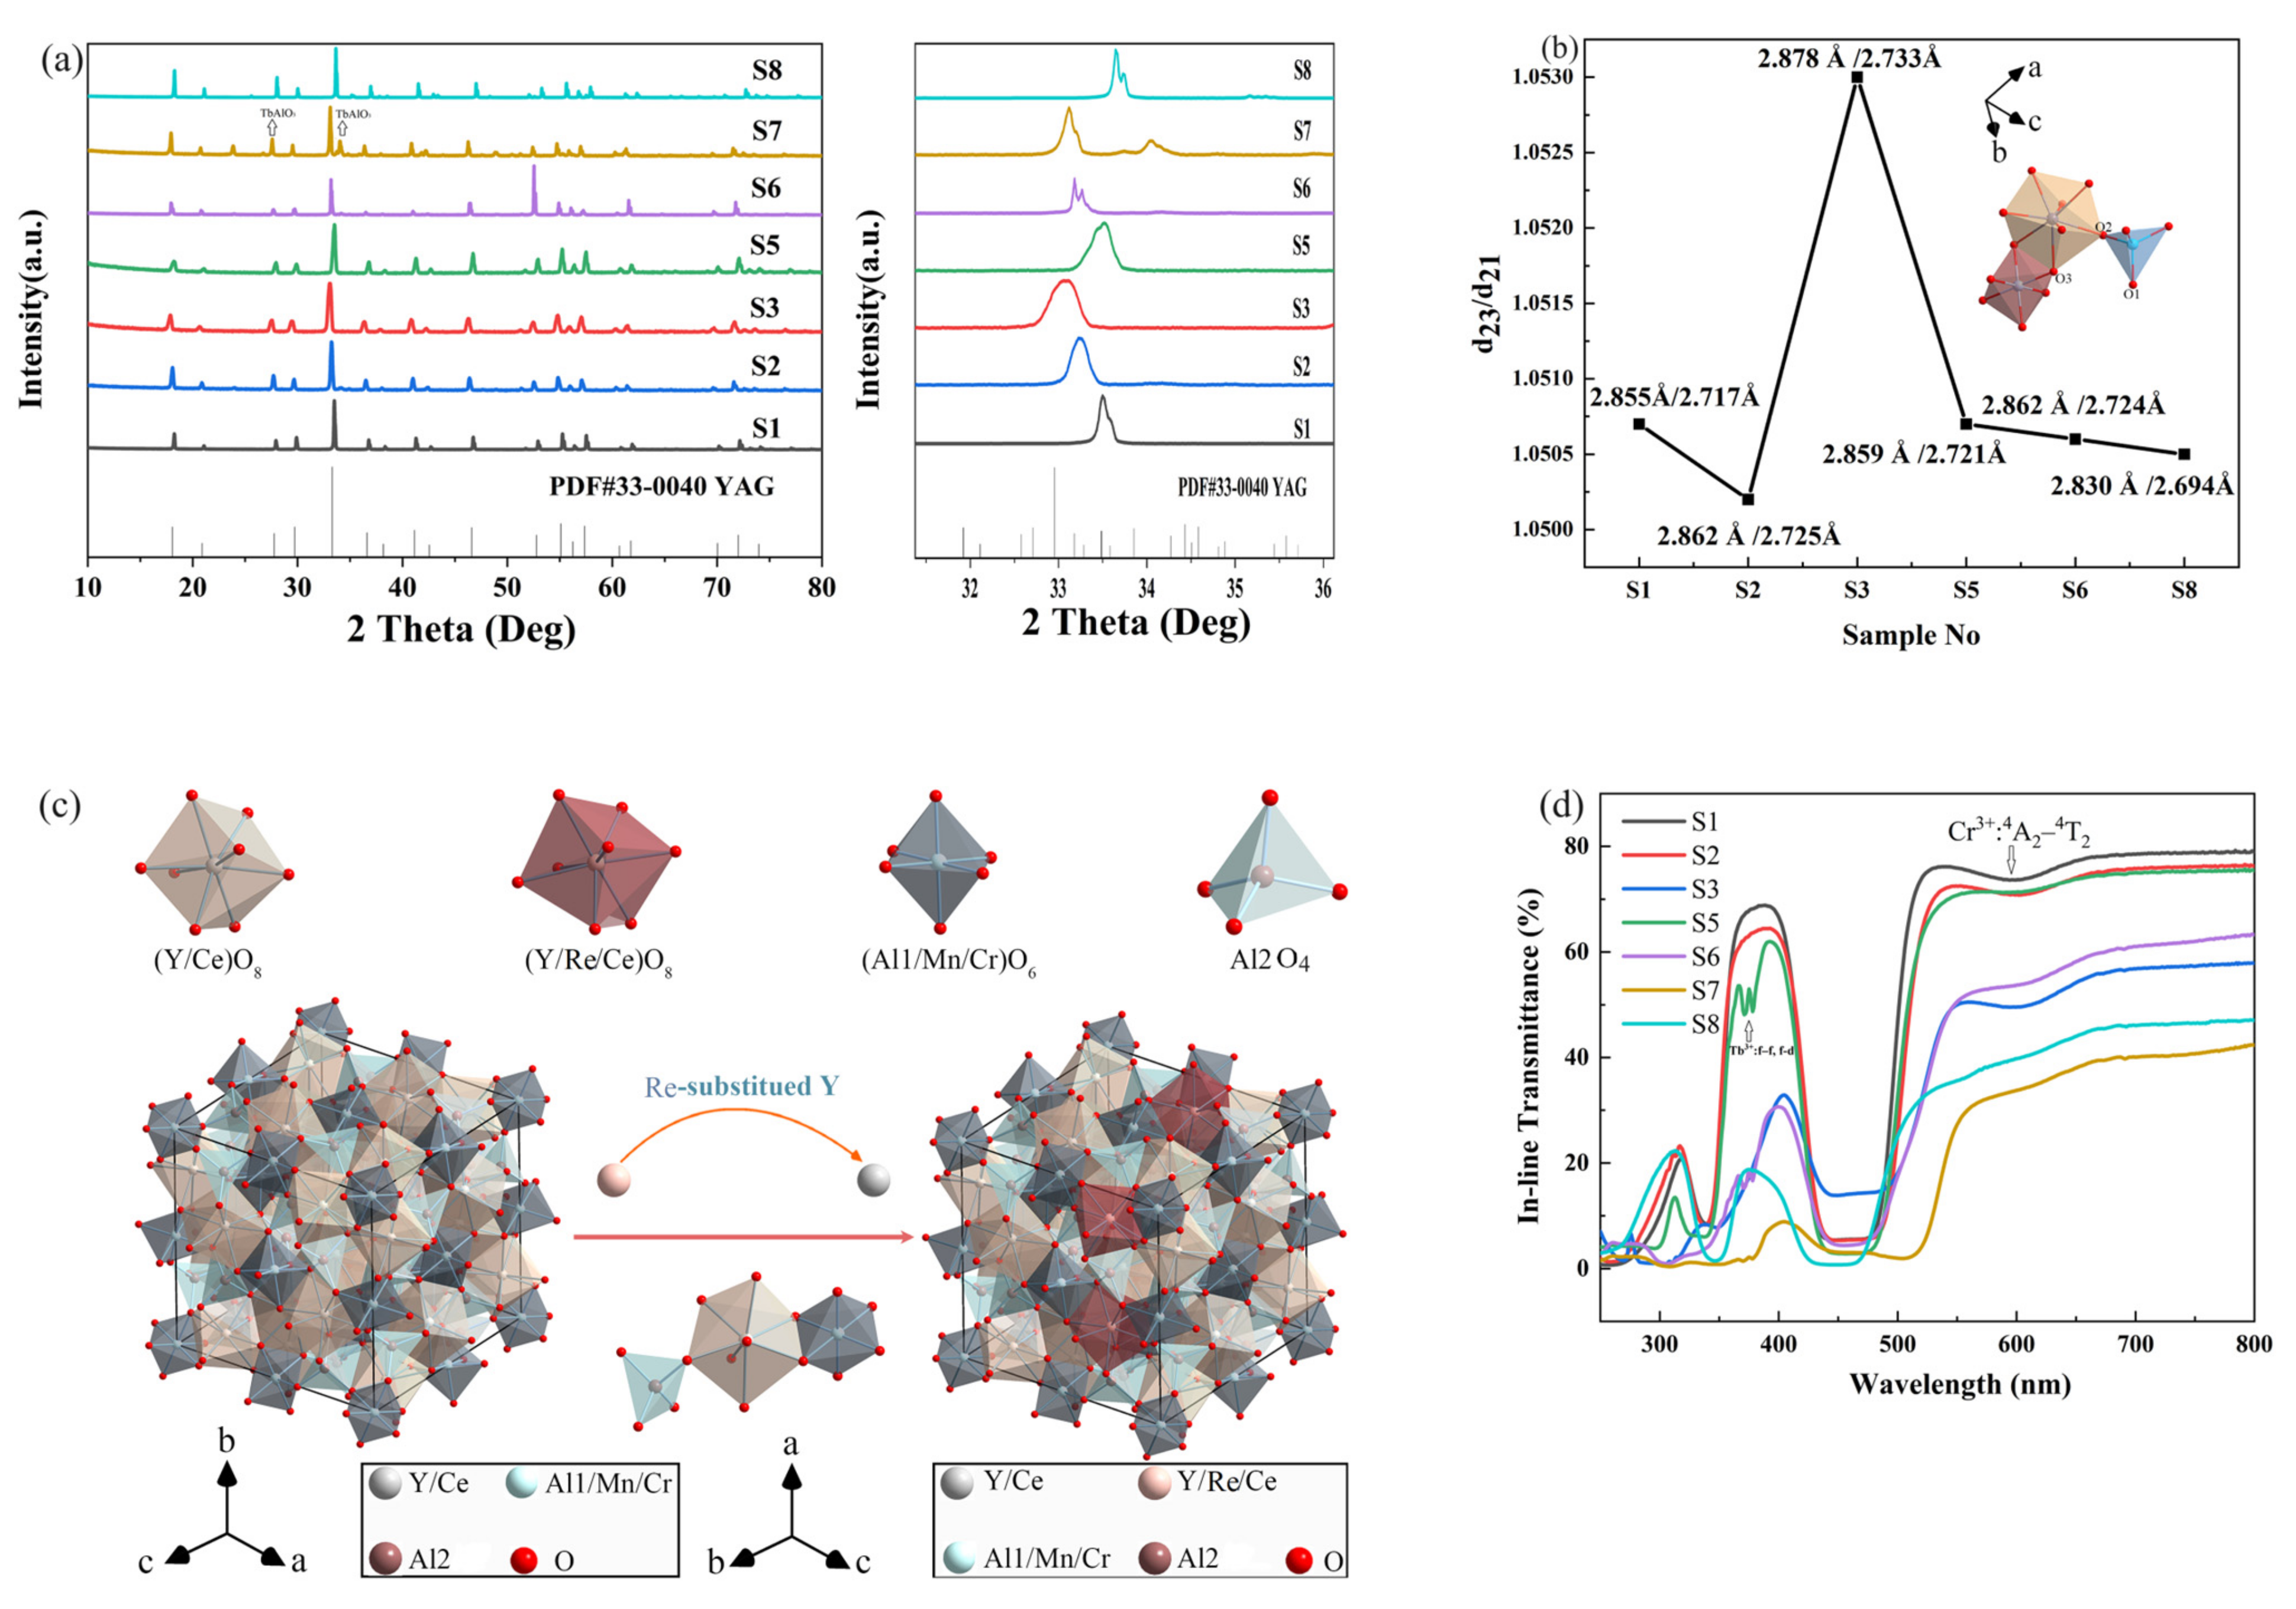
| S1 | Rex = 0 | (Y0.997Ce0.003)3(Al0.9748 Mn2+0.024Cr3+0.0012)5O12 |
| S2 | Rex = Gd0.333 | (Y0.664Gd0.333Ce0.003)3(Al0.9748 Mn2+0.024Cr3+0.0012)5O12 |
| S3 | Rex = Gd0.666 | (Y0.331Gd0.666Ce0.003)3(Al0.9748 Mn2+0.024Cr3+0.0012)5O12 |
| S4 | Rex = Gd0.997 | (Gd0.997Ce0.003)3(Al0.9748 Mn2+0.024Cr3+0.0012)5O12 |
| S5 | Rex = Tb0.333 | (Y0.664Tb0.333Ce0.003)3(Al0.9748 Mn2+0.024Cr3+0.0012)5O12 |
| S6 | Rex = Tb0.666 | (Y0.331Tb0.666Ce0.003)3(Al0.9748 Mn2+0.024Cr3+0.0012)5O12 |
| S7 | Rex = Tb0.997 | (Tb0.997Ce0.003)3(Al0.9748 Mn2+0.024Cr3+0.0012)5O12 |
| S8 | Rex = Lu0.997 | (Lu0.997Ce0.003)3(Al0.9748 Mn2+0.024Cr3+0.0012)5O12 |
Disclaimer/Publisher’s Note: The statements, opinions and data contained in all publications are solely those of the individual author(s) and contributor(s) and not of MDPI and/or the editor(s). MDPI and/or the editor(s) disclaim responsibility for any injury to people or property resulting from any ideas, methods, instructions or products referred to in the content. |
© 2023 by the authors. Licensee MDPI, Basel, Switzerland. This article is an open access article distributed under the terms and conditions of the Creative Commons Attribution (CC BY) license (https://creativecommons.org/licenses/by/4.0/).
Share and Cite
Li, Y.; Hanson, S.; Pang, C.H.; Lyu, P.; Jiang, J. Ce/Mn/Cr: (Re,Y)3Al5O12 Phosphor Ceramics (Re = Gd, Tb and Lu) for White LED Lighting with Significant Spectral Redshift and Improved Color-Rendering Index. Materials 2023, 16, 6667. https://doi.org/10.3390/ma16206667
Li Y, Hanson S, Pang CH, Lyu P, Jiang J. Ce/Mn/Cr: (Re,Y)3Al5O12 Phosphor Ceramics (Re = Gd, Tb and Lu) for White LED Lighting with Significant Spectral Redshift and Improved Color-Rendering Index. Materials. 2023; 16(20):6667. https://doi.org/10.3390/ma16206667
Chicago/Turabian StyleLi, Yukun, Svenja Hanson, Cheng Heng Pang, Peng Lyu, and Jun Jiang. 2023. "Ce/Mn/Cr: (Re,Y)3Al5O12 Phosphor Ceramics (Re = Gd, Tb and Lu) for White LED Lighting with Significant Spectral Redshift and Improved Color-Rendering Index" Materials 16, no. 20: 6667. https://doi.org/10.3390/ma16206667